Introduction
While only around 360,000 homes in the UK are currently heated by heat pumps, they are a proven low-carbon technology. They are three times more efficient than a gas boiler, work in the coldest UK temperatures and use electricity, which can be generated from renewable resources.
To meet climate change targets we need to be installing 450,000 heat pumps per year by 2030.
We are in the early adoption phase of this technology. The innovators have tested it, but heat pumps are not yet the norm.
So how can we support people across the country to engage with heat pumps? For some groups, it may be that the right offer will accelerate their adoption of the technology. For other consumers, the government, industry and organisations working to speed up decarbonisation will need to work harder to support them to transition to low-carbon heating.
Harnessing segmentation to support information campaigns and interventions, by positioning heat pumps in a way that's attuned to each segment, enables more effective targeting and engagement with consumers.
Summary
What we did
In phase one of this project, we developed profiles of eight distinct segments which make up around 30 million UK households. The segments represent commonalities across different traits and characteristics. They are built on characteristics that are more prominent in each segment than others. It's important to note that they are not universally consistent or representative across the whole segment population.
In phase two we aimed to develop and test messages with specific segments, in the real world, to understand which segments might be more receptive to which messages. We used AI-powered interviews, conducted by an AI-bot, over WhatsApp, following the structure and format defined by the research team in the topic guide. These interviews are asynchronous and can be replied to by participants in their own time. Interviews with 25 participants from each of the eight segments were conducted, to get a richer understanding of the following questions.
- What are the preferred ways of learning, engaging and making decisions within each segment?
- How do segments differ in terms of trust in sources (for example, installers, government, media, media personalities)?
- What are the most meaningful differences between segments that may not be obvious from survey or index data* alone?
*More information on survey and index data used to create the eight segments in this section.
What we found
The interviews explored:
- what participants care about when they think about their home heating
- what their main motivations would be for switching to an electric heating system
- how participants approach decision-making around home renovation and heating systems. Where do they look for information, who do they seek advice from? Who do they trust/distrust? Which are their primary sources of information?
- general attitudes to heat pumps: would they switch in practice, reasons why and what they would need to remove barriers to switching.
This report contains a summary, for each theme, and for each segment of:
- their main priorities in regards to their current heating system
- what the most attractive benefit would be, for them, to switch to electric heating
- their general attitudes to any preparatory upgrades necessary to switch to electric heating
- who they take advice from, in general
- who they trust, for home heating specifically, and the factors behind it
- their attitudes towards heat pumps, specific barriers to switching, and what would help remove these barriers.
The eight segments
Phase one of this project identified eight unique segments of the UK population:
- Segment A: Eco high-earner Gen-Xers
- Segment B: Techie young families
- Segment C: Budget-conscious millennial parents
- Segment D: Rural retirees on stable income
- Segment E: Homeowners eligible for free heat pumps
- Segment F: Tech-cautious pre-retirees
- Segment G: Young, green urban renters
- Segment H: Social tenants on tight budgets
The segments have been built based on their demographic, housing and attitudes towards heat pumps.
More information on the index and survey data used to create this segmentation can be found in our project methodology.
More information on how this segmentation was used for this specific research is in the methodology section.
Methodology
The eight segments for this specific research
For this analysis, it is important to know that Experian's 'Mosaic' consumer segmentation was used to create the eight segments. In Experian's segmentation, data is organised according to Mosaic's 66 detailed types, which is a granular breakdown of consumers.
In phase one of this project, we combined these to form coherent groupings for heat pump adopters. The re-grouping was achieved through 'hierarchical clustering', a statistical approach which groups data points that are similar sequentially into clusters and so builds a hierarchy of clusters. This resulted in a dendrogram, which represents the relationships between each of the clusters in a tree-like diagram. We can then cut the dendrogram to identify a good solution for a smaller number of summary groups based on the original 66 detailed types.
Using these data sources and methodology, Experian created profiles of bespoke segments of the population, based on their relationships to heat pumps. This is how the eight segments came to life.
Participant recruitment
We recruited participants through the Prolific platform, which has a panel of people who have registered and signed up to be contacted to take part in research, and are compensated financially for doing so. Selecting participants for research usually happens either based on criteria already provided by participants when they register to the platform, and/or by pre-screening participants.
Recruitment was done using a two-phased approach.
During the first phase, participants were asked a series of questions via a pre-screening survey:
- property type: detached house; semi-detached house; terraced house; bungalow; flat/maisonette
- tenure type (housing situation): own with mortgage; own outright; private rental; social rental
- number of bedrooms: less than three; three; more than three
- heating type: mains gas; electric; oil; LPG; heat network; solid fuel; wood; renewable; NA; prefer not to say
- household income band: under £10,000 per year; £20,000 to £29,999 per year; £30,000 to £39,999 per year; £40,000 to £49,999 per year; £50,000 to £59,999 per year; £60,000 to £69,999 per year; £70,000 to £99,999 per year; £100,000 and over
- respondent age band: 18-24; 25-34; 35-44; 45-54; 55+
- Experian Mosaic segment (a consumer segmentation done by Experian, based on demographic, lifestyle, behavioural and geographical criteria): 'click on this link, enter your postcode, and copy/paste in the pre-screening survey what category you belong to.'
Then, each respondent was categorised into one of the eight segments created in phase one of the project, based on the answers to the pre-screening survey.
Following a protocol, we invited 25 participants from each segment to participate in an AI-powered interview, using Langwith Research's AI interviewer via the platform WhatsApp.
This protocol was designed to ensure that the 25 participants per segment invited for AI interview would be most typical of the segment as found in the UK population. You can view pen portraits, which give an overview of what each segment looks like in the UK population. More details about the limitations of this method can be found in this section.
Interview design
Read the interview topic guide.
The topic guide was drafted based on the following research questions.
- What do participants care about when they think about their home heating?
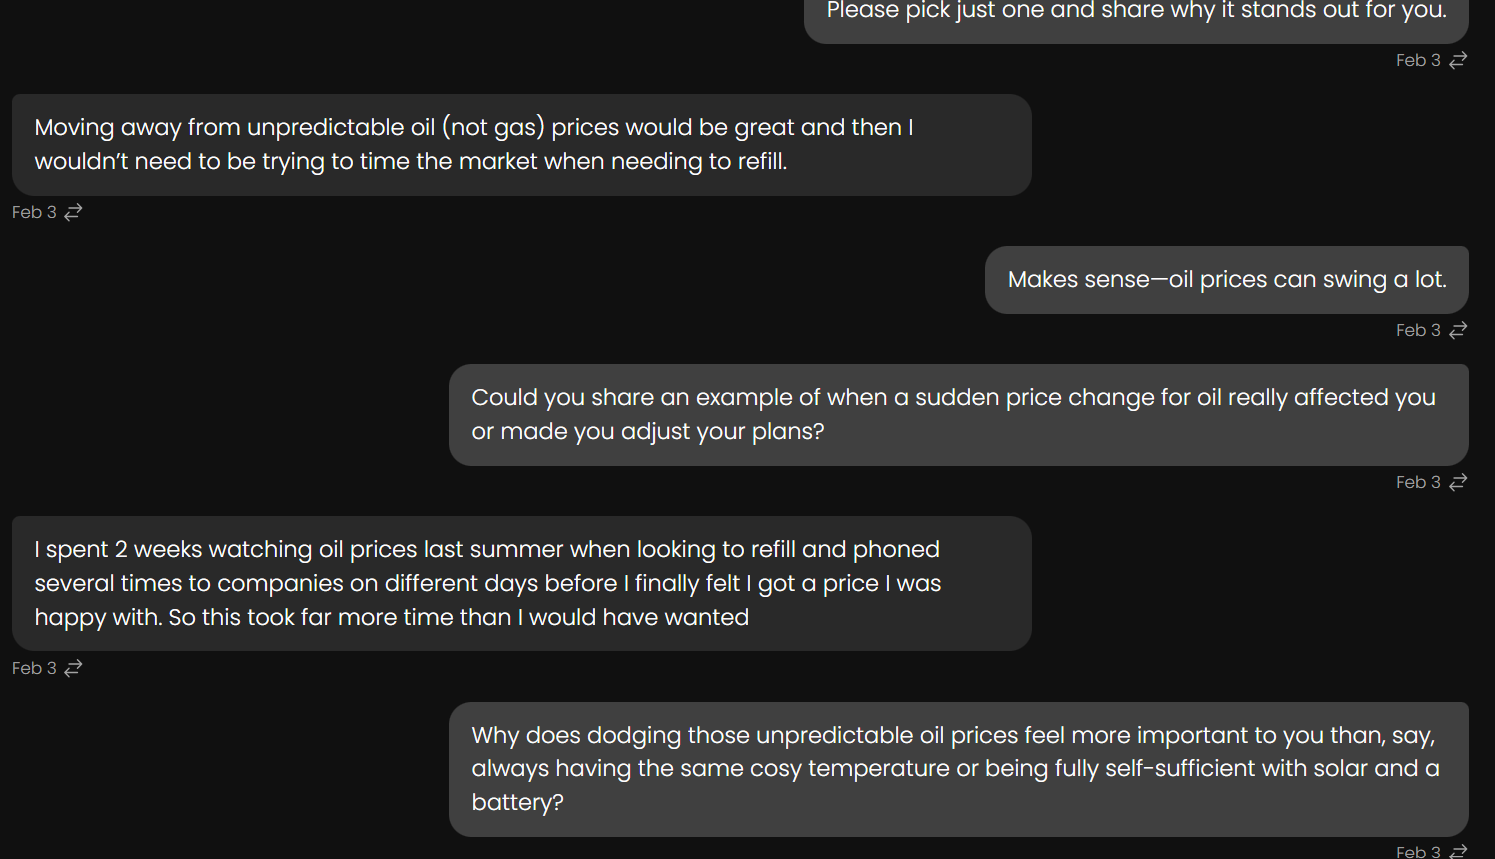
Please pick just one and share why it stands out for you.
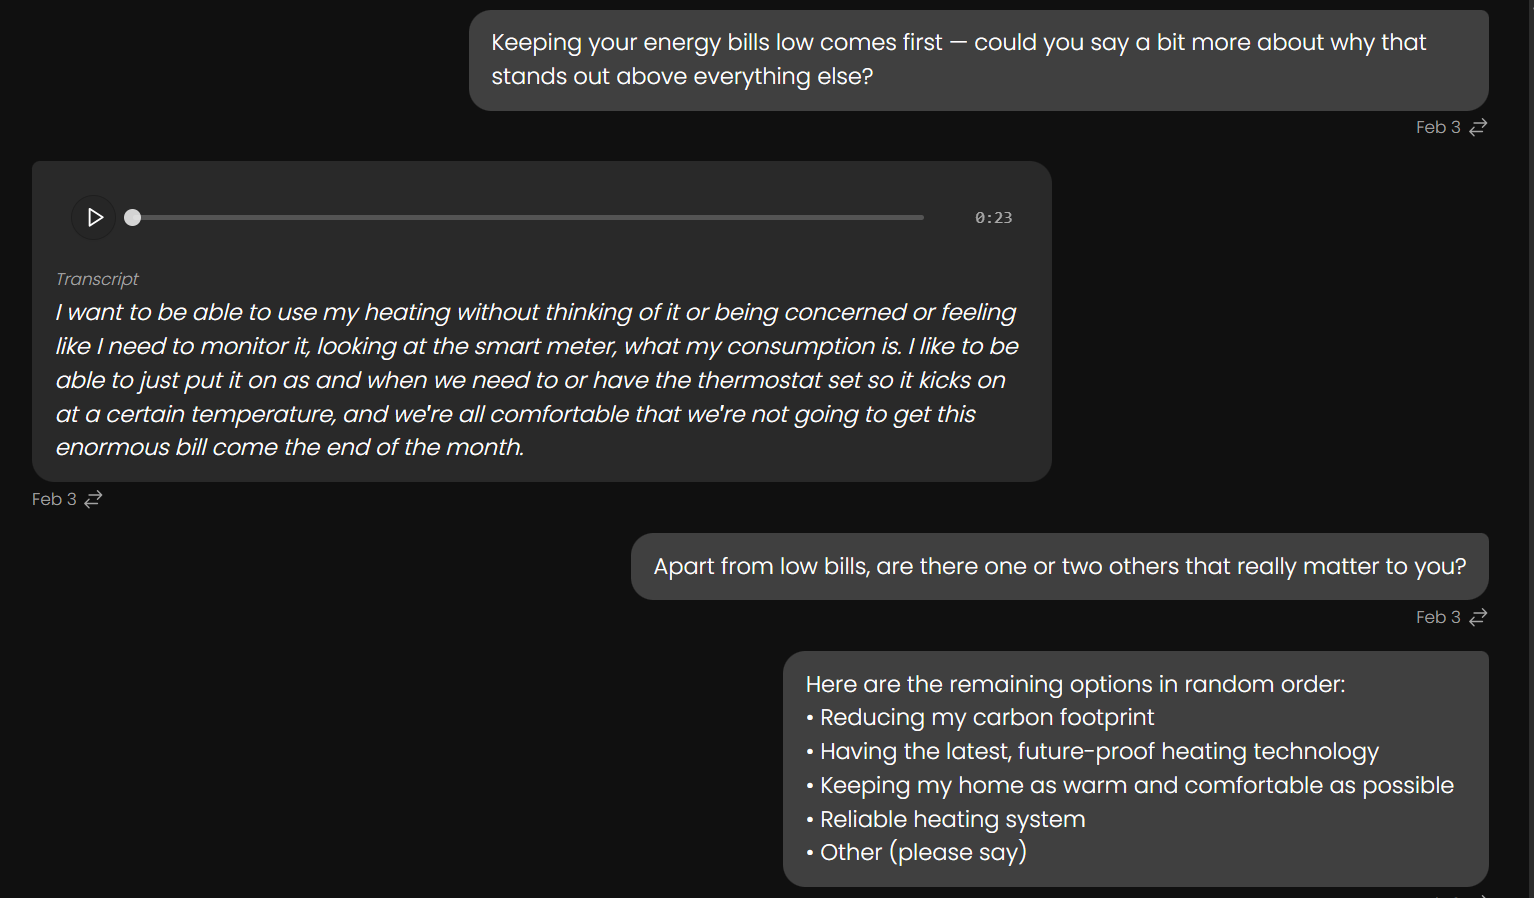
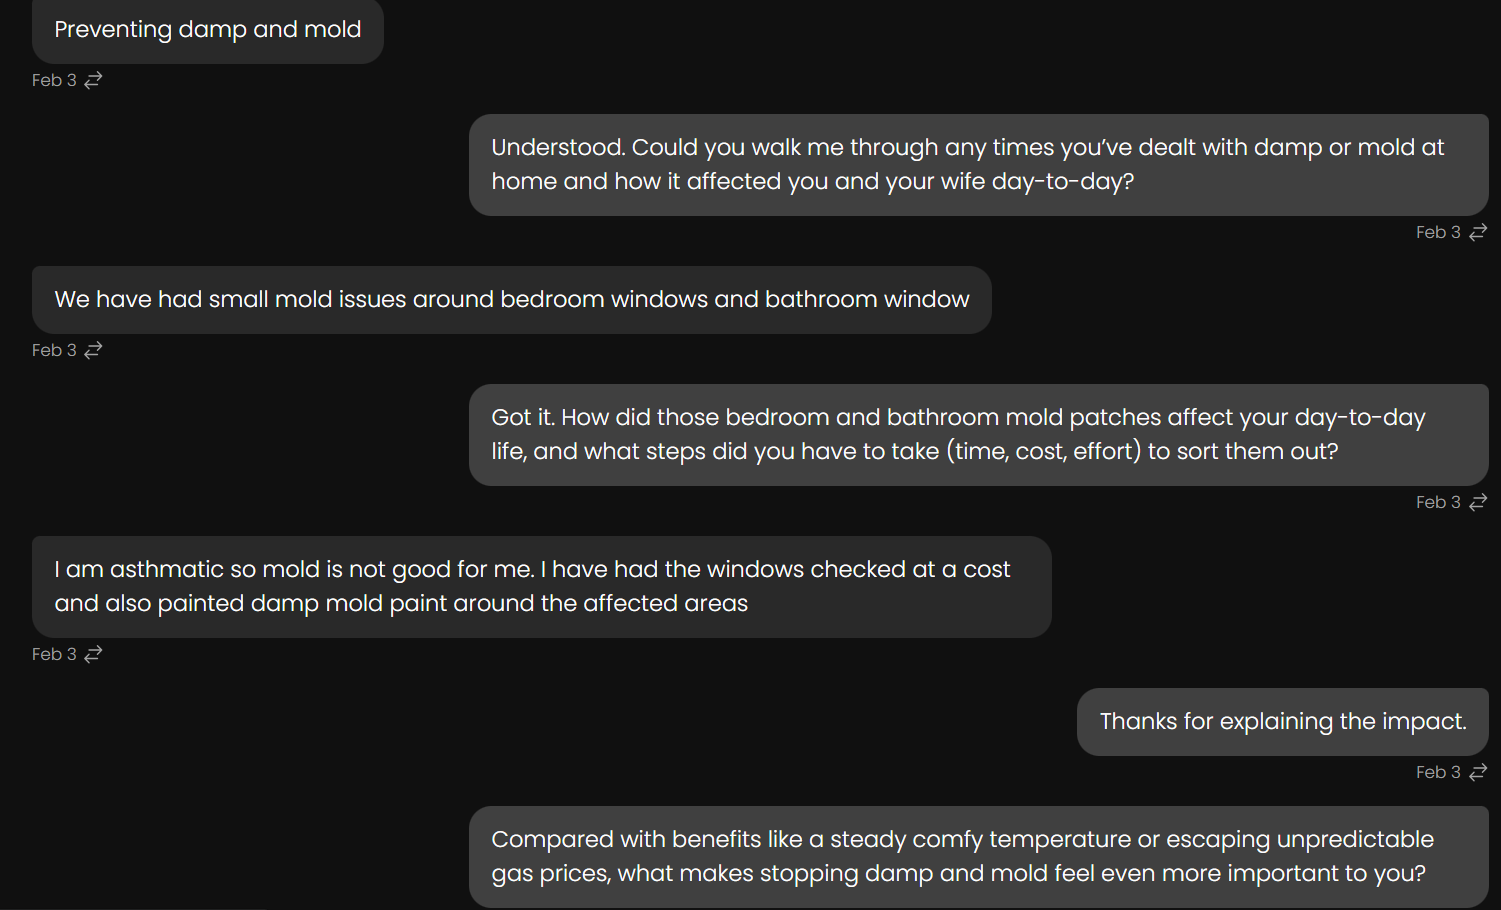
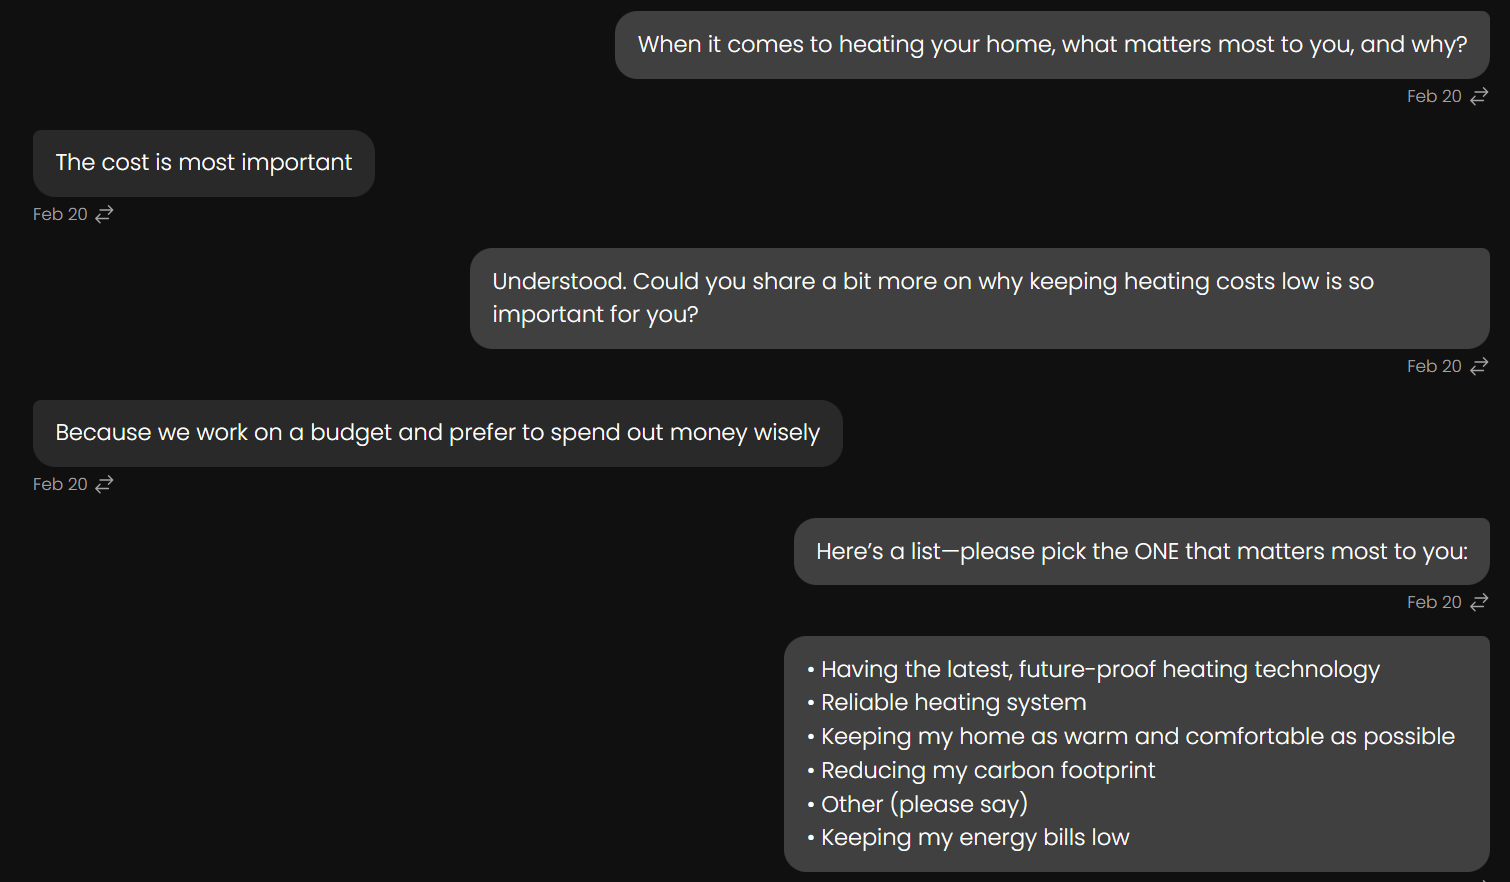
We tested the topic guide with two participants from each segment (16 participants total) before launching the interviews with all 200 participants. This was to test for:
- any safeguarding concerns that might have been missed
- whether the topic guide was fit for purpose
- whether the interviews were running smoothly as planned.
We finalised the topic guide after this test.
Analysis
We used a mix of deductive and inductive coding approaches to code a first sample of 30 transcripts. Two members of the research team manually coded these transcripts. Saturation was reached after the 30 transcripts were coded. We created a codebook based on this sample of transcripts. We manually coded a further 94 transcripts in Nvivo.
We uploaded the remaining 74 transcripts to NotebookLM, alongside the codebook, and the interim report to produce the final analysis. An audit trail of prompts and outputs can be found here. We manually checked outputs against transcripts and summaries of the interviews produced by Langwith Research, to ensure accuracy and validity of interpretation.
The final number of transcripts used for this analysis are:
| Segment |
Number of transcripts |
| A: Eco high-earner Gen-Xers |
25 |
| B: Techie young families |
25 |
| C: Budget-conscious millennial parents |
26 |
| D: Rural retirees on stable income |
23 |
| E: Homeowners eligible for free heat pumps |
23 |
| F: Tech-cautious pre-retirees |
24 |
| G: Young, green urban renters |
28 |
| H: Social tenants on tight budgets |
24 |
Limitations and considerations
Recruitment
The most apparent limitation is that both the recruitment method and the research method automatically screens for digital literacy, excluding participants who are not tech-savvy or don't have regular access to the internet.
- Participants for Segment F were the hardest to recruit. This is to be expected of this segment, as they are generally described as tech-cautious. However, the participants recruited for this segment are likely to be different from the rest of Segment F in the UK population as a whole, as they are less tech-cautious. This is reflected in the age of our participants, who are mostly aged 35-44.
- Participants for Segment A skew slightly younger than Segment A in the UK population as a whole (over half of our participants are not technically 'Gen X').
Sample size
Through the recruitment method and selection of participants for AI-interview we tried to ensure a representative sample of participants for each of the eight segments engaged in the research, but this analysis is based on 198 interview transcripts and its findings should therefore be put into context. The next phase of message testing should help test the external validity of the findings.
Data collection
While the use of an AI-interviewer allows for more participants to be interviewed within the time and financial resources available for this project, it limits the depth and richness of the data collected. It also introduces a black box variable where we cannot ensure that the interviewer systematically and consistently follows the topic guide as written. While we can set a maximum amount of prompts used by the AI-interviewer for each of the questions in the topic guide, we cannot predict either when or how the AI-interviewer chooses to prompt responses further, increasing the likelihood of the collected data being inconsistent.
Data analysis
Of the 198 transcripts, 124 were coded manually in Nvivo, based on the codebook created. The remaining 74 transcripts were uploaded into NotebookLM to supplement the manual coding.
Some limitations of NotebookLM became apparent during the analysis:
- the tendency to extrapolate from the data (ie come up with patterns between segments that don't exist)
- the tendency to exaggerate (ie infer a pattern from the data, even if it is only emerging signals)
- the tendency to get quotes mixed up (ie quote participant G24 when it is in fact participant B3 who mentioned this),
- the tendency to adopt a tone, which sounds definitive and certain, when there are some nuances and uncertainty needing to be taken into account in qualitative analysis.
We put mitigations in place during the analysis to minimise these risks. For example:
- prompting NotebookLM with already observable patterns in the data that had been manually coded (ie 'in my 124 transcripts, this is what I have observed. Is it the case in the additional 74 transcripts as well?)
- explicitly instructing NotebookLM not to extrapolate, make things up, or try and find patterns if they don't exist
- manually checking quote attribution, by going back to the raw data (transcripts)
- attenuating the tone by re-writing analysis sections.
Participants overview
| Attribute |
Segment A (n=25) |
Segment B (n=25) |
Segment C (n=26) |
Segment D (n=23) |
Segment E (n=23) |
Segment F (n=24) |
Segment G (n=28) |
Segment H (n=24) |
Total (n=198) |
| Heating: mains gas |
25 |
24 |
24 |
3 |
19 |
20 |
18 |
20 |
153 |
| Heating: electric |
0 |
1 |
1 |
0 |
2 |
2 |
7 |
4 |
17 |
| Heating: oil |
0 |
0 |
0 |
19 |
1 |
2 |
0 |
0 |
22 |
| Heating: wood/biomass |
0 |
0 |
0 |
1 |
0 |
0 |
0 |
0 |
1 |
| Heating: district/communal |
0 |
0 |
1 |
0 |
0 |
0 |
2 |
0 |
3 |
| Heating: N/A or none* |
0 |
0 |
0 |
0 |
1 |
0 |
1 |
0 |
2 |
| *Central heating |
|
|
|
|
|
|
|
|
|
| Property: detached |
2 |
10 |
1 |
15 |
0 |
7 |
3 |
0 |
38 |
| Property: semi-detached |
8 |
10 |
15 |
4 |
5 |
11 |
4 |
12 |
69 |
| Property: terraced |
15 |
5 |
10 |
0 |
14 |
5 |
4 |
6 |
59 |
| Property: flat/maisonette |
0 |
0 |
0 |
0 |
4 |
0 |
17 |
6 |
27 |
| Property: bungalow |
0 |
0 |
0 |
4 |
0 |
1 |
0 |
0 |
5 |
| Bedrooms: < 3 |
4 |
5 |
2 |
0 |
14 |
2 |
17 |
10 |
54 |
| Bedrooms: 3 |
13 |
7 |
20 |
8 |
7 |
12 |
4 |
11 |
82 |
| Bedrooms: 4+ |
8 |
13 |
4 |
15 |
2 |
10 |
7 |
2 |
61 |
| Bedrooms: not provided |
0 |
0 |
0 |
0 |
0 |
0 |
0 |
1 |
1 |
| Tenure: own outright |
6 |
5 |
12 |
17 |
6 |
10 |
4 |
8 |
68 |
| Tenure: own with mortgage |
17 |
20 |
14 |
5 |
12 |
14 |
12 |
9 |
103 |
Overall Participant Demographics
| Category |
|
|
|
|
|
|
|
|
Total |
| Tenure: rent (private) |
2 |
0 |
0 |
1 |
3 |
0 |
10 |
1 |
17 |
| Tenure: rent (LA/HA) |
0 |
0 |
0 |
0 |
2 |
0 |
2 |
6 |
10 |
| Income: <£10k |
0 |
0 |
1 |
0 |
2 |
0 |
0 |
0 |
3 |
| Income: £10k-£19k |
2 |
0 |
7 |
0 |
1 |
1 |
1 |
8 |
20 |
| Income: £20k-£29k |
1 |
0 |
2 |
4 |
9 |
3 |
3 |
5 |
27 |
| Income: £30k-£39k |
1 |
5 |
2 |
0 |
3 |
3 |
2 |
2 |
18 |
| Income: £40k-£49k |
4 |
2 |
5 |
1 |
4 |
6 |
3 |
6 |
31 |
| Income: £50k-£59k |
2 |
6 |
2 |
2 |
2 |
1 |
3 |
0 |
18 |
| Income: £60k-£69k |
3 |
4 |
1 |
2 |
1 |
2 |
1 |
1 |
15 |
| Income: £70k-£99k |
3 |
2 |
5 |
4 |
1 |
3 |
1 |
0 |
19 |
| Category |
|
|
|
|
|
|
|
|
Total |
| Income: >£100k |
7 |
6 |
0 |
2 |
0 |
5 |
1 |
0 |
21 |
| Income: not provided |
2 |
0 |
1 |
8 |
0 |
0 |
13 |
2 |
26 |
| Age: 18-24 |
0 |
1 |
0 |
0 |
0 |
0 |
2 |
1 |
4 |
| Age: 25-34 |
10 |
5 |
4 |
1 |
4 |
2 |
7 |
6 |
39 |
| Age: 35-44 |
5 |
7 |
7 |
3 |
7 |
6 |
8 |
5 |
48 |
| Age: 45-54 |
5 |
7 |
8 |
9 |
5 |
6 |
7 |
6 |
53 |
| Age: 55+ |
5 |
5 |
7 |
10 |
7 |
10 |
4 |
6 |
54 |
Segment A: Eco high-earning Gen-Xers
| Participant |
Heating system |
Property type |
Number of bedrooms |
Housing situation |
Household income |
Age |
| A1 |
Mains gas |
Terraced house |
3 |
Owns outright |
£40,000 to £49,999 |
55+ |
| A2 |
Mains gas |
Terraced house |
4+ |
Owns outright |
£50,000 to £59,999 |
45-54 |
| A3 |
Mains gas |
Terraced house |
<3 |
Owns with mortgage |
£20,000 to £29,999 |
25-34 |
| A4 |
Mains gas |
Semi-detached house |
3 |
Owns with mortgage |
£60,000 to £69,999 |
35-44 |
| A5 |
Mains gas |
Terraced house |
3 |
Owns with mortgage |
£70,000 to £99,999 |
25-34 |
| A6 |
Mains gas |
Terraced house |
4+ |
Owns with mortgage |
£100,000 and over |
45-54 |
| A7 |
Mains gas |
Terraced house |
3 |
Owns outright |
£10,000 to £19,999 |
35-44 |
| A8 |
Mains gas |
Terraced house |
|
Owns with mortgage |
£40,000 to £49,999 |
45-54 |
| A10 |
Mains gas |
Detached house |
4+ |
Owns with mortgage |
£100,000 and over |
45-54 |
| A11 |
Mains gas |
Terraced house |
3 |
Owns with mortgage |
£70,000 to £99,999 |
35-44 |
| A12 |
Mains gas |
Semi-detached house |
3 |
Owns with mortgage |
£60,000 to £69,999 |
25-34 |
| A13 |
Mains gas |
Terraced house |
<3 |
Owns outright |
£40,000 to £49,999 |
55+ |
| A14 |
Mains gas |
Terraced house |
4+ |
Owns with mortgage |
£70,000 to £99,999 |
55+ |
| A15 |
Mains gas |
Semi-detached house |
3 |
Owns with mortgage |
£100,000 and over |
25-34 |
| A16 |
Mains gas |
Terraced house |
4+ |
Owns with mortgage |
£100,000 and over |
35-44 |
| A17 |
Mains gas |
Semi-detached house |
3 |
Owns outright |
£40,000 to £49,999 |
55+ |
| A18 |
Mains gas |
Semi-detached house |
3 |
Owns with mortgage |
£30,000 to £39,999 |
25-34 |
| A19 |
Mains gas |
Detached house |
4+ |
Owns with mortgage |
Not provided |
45-54 |
| A20 |
Mains gas |
Semi-detached house |
4+ |
Privately rents* |
£100,000 and over |
25-34 |
| A21 |
Mains gas |
Terraced house |
3 |
Owns with mortgage |
£100,000 and over |
25-34 |
| A22 |
Mains gas |
Terraced house |
<3 |
Owns outright |
£10,000 to £19,999 |
55+ |
| A23 |
Mains gas |
Terraced house |
3 |
Owns with mortgage |
£50,000 to £59,999 |
25-34 |
| A24 |
Mains gas |
Terraced house |
3 |
Owns with mortgage |
Not provided |
25-34 |
| A25 |
Mains gas |
Semi-detached house |
4+ |
Privately rents |
£60,000 to £69,999 |
35-44 |
| A26 |
Mains gas |
Semi-detached house |
3 |
Owns with mortgage |
£100,000 and over |
25-34 |
*Participant stated in interview that they 'own their own home'
Summary of Segment A: Eco high-earning Gen-Xers
The 25 participants from Segment A all use mains gas as their main source of heating.
Most (n=15) live in terraced houses, with more than a third (n=8) living in semi-detached houses, and two participants living in detached houses, most of them three-bedroom houses. All but one participant are home-owners, most of whom (n=17) own their home with a mortgage, the others (n=6) owning their house outright.
A high proportion (n=12) of Segment A are mid (£40k) to high income (£99k) earners, earning between. Just over a third (n=7) of the segment are very high earners (>100k), while a few outliers (n=4) are lower earners (<£40k).
A majority (n= 15) of participants are aged between 25-44. The rest of participants are divided equally (n=5) between the ages of 45-54 and 55+.
How this sample compares to Segment A in the general population
This sample of participants A is similar to Segment A as it looks in the general population for heating system, housing type, bedroom numbers and tenure. However, our sample skews younger, with the majority of our respondents aged 25-44, compared to a majority of Segment A in the general population aged 46-61. This should be kept in mind when interpreting findings, particularly around questions of priorities for current heating systems and life stages.
Segment B: Techie young families
| Participant |
Heating system |
Property type |
Number of bedrooms |
Housing situation |
Household income |
Age |
| B1 |
Gas central |
Terraced |
3 |
Own with mortgage |
£60,000 to £69,999 |
45-54 |
| B2 |
Gas central |
Detached house |
4+ |
Own outright |
£60,000 to £69,999 |
45-54 |
| B3 |
Gas central |
Semi-detached house |
4+ |
Own with mortgage |
£50,000 to £59,999 |
45-54 |
| B4 |
Gas central |
Terraced |
4+ |
Own outright |
£100,000 and over |
55+ |
| B5 |
Gas central |
Detached house |
4+ |
Own outright |
£50,000 to £59,999 |
55+ |
| B6 |
Gas central |
Semi-detached house |
3 |
Own with mortgage |
£100,000 and over |
35-44 |
| B7 |
Gas central |
Semi-detached house |
3 |
Own with mortgage |
£100,000 and over |
35-44 |
| B8 |
Gas central |
Terraced |
4+ |
Own with mortgage |
£50,000 to £59,999 |
35-44 |
| B9 |
Gas central |
Semi-detached house |
4+ |
Own outright |
£100,000 and over |
35-44 |
| B10 |
Gas central |
Detached house |
4+ |
Own with mortgage |
£100,000 and over |
45-54 |
| B11 |
Gas central |
Detached house |
4+ |
Own with mortgage |
£70,000 to £99,999 |
45-54 |
| B12 |
Gas central |
Semi-detached house |
3 |
Own with mortgage |
£30,000 to £39,999 |
55+ |
| B13 |
Gas central |
Detached house |
4+ |
Own with mortgage |
£50,000 to £59,999 |
25-34 |
| B14 |
Gas central |
Detached house |
4+ |
Own with mortgage |
£60,000 to £69,999 |
55+ |
| B15 |
Gas central |
Detached house |
<3 |
Own with mortgage |
£30,000 to £39,999 |
25-34 |
| B16 |
Gas central |
Detached house |
4+ |
Own with mortgage |
£70,000 to £99,999 |
35-44 |
| B17 |
Mains gas |
Terraced |
3 |
Own outright |
£50,000 to £59,999 |
55+ |
| B18 |
Mains gas |
Semi-detached house |
3 |
Own with mortgage |
£50,000 to £59,999 |
35-44 |
| B19 |
Mains gas |
Semi-detached house |
<3 |
Own with mortgage |
£40,000 to £49,999 |
45-54 |
| B20 |
Mains gas |
Detached house |
4+ |
Own with mortgage |
£30,000 to £39,999 |
35-44 |
| B21 |
Mains gas |
Terraced |
<3 |
Own with mortgage |
£40,000 to £49,999 |
25-34 |
| B22 |
Mains gas |
Semi-detached house |
3 |
Own with mortgage |
£30,000 to £39,999 |
25-34 |
| B23 |
Mains gas |
Detached house |
4+ |
Own with mortgage |
£100,000 and over |
35-44 |
| B24 |
Mains gas |
Semi-detached house |
<3 |
Own with mortgage |
£30,000 to £39,999 |
45-54 |
| B25 |
Electric |
Semi-detached house |
<3 |
Own with mortgage |
£60,000 to £69,999 |
18-24 |
Summary of Segment B: Techie young families
All but one of the 25 participants from Segment B use mains gas as their main source of heating. The other participant uses an electric system.
Twenty of the participants are evenly split between living in detached houses (n=10) and semi-detached houses (n=10), with the remaining five participants living in terraced houses. Most of them live in larger, four-bedroom plus houses (n=13), followed by three-bedroom houses (n=7), and houses with fewer than three bedrooms (n=5).
All 25 participants are home-owners, most of whom (n=20) own their home with a mortgage, with the others (n=5) owning their house outright.
Over half (n=14) of segment B are mid (£40k) to high income (£99k) earners. The rest of participants B are divided between very high earners (>£100k) (n=6), and lower earners (<£40k) (n=5).
Just under half (n=12) of the participants are aged between 25-44, with one younger outlier aged 18-24. The rest of the participants are divided between the ages of 45-54 (n=7) and 55+ (n=5).
How this sample compares to Segment B in the general population
This sample of participants B is similar to Segment B as it looks in the general population for housing type and number of bedrooms. However the sample is different to Segment B as found in the general population as follows.
Our sample is over-represented by participants who heat their home with gas (all our participants, vs 86% in the general population), by participants who are home-owners (all our participants, vs 85% in the general population), and participants who own their home outright (20% of our participants vs 6% in the general population). Our sample is slightly under-represented by participants who are aged between 25-44 (half of our participants vs 59% in the general population).
This should be kept in mind when interpreting findings, particularly around questions of financial capabilities, and some barriers to heat pump adoption experienced by non-home owners are likely to be absent from the data.
Segment C: Budget-conscious millennial parents
| Participant |
Heating system |
Property type |
Number of bedrooms |
Housing situation |
Household income |
Age |
| C1 |
Gas central |
Semi-detached house |
3 |
Own outright |
£10,000 to £19,999 |
25-34 |
| C2 |
Gas central |
Semi-detached house |
<3 |
Own outright |
£10,000 to £19,999 |
25-34 |
| C3 |
Gas central |
Semi-detached house |
3 |
Own outright |
£10,000 to £19,999 |
45-54 |
| C4 |
Gas central |
Terraced |
3 |
Own with mortgage |
£10,000 to £19,999 |
35-44 |
| C5 |
Gas central |
Semi-detached house |
4+ |
Own outright |
£10,000 to £19,999 |
45-54 |
| C6 |
Electric storage direct |
Semi-detached house |
3 |
Own outright |
Under £10,000 |
35-44 |
| C7 |
Gas central |
Terraced |
3 |
Own outright |
£70,000 to £99,999 |
55+ |
| C8 |
Gas central |
Semi-detached house |
4+ |
Own with mortgage |
£70,000 to £99,999 |
35-44 |
| C9 |
Gas central |
Semi-detached house |
3 |
Own with mortgage |
£50,000 to £59,999 |
25-34 |
| C10 |
Gas central |
Terraced |
3 |
Own with mortgage |
£30,000 to £39,999 |
45-54 |
| C11 |
Gas central |
Semi-detached house |
3 |
Own with mortgage |
£40,000 to £49,999 |
55+ |
| C12 |
Gas central |
Terraced |
3 |
Own with mortgage |
£70,000 to £99,999 |
35-44 |
| C13 |
District communal |
Terraced |
3 |
Own with mortgage |
£20,000 to £29,999 |
45-54 |
| C14 |
Gas central |
Terraced |
3 |
Own with mortgage |
£30,000 to £39,999 |
45-54 |
| Participant |
Heating system |
Property type |
Number of bedrooms |
Housing situation |
Household income |
Age |
| C15 |
Gas central |
Semi-detached house |
3 |
Own with mortgage |
£40,000 to £49,999 |
55+ |
| C16 |
Gas central |
Semi-detached house |
3 |
Own with mortgage |
£50,000 to £59,999 |
25-34 |
| C17 |
Gas central |
Terraced |
3 |
Own outright |
£20,000 to £29,999 |
55+ |
| C18 |
Gas central |
Semi-detached house |
3 |
Own with mortgage |
£10,000 to £19,999 |
55+ |
| C19 |
Gas central |
Semi-detached house |
4+ |
Own outright |
£40,000 to £49,999 |
45-54 |
| C20 |
Gas central |
Terraced |
3 |
Own outright |
£10,000 to £19,999 |
45-54 |
| C21 |
Gas central |
Semi-detached house |
3 |
Own with mortgage |
£70,000 to £99,999 |
35-44 |
| C22 |
Gas central |
Semi-detached house |
3 |
Own outright |
£40,000 to £49,999 |
55+ |
| C23 |
Gas central |
Detached house |
4+ |
Own with mortgage |
Not specified |
55+ |
| C24 |
Gas central |
Terraced |
3 |
Own outright |
£70,000 to £99,999 |
45-54 |
| C25 |
Gas central |
Semi-detached house |
3 |
Own with mortgage |
£40,000 to £49,999 |
35-44 |
| C26 |
Gas central |
Terraced |
<3 |
Own outright |
£60,000 to £69,999 |
35-44 |
Summary of Segment C: Budget-conscious millennial parents
The 26 participants from Segment C use mains gas as their main source of heating in majority (n=24), with one participant using direct electric storage heaters and one using a district communal network.
Most (n=15) live in semi-detached houses, with a large proportion (n=10) living in terraced houses, and one participant living in a detached house, the vast majority of them being three bedroom houses (n=20).
All 26 participants are home-owners, just over half of whom (n=14) own their home with a mortgage, with the others (n=12) owning their house outright.
Exactly half (n=13) of the segment are lower earners (<£40k), while the remaining participants (n=12) are mid (£40k) to high income (£99k) earners, with one participant not disclosing their exact income. None of the participants in this segment are very high earners (>£100k).
A majority (n=15) of participants are aged 45 or older, divided between the ages of 45-54 (n=8) and 55+ (n=7). The rest of the participants are aged between 25-44 (n=11).
How this sample compares to Segment C in the general population
This sample of participants C is similar to Segment C as it looks in the general population for housing type.
However the sample is different to Segment C as found in the general population as follows.
Our sample is over-represented by participants who heat their home with gas (92% of our sample vs 86% in the general population), participants who live in three-bedroom houses (76% of our sample vs 66% in the general population), participants who are home-owners (all our participants vs 86% of the general population) and who own their home outright (half of our participants vs 6% in the general population), and participants who are aged 45 or older (62.5% of our participants vs 25% in the general population).
This should be kept in mind when interpreting findings, particularly around questions of financial capabilities and life-stages, and some barriers to heat pump adoption experienced by non-home owners, or non-gas users are likely to be absent from the data.
The difference between our sample of Segment C and the general population can be partly explained by the model used to recruit participants into their 'true' segments. It can be particularly difficult to correctly predict the segments for participants from Segment A and Segment C, based on the data that we have available for each participant. In our analysis, we've focused on choosing households that represent the key/dominant dimensions of the group, however because this group is quite spread out we miss some of the types of households that belong to this group. Our analysis is representative of the core members of the group, but there remains some unexplored diversity in the segment. We're confident that our analysis is useful and representative nonetheless.
Segment D: Rural retirees on stable income
| Participant |
Heating system |
Property type |
Number of bedrooms |
Housing situation |
Household income |
Age |
| D1 |
Gas central |
Detached house |
4+ |
Own with mortgage |
Not provided |
45-54 |
| D2 |
Oil |
Detached house |
4+ |
Own outright |
£60,000 to £69,999 |
55+ |
| D3 |
Gas central |
Bungalow |
3 |
Own with mortgage |
£50,000 to £59,999 |
45-54 |
| D4 |
Oil |
Bungalow |
3 |
Own outright |
£70,000 to £99,999 |
55+ |
| D5 |
Oil |
Detached house |
4+ |
Own outright |
Not provided |
55+ |
| D6 |
Oil |
Detached house |
4+ |
Own outright |
£70,000 to £99,999 |
55+ |
| D7 |
Wood or biomass |
Bungalow |
3 |
Own with mortgage |
Not provided |
45-54 |
| D8 |
Oil |
Detached house |
4+ |
Own outright |
£100,000 and over |
45-54 |
| D9 |
Oil |
Semi-detached house |
4+ |
Own outright |
£50,000 to £59,999 |
45-54 |
| D10 |
Oil |
Detached house |
3 |
Own outright |
Not provided |
55+ |
| D11 |
Oil |
Detached house |
4+ |
Own outright |
Not provided |
55+ |
| D12 |
Oil |
Detached house |
4+ |
Own outright |
Not provided |
45-54 |
| D13 |
Oil |
Detached house |
4+ |
Own outright |
£60,000 to £69,999 |
35-44 |
| D14 |
Oil |
Semi-detached house |
3 |
Own outright |
£20,000 to £29,999 |
45-54 |
| D15 |
Oil |
Detached house |
4+ |
Own outright |
Not provided |
55+ |
| D16 |
Oil |
Detached house |
4+ |
Own outright (no mortgage) |
£100,000 and over |
55+ |
| D17 |
Oil |
Semi-detached house |
3 |
Own outright (no mortgage) |
£20,000 to £29,999 |
35-44 |
| D18 |
Mains gas |
Semi-detached house |
4+ |
Own with a mortgage |
£40,000 to £49,999 |
25-34 |
| D19 |
Oil |
Detached house |
3 |
Privately rent |
Not provided |
55+ |
| D20 |
Oil |
Detached house |
4+ |
Own with a mortgage |
£70,000 to £99,999 |
35-44 |
| D21 |
Oil |
Detached house |
4+ |
Own outright (no mortgage) |
£70,000 to £99,999 |
45-54 |
| D22 |
Oil |
Bungalow |
3 |
Own outright (no mortgage) |
£20,000 to £29,999 |
55+ |
| D23 |
Oil |
Detached house |
4+ |
Own outright (no mortgage) |
£20,000 to £29,999 |
45-54 |
Summary of Segment D: Rural retirees on stable income
The 23 participants from Segment D mostly use oil (n=19) as their main source of heating, alongside a few using mains gas (n=3) or wood/biomass (n=1).
Most (n=15) live in detached houses, with the rest living equally in semi-detached houses (n=4) and bungalows (n=4), most of them houses with four or more bedrooms.
All but one participant are home-owners, most of whom (n=17) own their home outright, the others (n=5) owning their house with a mortgage, and one participant privately renting.
How this sample compares to Segment D in the general population
This sample of participants D is similar to Segment D as it looks in the general population for age, number of bedrooms, and housing type. However the sample is different to Segment D as found in the general population as follows.
Our sample is over-represented by participants who heat their home with oil (82+% of our participants compared to 43% in the general population), participants who are home-owners (all but one of our participants compared to 81% in the general population) and who own their home outright (74% of our participants compared to 48% in the general population).
This should be kept in mind when interpreting findings, particularly around questions of financial capabilities and current use/behaviours around heating, and some barriers to heat pump adoption experienced by non-home owners or non-oil users are likely to be absent from the data.
## Segment E: Homeowners eligible for free heat pumps
<div class="table-container" markdown="1">
| Participant | Heating system | Property type | Number of bedrooms | Housing situation | Household income | Age |
|-------------|-------------------|------------------|--------------------|--------------------|----------------------|-------|
| E1 | Gas central | Flat/maisonette | <3 | Own outright | £10,000 to £19,999 | 55+ |
| E2 | Gas central | Semi-detached house | 3 | Own with mortgage | £50,000 to £59,999 | 35-44 |
| E3 | Gas central | Terraced | 3 | Own outright | £30,000 to £39,999 | 45-54 |
| E4 | Gas central | Terraced | 3 | Own with mortgage | £50,000 to £59,999 | 35-44 |
| E5 | Oil | Terraced | <3 | Own outright | £20,000 to £29,999 | 55+ |
| E6 | Gas central | Terraced | 4+ | Own with mortgage | £30,000 to £39,999 | 25-34 |
| E7 | Gas central | Semi-detached house | <3 | Own outright | £20,000 to £29,999 | 55+ |
| E8 | Gas central | Semi-detached house | <3 | Privately rent | £20,000 to £29,999 | 55+ |
| E9 | Electric storage/ direct | Flat/maisonette | <3 | I Rent from LA or HA | Under £10,000 | 45-54 |
| E10 | Gas central | Flat/maisonette | <3 | Own with mortgage | £20,000 to £29,999 | 25-34 |
| E11 | Gas central | Flat/maisonette | <3 | Privately rent | £20,000 to £29,999 | 25-34 |
| E12 | Gas central | Terraced | 3 | Own with mortgage | £40,000 to £49,999 | 35-44 |
| E13 | Gas central | Terraced | <3 | Own with mortgage | £60,000 to £69,999 | 35-44 |
| E14 | Electric storage/ direct | Terraced | <3 | Own with mortgage | £40,000 to £49,999 | 35-44 |
| E15 | Gas central | Terraced | <3 | Own with mortgage | £20,000 to £29,999 | 45-54 |
| E16 | Gas central | Semi-detached house | <3 | Own with mortgage | £20,000 to £29,999 | 55+ |
| E17 | Mains gas | Terraced house | 3 | I own my home with a mortgage | £70,000 to £99,999 | 45-54 |
| E18 | Not applicable* | Terraced house | 3 | I own my home with a mortgage | £30,000 to £39,999 | 45-54 |
| E19 | Mains gas | Terraced house | <3 | I own my home outright (no mortgage) | £20,000 to £29,999 | 35-44 |
| E20 | Mains gas | Terraced house | <3 | I own my home with a mortgage | £40,000 to £49,999 | 35-44 |
| E21 | Mains gas | Semi-detached house | 3 | I own my home outright (no mortgage) | Under £10,000 | 55+ |
| E22 | Mains gas | Terraced house | 4+ | Privately rent my home | £40,000 to £49,999 | 25-34 |
| E23 | Mains gas | Terraced house | <3 | I Rent from LA or HA | £20,000 to £29,999 | 55+ |
</div>
*in the interview, this participant stated they heat their house with gas fires and electric radiators
### Summary of Segment E: Homeowners eligible for free heat pumps
The 23 participants from Segment E mostly use mains gas as their main source of heating (n=19), with a few using electric heating (n=2), oil (n=1), or lacking central heating* (n=1). Most (n=14) live in terraced houses, with some (n=5) living in semi-detached houses, and four participants living in flats or maisonettes, most of them having fewer than three bedrooms (n=14).
A majority of participants are home-owners (n=18), most of whom (n=12) own their home with a mortgage, the others (n=6) owning their house outright, while the remaining participants (n=5) rent their homes (n=3 privately, n=2 from LA or HA).
A high proportion (n=15) of segment E are lower earners (<£40k), with three participants earning under £10k. The rest of the segment (n=8) are mid (£40k) to high income (£99k) earners, with no participants being very high earners (>£100k).
Just under half (n=11) of participants are aged between 25-44. The rest of the participants are divided between the ages of 45-54 (n=5) and 55+ (n=7).
### How this sample compares to Segment E in the general population
This sample of participants E is similar to Segment E as it looks in the general population for gas heating. However the sample is different to Segment E as found in the general population as follows.
Our sample is over-represented by participants who live in terraced houses (60% of our participants vs 34% in the general population), participants who have fewer than three bedrooms (61% of our participants vs 49% in the general population), participants who are home-owners (78% of our participants vs 65% in the general population), participants who are aged 25-44 (half of our participants compared to 19% in the general population).
Our sample is under-represented by participants who own their home without a mortgage (26% of our participants vs 48% in the general population).
This is to be kept in mind when interpreting findings, particularly around questions of financial capabilities as this segment found in the general population might face fewer financial barriers than those raised by our participants. Life-stages and age-related findings are likely to be skewed younger too, and barriers specifically related to terraced houses might be overemphasised as well.
## Segment F: Tech-cautious pre-retirees
<div class="table-container" markdown="1">
| Participant | Heating system | Property type | Number of bedrooms | Housing situation | Household income | Age |
|-------------|------------------|---------------------|--------------------|-------------------|----------------------|-------|
| F1 | Electric storage/direct | Terraced | 3 | Own with mortgage | £40,000 to £49999 | 35-44 |
| F2 | Oil | Bungalow | <3 | Own outright | £20,000 to £29,999 | 35-44 |
| F3 | Gas central | Semi-detached house | 4+ | Own with mortgage | £30,000 to £39999k | 25-34 |
| F4 | Gas central | Semi-detached house | <3 | Own outright | £70,000 to £99,999 | 45-54 |
| F5 | Gas central | Semi-detached house | 3 | Own with mortgage | £70,000 to £99,999 | 35-44 |
| F6 | Gas central | Terraced | 3 | Own with mortgage | £20,000 to £29,999 | 45-54 |
| F7 | Gas central | Detached house | 4+ | Own outright | £100k and above | 45-54 |
| F8 | Gas central | Detached house | 4+ | Own with mortgage | £50,000 to £59,999 | 55+ |
| F9 | Gas central | Terraced | 3 | Own with mortgage | £40,000 to £49999 | 35-44 |
| F10 | Electric boiler/infrared | Semi-detached house | 3 | Own with mortgage | £40,000 to £49999 | 35-44 |
| F11 | Gas central | Semi-detached house | 3 | Own with mortgage | £100,000 and above | 35-44 |
| F12 | Gas central | Detached house | 4+ | Own with mortgage | £60,000 to £69,999 | 55+ |
| F13 | Gas central | Terraced | 3 | Own outright | £30,000 to £39999 | 55+ |
| F14 | Oil | Detached house | 4+ | Own outright | £40,000 to £49,999 | 55+ |
| F15 | Gas central | Detached house | 4+ | Own outright | £40,000 to £49,999 | 55+ |
| F16 | Gas central | Detached house | 4+ | Own outright | £70,000 to £99,999 | 55+ |
| F17 | Gas central | Semi-detached house | 3 | Own with mortgage | £40,000 to £49,999 | 25-34 |
| F18 | Gas central | Semi-detached house | 3 | Own outright | £20,000 to £29,999 | 55+ |
| F19 | Gas central | Semi-detached house | 3 | Own with mortgage | £100,000 and above | 45-54 |
| F20 | Gas central | Semi-detached house | 4+ | Own outright | £100,000 and above | 55+ |
| F21 | Gas central | Semi-detached house | 4+ | Own with mortgage | £30,000 to £39,999 | 45-54 |
| F22 | Gas central | Semi-detached house | 3 | Own outright | £60,000 to £69,999 | 55+ |
| F23 | Gas central | Terraced | 3 | Own with mortgage | £10,000 to £19,999 | 45-54 |
| F24 | Gas central | Detached house | 4+ | Own with mortgage | £100k and above | 55+ |
</div>
### Summary of Segment F: Tech-cautious pre-retirees
The 24 participants from Segment F mostly (n=20) use gas central as their main source of heating, with the rest equally divided between oil (n=2) and electric heating (n=2).
A big proportion (n=11) live in semi-detached houses, with nearly a third (n=7) living in detached houses, and five participants living in terraced houses (with one in a bungalow), most of them three-bedroom houses.
All participants are home-owners, most of whom (n=14) own their home with a mortgage, the others (n=10) owning their house outright.
A high proportion (n=12) of segment F are mid (£40k) to high income (£99k) earners. Just under a quarter (n=5) of the segment are very high earners (>100k), with a few outliers (n=7) being lower earners (<£40k).
The largest group (n=10) of participants are aged 55+. The rest of the participants are divided closely between the ages of 25-44 (n=8) and 45-54 (n=6).
### How this sample compares to Segment F in the general population
This sample of participants F is similar to Segment F as it looks in the general population for gas heating, and owning their home with a mortgage or outright. However, the sample is different to Segment F as found in the general population as follows.
Our sample is over-represented by participants who live in semi-detached houses (45% of our participants vs 28% in the general population), who are home owners (all of our participants vs 87% in the general population, and who are aged under 55 (59% of our participants vs 22% in the general population). This should be kept in mind when interpreting findings, particularly around questions of life-stages, age-related findings are likely to be skewed younger too, and barriers specifically related to semi-detached houses might be overemphasised as well. Barriers specifically related to non-home ownership are likely to be absent from the data.
## Segment G: Young, green urban renters
<div class="table-container" markdown="1">
| Participant | Heating system | Property type | Number of bedrooms | Housing situation | Household income | Age |
|-------------|-----------------------------|------------------|--------------------|----------------------|--------------------|-------|
| G1 | Electric storage, direct | Flat/maisonette | <3 | Privately rent | Not provided | 45-54 |
| G2 | Electric storage, direct | Flat/maisonette | 3 | Privately rent | £50,000 to 59,999 | 25-34 |
| G3 | Electric storage, direct | Flat/maisonette | 3 | Privately rent | £20,000 to £29,999 | 35-44 |
| G4 | Gas central | Flat/maisonette | <3 | Own with mortgage | Not provided | 45-54 |
| G5 | Gas central | Terraced | <3 | Rent from LA or HA | £30,000 to £39,999 | 35-44 |
| G6 | Gas central | Flat/maisonette | <3 | Privately rent | £40,000 to £49,999 | 25-34 |
| G7 | Gas central | Flat/maisonette | <3 | Own with mortgage | Not provided | 35-44 |
| G9 | District communal | Flat/maisonette | <3 | Own with mortgage | £40,000 to £49,999 | 35-44 |
| G10 | Gas central | Terraced | 4+ | Own with mortgage | £100,000 and above | 55+ |
| G11 | Gas central | Flat/maisonette | <3 | Own with mortgage | Not provided | 35-44 |
| G12 | Electric storage, direct | Flat/maisonette | <3 | Rent from LA or HA | Not provided | 25-34 |
| G13 | Electric storage, direct | Flat/maisonette | <3 | Privately rent | £30,000 to £39,999 | 18-24 |
| G14 | Not applicable, no central heating | Flat/maisonette | <3 | Privately rent | £50,000 to £59,999 | 45-54 |
| G15 | Gas central | Flat/maisonette | <3 | Own with mortgage | Not provided | 25-34 |
| G16 | Gas central | Flat/maisonette | <3 | Own with mortgage | Not provided | 45-54 |
| G17 | Mains gas | Semi-detached house | <3 | Privately rent | £60,000 to £69,999 | 25-34 |
| G18 | Electric (eg storage heaters, direct electric, infrared, boiler) | Flat/maisonette | <3 | Own with mortgage | Not Provided | 25-34 |
| G19 | Mains gas | Semi-detached house | 4+ | Own outright (no mortgage) | £70,000 to £99,999 | 55+ |
| G20 | Mains gas | Flat/maisonette | 3 | Own with mortgage | Not Provided | 45-54 |
| G21 | Mains gas | Terraced house | <3 | Own with mortgage | £10,000 to £19,999 | 45-54 |
| G22 | Mains gas | Terraced house | 4+ | Own with mortgage | £50,000 to £59,999 | 45-54 |
| G23 | Mains gas | Detached house | 4+ | Own outright (no mortgage) | Not Provided | 55+ |
| G24 | Mains gas | Semi-detached house | 4+ | Privately rent | £40,000 to £49,999 | 18-24 |
| G25 | Mains gas | Detached house | 4+ | Own outright (no mortgage) | £20,000 to £29,999 | 35-44 |
| G26 | District or communal heat network | Flat/maisonette | <3 | Privately rent | Not Provided | 35-44 |
| G27 | Mains gas | Semi-detached house | 3 | Own with mortgage | £20,000 to £29,999 | 25-34 |
</div>
*Please note participant G8 has been excluded from the final analysis, as they are a suspected AI bot.
### Summary of Segment G: Young, green urban renters
The 28 participants from Segment G predominantly use mains gas (n=18) as their main source of heating, with the remainder using electric heating (n=7), district communal heating (n=2), or have no central heating (n=1).
Most (n=17) live in flats or maisonettes, with the rest living in terraced (n=4), semi-detached (n=4), or detached houses (n=3), most of them having fewer than three bedrooms (n=17).
Over half of the participants are home-owners (n=16), most of which own their home with a mortgage (n=12), the others owning their house outright (n=4). The remaining participants are renters, mostly renting privately (n=10) or from a local authority/housing association (n=2).
Thirteen participants chose not to disclose their income. Of those with recorded incomes (n=15), a high proportion (n=8) are mid (£40k) to high income (£99k) earners. Only one participant is a very high earner (>£100k), while several (n=6) are lower earners (<£40k).
A majority (n=15) of participants are aged between 25-44. The rest of the participants are distributed across the ages of 45-54 (n=7), 55+ (n=4), and a small number aged 18-24 (n=2).
### How this sample compares to Segment G in the general population
This sample of participants G is similar to Segment G as it looks in the general population for gas heating, number of bedrooms and age range. However, the sample is different to Segment G as found in the general population as follows.
Our sample is over-represented by participants who are home-owners (57% of our participants vs 23% in the general population).
Our sample is under-represented by participants who live in maisonettes/flats (61% of our participants vs 88% in the general population), renters (36% of our participants vs 68% in the general population). This should be kept in mind when interpreting findings, particularly around barriers specifically related to non-home ownership and/or living in flats are likely less present in or absent from the data.
## Segment H: Social tenants on tight budgets
<div class="table-container" markdown="1">
| Participant | Heating system | Property type | Number of bedrooms | Housing situation | Household income | Age |
|-------------|----------------|---------------------|--------------------|--------------------|--------------------|-------|
| H1 | Gas central | Flat/maisonette | <3 | Own with mortgage | Not provided | 25-34 |
| H2 | Gas central | Terraced | 4+ | Own outright | £30,000 to £39,999 | 55+ |
| H3 | Gas central | Semi-detached house | 3 | Privately rent | £10,000 to £19,999 | 35-44 |
| H4 | Gas central | Semi-detached house | 3 | Own outright | £40,000 to £49,999 | 45-54 |
| H5 | Gas central | Semi-detached house | 3 | Own with mortgage | £40,000 to £49,999 | 55+ |
| H6 | Gas central | Terraced | 3 | Own with mortgage | £10,000 to £19,999 | 45-54 |
| H7 | Gas central | Flat/maisonette | <3 | Rent from LA or HA | £20,000 to £29,999 | 25-34 |
| H8 | Gas central | Semi-detached house | <3 | Own outright | £10,000 to £19,999 | 18-24 |
| H9 | Gas central | Semi-detached house | 3 | Rent from LA or HA | £40,000 to £49,999 | 45-54 |
| H10 | Gas central | Semi-detached house | 3 | Own outright | £20,000 to £29,999 | 35-44 |
| H11 | Gas central | Semi-detached house | 4+ | Own with mortgage | £60,000 to £69,999 | 45-54 |
| H12 | Gas central | Semi-detached house | 3 | Own with mortgage | £20,000 to £29,999 | 45-54 |
| H13 | Electric storage, direct | Semi-detached house | Not provided | Rent from LA or HA | £10,000 to £19,999 | 25-34 |
| H14 | Gas central | Terraced | <3 | Own with mortgage | £40,000 to £49,999 | 35-44 |
| H15 | Gas central | Terraced | <3 | Rent from LA or HA | £10,000 to £19,999 | 55+ |
| H16 | Gas central | Flat/maisonette | <3 | Own outright | £10,000 to £19,999 | 55+ |
| H17 | Electric storage, direct | Flat/maisonette | <3 | Rent from LA or HA | Not provided | 25-34 |
| H18 | Gas central | Semi-detached house | 3 | Own outright | £10,000 to £19,999 | 55+ |
| H19 | Gas central | Semi-detached house | 3 | Own with mortgage | £20,000 to £29,999 | 35-44 |
| H20 | Gas central | Flat/maisonette | <3 | Own with mortgage | £40,000 to £49,999 | 25-34 |
| H21 | Gas central | Terraced | 3 | Rent from LA or HA | £10,000 to £19,999 | 55+ |
| H22 | Electric storage, direct | Terraced | <3 | Own with mortgage | £40,000 to £49,999 | 25-34 |
| H23 | Gas central | Semi-detached house | 3 | Own outright | £30,000 to £39,999 | 45-54 |
| H24 | Electric storage, direct | Flat/maisonette | <3 | Own outright | £20,000 to £29,999 | 25-34 |
</div>
### Summary of Segment H: Social tenants on tight budgets
The 24 participants from Segment H predominantly use gas central heating (n=20) as their main source of heating, with a few using electric heating (n=4).
Half (n=12) live in semi-detached houses, with the remainder evenly split between flats/maisonettes (n=6) and terraced houses (n=6), most of them three bedroom (n=11) or smaller <three-bedroom (n=10) homes.
A majority (n=17) of participants are home-owners, most of which (n=9) own their home with a mortgage, the others (n=8) owning their house outright, while the rest are renting from a local authority or housing association (n=6) or privately (n=1).
A high proportion (n=15) of Segment H are lower earners (<£40k). Just under a third (n=7) of the segment are mid-income earners (£40k-£69k), with two participants not providing their income.
A large portion (n=11) of participants are aged between 25-44, with one younger outlier (n=1) aged 18-24. The rest of the participants are divided equally (n=6) between the ages of 45-54, and 55+.
### How this sample compares to Segment H in the general population
This sample of participants H is similar to Segment H as it looks in the general population for gas heating and number of bedrooms. However, the sample is different to Segment H as found in the general population as follows.
Our sample is over-represented by participants who are home-owners (70% of our participants vs 25% in the general population), living in semi-detached houses (half of our participants compared to 20% in the general population), are aged between 25-44 (45% of our participants compared to 27% in the general population).
## Priorities for current heating system
Participants were asked three questions specifically on what is important to them in regards to their home heating.
1. When it comes to heating your home, what matters to you?
[0-1 follow-up question]
2. If you had to pick just one, which of these matter most?
[Select one of (randomised)]:
* Keeping my home as warm and comfortable as possible
* Reliable heating system
* Keeping my energy bills low
* Reducing my carbon footprint
* Having the latest, future-proof heating technology
* Other (please say)' [0-1 follow-up question]
3. Are there another one or two on this list that matter to you? AI prompts what they haven't covered
[0-1 follow-up questions]
### The hierarchy of priorities: cost, comfort, and reliability
The triad of cost, comfort and reliability remained the universal framework for how people think about and evaluate their heating system, across all eight segments.
#### Cost
For all segments, the dominant concern remained keeping energy bills low, amplified by the cost of living crisis felt over the recent years, particularly for segments B, C, E, G and H:
<blockquote markdown="1">
“the cost of living has risen and as a single person living alone with only one wage coming in, I struggle to pay all the bills.” (H16)
</blockquote>

For budget-mindful segments, specifically (C, H and G), the higher cost was described as a matter of survival, with energy costs competing with prices of other essentials such as mortgages, food/drinks and transportation:
<blockquote markdown="1">
"Cost is the most important factor as we are having to balance our spending with the rise in cost of pretty much everything.” (H9)
</blockquote>

Many participants mentioned that they had already taken steps to reduce their heating, for example by ‘layering up' (H3), and restricting usage to rooms where participants described being present at any given time, or time-wise to a few hours across the day.
Other strategies frequently reported being used across segments to keep costs down involved monitoring energy usage with a smart meter or thermostat. Participants reported monitoring their usage to either adapt their consumption day-to-day, plan their consumption through a longer period, or adapt their household budget to fit increased bills.
Participants from segments A, D and E reported that the impact of rising costs had increased their need for an efficient heating system, as defined as providing ‘bang for your buck' (D15), with motivations other than pure survival:
<blockquote markdown="1">
“Energy efficiency is my number one concern both to save money and be environmentally responsible.” (A2)
</blockquote>
#### Comfort
Closely following cost was the need for warmth and comfort, across all segments. A recurring theme mentioned by participants was the need to balance comfort with the need of keeping costs down:
<blockquote markdown="1">
"We like to keep our bills as low as possible, but also we are sensible and we'll spend the money to ensure we are warm and comfortable.” (D4)
</blockquote>

The need for warmth was rarely described as a luxury, but rather as an important source of comfort (particularly for segments A and H). Imagery of the home being a 'sanctuary' (H17), a place to ‘feel relaxed' (B19), 'cosy' (C8) ‘comfy' (E11) and a place of 'enjoyment' (H13) were used by many participants.

This was mentioned by participants who recalled negative past experiences, described as ‘awful (D18), 'miserable' (F20), ‘a horror show' (H19), some even recalling the lasting impact of childhood experiences:
"growing up when my dad turned off the heating and when I was very little because he was trying to save money so I do not want to be in that situation again with my family." (D23)
The need for comfort was also mentioned as a necessary means to care for dependents, particularly for segments B, D, C and E, making sure that the home is warm enough for the kids, and that older family members are also protected from the cold.
Finally, the need for comfort was also associated with keeping health conditions at bay, for segments B, D and H. For segment H, warmth was associated with 'protection from illness' (H7) while participants across other segments, and Segment B specifically, referred to the specific chronic health conditions of their partners or children, like diabetes, low blood pressure, asthma, ‘made worse by the cold' (A13).
Reliability
Reliability completed this triad of priorities, particularly for segments A, B, D and G. Reliability was defined by participants in a few different ways, notably as working when required, avoiding expensive repairs, and ultimately avoiding anxiety and stress. For participant F24, this meant:
“I can forget about [the heating system] working properly when it matters.”
A component of reliability also mentioned by a few participants from segments A, D, G and E was servicing options. A reliable heating system means one that is easily serviceable with ‘widely available servicing options' (E20), 'cheap to fix if it goes wrong' (B11), or which ‘doesn't cost a fortune to keep it serviced annually' (D11).
Priorities for switch to electric
Participants were asked one question and a follow-up question about what the most attractive benefit would be for them to switch to electric heating.
- Below is an example of some of the benefits that moving from gas to electric as a source of fuel could provide. If you had to pick just one, which of these would matter most?
[Select one of (randomised)]:
* Improving the air quality in my home and neighbourhood
* Not having to pay gas bill standing charges
* Moving away from unpredictable gas prices
* Removes risk of gas leaks in the home
* With a battery, solar and a heat pump I could be self sufficient, not relying on anyone else for energy
* Having a home that always stays the same comfortable temperature
* Preventing damp and mold
* The ability to both cool and heat my house [0-1 follow-up question]
* Compared to the others? [0-2 follow-up questions]
The desire for autonomy, adaptation and consistency with an electric heating system
Self-sufficiency
The desire for self-sufficiency (with a heat pump, solar and battery) remained the most attractive argument for switching to an electric heating system, across all eight segments, but particularly for segments F, D and A. The appeal of self-sufficiency was strongly linked with the desire for protection against external factors out of participants' control, a need for certainty and a shared distrust of energy companies.
All segments expressed mostly negative emotions towards energy companies. This was a pattern observed across incomes and housing situations. There was a general distrust of energy companies and their motivations, who were often viewed as prioritising shareholders and profit at the expense of customers:
"Probably when they want to raise the prices for no other reason but they can. We're beholden to them and making shareholders richer.” (F19)
Participants also distrusted the way energy companies fix prices, describing prices as 'extortionate' (F8), or often ‘changing' (B1), going directly against their desire for future certainty.
Participants across segments also expressed wanting independence from energy markets. This want was motivated by external factors' impacts on energy prices:
“you are kind of at the mercy, I suppose, of geopolitical events sometimes for your energy costs." (B13)
Specific external factors mentioned were the invasion of Ukraine by Russia and the UK's reliance on imported energy.
The energy market and its associated energy prices were described by participants as extremely ‘volatile' (D19), ‘unpredictable' (A25), or 'spiking' (A23).
Self-sufficiency was understood by participants as ultimately leading to cutting costs, which was another strong motivation for switching to an electric heating system, particularly for segments F, G and C:
"If we could be self sufficient, I would expect that we would save considerably on costs." (F3)
The last motivation for self-sufficiency raised by participants was the desire to be more environmentally friendly. This was particularly present across segments A and G. The desire to be environmentally friendly was always coupled with cutting costs, and described as a 'win-win' scenario' (D12) between cost-effectiveness and carbon footprint reduction.
Some participants mentioned it as a way of making them feel better/less guilty about heating their home:
"But more than that, it would feel as though, you know, I was doing something good for the environment. And that would feel pretty good too.” (B8)
Others viewed having an electric heating system (with a battery and solar) a way to do 'their part' for the environment (A20).
Adaptation: the ability to both cool and heat their home
Participants from segments A, C, G and F specifically noted an evolving requirement for heating systems: the ability to also cool their home.
Participants mentioned the increased intensity of British summers in recent years as the primary motivation for needing to cool their homes. Many participants vividly described moments where the heat has felt 'unbearable', 'intolerable', 'outrageously hot' (A4). As participant F6 put it, high heat in summer is as much of a source of stress for her children as being cold in winter:
“One of my daughter's bedrooms, the temperature is so high in the summertime that she cannot sleep in there, which is why I have the big bulky air conditioning unit. So if there is something that could exist that helps deal with that and take some of the preparation and the moving around of this huge unit, if there's something that allows us to cool our homes as easy as it is to heat them up in the winter, then that's going to take a lot of the stress and the work out of trying to cool my house down so that my children can sleep."
Participants described some of the strategies they have already put in place to try and cool their homes down, without much success, such as using fans, ventilating, drawing blind/curtains, or even using standalone cooling units. The inefficiency of these methods was described as a strong motivation for wanting a system that can both cool and heat their home.
Consistency: same comfortable temperature
The desire for internal temperature to be consistent also emerged as an important consideration across all segments. Some variation in motivation emerged across segments.
For participants from segments E, G and H, it was about addressing the extreme constant of feeling cold in their home, even when going about their day-to-day activities:
“on a cold day I still spend a lot of the time cold, especially when getting out of bed and in the bathroom getting ready” (H24)
For participants from segments B and C, it was about mitigating the impact of variable temperatures on their health:
“When I get too cold, I get really bad joint pain which then affects my mobility. When it gets too hot, I overheat, get crippling headaches" (B17)
Other motivations included keeping the house a comfortable temperature for 'children and babies' (A24), and 'comfort in old age' (D16).
Experience of damp and mould: a strong motivator
Preventing damp and mould appeared as particularly important for segments D, G, and H. Almost all participants who chose this as a priority mentioned having experienced damp and mould previously or currently. Some participants also described the solutions they have used to try and reduce this problem, without much success.
One participant working in insurance claims commented on the impact they had seen it having on people:
“I work in insurance claims and have seen how this affects people. [...] heath affects and the affects it can have on your mentally and also the cost to replace items" (H17)
Participants' other motivation for keeping mould and damp at bay was the direct impact they have observed damp/mould have on their own or their family's health. This was both physical health, through chronic conditions such as asthma or chest problems, but also worsening mental health by increasing stress and anxiety.
This appeared to be linked with housing situation for segments G and H, with many participants from these two segments being renters and having to rely on their landlord to address the problem or find short-term fixes:
“The landlord wouldn't upgrade the heating so I had to treat it with anti mould spray." (H22)
The need for predictability: standing gas charges and unpredictable prices
Participants from segments B, C, E and G, in particular, mentioned the lack of predictable gas prices and standing charges as motivators for switching to an electric system. This was apparent in the description of the impact these have on participants' stress levels, and also the ability to manage their budget. As one participant put it:
"My direct debit doubled overnight with the recent increases. Suddenly I had less money for food, kids etc.” (C19)
For these participants, moving away from unpredictable gas prices was about removing the stress and mental load brought by expected rising costs:
“It would allow me to budget less and put towards other expenses and be able to put the heating on more often." (B24)
For these segments, but particularly for Segment E, standing gas prices were seen as 'unfair' (F2), with one participant even describing them as ‘criminal' (H4).
However, a few participants from segments C and E, but also B, D and F, also expressed scepticism towards the fact that electricity would be able to help make energy prices more predictable and/or less expensive. Participants commented on the high price of electricity standing charges, the high volatility of electricity prices, or the fact that electricity prices are currently much higher than gas prices.
Removing risks of gas leaks
One priority that appeared mostly for Segment H, but also segments G, B and E, was electric heating as a way to remove risks of gas leaks. The fear of gas leak for these participants was a powerful emotional driver, shaped by personal experience:
“When we recently had our gas service done they actually stopped us using it til someone had came out because it was leaking gas.” (H7)
But also, and mostly, by news stories in the media:
“I'm scared of that happening. I've seen gas accidents in the news where homes have blown up." (H3)
Approaches to preparatory upgrades
Participants were asked two questions specifically on whether they would be favourable, or not, to doing some preparatory upgrades before installing a new heating system.
I. Sometimes, to fit a more efficient heating system, you might need things like new pipes, radiators, windows, or extra insulation. How would you feel about making these kinds of preparatory changes to your home so a new heating system could be installed?
* [If favourable response] Would you want to make all the changes at once or do them gradually?[0-2 follow-up questions]
* [If unfavourable response] Why wouldn't you want to make them?
Favourable to upgrades, but...
Most participants expressed being favourable, in principle, to doing preparatory upgrades in order to install a new heating system. A majority of participants from each segment responded favourably, except for participants from Segment E, who had more mixed feelings about doing preparatory upgrades.
Conditional on cost and/or financial help
For segments B, C, D, E, F and H, this agreement in principle was, in practice, dependent on the upfront cost, or whether some sort of financial help (such as a grant or loan) would be available:
“Again, that comes down to money. I definitely need new windows and I'm sure upgrading everything would be welcomed in my home as it sure needs it, but cost would be the main factor here for me.” (C4)
Some have already started
Many participants expressed being favourable to doing such upgrades, and having already started, particularly segments F and H, but also A and D. The most mentioned upgrades included changing some radiators, installing underfloor heating, replacing the heating system and installing double glazing.
Others need assurance of 'return on investment'
Other participants, particularly from Segment B, mentioned ‘return on investment' as an important factor in their decision to make home upgrades. The idea of long-term benefits is important, as participants expect:
"Some sort of benefit financially to us, whether that's reduced energy bills significantly and or increases to the house price, that sort of thing.” (B8)
Gradual versus ‘all-at-once' changes
Out of those who responded favourably to doing preparatory upgrades, the majority expressed wanting to do them ‘all-at-once' rather than gradually. This was more mixed for Segment H.
One clear pattern emerging across segments, but for Segment H specifically, was the gap between what they'd ideally do, and the reality of their finances, highlighting that getting all changes done at once would be incompatible with the reality of their finance:
“So having everything done in one go would be optimal, but of course finances are what would likely prevent that and having to pay for the changes would be what would cause it to be bit by bit.” (H24)
While segments H and G are renters, participants from segment H in our sample mostly rent from local authorities or housing associations, who are used to rolling upgrade programmes gradually over a period of years. It is likely that the reality of their living situation also constrains their timeline for upgrades.
Another consideration when choosing to do these upgrades at once or gradually is the disruption to day-to-day life. While most participants agreed that doing all changes at once minimises disruption and the mental load of living with constant renovation, others thought a gradual approach would minimise logistical burdens, such as, for example, clearing spaces.
Barriers to upgrades
Cost
On the other hand, one of the reasons why participants were unfavourable to doing these changes was the fear that the changes wouldn't pay off. As participant D16 described:
“Horror! With no guarantee of same or better situation."
The upfront cost was particularly cited by participants A, B, C and E for not wanting to do these preparatory upgrades. Participants often stated that they simply cannot afford the upgrades and that they are too expensive.
Other participants cited the economic context and 'economic uncertainty' (A1) as a main barrier to undertaking expensive renovations.
Worried about disruption
For segments C and F in particular, but also segments A and H, the disruption caused by the upgrades was described as not worth the stress they bring. Participants expressed 'stress' (A8) ‘panic' (F6), and being filled with ‘dread' (C24) at the idea of such a 'massive upheaval' (A1) and ‘disruption' (F5).
Building rules wouldn't allow these changes
This barrier was particularly prominent for segments D, G and H, but for slightly different reasons. Segment D cited heritage constraints, such as living in a conservation area, as limiting their ability to do home upgrades. While some of these barriers are existing, other barriers cited were linked to perception of the heat pump technology not being efficient for the often older houses they live in, or needing quite a lot of financial investment to make it work with these types of houses.
For segments G and H, the specific building restrictions applied to their status as renters and their reliance on their landlord's permission:
"[...] more reluctant in a property that did not belong to me. If I had the buying of my landlord or landlady, I would then expect her to pay a portion of the cost because it's not my property. But for the future, I definitely would make all of these upgrades in a property that belonged to me.” (G28)
Uncertainty around future plans: moving house
For segments A and C particularly, the possibility of moving house in the near future was cited as a barrier to home upgrades, which reduced the appeal of making such a heavy financial investment:
"don't want to put that much money into our house with a view to moving and then having to do that again.” (A10)
Other barriers: trust in tradespeople, and current system works just fine
Other barriers touched on by a handful of participants were that their current system works just fine and they therefore saw no reason to change it. Some participants mentioned their worries about not being able to find reliable tradespeople as putting them off doing home upgrades in the future.
Valued opinions
Participants were asked one question specifically on whose opinions they usually value.
I. Who are the people in your life whose opinion you value when making decisions? Think about which family member, friends, neighbours – please don't tell us their full name, just their relationship to you [0-2 follow-up questions]
Ecosystem of trust
Inner circle: family and friends/neighbours
Across segments, the most valued opinion when making decisions is the partner/spouse. Most often, this is because participants' partners are impacted by the decision or have a say in how finances are spent across the household.
Another recurrent theme was valuing the opinion of older family members such as parents, in-laws, grandparents. Participants value their experience, their specific technical skills or their ability to see the bigger picture, and reported trusting their judgement in general.
Friends were also mentioned as a valued source of opinions, particularly for segments B and G, for three main reasons. The first one is that they reported having friends who are professional heating engineers, or in building trades. These are viewed as knowledgeable friends who would provide advice if needed.
Participants also mentioned valuing friends ‘who had had similar work done' (B17), and using friends as a filter to find reliable tradespeople, if needed, asking friends who have undergone home renovations themselves.
Trusting one's own judgement
Many participants across all segments, and particularly for segments E, G and H reported ultimately being the sole decision-maker for any home upgrade decision, for three main reasons.
For many participants, relying on their sole decision is a practical decision as they live by themselves. This was most prominent for segments G and H, but also occurred across segments.
Participants also report 'do[ing] quite a bit of research [themselves]' (G15), and trusting that research as the basis for their decision, often over somebody else's opinion.
Other participants, who live with their partners and children, reported having been put in the default position of doing research for household decisions:
“No one else - they leave admin to me.” (F16)
Participants were asked three questions specifically on what sources of information they use generally, and compared to sources of information for heating systems. They were also asked about sources of information they might be weary of or distrust.
I. Next I'd like to ask you questions about coming across new technology and learning more about it. New technology could be new objects to use in your home, in your social life, at work...
* When you first look into a new technology for your day-to-day use, who do you usually go for information? This could be...
* [Select (randomised order)]:
* Friends / neighbours
* A professional
* Government or council advice
* Celebrities
* Expert
* Google/search engines
* [1 follow-up question] Press them for specific professional, celebrity names, expert names etc and ask: Why?
* [2 follow-up questions] Find out where they look into a new technology specifically for heating: If you now think about looking into home heating specifically, do you look for information from the same sources or different ones? Which ones?
II. Can you tell me about any sources of information that you might trust less or have doubts about? [0-2 follow-up questions]
The search engine, the universal starting point
Most participants, across all segments, mentioned using a search engine as their first point of reference for both general and heating-specific information. This is often akin to a reflex for getting an immediate, big-picture understanding of a topic:
"I'd probably start with Google, just to kind of get an understanding of it myself before I speak to anybody else." (D20)
Participants viewed search engines as a gateway to credible sources of information, such as government websites, expert opinions, professionals' websites and other relevant websites.
The use of the search engine as the first point of reference was also supplemented by the use of AI-tools, most notably ChatGPT and Gemini. This was visible across segments, but particularly for segments G and H, who mentioned recently turning to these tools.
AI-tools were used by participants to 'point [them] in the right direction' (C24), either alongside using search engines or in place of, as first point of reference.
However, a handful of participants explicitly mentioned distrusting AI as a source of information, reporting the information provided as ‘often nonsensical' (A8), with 'frequent errors' (F6) and being suspicious at the lack of transparency about where the information comes from more generally. Some of these participants reported still being open to using AI tools, but wanting to exercise caution around its use by, for example, cross-referencing information provided.
The gold standards of experts: Which?, MoneySavingExpert
Which? and MoneySavingExpert (Martin Lewis) were cited by participants across segments as the two main authority figures for expert advice, except for Segment E. These sources are accessed by participants online, and the ‘ease of access' was also reported as a factor in choosing these sources over others.
Participants reported a high level of trust in these two sources, as they were perceived as independent, impartial, unbiased, or as 'not trying to sell something' (D3). As participant D7 put it:
“they've got no skin in the game, basically. They're not trying to sell business to you or convince you to get the work done. So their guidance, their knowledge is as unbiased as you can get.”
Participants also perceived these experts' interests as aligned with their own. Martin Lewis specifically, was repeatedly described as a figure who has people's interests at heart:
“I think Martin Lewis is a man of the people and wants to ensure everyone gets a fair deal." (B20)
These experts' reputation was also mentioned by participants across segments as being a factor of trust. Confidence around the way they research topics was expressed, and many participants mentioned having positive experiences of trusting their advice previously.
The importance of real-life experience: forums and friends/neighbours
Participants across segments, but particularly segments A and E, cited Reddit as a source of information for products or technology. Participants sometimes mentioned specific subreddits such as r/DIYuk, and r/Plumbing. They reported using Reddit, and other forums, for four main reasons.
Firstly, just like experts, participants reported trusting Reddit and other forums due to their lack of financial interest in selling or promoting a specific product:
“I know the content hasn't been paid for or sponsored, and it's usually objective and impartial.” (B21)
Secondly, forums were described as offering a wide range of different views, allowing participants to balance different information, understand pros and cons, and make their mind up.
Thirdly, the real-life experience aspects of forums, where 'real-life people' (H17) post their real-life experience and how it worked for them in practice, in their day-to-day life, was also highly valued by participants.
Finally, just like for using AI tools, a handful of participants reported the certainty of getting an answer to their question, no matter how specific that question is, as a pull-factor towards forums.
These reasons were shared equally for trust towards friends and neighbours.
Professionals are trusted, but segments are divided
Participants across segments reported trusting professionals, particularly segments C, D and E. Participants reported finding trusted professionals via different channels; already knowing a heating professional who had already done work for them, using friends and family for local recommendations, or using online directories such as Checkatrade or local Facebook groups, with positive online reviews, as a factor of trust.
Professionals were trusted by participants for their expert knowledge. This was usually mentioned as a given with their status of professionals, but participants sometimes mentioned accreditations such as Gas Safe or MCS, or other qualifications as additional proof of competency.
Participants also mentioned professionals' track records, and seeing their previous jobs as proof that they can be trusted. This was evident in both the good quality work that professionals had done for them personally, but also through online reviews.
Installers were also sometimes mentioned by participants, particularly from segments A, B and G, as distrusted sources of information due to the perception that installers ‘say what benefits them’ (A26) or as ‘recommend[ing] what they know rather than what is best’ (F24).
A few participants from Segment H, who are renters, also mentioned their lack of agency around heating systems and their landlord/housing association usually making the choice of professionals for them.
All segments expressed a suspicion and avoidance of social media as a source of information. Participants from segments A and D tended to completely avoid the use of social media for home or heating research, mentioning influencers and sponsored adverts as their main deterrent for avoiding social media.
Segments B, F and H mentioned avoiding influencers and adverts, but filtering through and still making good use of social media in certain situations. Some participants from Segment B reported trusting local Facebook groups for recommendations, while participants F and H mentioned avoiding some platforms like X, and/or browsing TikTok.
While participants from Segment G also cited social media as distrusted source of information, ‘ ignor[ing] all social media influencers’ (G23), and being realistic about the marketing aspects of these platforms, participants from segment G also mentioned social media as a useful source of ‘first hand experience’ (G18).
Videos and others
Participants from segments A, B and E were more likely to cite videos, and particularly YouTube, as a source of information. While participants from these segments reported using videos as independent product reviews, other participants reported looking at videos with ‘highest views and check[ing] out the comments to see if people have tried it.’ (E20), using them as filters of online comments for real-life experiences.
Other heating specific sources: energy companies and government advice
Most participants across segments report distrusting energy companies due to the perception that they have financial motives to sell specific products/technologies, or corporations focused on maximising profits. However, one factor that made participants trust energy companies was when an existing relationship, between energy companies and participants as their customer, existed, and was positive:
“There could definitely be companies or services and such that are biased or display information in a way that benefits themselves. I’m always sceptical of the people who stand to gain from your choices, however I’m with Octopus energy currently and they do seem to be a decent company I can trust.” (H24)
Participants expressed mixed trust about government advice. Participants from segments A, F and G generally displayed more positive or indifferent attitudes towards government, and their position as an unbiased authority.
Participants across segments, except for Segment F, reported checking government websites specifically to get an idea of what financial help they might be eligible for.
Some participants in segments C, D and E expressed negative attitudes towards the government or local authorities in general, and cited examples of mistakes made with cavity-wall insulation as reasons to turn away from their advice, a general perception of government as incompetent, or not qualified to provide advice around heating.
Attitudes to heat pumps
Participants were asked one question specifically on whether they would consider installing a heat pump, and the reasons why.
- Would you consider installing a heat pump to heat your home? Please tell us why’ [0-1 follow-up questions]
Attitudes towards heat pumps
Most participants said that they would switch to a heat pump as their new heating system, in principle. This was particularly apparent for segments A, B, F and G, where a majority of participants said they would switch to a heat pump. Opinions were more mixed for segments E and H. A majority of participants from segments C and D said that they would not switch to a heat pump in principle.
A conditional switch
The majority of participants who mentioned being open to switching to a heat pump in practice mentioned still lacking the necessary information to act on this. This was especially present for participants from segments B, D, F, and G. The information needs mentioned by participants were varied, but were mostly around costs, specifically what the return on investment or payback period would be after getting a heat pump.
Needing more information around the installation was mentioned, such as a clear picture of all upfront costs for installation and other preparatory upgrades, as well as knowing exactly ‘what work is required to install them and how much disruption it would cause’ (D22).
Other information mentioned included like-for-like comparisons for running costs with ‘reliable bills predictions’ (C21) but also assurances that the heat provided by the system would be enough to make participants’ homes feel warm.
Participants expressed clear knowledge gaps around the day-to-day running of a heat pump particularly on noise, aesthetics and whether ‘it would work well in [their] home’ (H9), and many wanted to see real-life evidence of heat pumps working in practice.
Other participants mentioned lacking basic knowledge of heat pumps, around what it does and how it works more generally.
Most interestingly, some participants from segments A and G, who indicated being open to switching in principle, still expressed apprehension around the technology and its ability to work efficiently in their home. They also expressed apprehension around the noise they make. This apprehension was sometimes shaped by ‘horror stories of them not working that well’ (A2), or general reticence of being an early adopter and wanting to ‘be in the second wave after the initial problems [are] ironed out’ (G10).
Many participants, particularly from segments B and E, who expressed being favourable to switching to a heat pump in practice, mentioned the cost as being the primary barrier preventing them to act. As well as a guarantee of either ‘price parity with gas’ (B15) or lower running costs, participants mentioned a reduction in upfront costs via either grants, or interest-free ‘finance options’ (B6):
“if I could afford it or if I had a grant towards it that was substantial by the government.” (D23)
More communication is clearly needed around these areas to maximise heat pump adoption among those interested, and motivated, audiences.
The environment and cost as main motivations for switching
The most common motivations for being favourable to switching to heat pumps were cost and environmental reasons.
Participants, particularly from segments A and G, perceived the switch to an electric system as a potential money saving solution, particularly in the long term.
Many participants, mostly from Segment A, also viewed switching to an electric system as a way to lower their carbon footprint, and be generally more environmentally friendly.
A few participants who mentioned already having solar panels, viewed a heat pump as the logical next step in their home upgrade journey:
“We already have solar panels. So this was also a key driver for us to consider a heat pump." (G23)
Some participants who expressed being favourable in practice, particularly from segments B, D and G, mentioned that they would look into a heat pump as an alternative to their current heating system when the time comes for it to be replaced.
Perceived barriers to heat pump adoptions
The main barrier cited by participants, across all segments, but particularly for segments C, F and H, is the cost involved. These included the initial costs, and also included the added costs linked to preparatory upgrades, described as being an active blocker in getting a heat pump. Participant G23 mentioned that they had started the process of getting a heat pump, but had to pull out due to these costs:
“However the last survey revealed that we’d need [to] change all the pipes in our heating system. As well as the upheaval to our flooring this would result in substantially more costs"
The last aspect of costs mentioned by participants was the anticipation that using electricity would result in higher running costs than using oil or gas, described as a ‘lack of incentive to swap over at the moment’ (E17).
After cost, a distrust towards the technology was apparent in participants who expressed being unfavourable to switching. This was particularly apparent for participants from Segment D, but was also present for segments C and E.
For participants from Segment D, this distrust translated into the belief that the technology would only work in well insulated, newer houses, and wouldn’t be suitable for their houses which were older, detached, sometimes converted, or in conservation areas.
This belief was also present for segments C and E, and reinforced by what ‘everything [they]’ve seen says about them’ (D1), both from friends and local tradespeople:
“I have a friend with one and it’s notoriously unreliable and has broken down many times leaving her with no heating” (C5)
The other barriers mentioned by participants as blockers to switching to a heat pump were the fact that their current heating system worked well (mostly from segments B, D, G and H), lack of knowledge about them (mostly from segments B and G), and the installation being perceived as too big a disruption (mostly from segments A and D).
Enablers for the switch
Without surprises, the three most cited enablers by participants were financial assistance, better long-term visibility in terms of running costs, and increased confidence in the technology.
Financial assistance included grants towards the initial upfront costs or interest-free loans, or a drop in the price of heat pumps altogether. This was mostly brought up by segments A and C. Renters among segments E and G raised help towards costs from their landlords or housing association as an enablers for the switch.
Participants from segments B, F and G emphasised long-term visibility around running costs and electricity price as an essential element to help them make the switch, and wanted certainty that running costs would align with their current heating system.
Participants across segments, and particularly from segments A and H, mentioned needing to have more confidence in the technology before making the switch. This included ‘having more information’ (D15) in general, ‘seeing [heat pumps] well adopted’ (E16) first, or seeing heat pumps in action in ‘similar homes in [their] part of the world’ (F4).
Conclusion
Across all eight segments, the expectations of a home heating system are universal: it must be affordable, reliable and keep the family comfortably warm. However, the ongoing cost-of-living crisis has heavily impacted how consumers view their energy use, making cost the primary driver of decision-making.
While there is a general openness to adopting heat pumps and electric heating, this research highlights a significant gap between interest in principle and practical adoption. To successfully encourage the transition, future communications and strategies must address the following core realities.
The desire for self-sufficiency is the strongest motivator
When participants imagine the benefits of moving away from gas, their greatest aspiration is energy independence. Driven by the consequences of recent geopolitical price spikes and a distaste for energy companies’ power on prices and standing charges, consumers are highly attracted to the idea of a self-sufficient ecosystem (with solar, batteries and a heat pump).
The ability to both heat and cool the home is emerging as a surprisingly strong secondary motivator
As British summers become increasingly uncomfortable, participants report strong negative emotions associated with this feeling of discomfort, the inefficient strategies that they have already adopted and the strong need to protect their families.
Cost and disruption are paralysing barriers
Despite the appeal of greener technology, the upfront cost of heat pumps and the necessary preparatory upgrades (new pipes, radiators, insulation) are viewed as hurdles for most. The fear of upheaval creates strong negative emotions among participants. In the event of being favourable to the preparatory upgrades, there is a strong consensus that participants would prefer to ‘bite the bullet’ and do them all at once to minimise the duration of the upheaval, but this preference is managed by the practicalities of participants’ finances, which would force them towards gradual upgrades.
A severe lack of 'real-world' confidence
Participants are currently suffering from an information gap regarding heat pumps. Anecdotal horror stories of homes being left freezing cold, or tradespeople actively advising against the technology, have seeded a distrust in heat pump performance, particularly for those in older or rural properties. Participants are asking for proof that a heat pump will actually keep their specific type of house warm, and not cost more to heat than their current heating system.
The 'ecosystem of trust' relies on independence
When participants research new heating technology, they actively reject anyone they perceive as having a financial interest in products they are selling. Adverts, influencers and often energy companies are dismissed as being profit-driven and not having participants’ best interests at heart.
Instead, the current research journey follows a clear path:
- it starts with a broad Google search, increasingly supplemented by AI tools, to gather initial facts
- then, it looks to independent consumer champions (like Martin Lewis/MoneySavingExpert and Which?) for unbiased pros and cons analysis
- it seeks peer-to-peer validation via Reddit, local Facebook groups, or trusted tradespeople friends to find out what it is actually like to live with the technology.
The path forward
To move consumers from ‘favourable in principle’ to ‘installing’, message development must focus heavily on transparency and proof. It is not enough to promote the environmental benefits as carbon reduction is a secondary concern limited by financial constraints across all segments.
Instead, successful messaging must:
- provide clear financial visibility: show transparent return on investment (ROI) calculations, guarantee long-term running costs against gas, tariffs available, and clearly highlight substantial grants or low cost financing
- leverage peer proof: use case studies and video testimonials of heat pumps working effectively in similar homes to break the ‘cold house’, noisy, ‘needs tonnes of space’ myths
- use trusted messengers: align messaging with independent consumer advocates, local tradespeople or friends, rather than politicians, environmental activities or governmental actors.
Appendix
Priorities for current heating system
Number of participants, per segment, mentioning each theme
| Theme |
Eco high-earning Gen Xers (A) |
Techie young families (B) |
Budget-conscious millennial parents (C) |
Rural retirees on stable income (D) |
Homeowners eligible for free heat pumps (E) |
Tech-cautious soon retirees (F) |
Young, eco-friendly, urban renters (G) |
Social tenants on tight budgets (H) |
Total |
| Having latest future-proof tech |
2 |
1 |
2 |
4 |
2 |
2 |
5 |
2 |
20 |
| Keeping energy bills low |
24 |
24 |
26 |
22 |
23 |
20 |
27 |
24 |
190 |
| Keeping house warm and comfy |
23 |
23 |
26 |
20 |
22 |
19 |
24 |
22 |
179 |
| Other |
1 |
2 |
5 |
1 |
5 |
1 |
1 |
2 |
18 |
| Reducing carbon footprint |
14 |
11 |
6 |
8 |
5 |
2 |
11 |
6 |
63 |
| Reliable heating system |
20 |
23 |
17 |
20 |
12 |
16 |
20 |
19 |
147 |
| Total (unique participants) |
25 |
25 |
26 |
23 |
23 |
24 |
28 |
24 |
198 |
Number of references to each theme, made by each segment
| Theme |
Eco high-earning Gen Xers (A) |
Techie young families (B) |
Budget-conscious millennial parents (C) |
Rural retirees on stable income (D) |
Homeowners eligible for free heat pumps (E) |
Tech-cautious soon retirees (F) |
Young, eco-friendly, urban renters (G) |
Social tenants on tight budgets (H) |
Total |
| Having latest future-proof tech |
3 |
1 |
3 |
4 |
2 |
2 |
6 |
2 |
23 |
| Keeping energy bills low |
52 |
79 |
70 |
52 |
57 |
49 |
62 |
59 |
480 |
| Keeping house warm and comfy |
46 |
45 |
48 |
47 |
50 |
37 |
52 |
50 |
375 |
| Other |
1 |
3 |
7 |
1 |
6 |
2 |
1 |
2 |
23 |
| Reducing carbon footprint |
23 |
20 |
9 |
17 |
7 |
3 |
16 |
11 |
106 |
| Reliable heating system |
33 |
44 |
33 |
36 |
29 |
30 |
29 |
30 |
264 |
| Total References |
158 |
192 |
170 |
157 |
151 |
123 |
166 |
154 |
1,271 |
Priorities for switch to electric
Number of participants, per segment, mentioning each theme
| Theme |
Eco high-earning Gen Xers (A) |
Techie young families (B) |
Budget-conscious millennial parents (C) |
Rural retirees on stable income (D) |
Homeowners eligible for free heat pumps (E) |
Tech-cautious soon retirees (F) |
Young, eco-friendly, urban renters (G) |
Social tenants on tight budgets (H) |
Total |
| Both cool and heat my house |
7 |
6 |
9 |
1 |
5 |
8 |
7 |
3 |
46 |
| Improved air quality |
1 |
2 |
0 |
0 |
0 |
0 |
1 |
1 |
5 |
| No standing gas charge |
2 |
3 |
4 |
0 |
6 |
2 |
4 |
2 |
23 |
| No unpredictable gas price |
3 |
6 |
7 |
1 |
2 |
1 |
2 |
2 |
24 |
| Other |
1 |
1 |
1 |
0 |
4 |
2 |
0 |
1 |
10 |
| Preventing damp and mould |
2 |
3 |
3 |
6 |
3 |
1 |
6 |
5 |
29 |
| Remove risks of gas leaks |
1 |
3 |
0 |
0 |
3 |
0 |
3 |
6 |
16 |
| Same comfortable temperature |
4 |
4 |
3 |
3 |
6 |
3 |
1 |
5 |
29 |
| Self-sufficiency |
10 |
8 |
7 |
15 |
8 |
7 |
6 |
4 |
65 |
| Total (unique participants) |
25 |
25 |
26 |
23 |
23 |
24 |
28 |
24 |
198 |
Number of references to each theme, made by each segment
| Theme |
Eco high-earning Gen Xers (A) |
Techie young families (B) |
Budget-conscious millennial parents (C) |
Rural retirees on stable income (D) |
Homeowners eligible for free heat pumps (E) |
Tech-cautious soon retirees (F) |
Young, eco-friendly, urban renters (G) |
Social tenants on tight budgets (H) |
Total |
| Both cool and heat my house |
19 |
8 |
13 |
1 |
10 |
15 |
10 |
8 |
84 |
| Improved air quality |
5 |
2 |
0 |
0 |
0 |
0 |
2 |
2 |
11 |
| No standing gas charge |
4 |
4 |
5 |
0 |
10 |
5 |
10 |
2 |
40 |
| No unpredictable gas price |
6 |
14 |
10 |
2 |
2 |
3 |
3 |
3 |
43 |
| Other |
1 |
1 |
1 |
0 |
5 |
2 |
0 |
2 |
12 |
| Preventing damp and mould |
4 |
7 |
6 |
9 |
5 |
1 |
8 |
7 |
47 |
| Remove risks of gas leaks |
1 |
3 |
0 |
0 |
3 |
0 |
6 |
11 |
24 |
| Same comfortable temperature |
4 |
7 |
5 |
4 |
6 |
5 |
1 |
9 |
41 |
| Self-sufficiency |
18 |
21 |
19 |
39 |
18 |
13 |
10 |
11 |
149 |
| Total References |
62 |
67 |
59 |
55 |
59 |
44 |
50 |
55 |
451 |
Approaches to preparatory upgrades
Number of participants, per segment, mentioning each theme
| Attitude |
Eco high-earning Gen Xers (A) |
Techie young families (B) |
Budget-conscious millennial parents (C) |
Rural retirees on stable income (D) |
Homeowners eligible for free heat pumps (E) |
Tech-cautious soon retirees (F) |
Young, eco-friendly, urban renters (G) |
Social tenants on tight budgets (H) |
Total |
| Favourable |
15 |
17 |
17 |
14 |
11 |
14 |
19 |
16 |
123 |
| Unfavourable |
10 |
8 |
12 |
11 |
13 |
7 |
10 |
9 |
80 |
Note: some participants expressed mixed feelings, and have been coded under both favourable and unfavourable attitudes. This explains the total number being higher than 198.
Number of participants, per segment, who responded favourably to doing preparatory upgrades, and their preferences for doing the changes 'all in one go' or 'gradually'
| Preference |
Eco high-earning Gen Xers (A) |
Techie young families (B) |
Budget-conscious millennial parents (C) |
Rural retirees on stable income (D) |
Homeowners eligible for free heat pumps (E) |
Tech-cautious soon retirees (F) |
Young, eco-friendly, urban renters (G) |
Social tenants on tight budgets (H) |
Total |
| All changes at once |
10 |
14 |
12 |
9 |
8 |
9 |
16 |
11 |
89 |
| Gradual changes |
5 |
4 |
5 |
4 |
3 |
4 |
4 |
7 |
36 |
Note: some participants expressed mixed feelings, and have been coded under both all changes at once and gradual changes. This explains the total number being higher than 123.
Number of references to each theme, made by each segment
| References |
Eco high-earning Gen Xers (A) |
Techie young families (B) |
Budget-conscious millennial parents (C) |
Rural retirees on stable income (D) |
Homeowners eligible for free heat pumps (E) |
Tech-cautious soon retirees (F) |
Young, eco-friendly, urban renters (G) |
Social tenants on tight budgets (H) |
Total |
| Favourable |
18 |
22 |
18 |
14 |
12 |
15 |
22 |
17 |
138 |
| Unfavourable |
26 |
15 |
19 |
17 |
24 |
10 |
12 |
13 |
136 |
Valued opinions
Number of participants, per segment, mentioning each theme
| Theme |
Eco high-earning Gen Xers (A) |
Techie young families (B) |
Budget-conscious millennial parents (C) |
Rural retirees on stable income (D) |
Homeowners eligible for free heat pumps (E) |
Tech-cautious soon retirees (F) |
Young, eco-friendly, urban renters (G) |
Social tenants on tight budgets (H) |
Total |
| AI sources |
0 |
2 |
0 |
0 |
0 |
1 |
0 |
0 |
3 |
| Experts and/or scientists |
3 |
3 |
3 |
4 |
2 |
0 |
8 |
4 |
27 |
| Family member |
18 |
22 |
24 |
17 |
16 |
13 |
19 |
18 |
147 |
| Friend |
6 |
11 |
2 |
2 |
7 |
5 |
10 |
5 |
48 |
| Neighbour |
1 |
1 |
1 |
3 |
0 |
2 |
2 |
3 |
13 |
| Own judgement |
6 |
4 |
2 |
5 |
8 |
7 |
8 |
8 |
48 |
| Social media |
0 |
0 |
0 |
1 |
0 |
1 |
1 |
3 |
6 |
Number of participants, per segment, who responded favourably to doing preparatory upgrades, and their preferences for doing the changes 'all in one go' or 'gradually'
| Theme |
Eco high-earning Gen Xers (A) |
Techie young families (B) |
Budget-conscious millennial parents (C) |
Rural retirees on stable income (D) |
Homeowners eligible for free heat pumps (E) |
Tech-cautious soon retirees (F) |
Young, eco-friendly, urban renters (G) |
Social tenants on tight budgets (H) |
Total |
| AI sources |
0 |
2 |
0 |
0 |
0 |
2 |
0 |
0 |
4 |
| Experts and/or scientists |
4 |
4 |
3 |
6 |
2 |
0 |
8 |
5 |
32 |
| Family member |
30 |
29 |
40 |
23 |
22 |
20 |
27 |
23 |
214 |
| Friend |
7 |
14 |
2 |
2 |
9 |
6 |
12 |
7 |
59 |
| Neighbour |
1 |
1 |
1 |
3 |
0 |
5 |
2 |
3 |
16 |
| Own judgement |
7 |
4 |
2 |
5 |
9 |
7 |
8 |
8 |
50 |
| Social media |
0 |
0 |
0 |
1 |
0 |
1 |
1 |
3 |
6 |
Number of participants, per segment, mentioning each theme
| Theme |
Eco high-earning Gen Xers (A) |
Techie young families (B) |
Budget-conscious millennial parents (C) |
Rural retirees on stable income (D) |
Homeowners eligible for free heat pumps (E) |
Tech-cautious soon retirees (F) |
Young, eco-friendly, urban renters (G) |
Social tenants on tight budgets (H) |
Total |
| Celebrities |
2 |
2 |
0 |
1 |
0 |
0 |
1 |
1 |
7 |
| Expert |
9 |
8 |
9 |
7 |
4 |
3 |
9 |
5 |
54 |
| Family |
2 |
5 |
8 |
3 |
2 |
3 |
3 |
5 |
31 |
| Friend, neighbour |
10 |
14 |
10 |
7 |
8 |
7 |
8 |
7 |
71 |
| General google search |
19 |
20 |
20 |
23 |
16 |
15 |
19 |
21 |
153 |
| Government/ council |
9 |
6 |
4 |
6 |
7 |
2 |
6 |
5 |
45 |
| Other |
0 |
1 |
0 |
1 |
1 |
1 |
0 |
0 |
4 |
| Professional |
7 |
7 |
13 |
10 |
8 |
5 |
8 |
7 |
65 |
| Specific websites |
16 |
19 |
18 |
15 |
17 |
11 |
18 |
16 |
130 |
| Variety of different sources |
4 |
1 |
0 |
1 |
0 |
2 |
0 |
3 |
11 |
Number of references to each theme, made by each segment
| Theme |
Eco high-earning Gen Xers (A) |
Techie young families (B) |
Budget-conscious millennial parents (C) |
Rural retirees on stable income (D) |
Homeowners eligible for free heat pumps (E) |
Tech-cautious soon retirees (F) |
Young, eco-friendly, urban renters (G) |
Social tenants on tight budgets (H) |
Total |
| Celebrities |
2 |
2 |
0 |
1 |
0 |
0 |
1 |
1 |
7 |
| Expert |
11 |
11 |
11 |
8 |
4 |
3 |
10 |
6 |
64 |
| Family |
2 |
8 |
9 |
3 |
2 |
4 |
3 |
6 |
37 |
| Friend, neighbour |
13 |
19 |
12 |
13 |
11 |
8 |
9 |
9 |
94 |
| General google search |
20 |
24 |
22 |
28 |
19 |
19 |
24 |
26 |
182 |
| Government/ council |
12 |
8 |
5 |
7 |
8 |
2 |
7 |
6 |
55 |
| Other |
0 |
1 |
0 |
1 |
1 |
1 |
0 |
0 |
4 |
| Professional |
8 |
9 |
21 |
13 |
13 |
6 |
9 |
8 |
87 |
| Specific websites |
39 |
38 |
27 |
29 |
26 |
16 |
33 |
28 |
236 |
| Variety of different sources |
4 |
2 |
0 |
2 |
0 |
3 |
0 |
4 |
15 |
Number of participants, per segment, and the specific websites they mentioned
| Theme |
Eco high-earning Gen Xers (A) |
Techie young families (B) |
Budget-conscious millennial parents (C) |
Rural retirees on stable income (D) |
Homeowners eligible for free heat pumps (E) |
Tech-cautious soon retirees (F) |
Young, eco-friendly, urban renters (G) |
Social tenants on tight budgets (H) |
Total |
| AI tools (eg ChatGPT) |
4 |
4 |
2 |
4 |
2 |
3 |
7 |
7 |
33 |
| Comparison/ review sites (Which?, Trustpilot, Checkatrade) |
11 |
13 |
9 |
9 |
3 |
5 |
6 |
6 |
62 |
| Forums / social media |
10 |
4 |
1 |
0 |
8 |
3 |
3 |
4 |
33 |
| Money saving sites (MoneySaving Expert) |
3 |
6 |
5 |
2 |
3 |
2 |
3 |
2 |
26 |
| News sites (The Guardian, The Times) |
3 |
2 |
0 |
4 |
1 |
0 |
3 |
0 |
13 |
| Retailers' websites (Amazon, Currys) |
2 |
0 |
3 |
4 |
1 |
0 |
0 |
3 |
13 |
| Social media (TikTok, Instagram) |
0 |
0 |
0 |
0 |
0 |
1 |
4 |
1 |
6 |
| Tech-specific sites (Techradar, Wired) |
2 |
0 |
1 |
1 |
1 |
1 |
3 |
2 |
11 |
| Videos, YouTube |
6 |
5 |
4 |
1 |
5 |
3 |
2 |
3 |
29 |
| Wikipedia |
0 |
0 |
0 |
0 |
0 |
0 |
0 |
1 |
1 |
Attitudes to heat pump
Number of participants, per segment, who said they would or wouldn't switch to a heat pump
| Theme |
Eco high-earning Gen Xers (A) |
Techie young families (B) |
Budget-conscious millennial parents (C) |
Rural retirees on stable income (D) |
Homeowners eligible for free heat pumps (E) |
Tech-cautious soon retirees (F) |
Young, eco-friendly, urban renters (G) |
Social tenants on tight budgets (H) |
Total |
| Would switch |
17 |
15 |
10 |
10 |
12 |
10 |
17 |
10 |
101 |
| Wouldn't switch |
9 |
9 |
16 |
12 |
11 |
7 |
9 |
11 |
84 |
Number of participants, per segment, and the specific barriers they mention for not switching to a heat pump
| Barrier/factor against switching |
Eco high-earning Gen Xers (A) |
Techie young families (B) |
Budget-conscious millennial parents (C) |
Rural retirees on stable income (D) |
Homeowners eligible for free heat pumps (E) |
Tech-cautious soon retirees (F) |
Young, eco-friendly, urban renters (G) |
Social tenants on tight budgets (H) |
Total |
| Cost |
6 |
4 |
9 |
6 |
4 |
2 |
2 |
7 |
40 |
| Distrust the technology |
3 |
2 |
5 |
9 |
5 |
4 |
1 |
3 |
32 |
| Current system works fine |
1 |
4 |
2 |
2 |
2 |
0 |
4 |
4 |
19 |
| Installation challenges/too many upgrades required |
4 |
0 |
2 |
4 |
3 |
1 |
3 |
1 |
18 |
| Lack of knowledge |
2 |
4 |
3 |
0 |
2 |
0 |
2 |
2 |
15 |
| Lack of space |
4 |
0 |
4 |
1 |
4 |
0 |
1 |
1 |
15 |
| Not aesthetic |
0 |
0 |
0 |
1 |
0 |
0 |
0 |
0 |
1 |
Number of participants, per segment, and the enablers to switching to a heat pump
| Enabler/ condition for switching |
Eco high-earning Gen Xers (A) |
Techie young families (B) |
Budget-conscious millennial parents (C) |
Rural retirees on stable income (D) |
Homeowners eligible for free heat pumps (E) |
Tech-cautious soon retirees (F) |
Young, eco-friendly, urban renters (G) |
Social tenants on tight budgets (H) |
Total |
| Better long-term visibility with price comparison (ROI, running costs) |
6 |
8 |
6 |
4 |
7 |
8 |
10 |
6 |
55 |
| Financial assistance (grants, subsidies, lower upfront costs) |
10 |
4 |
12 |
4 |
4 |
5 |
6 |
8 |
53 |
| More confidence in the tech (proof it works, real-world reviews, guarantees) |
7 |
6 |
7 |
7 |
7 |
5 |
7 |
7 |
53 |
| Reduced installation requirements (less disruption, no need to rip up floors/pipes) |
4 |
0 |
3 |
2 |
1 |
0 |
5 |
0 |
15 |
| Trustworthy installer |
0 |
0 |
1 |
0 |
0 |
0 |
0 |
1 |
2 |