About Nesta
Nesta is an innovation foundation. For us, innovation means turning bold ideas into reality and changing lives for the better.
We use our expertise, skills and funding in areas where there are big challenges facing society.
Nesta is based in the UK and supported by a financial endowment. We work with partners around the globe to bring bold ideas to life to change the world for good.
To find out more, visit www.nesta.org.uk
If you'd like this publication in an alternative format, such as Braille or large print, please contact us at: [email protected].
About J.P. Morgan
This project is supported by J.P. Morgan as part of their $350 million, five-year global commitment to prepare people around the world for the future of work. This commitment will focus on creating economic mobility and career pathways for underserved populations and the firm's employees, by collaborating with educational and research institutions to forecast emerging skillsets in the financial services industry and enable new training programs to prepare the firm's workforce for changes in technology and business.
While this report has been supported by J.P. Morgan, the contents and opinions in this paper are those of the authors alone and do not reflect the views of the J.P. Morgan Chase Foundation, J.P. Morgan Chase & Co. or any of its affiliates.
Suggested reference
Kanders K., Djumalieva, J., Sleeman, C. and Orlik, J. (2020). Mapping Career Causeways: Supporting workers at risk. London: Nesta.
Report designed by Sam Walter, Festoon Studios and illustrated by Kirstin Smith
ISBN: 978-1-913095-28-4
Acknowledgements
We are grateful for the support of J.P. Morgan. We thank participants in two early workshops for their advice and contributions. We are greatly indebted to Genna Barnett who managed the project. We would also like to thank Madeleine Gabriel, Damian Hebron and George Richardson for their generous support and valuable comments on the findings.
Carrying out the data analysis for this report would not have been possible without the availability of high-quality, open-source and free-to-use quantitative computing tools. This report made use of many libraries and packages from the Python scientific computing ecosystem, particularly pandas, NumPy, SciPy, Matplotlib, Seaborn, scikit-learn, igraph, leidenalg. We thank all of the maintainers, contributors and supporters of these projects and others.
About the authors
This report is part of Nesta's Open Jobs programme. Open Jobs is an initiative to help individuals, organisations and governments make more informed labour market decisions. We believe that we can improve social mobility, address skills gaps and enhance productivity by mobilising labour market data from a variety of sources.
Karlis Kanders, Data Scientist
Jyldyz Djumalieva, Head of Open Jobs
Cath Sleeman, Head of Data Visualisation
Jack Orlik, Programme Manager
Foreword
The COVID-19 pandemic has wreaked havoc with labour markets, and risks causing widespread worker displacement in the worst affected sectors. This disruption has thrown into sharp relief the lack of timely and detailed careers advice for workers. This report aims to fill that information gap by providing a 'map of the labour market'. The map captures the similarities between over 1,600 occupations, based on the skills and tasks that make up each role.
Using the map, we can identify a set of jobs that require similar skills and activities to a worker's most recent role, demonstrating the transferability of their skillset. The algorithm behind the map can also pinpoint the skills that a worker may need in order to move into a new role. In addition, we can isolate the most effective skills for expanding a worker's job options, both for an individual worker or for a group of workers within a particular sector.
This report focuses on the impact of automation and it shows how the map and underlying algorithm might help workers transition into jobs that are less exposed to this risk. The current backdrop of rising unemployment only increases the need for tools that can aid worker resilience. Moreover, the pandemic may compound the impact of automation as it speeds up the adoption of technologies that replace face-to-face tasks.
Estimating automation risk is extremely challenging and the report focuses on one component of this risk, which is the suitability of tasks for machine learning. Suitability for machine learning is a necessary, but not sufficient, condition for automation - legal, cultural, financial and organisational barriers may prevent or slow the automation process. Nevertheless, this exercise demonstrates that a shock's impact depends not just on its effect on each individual job, but on how easily workers can move between jobs to escape the shock. In the case of automation, the map shows that jobs requiring similar skills tend to face similar levels of risk, and so displaced workers may find it particularly difficult to enter lower-risk roles.
Just like a topographic map, this first map of the labour market will need further revision. Over the next year, the transition pathways will be validated and trialed with partners. Although the map is a work in progress, we hope that it will ultimately help workers to navigate the ever-changing labour market with greater confidence and resilience.
Conceptual illustration of a sailboat with 'CORE SKILLS' written on its sail, representing the foundational skills needed for career pathways.
Executive summary
Automation is changing the landscape of work. To date, the automation literature has focused on identifying the occupations that are at greatest risk. Yet the impact of automation will also depend on how easily workers can move within the labour market and transition to safer occupations. Their ability to transition will depend in large part on their skills sets.
As economies look to recover from COVID-19, understanding automation risk is more important than ever. For a start, the pandemic will likely accelerate the pace of labour-displacing automation.¹ In addition, given the cataclysmic impact of the virus and its fallout on many industries, it is likely that millions of workers across Europe will need to retrain for new roles. Focusing on occupations at lower risk of automation will be a better investment for individuals and economies more widely.
Our research reveals that some workers will find it much harder than others to escape the rising tide of automation. There are two reasons for this: their skills are required in fewer jobs, and the jobs in which they could use their skills face a similarly high risk of automation. These at-risk workers, who predominantly work in sales, customer service and clerical roles, will require more retraining to find an occupation that is at lower risk.
By analysing how similar occupations are to one another in terms of their skills requirements and typical work characteristics, we may be able to advise workers whose jobs are at high risk of automation as to how they might transition to a range of lower-risk jobs. We call these 'career causeways' – pathways that workers can follow to find jobs with better long-term prospects as the tide of automation engulfs a wide range of occupations.
The narrow aim of this report is to provide practical recommendations for lowering workers' exposure to automation risk. The broader aim is to present a methodology for measuring the resilience of workers to economic shocks, of which automation is just one example. This work furthers Nesta's mission, detailed in Precarious to Prepared,² of empowering workers to navigate their way through the labour market. The project is supported by J.P. Morgan as part of its New Skills at Work initiative.³
Conceptual illustration of an island with career pathways, representing the landscape of work and job transitions.
A new system for supporting job transitions
We analysed more than 1,600 jobs, carrying out three key steps (see Figure 1, page 8):
1 Measuring automation risk
We used the results of a study from the United States (US) which rated thousands of tasks that make up US occupations on their suitability for automation.⁴ Their results captured whether it is technically feasible to automate the tasks by using machine learning. We translated this to a European context by matching each US occupation to a European occupation, as defined in the European multilingual classification of Skills, Competences, Qualifications and Occupations (ESCO). It is important to emphasise that these automation risk estimates are not direct predictions about the likelihood of jobs being automated away, as that will be additionally influenced by other - legal, cultural, financial and organisational - factors. Instead, they point towards areas of work that may experience the largest changes due to advances in machine learning.
2 Identifying at-risk workers
To identify the characteristics of at-risk workers, we focused on three European countries: the United Kingdom (UK), France and Italy. We built up a picture of the workers (including their gender mix, income and education levels) and their working patterns (i.e. full time or part time) using microdata from the European Union Labour Force Survey.
3 Recommending job transitions
For each occupation at high risk of automation, we identified alternative occupations that are similar and into which a worker could potentially transition. We measured 'similarity' between pairs of occupations by comparing the essential and optional skills required to perform each job, the particular work activities, the interpersonal, physical and structural work characteristics, and the typical required levels of education and experience. Those jobs that are sufficiently similar are deemed 'viable transitions' for the at-risk worker. The subset of these occupations that offer comparable or higher levels of pay is called 'desirable transitions'. Finally, an even smaller subset that we call 'safe and desirable transitions' will reduce workers' exposure to automation.
We recognise that the feasibility of transitioning from one occupation to another depends on numerous other factors, including the location of the job opportunity, access to transportation, employer and recruiter attitudes, and of course other labour market shocks, such as COVID-19. However, our analysis is the first step towards building a detailed career recommendation system, into which we will accommodate more factors over time.
This analysis allows us to pinpoint workers who may struggle to escape automation risk. We also identify a core group of skills that can broaden the transition options for workers. In carrying out this analysis, we aim to further the automation debate and provide practical steps for at-risk workers to reduce their exposure to automation risk. To the best of our knowledge, this work presents the most detailed fully open framework for supporting transitions out of occupations at risk of automation. While more validation is required, we see huge potential for this type of granular analysis to provide tailored skill and job recommendations for workers wishing to improve their long-term prospects for employment.
Figure 1. A system for supporting job transitions for workers at risk of automation
This diagram illustrates a three-step system for supporting job transitions for workers at risk of automation:
- Measuring automation risk:
- Task automation scores ('Suitability for machine learning' for 18,000 tasks)
- Translated to European occupations: O*NET database (900+ occupations) crosswalked to ESCO occupations (1,627 occupations).
- Outputs: High automation risk (high average automatability across all job tasks) and Few bottleneck tasks (low prevalence of difficult-to-automate tasks in a job). This leads to identifying "High-risk occupations".
- Identifying at-risk workers:
- Uses EU Labour Force Survey data for UK, France, and Italy.
- Outputs: Geography and demographics of automation.
- Recommending job transitions:
- Uses combined occupational data from ESCO and O*NET.
- Steps:
- Identify safe and desirable transitions by comparing occupations using data science and machine learning.
- Select destinations with a good fit in terms of skills, work activities, context, and education and experience levels.
- Select destinations that incur a limited loss of earnings.
- Select destinations with a lower automation risk.
- This leads to "Transitions to more secure jobs".
- Also involves "Skills analysis" to identify "Core skills that expand workers' options" and "Identification of skills gaps".
Key findings
1 Retail and customer service roles and administrative and business clerks are at greatest risk of automation
Compared to other jobs, these occupations not only have an overall higher risk of automation but they also have fewer tasks that are difficult to automate and that would otherwise impede the automation process.
2 Automation risk is higher when jobs have predictable environments and involve routine interactions
We find that automation risk is raised by activities such as interacting with computers, one-way routine interactions with people, monitoring resources and analysing data. Conversely, the risk of automation is lowered by activities that require non-routine engagement with the public, knowledge building, resolving conflicts and negotiating and, more broadly, any activities that involve operating in dynamic, uncontrolled environments.
The need for physical effort and high levels of dexterity also protects a number of tasks from automation. This means, for example, that many jobs in construction and manufacturing are currently at relatively low risk of automation. However, if there is a leap forward in robotic innovation, many of these jobs would experience large increases in automation risk, which would change the make-up of at-risk workers and the focus of policymakers.
3 Automation risk varies between and within countries
Across the three countries that we consider, Italy has the highest proportion of workers in at-risk occupations (23 per cent, followed by France with 17 per cent and the UK with 16 per cent). However, the UK has a smaller proportion of workers in low-risk occupations. Within the UK, the highest proportion of at-risk workers are in the North West (17 per cent) and the lowest are in the East Midlands (14.5 per cent).
4 Women and low-paid workers are at greater risk
Women are disproportionately represented in occupations with high exposure to automation. In the UK, for example, 21 per cent of female workers are in at-risk occupations, compared to just 12 per cent of male workers. This may be attributable to the high prevalence of female workers in retail, which faces a high risk of automation.
Workers in low-paid jobs are more likely to be employed in occupations with a high risk of automation. In the UK, workers whose incomes are among the lowest 20 per cent face a risk of automation that is around three times higher than that faced by workers whose incomes are among the highest 20 per cent.
5 At-risk workers have 10 per cent fewer options than workers in lower-risk jobs
High-risk workers are defined by two characteristics: their current job is at high risk of automation, and it contains very few tasks that could prevent or slow automation (we call these 'bottleneck' tasks).
We find that when at-risk workers try to lower their automation risk by moving jobs, they face two additional hurdles compared to other workers.
First, workers in high-risk occupations have significantly fewer jobs that they could transition into, based on their skills, compared to workers in lower-risks occupations. The median number of desirable transitions for at-risk workers is 27, which is 10 per cent less than for all other workers (who have a median of 30 transitions).
6 Many transitions for at-risk workers would place them in occupations that are also at high risk of automation
The second hurdle facing at-risk workers is that even if an at-risk worker switches jobs, they may not necessarily reduce their exposure to automation risk. This is because jobs that require similar skills tend to face similar levels of automation risk.
We find that approximately one-third of all desirable transitions for high-risk workers would put them back into jobs that are at high risk of automation. If we rule out transitions that would place workers into high-risk jobs, then the median number of safe and desirable transitions for at-risk workers is 15, which is 42 per cent less than for all other workers (who have a median of 26 transitions to jobs that are not at high risk).
Certain groups of occupations are particularly affected by their closest transitions being at high risk of automation. They include workers in clerical support, business and administration, as well as sales and services.
In summary, at-risk workers face the seemingly impossible challenge of finding a job that is sufficiently similar to their current role so that it is a viable transition, but also sufficiently dissimilar such that it has a lower risk of automation.
COVID-19
COVID-19 has already put a significant number of workers into unemployment. It has the potential to cause further disruption by compounding the impact of automation. First, it may speed up the adoption of automation technologies, driven by the need for social distancing between workers and the reduction in face-to-face tasks. Second, COVID-19 may reduce the number of viable transitions for workers in sectors such as food, cleaning and services, and retail and sales. These workers already have fewer transition options compared with others and now also face a greater level of exposure to COVID-19. With these impacts combined, workers may be forced to confront automation sooner than anticipated, and they may have to undertake more reskilling to avoid jobs that are vulnerable to the impacts of COVID-19.
7 Workers with higher levels of education and experience have more transition options
Upskilling or retraining is the key to expanding workers' options and making it easier for them to transition into lower-risk jobs. We find that workers with more advanced levels of education and experience also tend to have a greater number of transition options. On average, workers who are in jobs that typically require an undergraduate level of training have four times more transition options than workers in jobs that require a secondary school qualification and minimal previous work experience. The number of safe transitions is also positively correlated with on-the-job training, showing that training does not have to take the form of an accredited course and that, instead, there are multiple routes to upskilling as a way to which raise worker mobility.
8 A special set of core skills can broaden the options for a range of at-risk workers
Upskilling is a costly investment in terms of time and resources, and it is therefore important to target this investment in the right direction.⁵ One approach is to identify core skills that, on average, would broaden the range of options for all at-risk workers. The most effective of these core skills can unlock between two and three new safe and desirable options on average per occupation. Many of these core skills fall into one of the following four groups:
- Management skills - specifically, to manage staff, budgets and projects;
- Communication skills - specifically, to build and maintain business relationships, use different communication channels and liaise with managers and authorities;
- Information analysis and evaluation skills - specifically, to execute feasibility studies, assess financial viability, analyse risk and perform research;
- Skills related to complying with company guidelines, work health and safety standards, and environmental legislation.
These core skills emphasise the potential of non-routine activities (such as those that require advanced cognitive reasoning, human judgement and working with people) in protecting workers against automation. They also echo our findings in relation to the types of work activities that lower automation risk.
9 Upskilling pathways can be tailored for at-risk workers
Alongside the promotion of core skills, another approach is to tailor skills recommendations to at-risk workers based on their current roles. This is important because the effectiveness of core skills can vary. For example, the core skill of managing budgets is slightly more effective for business clerks and administrative workers (giving the average worker 4 new transition options) than it is for sales and services workers (giving 2.8 extra transitions). We should therefore aim to tailor advice for workers, identifying their closest desirable transition and the new skills that they need to reach this role.
We illustrate this approach by taking the case of a shop assistant a role that is at high risk of automation and is also typically low-paid. While perhaps the most obvious choice among the viable transitions is 'retail manager', we find that 'visual merchandiser' - responsible for the visual presentation of goods in retail outlets - is also among their viable options and has a substantially higher salary. The shop assistant already has some skills required for the role, such as maintaining relationships with suppliers and customers and possessing knowledge of merchandising techniques. We then identify nine new skills that the shop assistant may need to acquire through training in order to make the transition. These skills include executing visual presentation changes, conducting research on trends in design and interpreting floor plans.
This form of tailored advice could also be broadened to a whole sector when that sector is displaced by a shock such as COVID-19. We demonstrate this approach by assessing the typical skills gaps faced by workers in all high-risk roles within sales and service occupations.
Conceptual illustration of a sailboat with 'CORE SKILLS' written on its sail, representing the foundational skills needed for career pathways.
Recommendations for policy and practice
The insights uncovered through the Mapping Career Causeways methodology have the potential to help policymakers, providers of training and careers services, employers and individuals to prepare for changes to jobs and skills resulting from automation.
Enhancing resilience to labour market disruption
While local contexts will shape their decisions, policymakers across Europe can use these findings to design targeted interventions that anticipate changes to the demand for skills and enhance regional and individual resilience to labour market disruption.
Prepare for economic shocks: Governments can use Mapping Career Causeways to develop a watch list of at-risk occupations (including those with few bottleneck tasks) so that tailored support services for workers in these roles can be rapidly deployed in the event of their automation. So that job losses can be foreseen, we recommend that policymakers regularly survey firms that employ workers in these at-risk occupations about their automation intentions.
Build regional resilience: Policymakers developing regional industrial strategies can draw on this research to gauge the number of jobs at risk in their locality. To limit the shock of automation, those in regions where a high proportion of workers are in high-risk occupations should seek to diversify employment opportunities and improve access to training which opens up additional transition pathways. Mapping Career Causeways offers the additional benefit of allowing policymakers to identify occupations that will make use of the skills of at-risk workers. When looking to attract businesses to the region, they can use these new insights to target firms that offer a range of destination occupations for workers in roles that are at risk of disruption.
Improve the resilience of occupations and workers: By identifying occupations that are at risk of automation, this research provides policymakers with the information they need to design policies that give employers and individuals a head start in preparing for changes in the demand for skills. To build individual resilience to disruption, policymakers should invest in public awareness campaigns about high-risk occupations in order to encourage participation in upskilling and engagement with public employment services and careers guidance. This research is also a prompt for policymakers to support and incentivise employers to redesign jobs in ways that facilitate the development of core skills and minimise lay-offs - for example, by creating jobs around bottleneck tasks. Policymakers should foster cooperation between social partners and employers to achieve this aim.
An illustration depicting a person navigating a complex network of pathways and markers, symbolising career causeways and transition points in the labour market.
Building an inclusive and responsive system to support career transitions
The insights from Mapping Career Causeways could also be used to make services for skills development and career transitions more responsive to changes in the demand for skills and better tailored to workers whose jobs are at risk.
Ensure career support and training anticipates future labour market demand
- Ensure that the measures of occupational automation risk identified in Mapping Career Causeways are incorporated into careers information services in order to direct young people and jobseekers away from high-risk roles.
- Increase the accessibility and quality of training available for the core skills this research has identified (management, communication, information analysis and evaluation, as well as compliance-related competencies), which open up a greater range of transition opportunities for workers in high-risk occupations.
- Expand the provision of career information, advice and guidance to those currently employed in occupations that are at high risk of disruption.
Tailor skills and careers services to worker needs, based on their work experience and skills
- The skills profiles and transition pathways identified through Mapping Career Causeways complement methods used by careers guidance professionals for profiling and assessing workers' skills and enable them to provide more targeted, transparent guidance.
- Direct workers to training that is targeted at increasing the number of potential career transitions that would be open to them, based on their current skills profile.
Target funding at those most at risk in order to improve the efficiency of training delivery and support
- Given their over-representation in at-risk occupations, it is important to increase women's participation in training - for example, by improving access to childcare, supporting flexible working-time and encouraging secondary caregivers to contribute further to care responsibilities.
- Ensure that training rights exist and are enforced for low-paid workers, many of whom are in at-risk roles.
- Set up training and support hubs in locations in which many workers are employed in high-risk occupations.
- Provide enhanced career guidance and job search assistance to workers in high-risk occupations to build their awareness of the benefits of lower-risk roles and encourage them to upskill.
- Incentivise employers to invest in on-the-job training for workers transitioning from high-risk roles; this will help the workers to move occupations and additionally build their resilience to overcome future disruption.
- Support workers to identify a range of on-the-job options for developing core skills, such as through volunteering or online crowd work.⁹
Reduce the friction of career transitions by removing barriers and raising employer awareness of viable career causeways
- Support and incentivise employers of low-risk occupations to broaden their criteria for recruitment to workers in high-risk roles - for example, by re-evaluating qualification requirements.
- Encourage cross-sectoral employer partnerships to facilitate worker transitions between firms which are likely to automate occupations and firms which are likely to require more workers for low-risk roles.
- Enable workers in high-risk occupations to gain experience in lower-risk roles. Belgium's flexi-job scheme, in which workers can take on an additional part-time job that is exempt from social security contributions and taxes, could provide a model to help workers diversify their skills and experience.¹⁰
Next steps
The key output from this report is a 'map' which captures the relationships between more than 1,600 occupations based on their skills requirements and work characteristics. Occupations that are located near each other on the map are those that require similar skills, while isolated occupations denote the presence of specialist skills. For this report, we overlaid the risk of automation onto the map and examined how workers can move away from jobs that are at high risk of automation. However, this map has a number of other potential uses.
For workers, the map is intended to complement existing sources of careers advice and to act as a supplementary source of guidance and inspiration. Careers advisors could mould the insights from the map to reflect the preferences and unique skills of an individual worker. We recognise that individuals may still need additional assistance, such as building the confidence required to make career transitions. They must also be given the opportunity to take up retraining, and there must be vacancies available in their preferred occupation.
For employers, this map could be used to broaden their recruitment pools. We know that employers may struggle to assess the skills of candidates who are applying from other industries. This map could power a tool that tells employers the range of workers who would be suitable for their vacancies. It could also provide advice on where new workers may need extra training or support.
For local and central government, this map would provide a bird's eye view of the labour market. Following a sudden shock, such as COVID-19, the government could use the map to quickly identify the types of retraining that it should support in order to enable the affected workers to transition into neighbouring occupations. Governments could also use the map to identify workers who are likely to be more vulnerable to future shocks because their skills sets are isolated and they have fewer transition options than other workers.
Over the next year, we hope to trial these use cases for the map, and we are actively seeking partners to work alongside us as we pursue this mission. This work will involve validating the transition pathways, testing different methods for delivering insights from the map and extending the map by, for example, incorporating the availability of jobs in a worker's local area. Through this work, our aim is to enrich and broaden the information that is available to individuals, businesses and the organisations that support them as each group navigates the ever-changing labour market.
An illustration showing a person navigating a career map with pathways and different risk indicators, symbolising the journey through a changing labour market.
Endnotes
Bibliography
Kanders K, Djumalieva J and Sleeman C (2019). The Future of Skills: Employment in 2030. Nesta. https://www.nesta.org.uk/report/the-future-of-skills-employment-2030/
Autor D (2015). Why Are There Still So Many Jobs? The History and Future of Workplace Automation. Journal of Economic Perspectives, 29 (3): 3-30.
Bakhshi H, Frey C and Osborne M (2017). Creativity vs. Robots: The creative economy and the future of skills. Nesta. https://www.nesta.org.uk/report/creativity-vs-robots/
Berger T and Frey C (2016). Structural Transformation in the OECD: Too Slow, Too Fast, or Just Right? Oxford Martin School.
Bonet J and Candia C (2019). The Skill-Relatedness of Occupations in Colombia. Banco de la Republica de Colombia.
Bresnahan T, Brynjolfsson E and Hitt L (2002). Information Technology, Workplace Organization, and the Demand for Skilled Labor: Firm-Level Evidence. Quarterly Journal of Economics, 117 (1): 339-376.
Brynjolfsson E and McAfee A (2014). The Second Machine Age: Work, Progress, and Prosperity in a Time of Brilliant Technologies. WW Norton & Company.
Brynjolfsson E, Mitchell T and Rock D (2018). What Can Machine Learning Do? Workforce Implications. AEA Papers and Proceedings, 108: 111-15.
Burroni L and Evangelista F (2019). Skill Similarity and Job Mobility in Italy. European Journal of Industrial Relations, 25 (3): 220-236.
Carnevale A, Smith N and Gulish A (2015). The Overlooked Value of Certificates and Certifications: What we know about one million non-degree credentials. Georgetown University Center on Education and the Workforce.
De Vos M and Maes J (2017). Flexible and Seasonal Employment in the Service Sector. ILO.
Eurostat (2019). European Union Labour Force Survey.
Frey C and Osborne M (2017). The future of employment: How susceptible are jobs to computerisation? Technological Forecasting and Social Change, 114: 254-280.
Gibbons S and Telg C (2012). The UK Labour Market and the Great Recession. The National Institute of Economic and Social Research.
Grasmick D (2019). The Role of Skills in Occupational Mobility. National Centre for Postsecondary Research.
Green F, Lee S and Zanchi L (2019). The evolution of employment protection legislation: 1980-2015. International Labour Review, 158 (1): 1-32.
Hajdu T and Hajdu G (2019). How does the occupational structure of the labour market change due to automation? An analysis of Hungary. The Journal of the European Academy of Labour.
Kuhn C and Marschner H (2019). Labour market transitions and the role of skills: Evidence from Germany. Institute for Employment Research.
Neumark D, Romans A and Van der Klaauw W (2016). Minimum Wages and the Employment of Low-Skill Workers: A Survey of Recent Evidence. IZA Journal of Labour Economics, 5 (1): 1-45.
Nesta (2018). Precarious to Prepared: Helping workers thrive through an era of uncertainty. Nesta. https://www.nesta.org.uk/report/precarious-to-prepared-helping-workers-thrive-through-an-era-of-uncertainty/
OECD (2018). Automation, Skills and Training in the Era of Digitalisation. OECD Publishing.
Schumpeter J (1942). Capitalism, Socialism and Democracy. Harper & Brothers.
Thompson P (2018). The automation of work: The impact of automation on employment and jobs. Industrial Relations Journal, 49 (3): 221-235.
World Economic Forum (2018). The Future of Jobs Report 2018. World Economic Forum. http://www.weforum.org/reports/the-future-of-jobs-report-2018
Introduction
Understanding automation risk is more important than ever
Throughout history, technological progress has been associated with automation, with machines replacing workers in tasks that they previously performed. While new technologies have displaced some workers, they have also generated demand for labour through the creation of new tasks and jobs.
There is concern that the current wave of automation caused by advancements in Artificial Intelligence (AI) will be different. This is because technologies such as machine learning, a field within AI, make it possible for algorithms to learn and perform tasks using large amounts of unstructured data without being explicitly programmed. As a result, many more types of activities are likely to become susceptible to automation.
The consensus among experts is that AI will affect tasks in almost every job, but to a varying degree, with a greater proportion of tasks being shifted from people to machines in some occupations than in others. While AI has the potential to create new jobs, there is evidence to suggest that this is not happening.
Thus far, the adoption of AI-driven labour-displacing technology has been gradual, but COVID-19 might accelerate the pace of this process. The perfect storm of automation and COVID-19 will disproportionately and drastically affect certain occupations, places and demographic groups. The adverse effects of these disruptions will also materialise sooner than perhaps anticipated.
For these reasons, it's more important than ever that we develop practical strategies to help those impacted by automation.
Shifting the focus of automation research onto affected workers
Illustration: Conceptual diagram of a landscape with flowing paths and structures, representing career causeways or transition paths.
The illustration features abstract blue and green shapes resembling landmasses and flowing water, with small architectural elements like bridges and a warning sign (similar to the previous image's theme) suggesting movement or transition within a system.
In less than a decade, a large number of studies on automation have been published. Generally, research has been moving towards recognising the complexity of how different facets of automation interact with job characteristics. The very first study, by Frey and Osborne, evaluated the feasibility of automating whole occupations. Subsequent studies took a more nuanced approach based on mapping automation risk to specific job tasks and underlying cognitive abilities.
To date, most automation studies have focused on generating estimates of automation risk for broad groups (or 'families') of jobs. Our research aims to shift the focus of the automation debate onto the workers affected by automation, identifying their demographic characteristics and locations and providing training advice that is tailored to their current jobs.
First, we estimate automation risk for 1,627 separate occupations. Most studies have calculated risk for broad groups of jobs. Our concern is that automation risk may vary across jobs within these groups and so workers may be misinformed about the risks specific to their role.
Second, we provide a demographic breakdown of the groups who work in occupations at the highest risk of automation at a regional level. We want to support local policymakers to design targeted initiatives.
Finally, and most importantly, most automation studies have stopped short of offering practical advice in regards to which jobs at-risk workers should transition towards. This advice is essential if we are to help workers reduce their exposure to automation risk. For each at-risk occupation, we identify alternative occupations that require similar skills but are at lower risk of automation. We also identify a set of core skills that increase the number of transition options for many workers.
Methodology
Data
Occupational frameworks
O*NET
O*NET is a digital database that was developed with support from the US Department of Labor's Employment and Training Administration. The database provides detailed information for over 900 US occupations. It consists of standardised descriptors of occupational requirements and worker attributes, including skills and knowledge required, how the work is performed and typical work settings. Information in the database is publicly accessible and is continually updated using input from occupational experts, job holders and job postings. O*NET is widely used by researchers to address labour market issues, such as the effects of automation on employment and the changing nature of task requirements.
In this study, we used O*NET data on tasks and work activities performed in US occupations to produce estimates of automation risk in European Union (EU) occupations. We also incorporated information from O*NET on work context and education and experience requirements when measuring similarity between jobs and identifying transition opportunities.
ESCO
The European Commission's ESCO represents a major public effort to systematise occupational information across Europe. ESCO is an ontology that maps relationships between skills, qualifications and occupations. Following several years of expert collaboration and public consultations, the first full version of ESCO was released in October 2017. Similar to O*NET, ESCO is open to the public.
We primarily used ESCO to capture detailed skills requirements, as ESCO features descriptions of 13,485 unique skills linked to 2,942 occupations. We also used the recently released official ESCO skills hierarchy, which categorises skills at three levels. The categories at the lowest level are based on the intermediate work activities of O*NET, and skills within the same category can therefore be seen as pertaining to the same type of work activity.
ESCO occupations are harmonised with the International Standard Classification of Occupations (ISCO), meaning that they represent more granular occupations that reside within broader ISCO job families. We leveraged this hierarchical relationship when analysing official statistics on employment in European countries, which are currently produced by Eurostat using ISCO classification.
Illustration: Abstract blue and green shapes resembling landmasses and flowing water, with small architectural elements like bridges, forming a conceptual landscape.
This diagram continues the visual theme of "Mapping Career Causeways," showing interconnected paths and structures, implying movement and relationships between different elements.
Crosswalk between O*NET and ESCO
To combine rich insights from O*NET and ESCO, we developed the first crosswalk between these frameworks. The crosswalk establishes a mapping between O*NET occupational codes and those in ESCO. While many of the mappings are one to one, there are instances where a single O*NET occupation is matched to more than one ESCO occupation. As a result, the automation estimates should be viewed with caution as the risk associated with one O*NET occupation may have been applied to several (albeit very similar) ESCO occupations. There may be a task that is unique to one of these occupations that would merit raising or lowering the automation risk for that role.
To derive the crosswalk, we leveraged several strategies. First, we used an existing crosswalk between O*NET and ISCO (i.e. broader occupational groups than ESCO) to identify the most likely matches. Second, we applied techniques from Natural Language Processing (NLP) – a subfield of machine learning - to identify for each ESCO occupation corresponding O*NET occupations with the highest semantic similarity of occupational group descriptors and known job titles. Finally, we manually assigned occupational codes in instances where the two automated approaches didn't agree. For further details on the methodology used to produce the crosswalk, refer to the Appendix of this report.
Official statistics on employment and earnings
European Union Labour Force Survey
The European Union Labour Force Survey (EU LFS) is a large household sample survey that provides official statistics on labour market participation in all EU Member States as well as Iceland, Norway, Switzerland and the UK.
The EU LFS is conducted separately by national statistics agencies and then processed by Eurostat. The centralised processing of the surveys ensures that statistics collected from different countries are harmonised so that labour market statistics are produced using standard definitions and common occupational and industrial classifications.
In this research, we accessed anonymised EU LFS microdata for France, Italy and the UK. The data was used to study demographic characteristics of workers at high risk of automation in the three countries.
UK Annual Survey of Hours and Earnings
The Annual Survey of Hours and Earnings (ASHE) is the most comprehensive source of information on the structure and distribution of earnings in the UK. ASHE provides information about the levels, distribution and make-up of earnings and paid hours worked for employees in all UK industries and occupations. We mapped this data to ESCO occupations to provide indicative estimates of workers' expected annual earnings, which were used to evaluate job transitions out of occupations at high risk of automation.
Approach
Measuring automation risk
Researchers have previously pursued different approaches to measuring automation risk. In one of the earliest studies in the field, Frey and Osborne asked experts to evaluate a subset of occupations and determine whether each occupation, as a whole, was automatable or not automatable. The authors then used machine learning to infer automation probabilities for all other occupations. Their resulting estimates were alarming, and showed that 47 per cent of US jobs were at high risk of automation.
In a 2016 study by the Organisation for Economic Co-operation and Development (OECD), Arntz and colleagues took a different approach. They argued that as any occupation is made up of many tasks, it is highly unlikely that all the tasks could be automated. When Arntz et al. revisited occupations previously identified as high risk by Frey and Osborne, they found that many of them required skills that are difficult to automate. As a result, Arntz et al. estimated that only 9 per cent of jobs will disappear entirely, while 32 per cent are likely to be significantly modified. These estimates were produced for 43 broad European occupational groups.
Brynjolfsson and colleagues extended the OECD's approach and generated even more granular estimates of risk. In the OECD study, every occupation was made up of a combination of 3 skills and 25 tasks, and so each of these skills and tasks were very broad. Brynjolfsson et al. instead used the O*NET taxonomy, in which every occupation is linked to a combination of over 18,000 tasks and 2,000 detailed work activities. Using that approach, they found that few US occupations are in a situation where all the work activities that make up that occupation are at risk of automation.
While Brynjolfsson et al. attempted to directly link AI developments to tasks, a recent study by Tolan et al. instead introduced an intermediate level of cognitive abilities. Researchers mapped 119 occupations (three-digit ISCO minor groups) to 14 cognitive abilities, which were further linked to AI benchmarks. The approach by Tolan and co-authors offers a more flexible framework for measuring the occupational impact of AI and predicting the direction of future development.
These studies highlight the different perspectives and methodological trade-offs when measuring automation risk. After consideration, we chose to base our research on the findings of Brynjolfsson et al., as these offer the highest level of granularity - providing the automation risk for over 18,000 different tasks. This enables us to make policy recommendations that are tailored and actionable.
Deriving occupation-level risk estimates
To generate estimates of automation risk for European occupations, we adapted Brynjolfsson et al.'s approach to a European context. In that study, the authors used collective intelligence methods (see Feature Box 1, on page 21) together with data from O*NET to produce estimates of automatability (referred to as suitability for machine learning - SML) for US occupations.
Figure 2. Collective intelligence approach used by Brynjolfsson et al. to assess task SML
Flowchart illustrating the steps:
1. Recruit people on CrowdFlower (now called Appen)
2. For each detailed work activity, show the person a representative task
3. Ask about their own experience and familiarity with the task
4. Ask 23 questions about the task (answer each on a scale of 1-5)
Feature Box 1: Overview of the approach by Brynjolfsson et al.
In their paper entitled 'What can machines learn and what does it mean for occupations and the economy?', Brynjolfsson and co-authors used a collective intelligence approach to source automatability ratings for thousands of work activities that make up US occupations (Figure 2). Automatability is defined as SML and is measured on a scale from 1 to 5, where 1 refers to the lowest level of automatability and 5 to the highest.
The SML of work activities was assessed by participants on the CrowdFlower platform. For each work activity, raters were shown a representative task that they then scored against 23 questions, which we also refer to as automation dimensions. Raters were asked about their familiarity with the tasks, and only responses from raters who confirmed they understood the task were included in the analysis.
Each of the questions was presented in the form of a statement, and the participants were asked to indicate their agreement on a scale from 1 to 5 corresponding to strong disagreement and strong agreement, respectively.
Example statement:
It is not important that outputs are perceived to come from a human
- Strongly disagree (score 1/5): Task fundamentally requires human connection (e.g. therapy, teaching, making a speech, delivering bad news like a diagnosis)
- Neutral (score 3/5): Task could be done by a non-human, but might cause frustration or inefficiency (e.g. customer service)
- Strongly agree (score 5/5): Task requires little human connection, empathy or emotional intelligence (e.g. telemarketing, preparing taxes, performing calculations, lifting boxes)
Individual scores for work activities were aggregated, first across raters and then across automation dimensions. The resulting average work activity SML scores were combined to generate SML estimates for over 900 O*NET occupations. These estimates were produced in order to reflect the importance of individual tasks and work activities to occupations.
It's worth noting that in their framework, Brynjolfsson and co-authors do not incorporate the impact of developments in robotics. In the SML rubric used to assess work activities, requirements for physical labour and dexterity are associated with low automatability.
Figure 3. Overview of the process for deriving automation risk estimates for European occupations
Flowchart showing the five main steps:
1. US Occupational Information Network (O*NET)
* 900+ occupations
* Take SML scores for tasks used in O*NET occupations
2. Crosswalk from O*NET to ESCO occupations
3. European multilingual classification of Skills, Competences, Qualifications and Occupations (ESCO)
* 1,627 occupations
* Obtain SML scores for tasks used in ESCO occupations
4. Calculate occupation-level risk for ESCO occupations
Image shows logos for O*NET and European Commission.
As shown in Figure 3 on page 22, we mapped Brynjolfsson et al.'s results for US occupations to European occupations using an author-developed crosswalk between O*NET and ESCO (see Appendix, page 83 for further detail). The crosswalk was also used to build rich occupational profiles by combining information on skills requirements from ESCO with data on work context and workers' education and experience requirements from O*NET. We provide more details on this in the section on our career transition recommendation algorithm.
We generated two sets of automation risk estimates for 1,627 ESCO occupations. The first set refers to the overall automation risk. In line with the original study by Brynjolfsson et al., this is measured as an average of automatability scores across all tasks that make up a given occupation, weighted by task importance (Figure 4, page 23).
We also produced a new measure of automation risk, which is related to the existence of so-called 'bottleneck' tasks. These are the tasks that score low on some automation dimensions and so slow down or prevent the occupations from being automated. The greater the number of such tasks in an occupation, the more difficult it is to automate it overall.
To measure the prevalence of bottleneck tasks, we looked at individual dimensions of automation for each task in a given occupation. If at least one dimension had a score of less than or equal to two, we considered the task to be a bottleneck task. We summed the importance weights for all tasks that met this criterion to arrive at an occupation-level metric (Figure 5).
Figure 4. Illustration for calculating occupation-level automation risk
Note: Mean task SML scores are weighted by their importance and summed at the occupation level to arrive at the occupation's overall risk of automation.
Diagram showing the calculation:
| Mean SML (suitability for machine learning) |
|
Weight |
|
Occupation (Weighted average SML) |
| TASK 1: 1.0 |
x |
0.28 |
→ |
3.05 (Dials showing range from LESS 1 to MORE 5, with needle at ~3.05) |
| TASK 2: 3.5 |
x |
0.25 |
|
|
| TASK 3: 4.0 |
x |
0.33 |
|
|
| TASK 4: 4.1 |
x |
0.14 |
|
|
Weight task mean SML by its importance → Sum at occupation level
Reading this diagram
The dials indicate the SML (suitability for machine learning)
LESS 1 2 3 4 5 MORE
The lower the score, the lower is the potential for applying machine learning to the task.
Figure 5. Illustration for calculating prevalence of bottleneck tasks in a given occupation
Note: 'Low SML score' refers to automatability scores of less than or equal to two.
Diagram showing the calculation:
| # of dimensions with low SML score |
|
Weight |
|
Occupation (Prevalence of bottleneck tasks) |
| TASK 1: 5 |
→ |
0.28 |
→ |
0.53 (Dials showing range from LESS 0.0 to MORE 0.8, with needle at ~0.53) |
| TASK 2: 2 |
→ |
0.25 |
|
|
| TASK 3: 0 |
→ |
0.33 |
|
|
| TASK 4: 0 |
→ |
0.14 |
|
|
If the task has at least one automation dimension with a score less than or equal to two, count its weight towards the metric → Sum at occupation level
Bottleneck tasks are more protected from automation
Bottleneck tasks typically solve problems which are not yet amenable to machine learning. Therefore, a larger prevalence of bottleneck tasks in an occupation reduces its exposure to automation risk.
LESS 0.0 0.2 0.4 0.6 0.8 MORE
Figure 6. Grouping occupations into categories of 'low risk' (green), 'high risk' (red) and 'other' (grey)
Table showing risk categories based on Overall automation risk and Prevalence of bottleneck tasks:
|
Overall automation risk (Weighted mean of task SML scores) |
|
Low risk (First quartile) |
| Prevalence of bottleneck tasks (Weighted proportion of tasks that have at least one dimension whose SML score is less than or equal to two) |
High (Fourth quartile) |
| Medium (Second and third quartile) |
Other |
| Low (First quartile) |
Other |
Figure 7. Hierarchy of tasks and activities
Flowchart showing increasing granularity from left to right:
37 Elements (Broad activities) → 332 Intermediate work activities → 2,062 Detailed work activities → 18,250 Tasks (Specific)
To differentiate between the level of automation risk in ESCO occupations, we grouped the occupations into categories. Each occupation was assigned to a 'high risk', 'low risk' or 'other' category based on a combined measure of the overall risk of automation and the prevalence of bottleneck tasks. As shown in Figure 6 above, the 'high risk' category includes ESCO occupations that are characterised by high overall risk and very few bottleneck tasks.
Finding the tasks that raise and lower automation risk
To develop a better understanding of what drives automation risk, we analysed the types of tasks and work activities that lowered or raised the risk of automation. The impact of each task was estimated by calculating how the automation scores of occupations would change if the task were removed. To aid interpretation of results, individual tasks were grouped into detailed work activities, intermediate work activities and elements using the O*NET framework (Figure 7).
Building demographic profiles of at-risk workers
Figure 8. Analysing employment and demographic characteristics of workers in high-risk, low-risk and remaining three-digit ISCO occupations
Note: Q1 refers to the first quartile and Q4 to the fourth quartile of the corresponding distributions.
Flowchart showing three main steps:
1. Derive risk estimates for three-digit ISCO occupations
* Take average of risk estimates for ESCO occupations residing in the same three-digit ISCO occupation.
* Outputs: Average overall automation risk, Average prevalence of bottleneck tasks
2. Assign risk categories to three-digit ISCO occupations
* Rank three-digit ISCO occupations by overall risk and prevalence of bottlenecks; then group into risk categories using quartiles.
* Conditions: Low risk: Low overall risk (Q1) and high prevalence of bottleneck tasks (Q4). High risk: High overall risk (Q4) and low prevalence of bottleneck tasks (Q1).
3. Build demographic profiles
* Use EU LFS to analyse employment and demographic characteristics of workers in three-digit ISCO occupations.
* Outputs: Employment statistics and demographic profiles for workers in high-risk, low-risk and remaining occupations
To identify at-risk workers, we built up a picture of their demographic characteristics and working patterns using anonymised microdata from the EU LFS. Demographic analysis was conducted at both national and regional levels for the UK, France and Italy.
The EU LFS only reports respondents' occupations at a minor group level (three-digit ISCO occupations), whereas our estimates of automation risk are much more granular. To be able to use employment statistics from the EU LFS, we aggregated occupation-level automation risk estimates. For a given minor ISCO occupation, we took an average of risk estimates across all detailed occupations that reside under this broad occupational group.
Similar to the approach used for more detailed ESCO occupations, we then grouped minor ISCO occupations into three risk categories based on the average estimates of overall risk and prevalence of bottleneck tasks (Figure 8).
Once minor ISCO occupations were assigned to a risk category, we analysed EU LFS data and estimated the number and proportion of workers employed in high-risk, low-risk and remaining occupations. These indicators incorporated breakdowns by age, gender, highest level of educational attainment, industry, working patterns and type of contract. To evaluate the results, we also investigated whether some of the observed demographic differences were statistically significant. For example, we were able to explore if there is a significant relationship between workers' gender and them being employed in a high-risk occupation.
Recommending job transitions
Figure 9. Illustration of the general approach for finding viable and desirable job transitions
Note: We define desirable transitions as a subset of the viable ones.
Diagram showing the flow from an "Origin occupation" to "Destination occupations":
Current job
↓
Career transition recommendation algorithm
Branches out to three types of destination jobs:
Not Viable (Job A)
* Not viable
Viable (Job B)
* Viable
* 'Is the job a good fit?'
* Skills, education and experience requirements
* Types of work activities
* Interpersonal, physical and structural work aspects
Desirable (Job C)
* Desirable and viable
* 'Do I want the job?'
* Expected earnings
* Other situation-specific factors
An essential part of our research was the characterisation of the job transition possibilities for workers in different occupations. This allowed us to find promising pathways for at-risk workers to move into occupations with safer future prospects. Moreover, by assessing the range of recommendations, it is possible to identify workers who have very few transition possibilities and who might, therefore, be less resilient in the face of automation and other labour market disruptions.
Our methodology builds on recent research developments that have demonstrated the value of detailed occupational frameworks and labour market information for data-driven identification of job transitions that are both viable and desirable from the standpoint of workers (Figure 9). The viability of transitions is determined by examining the fit between occupations, which in turn allows us to recommend transitions to jobs (destination occupations) that are most similar to workers' current jobs (origin occupations). Transitions deemed to be the most viable are presumed to be the least challenging in terms of reskilling needs.
The desirability of transitions is influenced by a more complex and individual set of criteria, which may include (but is not limited to) monetary compensation, location of the job, working hours and, importantly, the personal aspirations of the worker. Future prospects of employment and the resilience of the job to labour market disruptions, such as automation, are also generally desirable features of transitions that workers may not be aware of.
Developing an open and granular model of career transitions
Using richer data on occupations
A number of recent studies have employed the detailed information in O*NET as the foundation for measuring the similarities between different occupations. The wide array of descriptors enables comprehensive comparisons between the hundreds of occupations featured in O*NET. Importantly, Mealy et al. and Dworkin have shown that the occupation similarities estimated using O*NET are indeed significantly correlated to real-world job transition rates as given by the US Current Population Survey.
To assess the fit between occupations, we pursued a novel direction compared to previous research on transitions out of automation and used ESCO as the foundation for our transition recommendations. Importantly, our crosswalk between O*NET and ESCO allowed us for the first time to build detailed occupational profiles that leverage the strengths of both frameworks. We used this to develop comprehensive comparisons of occupations ranging from very specific skills from the ESCO framework to more general interpersonal, physical and structural aspects of work using O*NET work context features.
Producing highly granular recommendations
A different stream of research has made use of individual-level data from the OECD Survey of Adult Skills to assess job transition feasibility. From the responses of thousands of individuals, two cognitive and five task-based skills indicators have been derived and used to characterise transitions between 120 broad occupational families corresponding to the three-digit ISCO minor groups. While limited with respect to the granularity of occupations and their characteristics, these studies have provided insights into regional differences in feasibility as well as the potential time and monetary costs of transitions.
For our case, ESCO provides a standardised classification of over 13,000 skills linked to more than 2,900 occupations. While we mainly considered the subset of 1,672 occupations to which we have assigned automation risk estimates, our approach for recommending job transitions can be applied to all ESCO occupations. This number of occupations and skills marks a significant improvement in the precision of the transition recommendations compared to previous studies, which have commonly considered between 100 and 1,000 distinct occupations and up to several hundred different occupational descriptors.
Incorporating automation risk into the recommendations
The aspect of transition desirability or 'acceptability' has been commonly expressed in previous studies by the expected increase in earnings together with other factors such as future employment prospects, retention of human capital and the automation risk of the destination occupation.
Similar to other studies, we established desirability by comparing the estimated earnings of the origin and destination occupations. Crucially, we used our estimates of automation risk to select safe, viable and desirable transitions that reduce worker exposure to automation. By using both risk and the proportion of bottleneck tasks, we were able to make a more well-rounded assessment of the automation risk of destination occupations compared to just using the average automation risk or the Frey and Osborne risk.
Open-source approach
All the data used in our research, as well as the recommendation algorithm is open-source. This is important for two reasons. First, it is essential to expose the data and algorithms to scrutiny if they are, as we hope, to be used in practical settings. This can only happen if the methodology is fully transparent. Second, there are no additional monetary barriers associated with adopting our approach, as opposed to relying on proprietary data and algorithms. While sources such as online job adverts provide timely and highly localised data about the labour market, at present, procuring such data is costly.
To the best of our knowledge, this work presents the most detailed, fully open framework for supporting transitions out of occupations at risk of automation. In the next sections, we demonstrate the main steps of comparing occupations and identifying viable, desirable and safe transitions. Further technical details are provided in the Appendix.
Figure 10. Overview of our approach to deriving job transition recommendations for workers at risk of automation
Flowchart showing five main steps:
1. Build detailed occupation profiles
* Combine data on occupations from ESCO and O*NET
2. Measure occupation similarity
* Compare occupations using data science and machine learning
3. Identify viable transitions
* Select destinations with a good fit of skills, work activities, work context, and education and experience level
4. Identify desirable transitions
* Select destinations that incur a limited loss of earnings
5. Identify safe transitions
* Select destinations with a lower automation risk
Building a career transition recommendation algorithm
By employing the conceptual framework of viable and desirable transitions, we developed a fully open approach for identifying career transitions that lower the risk of automation to workers, following the five steps outlined above (Figure 10). Taken together, these five steps give rise to our 'map' of occupations a detailed account of the relationships between over 1,600 ESCO occupations and the potential transition pathways between them.
Building detailed occupational profiles
For each ESCO occupation, we built a comprehensive profile capturing both the typical requirements from workers as well as the nature of their work (Figure 11, page 29). We used more than 10,000 essential and optional skills from ESCO together with 75 work activity types described by the ESCO hierarchy and 57 work context features from O*NET. To arrive at more robust transition viability estimates, we additionally used the job zone attribute from O*NET, which compactly captures the expected education and experience levels of the workers. Finally, in order to determine transition desirability, we estimated workers' annual earnings using the ASHE, which is the most comprehensive source of information on earnings in the UK.
Figure 11. Step 1: Building detailed occupational profiles
Notes: This is a snapshot of a profile, showing the different types of information that were used to recommend job transitions (only a subset of the full profile is shown). The work context features have been normalised in the range between 0 and 1.
OCCUPATIONAL TITLE:
Hotel concierge
| AUTOMATION RISK: |
EDUCATION & EXPERIENCE LEVEL: |
ANNUAL EARNINGS: |
| High |
3/5 |
£19,000 |
| INTERPERSONAL WORK CONTEXT: |
STRUCTURAL WORK CONTEXT: |
PHYSICAL WORK CONTEXT: |
| Telephone use 1.00 |
Time pressure 0.50 |
Time spent sitting 0.82 |
| Face-to-face discussions 0.90 |
Freedom to make decisions 0.30 |
Exposed to weather 0.86 |
| TYPES OF WORK ACTIVITY: |
ESSENTIAL SKILLS: |
OPTIONAL SKILLS: |
| Obtaining information verbally |
Identify customer's needs |
Take room service orders |
| Providing information and support to the public and clients |
Provide tourism-related information |
Implement marketing strategies |
| Negotiating |
Assist clients with special needs |
Maintain incident reporting records |
|
Greet guests |
Detect drug abuse |
|
Handle customer complaints |
Ensure the privacy of guests |
Figure 12. Step 2: Measuring occupation similarity
Flowchart showing "Input data", "Analysis steps" and "Outputs":
Input data:
* Skills, knowledge, attitudes and values (ESCO skills pillar)
* Types of work activities (ESCO skills hierarchy)
* Interpersonal, physical and structural work features (O*NET work context)
(Crosswalk to ESCO between Input data and Analysis steps)
Measure occupation similarity (Analysis steps):
* Overlap of essential skills* (NLP-adjusted overlap)
* Overlap of optional skills* (NLP-adjusted overlap)
* Alignment of work activity types (Vector similarity)
* Alignment of work context features (Vector similarity)
* *includes skills, knowledge, attitudes and values from the ESCO skills pillar
- All four measures aggregate by averaging → Combined similarity measure (Output)
Labels for sections:
Occupational data (below input data)
Analysis steps (below Measure occupation similarity)
Outputs (below Combined similarity measure)
Measuring occupation similarity
To measure the fit between different occupations, we compared the occupational profiles across four different facets: essential skills, optional skills, work activity types and work context (Figure 12).
For comparing the essential and optional skills sets between different occupations, we developed a novel approach that employs recent advances in NLP which allowed us to generate high-quality numerical representations of skills descriptions and measure their semantic overlaps. We describe this approach - the NLP-adjusted overlap - at greater length in the Appendix.
To capture the similarity of work activities, which has been indicated to be particularly predictive of real-world job transitions, we constructed numerical representations (so-called 'feature vectors') that describe the relative intensity of each type of work activity in an occupation and compared these representations. The different types of work activities are based on the ESCO skills categories, where skills in the same category can be seen as pertaining to the same broader type of activity - for example, the skills to 'stimulate creativity in the team' and to 'encourage teams for continuous improvement' pertain to the activity of 'building and developing teams'. Hence, by definition, this is a coarser assessment of the occupational similarities compared to the NLP-adjusted overlap of skills sets.
METHODOLOGY - APPROACH
Figure 13. Step 3: Identifying viable transitions
This diagram illustrates the process of identifying viable job transitions.
Input data (left column):
* Combined similarity measure
* Education and experience (O*NET job zones)
* Occupational data
Crosswalk to ESCO connects "Education and experience" and "Occupational data" to the "Analysis steps".
Analysis steps (middle column, connected by arrows):
1. Identify viable transitions
* Calibrate viability threshold
* Select transitions above the viability threshold
2. Select destinations with similar level of education and experience
Outputs (right column, derived from analysis steps):
* Viable transitions (derived from "Select transitions above the viability threshold" and "Select destinations with similar level of education and experience")
Finally, we evaluated the occupational similarity with respect to the interactions between workers and other people, their physical work environment and the structural characteristics of the job. Similar to the comparison of work activities, we constructed and compared feature vectors that capture the relative intensity of 57 different work context characteristics, such as how often one needs to have telephone conversations, how often the job requires exposure to high places and how often the job requires you to meet strict deadlines.
The rationale of using several different measures was to assess occupational proximity at varying degrees of resolution that, when combined, would provide a more comprehensive picture about the relationships between different jobs. We aggregated the four similarity measurements via a simple equally weighted average and proceeded to use the combined measure to find viable job transitions.
Identifying viable transitions
Occupational similarity threshold
For any given occupation, the similarity measurements allow us to rank the other occupations from most to least similar, and we can use this ranking to determine the relative viability of each job transition. However, to assess the range of viable transitions, we need a threshold below which we deem transitions to be unviable (Figure 13).
To this end, we calibrated a data-driven viability threshold by making the assumption that transitions between ESCO occupations that belong to the same ISCO four-digit group (the so-called 'unit groups') should typically be viable. For each unit group, we calculated the mean similarity between all its lower-level ESCO occupations (Figure 14, page 32). Interestingly, we found that the mean within-unit group similarity varies rather widely – between 0.15 (for armed forces occupations) and 0.97 (for driving instructors), with the median around 0.45. We defined the viability threshold at 0.30, which corresponds to the mean minus one standard deviation of the distribution of the within-unit group averages.
Figure 14. Illustration for the calibration of the occupational similarity threshold that was used to select viable transitions
This diagram shows how the occupational similarity threshold is calibrated.
Occupational data (left column):
* ISCO unit group (four-digit code) connected to a list of ESCO occupations in the same ISCO unit group.
* Another ISCO unit group (four-digit code) connected to another list of ESCO occupations in the same ISCO unit group.
Analysis steps (middle column, showing calculations and thresholds):
1. Mean within-unit group similarity is calculated for each ESCO occupation set (represented by circles with values like 0.35 and 0.68).
2. These means feed into an Aggregate mean within-unit group similarities step.
3. This aggregate then informs the Set threshold to mean minus one standard deviation.
Outputs (right column):
* Viability threshold
Level of education and experience
To further increase the robustness of our recommendations, we discarded transitions to occupations that have divergent education levels and work experience. Following the approach proposed by the World Economic Forum, we used the 'job zone' attribute from O*NET, which provides a compact measure for workers' expected level of education, related work experience and on-the-job training. There are five distinct job zones, with job zone 1 corresponding to occupations that need little or no preparation (e.g. laundry workers) and job zone 5 to occupations that need extensive preparation (e.g. judges). We restricted the range of possible job zone changes between -1 and +1 to ensure that the recommended transitions remain realistic.
Identifying desirable transitions
In this work, we restricted the scope of assessing desirability to ensuring that the recommended transitions incur a limited loss of annual income and thus allow for maintenance of a similar if not better standard of living (Figure 15, page 33). Specifically, the criterion for a viable transition to be accepted as a desirable one was that the median annual earnings ratio between the destination and origin occupation be no lower than 0.75. This is a rather lenient criterion, which we further discuss in the Appendix.
While the annual earnings of each occupation were estimated using data from UK workers, our recommendation algorithm can be easily adjusted to include earnings data from other countries and regions.
Impact of COVID-19
Early signs are emerging that the ongoing coronavirus pandemic is accelerating the adoption of automation technologies as employers rush to mitigate the impacts of COVID-19 and the risks associated with social distancing measures. To account for the risk of accelerated automation, it may therefore be useful to identify workers who are not only at high risk of automation but who are also especially impacted by COVID-19.
We derived a simple estimate for occupational-level exposure to the impact from COVID-19 based on the workers' physical proximity to other people (determined from information in O*NET) and on the extent to which the work has to be performed on-site (measured by del Rio-Chanona et al.'s Remote Labor Index ). For example, the COVID-19 exposure score for concierge workers is high (0.75), as they normally have to work close to other people ('at arm's length') and only one out of the seven concierge work activities can be performed remotely. We occasionally used this exposure score to evaluate the origin and destination occupations.
Figure 15. Step 4: Identifying desirable transitions
This diagram outlines the process of identifying desirable job transitions.
Note: Shaded boxes indicate optional analysis of the impact on occupations from COVID-19 that is discussed in feature boxes in the Results section.
Input data (left column):
* Viable transitions
* Salary (Official data on annual earnings)
* Physical proximity (O*NET work context)
* Remote Labor Index (del Rio-Chanona et al. (2020))
* Occupational data
Crosswalk to ESCO connects "Occupational data" to the "Analysis steps".
Analysis steps (middle column, showing calculations and selections):
1. Identify desirable transitions
* Select transitions with a limited loss of earnings (derived from "Viable transitions" and "Salary").
* Calculate the COVID-19 exposure score (derived from "Physical proximity", "Remote Labor Index", and "Occupational data").
* Select transitions with a smaller exposure score (derived from "Calculate the COVID-19 exposure score").
Outputs (right column, derived from analysis steps):
* Desirable transitions (derived from "Select transitions with a limited loss of earnings").
* Transitions reducing impact from COVID-19 (derived from "Select transitions with a smaller exposure score").
Identifying safe transitions
The final essential factor in our transition recommendation algorithm is that the risk of automation ought to be reduced in the destination job (see Figure 16, page 34). Instead of defining a specific amount of risk reduction, we apply the simple heuristic that the destination job should not be in the category of occupations that we have found to be at 'high risk' of automation. Occupations in this category have an especially high estimated risk and low proportion of bottleneck tasks. We slightly modify this heuristic depending on the analysis context.
When the scope of our analysis is limited to only the occupations in the 'high risk' category, we defined an additional stricter condition that the destination occupation must also have a lower risk estimate and a higher prevalence of bottleneck tasks. This ensures that the transition reduces both aspects of automation risk and thus produces more robust recommendations. When considering the transitions out of other, lower-risk occupations, this additional stricter condition is, however, unfair because workers in these low-risk occupations don't necessarily need to further lower their automation risk; in fact, this would unnecessarily decrease their transition options. In the following sections, we specify the exact criteria used for each discussed case.
Figure 16. Step 5: Identifying safe transitions
This diagram illustrates the process of identifying safe job transitions.
Note: The white output box indicates the output that is used when comparing occupations in the 'high risk' category versus occupations in the lower-risk categories. Otherwise (when the analysis is limited to high-risk occupations) we use the stricter criteria for transition to both reduce the automation risk and increase the prevalence of bottleneck tasks.
Input data (left column):
* Desirable transitions
* Automation risk estimates
* Occupational data
Analysis steps (middle column):
1. Identify safe transitions
* Select destinations that are not at high risk of automation (derived from "Desirable transitions" and "Automation risk estimates").
* Select destinations that reduce automation risk AND increase the prevalence of bottleneck tasks (derived from "Desirable transitions" and "Automation risk estimates").
Outputs (right column):
* Safe and desirable transitions (used when comparing high-risk and lower-risk occupations)
* Safe and desirable transitions
Feature Box 2: Examples of identified transitions for concierge workers
Hotel concierges are at a high risk of automation – indeed, already back in 2016, IBM deployed a concierge robot named Connie, powered by its AI engine Watson, to a Hilton hotel in the US. While customers still prefer human concierges, the adoption of humanoid service robots is rising along with other technological solutions such as check-in machines and concierge apps. Moreover, for concierges working in the hospitality industry, the looming threat of automation is compounded by the economic impact from COVID-19.
Our algorithm has identified almost 20 potential safe and desirable transitions for concierge workers (Figure 17, page 35). Here, we elaborate on three cases that exemplify the trade-offs of different transitions (Figure 18, page 36).
The first case is a highly viable transition to the hotel porter occupation, which has a good match of skills while being a physically more demanding role (which renders it less susceptible to automation). Hotel porter jobs, however, are also highly likely to be affected by COVID-19, and they have only two safe transitions to other occupations, which adds the risk of being stuck in this occupation.
The second case is a transition to the customer experience manager occupation, which still uses some of the concierge's skills but also involves more managerial and strategic skills and activities. While this transition is more challenging, it comes with a potentially significant pay raise. With six other safe transitions, customer experience managers are also less isolated from other occupations than hotel porters.
The third case is a transition to the social security officer occupation, which is a broadly similar role with a poor match of specific skills and knowledge but similar emphasis on communication and activities related to assisting and providing information and support. While the pay rise is more moderate compared to the transition to customer experience manager, this role has 11 other safe transitions, thus potentially opening more pathways for future career transitions.
Figure 17. Uncovered safe and desirable transition options for the hotel concierges
Notes: The transitions are ranked such that the destination occupations at the top of the list have a greater overlap of the specific essential and optional skills. Conversely, occupations towards the bottom of the list are similar to the concierge in a broader sense, in terms of their general types of work activities and the interpersonal, physical and structural context of the work.
This diagram shows a vertical list of occupations representing safe and desirable transition options for Hotel concierge.
- An arrow labeled "Similar specific skills" points upwards from "Hotel concierge" towards the top of the list.
- An arrow labeled "Similar general types of work activities" points downwards from "Hotel concierge" towards the bottom of the list.
- A vertical arrow labeled "Similarity" spans the entire list from top to bottom.
The list of occupations, from most similar specific skills to most similar general work activities, is:
* Doorman/doorwoman
* Hotel porter
* Club host/club hostess
* Customer experience manager
* Hospitality entertainment manager
* Funeral attendant
* Rooms division manager
* Travel agency manager
* Advertising specialist
* Railway station manager
* Customer contact centre information clerk
* Advertising media buyer
* ICT help desk agent
* Consumer rights advisor
* Customer service representative
* Lottery operator
* Private detective
* Social security officer
Figure 18. More details on the skills gaps and impact from COVID-19 for three safe and desirable transitions for hotel concierges
Note: The 'occupation similarity' percentages indicate the combined similarity measure between the hotel concierge and other occupations.
This infographic compares three transition options from Hotel concierge (£19,000, High impact from COVID-19) to other occupations, detailing skills match and COVID-19 impact.
Hotel porter (60% Occupation similarity)
* £21,000
* High impact from COVID-19
* ✅ Good overall skills match: Both occupations share skills to greet guests, maintain customer service and assist clients with special needs
* ❌ Involves more physical skills and activities, and spending more time outdoors and walking
Customer experience manager (35% Occupation similarity)
* £38,800
* Lower impact from COVID-19
* ✅ Similarly strong emphasis on activities and skills related to communication, such as to maintain customer service, manage customer experience, monitor customer behaviour, and handle customer complaints
* ☑ Involves more management skills and activities such as developing objectives and strategies, and there is a stronger emphasis on information skills, such as to measure customer feedback and to analyse business objectives and data about clients
Social security officer (33% Occupation similarity)
* £28,700
* Lower impact from COVID-19
* ✅ Similar emphasis on communication, assisting and providing information and support
* ❌ Poor match of specific skills and knowledge, particularly knowledge of social security law and government social security programmes, and skills to investigate social security applications and administering appointments
Skills analysis
To identify skills that facilitate transitions away from high automation risk, we developed two novel approaches that use our detailed occupational profiles together with the transition recommendation algorithm. These methods are a step towards generating highly specific, data-driven reskilling and upskilling advice for practical and actionable career guidance.
Identifying core skills that expand workers' transition options
We developed a new approach to measure the potential impact of upskilling on workers' range of transitions. Using methods from network science, we identified 100 core skills which reflect the central competencies for a wide range of jobs (Table 1, page 38). To further evaluate the impact of adopting a new core skill, these were added, one at a time, to the skills set of each high-risk occupation and the similarities with other occupations were recalculated. We then evaluated the number of new safe and desirable transitions that emerged as a result of learning each skill. This analysis can, in principle, be carried out for all ESCO skills (and potentially even skills outside of the ESCO data set), but we have presently restricted our scope due to the computational requirements that such an exercise would entail.
Note that the pre-selected core skills are, as expected, rather general, and as such they are complementary to the skills set that the workers already possess. Our expectation was that the transition destinations unlocked by the upskilling would already be somewhat similar to the origin occupation and that the addition of a core skill would help the transition to cross the viability threshold.
| ESCO skill |
Description |
| Use different communication channels |
Make use of various types of communication channels such as verbal, handwritten, digital and telephonic communication with the purpose of constructing and sharing ideas or information. |
| Train employees |
Lead and guide employees through a process in which they are taught the necessary skills for the prospective job. Organise activities aimed at introducing work and systems or improving the performance of individuals and groups in organisational settings. |
| Manage staff |
Manage employees and subordinates, working in a team or individually, to maximise their performance and contribution. Schedule their work and activities, give instructions, motivate and direct the workers to meet the company objectives. Monitor and measure how an employee undertakes their responsibilities and how well these activities are executed. Identify areas for improvement and make suggestions or how to achieve this. Lead a group of people to help them achieve goals and maintain an effective working relationship among staff. |
| Manage budgets |
Plan, monitor and report on the budget. |
| Communicate with customers |
Respond to and communicate with customers in the most efficient and appropriate manner to enable them to access the desired products or services, or any other help they may require. |
| Create solutions to problems |
Solve problems which arise in planning, prioritising, organising, directing/facilitating action and evaluating performance. Use systematic processes of collecting, analysing and synthesising information to evaluate current practice and generate new understandings about practice. |
| Write work-related reports |
Compose work-related reports that support effective relationship management and a high standard of documentation and record keeping. Write and present results and conclusions in a clear and intelligible way so they are comprehensible to a non-expert audience. |
| Comply with quality standards |
Comply with the national and international requirements, specifications and guidelines to ensure that products, services and processes are of good quality and fit for purpose. |
| Identify customers' needs |
Use appropriate questions and active listening in order to identify customer expectations, desires and requirements according to products and services. |
| Liaise with managers |
Liaise with managers of other departments, ensuring effective service and communication, i.e. sales, planning, purchasing, trading, distribution and technical. |
| Perform project management |
Manage and plan various resources (such as human resources) budget, deadlines, results and quality necessary for a specific project, and monitor the project's progress in order to achieve a specific goal within a set time and budget. |
| Be familiar with mechanics |
Theoretically and practically apply the science studying the action of displacements and forces on physical bodies to the development of machinery and mechanical devices. |
| Troubleshoot |
Identify operating problems, decide what to do about them and report accordingly. |
| Adhere to organisational guidelines |
Adhere to organisational or department-specific standards and guidelines. Understand the motives of the organisation and the common agreements and act accordingly. |
| Recruit employees |
Hire new employees by scoping the job role, advertising, performing interviews and selecting staff in line with company policy and legislation. |
Table 1. Fifteen core skills (out of 100) whose impact on opening new transition opportunities was evaluated
Note: Skills descriptions are from the ESCO database.
Identifying workers' skills gaps
Our approach for measuring the similarity between occupations also allows us to identify the detailed skills gaps that a worker may need to fill as they move from one occupation to another. For each transition, we can calculate 'matching scores' for the best-matching skill pairs between the origin and destination occupations (Figure 19, page 40). Low-matching scores help to identify the biggest skills gaps. This information can sharpen the focus of workers' reskilling efforts.
This approach can be extended to evaluate a collection of transition pathways – for example, we might be interested in summarising the skills gaps for all transitions out of a specific occupation. The most effective reskilling would focus on the most prevalent skills gaps – that is, the skills that have a below-average matching score across a large number of transitions.
Figure 19. Illustration for skills gap analysis for a single job transition and a collection of transitions
Note: The best-matching skill pairs are found using NLP techniques to measure the semantic similarity of skills descriptions (see the section on 'NLP-adjusted overlap for comparing skills sets' in the Appendix for more detail).
This diagram illustrates the process of determining best-matching skill pairs using NLP to analyze skills gaps.
Determine the best-matching skill pairs using NLP (Left and Center):
* Origin skills set (left column) and Destination skills set (center column) are shown with examples:
* Skill 1 (Origin) matches Skill 1 (Destination) with a Score of 1.00.
* Skill 2 (Origin) matches Skill 5 (Destination) with a Score of 0.90.
* Skill 3 (Origin) matches Skill 6 (Destination) with a Score of 0.10.
* Skill 4 (Origin) matches Skill 7 (Destination) with a Score of 0.00.
* The "Score" column has a label "Transition skills gaps" below it.
Average matching scores across a collection of transitions (Middle):
* An arrow from the individual scores points to a horizontal bar chart icon representing aggregation.
All destination skills (right column):
* The aggregated average matching scores are then applied to all destination skills, showing a similar scoring pattern:
* Skill 1: 1.00
* Skill 22: 1.00
* Skill 18: 0.01
* Skill 7: 0.00
* The "Score" column for aggregated skills has a label "Aggregated skills gaps" below it.
Limitations
Data
- The analysis assumes that O*NET captures all important job attributes and that these are fundamentally the same in European countries.
- The estimates of automation risk rely on an accurate mapping between O*NET and ESCO occupations. To the best of our knowledge, there are no established crosswalks between the two frameworks. We publish the crosswalk produced by the authors, allowing others to use it and suggest improvements.
- An inherent limitation in using a crosswalk is that a single O*NET occupation can be mapped to several related ESCO occupations, as ESCO characterises a larger number of roles. Applying the same automation risk estimate to all ESCO occupations mapped to the same O*NET code might conceal the more nuanced differences among those ESCO occupations. However, the many-to-one approach allows us to analyse the relationships to a larger number of ESCO occupations and arrive at more granular career transition recommendations.
Measuring automation risk
- As stated in the original study by Brynjolfsson et al., the estimates of risk provided are based on whether automation of a task is technically feasible. However, other factors (e.g. legal, cultural, financial or organisational factors) will affect both the adoption of AI and workers' ability to adjust.
- We are measuring relative, not absolute, risk of automation. While we can compare risk between occupations, we are not able to predict the likelihood that a given job will be automated.
- As currently defined, the automatability of tasks and work activities does not reflect the impact of robotics. This means that we are likely underestimating the risk of workers being displaced by technology.
Demographic analysis
- This study generates automation risk estimates for highly granular occupations (five-digit ISCO occupations). However, EU LFS reports workers' occupation only at the level of broad occupational groups (three-digit minor ISCO occupations). Because of this, the demographic profiles of workers at high risk of automation are less precise due to more detailed occupations being combined into broader groups.
- Demographic analysis assessed demographic characteristics independently, and interactions between them have not been explored.
Recommending job transitions
- While our approach attempts to incorporate a range of aspects important to career transitions, we do not account for all potential barriers to worker mobility. Therefore, the uncovered transition recommendations should be seen as an essential first step to appreciating the full range of workers' career transition possibilities.
- The analysis assumes that workers possess only (and all) the skills of their current occupation. In reality, each worker will have their own labour market journey that has endowed them with a unique collection of skills and experience. While our present goal is to uncover general trends about occupations, specifically tailored transition recommendations will be crucial to provide the best possible advice and guidance to individuals.
- Our career transition algorithm does not incorporate country-specific information when generating transition recommendations. While there is evidence for differences between countries with respect to the general cognitive and task-based skills of workers in the same occupations, our transition recommendations are based on more narrowly defined occupations, and hence the within-occupation differences can be expected to be smaller. Therefore, we expect our transition recommendations to be valid across different European countries.
- To evaluate transition desirability, we used indicative estimates of the annual earnings of UK workers. While salaries will be different across Europe, we expect the relative levels of compensation to remain largely similar; moreover, we have kept the criterion for discarding transitions based on salary differences relatively lenient. In the practical setting, the recommendation algorithm can easily be linked to more specific and timely regional earnings data.
- Transition desirability indicators that have not been included in our analysis will also play an important role, such as, for example, the present employment and future prospects of growth. However, we refrained from using these indicators, as we expect strong regional differences to exist. Going forward, the transition recommendation framework should be supplemented with local data on vacancies and employment forecasts for each occupation.
- Skills analysis relies on the ESCO skills pillar and hence carries with it the same limitations as the framework itself. While it is a very comprehensive and inclusive expert-designed database, as such it has the usual limitation of gradually becoming out of date, especially with respect to quickly changing disciplines, such as software development. Ultimately, for best results, the breadth and depth of the ESCO framework should be married with the timeliness of other labour market information, such as job adverts.
- Due to computational requirements, the identification of skills that open up new opportunities for workers is presently restricted to the identified 100 core skills, and it cannot be ruled out that other potentially effective skills have been overlooked.
- While our criteria for transition viability do include the requirement of comparable levels of education and experience, the analysis does not assess the difficulty or cost of bridging specific skills gaps.
Results
Part A: Identifying workers at high risk
The analysis of the tasks and work activities in European occupations suggests that certain jobs face a particularly high risk of automation. These jobs include sales and customer service workers, financial and mathematical associate professionals as well as administrative and business clerks. The primary driver of automation risk for these occupations is the extent to which they involve interacting with computers, one-way routine communication with people, monitoring resources and analysing data. This information could be communicated to workers and to young people starting their careers to help them spot the signs of a job that is at high risk of automation.
The findings also emphasise the importance of tracking the impact of future developments in AI and technology on tasks. A leap forward in robotics would substantially raise the risk of automation for a number of occupations. These occupations are currently protected by tasks that require physical movement and high levels of dexterity which, at present, are difficult to automate. Advances in automation would mean that these tasks would no longer act as a bottleneck to automation. More broadly, insights on activities that raise and lower automation risk can inform job redesign initiatives. Complemented by a more in-depth study of activities that are augmented by AI, such knowledge can be used to bundle tasks into jobs in a way that both leverages AI and sustains demand for labour.
Analysis of employment statistics for France, Italy and the UK shows that a significant proportion of workers are currently employed in occupations facing a high risk of disruption due to automation. Importantly, the exposure to automation risk is unequal. Adverse impacts of automation are unevenly distributed across countries, regions and demographic groups.
A closer examination of high-risk occupations found that retail and customer service workers along with administrative and business clerks make up the bulk of jobs in this category.
More generally, the types of occupations that are associated with a high risk of automation are closely linked to work activities performed in those jobs. By examining the tasks required in high- and low-risk occupations, we have identified the types of activities that raise and lower automation risk as well as the tasks that may protect jobs from automation.
Automation risk by occupation
Certain occupations emerged from the analysis as facing particularly high risk of automation (Table 2, page 44). As described earlier, these occupations not only have a higher overall risk than others but they also have a low number of tasks that are difficult to automate, which could slow the automation process (Figure 20, page 45; Table 3, page 45).
A note on creative occupations
A special note of caution is in order around the interpretation of these results for creative occupations, which include roles within the Arts and Media sector and the IT sector. A small number of creative occupations are estimated to be at high risk of automation; in particular, multimedia artist roles such as animators, digital artists and illustrators.
These estimates come about as Brynjolfsson et al. consider a high proportion of tasks in these roles to be suitable for machine learning. Many of these tasks relate to creating computer-generated graphics or animation, and there have been significant recent advances in applying machine learning to these areas of creative work. That said, our estimates for these occupations may be distorted by the limited granularity of the O*NET occupational framework, which forms the basis of the task automation scores. All of these roles were matched to the same O*NET occupation of 'multimedia artists and animators'. This may have prevented us from uncovering more nuanced differences between these creative occupations.
A broader point to bear in mind is that the actual likelihood of automation is a function of two factors: the suitability of tasks for automation and the extent of barriers that may prevent automation. This study focuses exclusively on the former and does not consider the cultural, societal or financial barriers that may prevent automation. In the creative industries, a specific barrier comes from the expectation that 'creative tasks' stem from individuals and not machines. One example of this barrier in action is for the role of a Composer. Already, it is possible to compose music by machine, and in this study many of the tasks attributed to this role are found to be suitable for machine learning. However, the demand for such computer-generated music is limited and, as such, the occupation is unlikely to be automated.
| Occupation |
ISCO code |
Risk of automation (1-5) |
Prevalence of bottleneck tasks (0-1) |
Occupation |
ISCO code |
Risk of automation (1-5) |
Prevalence of bottleneck tasks (0-1) |
| Highest automation risk |
|
|
|
Lowest automation risk |
|
|
|
| Hotel concierge |
4229 |
3.90 |
0.26 |
Massage therapist |
3255 |
2.78 |
1.00 |
| Drafter |
3118 |
3.90 |
0.34 |
Plasterer |
7123 |
3.14 |
0.93 |
| Funeral services director |
5163 |
3.89 |
0.28 |
Dancer |
2653 |
3.15 |
0.92 |
| Investment clerk |
4312 |
3.78 |
0.39 |
Prepared meat operator |
8160 |
3.15 |
1.00 |
| Animator |
2166 |
3.74 |
0.47 |
Forestry equipment operator |
8341 |
3.15 |
0.90 |
| Usher |
9629 |
3.74 |
0.29 |
Stonemason |
7113 |
3.18 |
0.89 |
| File clerk |
4415 |
3.73 |
0.35 |
Automated cable vehicle controller |
8343 |
3.18 |
0.92 |
| Auditing clerk |
4312 |
3.72 |
0.36 |
Bricklayer |
7112 |
3.20 |
0.91 |
| Desktop publisher |
2166 |
3.72 |
0.12 |
Animal handler |
5164 |
3.20 |
0.90 |
| Bank teller |
4211 |
3.71 |
0.29 |
Professional athlete |
3421 |
3.21 |
0.87 |
| Telephone switchboard operator |
4223 |
3.71 |
0.47 |
Pile driving hammer operator |
8342 |
3.22 |
1.00 |
| Human resources officer |
2423 |
3.70 |
0.26 |
Dredge operator |
8342 |
3.23 |
1.00 |
| Medical transcriptionist |
3344 |
3.70 |
0.07 |
Hardwood floor layer |
7122 |
3.23 |
1.00 |
| Administrative assistant |
3343 |
3.70 |
0.21 |
Train preparer |
8312 |
3.23 |
0.92 |
| Property appraiser |
3315 |
3.70 |
0.32 |
Tyre fitter |
7231 |
3.24 |
0.97 |
| Door to door seller |
5243 |
3.69 |
0.09 |
Firefighter |
5411 |
3.25 |
0.92 |
| Amusement and recreation attendant |
9629 |
3.68 |
0.28 |
Make-up and hair designer |
5142 |
3.26 |
0.90 |
| Child day care centre manager |
1341 |
3.68 |
0.42 |
Helmsman |
3152 |
3.27 |
0.89 |
| Rental service representative |
5249 |
3.68 |
0.13 |
Energy conservation officer |
3112 |
3.27 |
0.94 |
| Data entry clerk |
4132 |
3.68 |
0.35 |
Chemical mixer |
8131 |
3.28 |
0.89 |
Table 2. Representative high-risk ESCO occupations with the highest overall risk of automation (left) and low-risk occupations with the lowest overall risk of automation (right)
Note: In the cases where several ESCO occupations were mapped to the same O*NET occupation, one exemplar ESCO occupation is shown. For the full list of high-risk ESCO occupations, please see the Appendix.
Figure 20. Overall automation risk and prevalence of bottleneck tasks across ESCO occupations
Note: High-risk occupations are shown in red and low-risk occupations in green.
This is a scatter plot showing "Prevalence of bottleneck tasks" on the Y-axis (from 0.0 to 1.0) and "Overall automation risk" on the X-axis (from 3.0 to 4.0).
- High risk occupations are marked in red dots.
- Low risk occupations are marked in green dots.
- Other occupations are likely represented by the remaining grey dots.
Several occupations are labelled on the plot:
* In the low-risk (green) cluster: Plasterer, Dancer, Forestry equipment operator, Sports official.
* In the high-risk (red) cluster: Phlebotomist, Driving instructor, Animator, Investment clerk, Drafter, Hotel concierge, Medical transcriptionist.
The plot visually separates high-risk occupations (lower prevalence of bottleneck tasks, higher automation risk) from low-risk occupations (higher prevalence of bottleneck tasks, lower automation risk).
|
High-risk occupations |
Low-risk occupations |
Remaining occupations |
| Mean risk of automation* |
3.62 |
3.33 |
3.47 |
| Mean prevalence of bottleneck tasks |
32% |
91% |
64% |
| Number of occupations |
217 |
181 |
1,229 |
Table 3. Comparison of high-risk, low-risk and remaining occupations
Note: *Risk of automation can vary between 1 and 5, with 5 referring to the highest level of risk.
Automation risk tends to be raised by activities such as interacting with computers, one-way routine interactions with people, monitoring resources and analysing data (Table 4, page 46). This result is in line with previous studies which found that activities with significantly higher automation potential were primarily related to collecting and processing data, as well as performing physical activities and operating machinery in predictable environments. The study by McKinsey also found that the proportion of time spent by US workers on high-risk activities accounted for just over half of total working hours. Assuming that a comparable proportion of time is spent on these activities in European countries, the scale of potential disruption and need for job redesign is very high.
The risk is lowered by activities that require non-routine engagement with the public, knowledge-building, resolving conflicts and negotiating, and, more broadly, those activities that involve operating in dynamic uncontrolled environments. In previous research, the automation potential of these types of activities was also estimated as low. Specifically, these included activities related to managing people, applying expertise, interfacing with stakeholders and operating in unpredictable environments.
PART A: IDENTIFYING WORKERS AT HIGH RISK
Table 4. Top five broad activities that raise the risk of automation and the top five that lower the risk of automation
| Activities that raise risk (most risky detailed work activities shown)* |
Activities that lower risk (safest detailed work activities shown)* |
| Interacting with computers: |
Performing for or working directly with the public: |
| 1. Enter information into databases or software programmes. |
1. Resolve customer complaints or problems. |
| 2. Update computer database information. |
2. Entertain the public with comedic or dramatic performances. |
| 3. Troubleshoot issues with computer applications or systems. |
3. Respond to customer problems or complaints. |
| Communicating with people outside organisation: |
Operating vehicles, mechanised devices or equipment: |
| 1. Represent the interests of clients in legal proceedings.** |
1. Navigate water vessels. |
| 2. Testify at legal or legislative proceedings. |
2. Operate vehicles or material-moving equipment. |
| 3. Inform individuals or organisations of status or findings. |
3. Operate ships or other watercraft. |
| Selling or influencing others: |
Updating and using relevant knowledge: |
| 1. Sell products or services. |
1. Maintain medical or professional knowledge. |
| 2. Distribute promotional literature or samples to customers. |
2. Update knowledge about emerging industry or technology trends. |
| 3. Merchandise healthcare products or services. |
3. Research topics in areas of expertise. |
| Monitoring and controlling resources: |
Resolving conflicts and negotiating with others: |
| 1. Prescribe medications. |
1. Arbitrate disputes between parties to resolve legal conflicts. |
| 2. Collect deposits, payments or fees. |
2. Negotiate sales or lease agreements for products or services. |
| 3. Monitor availability of equipment or supplies. |
3. Resolve operational performance problems. |
| Analysing data or information: |
Controlling machines and processes: |
| 1. Analyse market conditions or trends. |
1. Operate pumping systems or equipment. |
| 2. Analyse business or financial data. |
2. Operate mixing equipment. |
| 3. Analyse design or requirements information for mechanical equipment or systems. |
3. Operate cranes, hoists or other moving or lifting equipment. |
Notes: *For each broad work activity, the top three detailed work activities are shown. **Interestingly, among the detailed work activities that raise automation risk by the greatest amount, we found two activities that were related to legal proceedings in the category 'communicating with people outside organisation'. Other risky examples under this broader category included presenting information to the public by reporting news, providing transportation information to passengers or customers, and answering telephones. This suggests that, when judging automation risk, the SML rubric used by Brynjolfsson et al. has put most emphasis on the task of presenting information in legal activities. It appears to have overlooked the more complex tasks that underpin the activity and relate to representing the interests of clients, such as making complex arguments to judges and juries and questioning witnesses during a trial.
Figure 21. Most common task automation bottlenecks
Note: The bottlenecks correspond to the different dimensions of automation specified in the questionnaire by Brynjolfsson et al.^(76)
The chart displays various task automation bottlenecks and their respective percentages:
* Requires high dexterity: 61.9%
* Requires physical labour and movement: 56.2%
* Is not error tolerant: 12.8%
* Requires human connection: 10.7%
* Requires complex conversations: 10.1%
* Cannot be completed in a second or less: 9%
* Requires a wide range of complex actions and outputs: 8.9%
* Requires complex, abstract reasoning: 8.8%
* Is not focused on ranking, sorting, grouping or predicting: 8.3%
* Requires long-term planning: 7.3%
* Involves the need to explain decisions: 5.9%
* Is not highly routine and not repeated frequently: 3.3%
* Is not about matching information to concepts, labels, etc.: 3.1%
* Information is not machine-readable: 2.8%
* Is not describable with rules: 2.4%
* Information is not recorded or recordable by computer: 2.3%
* Each task completion is different and cannot be measured: 2.1%
* Actions need not be completed in a specific order: 2.1%
* Feedback is not immediate: 1.9%
* Does not involve working with data: 0.5%
It is important to note, however, that even work activities that generally lower the risk of automation contain individual tasks that are highly automatable. As a result, automation risk may vary between apparently similar types of tasks and activities. For instance, while our findings confirm that many tasks that require interaction and social intelligence lower automation risk, we find that not all interactive tasks and people-facing roles are safe. Consider a task which falls under the broad activity of 'selling and influencing others': 'plan, describe, arrange, and sell itinerary tour packages and promotional travel incentives offered by various travel carriers.' The task requires interaction; however, much of it involves giving and receiving factual information. As a shift in consumer behaviour towards booking holidays online illustrates, this task has been replaced by travel deal comparison websites.
Such findings illustrate the need for a nuanced analysis of automatability of tasks, including those that appear to perform similar types of activities. Through careful examination of bundles of tasks, such analysis may identify opportunities for replacing higher-risk tasks with lower-risk alternatives, even in the case of occupations that are highly automatable as a whole.
Another important consideration is the presence of bottleneck tasks, mentioned earlier. These have certain aspects which protect the task from automation. The most common types of bottleneck tasks fall under two categories (Figure 21). The first category includes tasks that require dexterity, physical labour and movement. The second category includes tasks that have low tolerance to error or require abstract thinking, long-term planning or human connection.
Table 5. Ten occupations that experience the largest increase in risk if physical movement and dexterity are no longer barriers to automation
| ESCO occupation |
ISCO code |
Increase in automation risk |
Current prevalence of bottleneck tasks |
Hypothetical prevalence of bottleneck tasks |
Current risk category |
| Rigger |
7215 |
7% |
100% |
0% |
Low risk |
| Construction scaffolder |
7119 |
7% |
95% |
0% |
Other |
| Diesel engine mechanic |
7231 |
6% |
100% |
0% |
Low risk |
| Pile driving hammer operator |
8342 |
6% |
100% |
0% |
Low risk |
| Automotive brake technician |
7231 |
6% |
95% |
0% |
Low risk |
| Automated cable vehicle controller |
8343 |
6% |
92% |
0% |
Low risk |
| Livestock worker |
9212 |
6% |
100% |
8% |
Low risk |
| Dismantling worker |
7214 |
5% |
87% |
0% |
Other |
| Tyre fitter |
7231 |
5% |
97% |
0% |
Low risk |
| Vehicle technician |
7231 |
5% |
100% |
5% |
Low risk |
Advances in robotic innovation pose a hidden threat to many occupations
Bottleneck tasks should be studied further. On the one hand, new bottleneck tasks might emerge as legal, ethical and cultural constraints are imposed on the process of automation. On the other hand, some of the existing bottleneck tasks might disappear due to developments in AI and robotics.
A leap forward in robotics would substantially raise the risk of automation for a number of occupations in construction and manufacturing. These occupations are currently protected by tasks that require physical movement and high levels of dexterity which, at present, are difficult to automate. Advances in robotics would mean that these tasks would no longer act as a bottleneck to automation. For some occupations, such as vehicle technicians, this could mean that the proportion of tasks that are difficult to automate for this job changes from 100 per cent to 5 per cent (Table 5).
Currently, there are no occupations that don't contain any bottleneck tasks. However, if we were to assume that physical movement and dexterity are no longer barriers to automation, 530 occupations (almost a third) lose all bottleneck tasks (Figure 22, page 49). Of those, 250 are currently considered to have low risk of automation.
Figure 22. Prevalence of bottleneck tasks across ESCO occupations currently (with physical bottlenecks) and in the case of rapid advancements in robotics (when requirements for dexterity or physical movement are no longer bottlenecks to automation)
Note: The red and green dots highlight occupations listed in Table 5, page 48 which would experience the largest increase in automation risk.
The chart is a scatter plot showing "Prevalence of bottleneck tasks" on the y-axis (0.0 to 1.0).
It visualizes two clusters of occupations:
1. Occupations with physical bottlenecks: A cluster of green and grey dots on the left, generally showing higher prevalence of bottleneck tasks. Specific occupations like "Vehicle technician" and "Tyre fitter" are highlighted in green within this cluster.
2. Occupations without physical bottlenecks: A cluster of red and grey dots on the right, generally showing lower prevalence of bottleneck tasks. Specific occupations like "Vehicle technician" and "Tyre fitter" are highlighted in red within this cluster, indicating a shift after removing physical bottlenecks.
An arrow labeled "Removing physical bottlenecks" illustrates the conceptual shift from the higher prevalence to lower prevalence for these occupations when physical bottlenecks are no longer a barrier.
Table 6. Employment across risk categories in France, Italy and the UK
|
France |
Italy |
UK |
|
Employment
(thousands) |
Share of
employment (%) |
Employment
(thousands) |
| High risk |
4,401 |
17% |
5,210 |
| Low risk |
3,643 |
14% |
3,433 |
| Other |
18,357 |
70% |
13,841 |
Note: Shown are average indicators for 2014-2018. Due to rounding, percentages may not add up to 100.
Table 7. Ten broad occupational groups (three-digit ISCO occupations) that have the highest relative risk in France, Italy and the UK (employment data in thousands)
| Minor occupational group |
ISCO code |
France |
Italy |
UK |
| Sales, marketing and development managers |
122 |
194 |
24 |
296 |
| Financial and mathematical associate professionals |
331 |
261 |
684 |
477 |
| Sales and purchasing agents and brokers |
332 |
588 |
553 |
236 |
| General office clerks |
411 |
512 |
803 |
192 |
| Keyboard operators |
413 |
18 |
47 |
41 |
| Client information workers |
422 |
229 |
390 |
849 |
| Numerical clerks |
431 |
501 |
304 |
532 |
| Shop salespersons |
522 |
1,118 |
1,436 |
1,527 |
| Cashiers and ticket clerks |
523 |
183 |
145 |
206 |
| Other sales workers |
524 |
192 |
150 |
247 |
Notes: Shown are average statistics on employment in 2014-2018 (inclusive). For each country, the three largest at-risk occupational groups are highlighted in red.
Automation risk by geography
Analysis of employment data from the EU LFS suggests that across France, Italy and the UK, 16-23 per cent of workers are employed in high-risk occupations. According to the estimates shown in Table 6, a greater proportion of workers appears to be facing high automation risk in Italy than in France or the UK. At the same time, the UK has a lower proportion of workers in low-risk categories.
Across the three countries, some of the largest high-risk occupational groups are shop salespersons, general office clerks and financial and mathematical associate professionals^(79) (Table 7). Occupations that have a relatively low risk are shown in Table 8, page 51.
Table 8. Ten broad occupational groups (three-digit ISCO occupations) that have the lowest relative risk in France, Italy and the UK (employment data in thousands)
| Minor occupational group |
ISCO code |
France |
Italy |
UK |
| Animal producers |
612 |
234 |
92 |
140 |
| Building frame and related trades workers |
711 |
511 |
516 |
606 |
| Building finishers and related trades workers |
712 |
259 |
292 |
394 |
| Machinery mechanics and repairers |
723 |
285 |
357 |
482 |
| Electrical equipment installers and repairers |
741 |
221 |
284 |
265 |
| Wood treaters, cabinet makers and related trades workers |
752 |
73 |
131 |
60 |
| Mobile plant operators |
834 |
249 |
146 |
162 |
| Domestic, hotel and office cleaners and helpers |
911 |
1,659 |
1,077 |
625 |
| Agricultural, forestry and fishery labourers |
921 |
4 |
360 |
87 |
| Manufacturing labourers |
932 |
21 |
87 |
261 |
Note: Shown are average statistics on employment in 2014-2018 (inclusive).
There are variations in the level of exposure across regions of France, Italy and the UK (Figure 23, page 52). In France, the three regions with the highest share of at-risk workers are Poitou-Charentes and Corsica followed by Provence-Alpes-Côte d'Azur, with all three regions having approximately 18 per cent of workers in high-risk occupations. Conversely, Lower Normandy has the lowest percentage of at-risk workers at 14 per cent. In Italy, Sicily, Liguria and Lazio have the largest percentage (25 per cent), whereas Marche has the lowest (21 per cent). In the UK, the largest percentage of at-risk workers is in the North West region (17 per cent at risk) and the lowest is in the East Midlands (14.5 per cent). Moreover, we observed a general tendency for the northern parts of the UK to have a higher share of at-risk workers compared to the southern regions.
Figure 23. Local quotients indicating the regional variations in the percentage of workers in high-risk occupations compared to the national average
Notes: Darker red colours indicate regions where the share of workers in high-risk occupations is higher compared to the nationwide metric (national average corresponds to local quotient = 1). Lighter red colours indicate a lower share of at-risk workers. Data was available at the second level of the Nomenclature of Territorial Units for Statistics (NUTS) for France and Italy, and at the first level for the UK.
The figure displays three heatmaps for France, Italy, and the United Kingdom, visualizing the regional variations in the local quotient of high-risk occupations. A scale on the right indicates local quotient values ranging from 0.85 (lighter red) to 1.15 (darker red). Each map shows geographical regions shaded according to this scale, with darker red indicating a higher share of workers in high-risk occupations relative to the national average (quotient = 1).
The variation in exposure at country and regional levels is driven by differences in the industrial make-up of national and local economies. As shown in Figure 24, see page 53, the industries that employ the greatest number of at-risk workers are wholesale and retail trade; financial and insurance activities; professional, scientific and technical activities; public administration; and manufacturing. These measures of exposure reflect employment in 2014-2018 and do not incorporate the impact of the short-term shock of COVID-19. There is concern that certain industries as a whole might be at risk of both automation and the pandemic and that, consequently, workers in those industries might face a more rapid displacement than originally expected.^(80) We provide further detail on these occupations below. More broadly, COVID-19 might change the balance of factors that impede or facilitate adoption of automation. For example, face-to-face interaction and social intelligence might become less desirable, and jobs that rely on these attributes might become more susceptible to automation. Similarly, this might provide a greater incentive to innovators to develop AI for automating interactive tasks. As a result, the exposure of industries to automation is likely to change significantly over the coming years.
Figure 24. Employment of workers in high-risk occupations across industries in France, Italy and the UK
This chart displays the employment of workers (in thousands) in high-risk occupations across various industries in France, Italy, and the UK. The industries listed on the y-axis include:
- Agriculture, forestry and fishing
- Mining and quarrying
- Manufacturing
- Electricity, gas, steam and air conditioning supply
- Water supply; sewerage; waste management and remediation activities
- Construction
- Wholesale and retail trade; repair of motor vehicles and motorcycles
- Transporting and storage
- Accommodation and food service activities
- Information and communication
- Financial and insurance activities
- Real estate activities
- Professional, scientific and technical activities
- Administrative and support service activities
- Public administration and defence; compulsory social security
- Education
- Human health and social work activities
- Arts, entertainment and recreation
- Other services activities
For each industry, a horizontal bar indicates the number of workers (in thousands) for France (blue), Italy (green), and the UK (purple). The x-axis ranges from 0 to 2,000 thousand workers. For instance, "Wholesale and retail trade; repair of motor vehicles and motorcycles" shows the highest employment in high-risk occupations across all three countries, with Italy and the UK having significantly larger numbers compared to France.
Automation risk by demographic group
Analysis of employment in France, Italy and the UK demonstrates that some groups of workers are consistently at higher risk than others. As shown in Figure 25, women are disproportionately represented in occupations with high exposure to automation. This might be explained primarily by the higher prevalence of female workers in retail, which is among the industries facing the highest risk in all three countries.
On average, twice as many women are employed in high-risk occupations. The negative relationship between gender and employment in a high-risk job is observed for all countries over the years between 2014 and 2018 (inclusive). The findings are in line with previous UK research which found that women accounted for 70.2 per cent of workers in jobs with a high risk of automation.^(81)
At-risk workers are statistically more likely to work part time. Similar to gender, across France, Italy and the UK, workers employed in part-time jobs are consistently more likely to be employed in high-risk occupations (Figure 26). The risk difference is more pronounced in Italy and the UK, while the general pattern holds true for all three countries. Previous research from the UK Office for National Statistics has also found that part-time workers were disproportionately represented in high-risk occupations.^(82)
Figure 25. Breakdown of workers by risk category and gender
Note: Statistically significant: France (all years); Italy (all years); UK (all years).
This chart displays the percentage breakdown of workers by risk category (Low risk, Other, High risk) for female and male workers in France, Italy, and the UK.
For France:
* Female: 12% Low risk, 64% Other, 24% High risk
* Male: 15% Low risk, 75% Other, 10% High risk
For Italy:
* Female: 11% Low risk, 57% Other, 32% High risk
* Male: 19% Low risk, 64% Other, 17% High risk
For UK:
* Female: 5% Low risk, 74% Other, 21% High risk
* Male: 15% Low risk, 73% Other, 12% High risk
The x-axis represents "Percentage of workers" from 0% to 100%.
Figure 26. Breakdown of workers by risk category and working pattern
Note: Statistically significant: France (all years); Italy (all years); UK (all years).
This chart displays the percentage breakdown of workers by risk category (Low risk, Other, High risk) for full-time and part-time workers in France, Italy, and the UK.
For France:
* Full time: 12% Low risk, 72% Other, 16% High risk
* Part time: 22% Low risk, 57% Other, 21% High risk
For Italy:
* Full time: 14% Low risk, 65% Other, 21% High risk
* Part time: 20% Low risk, 49% Other, 31% High risk
For UK:
* Full time: 11% Low risk, 76% Other, 13% High risk
* Part time: 8% Low risk, 68% Other, 24% High risk
The x-axis represents "Percentage of workers" from 0% to 100%.
Figure 27. Breakdown of workers by risk category and income decile
Notes: As earnings are self-reported, for many respondents this information is missing. Statistically significant: France (all years); Italy (all years); UK (all years).
This chart displays the percentage breakdown of workers by risk category (Low risk, Other, High risk) across ten income deciles (1-10) for France, Italy, and the UK. The x-axis represents "Percentage of workers" from 0% to 100%.
For France:
* Decile 1: 30% Low risk, 54% Other, 16% High risk
* Decile 2: 22% Low risk, 53% Other, 25% High risk
* Decile 3: 18% Low risk, 58% Other, 24% High risk
* Decile 4: 17% Low risk, 62% Other, 21% High risk
* Decile 5: 14% Low risk, 67% Other, 19% High risk
* Decile 6: 12% Low risk, 70% Other, 18% High risk
* Decile 7: 8% Low risk, 75% Other, 17% High risk
* Decile 8: 6% Low risk, 81% Other, 13% High risk
* Decile 9: 4% Low risk, 85% Other, 11% High risk
* Decile 10: 3% Low risk, 86% Other, 11% High risk
For Italy:
* Decile 1: 35% Low risk, 44% Other, 21% High risk
* Decile 2: 25% Low risk, 47% Other, 28% High risk
* Decile 3: 20% Low risk, 55% Other, 25% High risk
* Decile 4: 18% Low risk, 57% Other, 25% High risk
* Decile 5: 15% Low risk, 60% Other, 25% High risk
* Decile 6: 13% Low risk, 63% Other, 24% High risk
* Decile 7: 11% Low risk, 67% Other, 22% High risk
* Decile 8: 10% Low risk, 70% Other, 20% High risk
* Decile 9: 8% Low risk, 72% Other, 20% High risk
* Decile 10: 4% Low risk, 76% Other, 20% High risk
For UK:
* Decile 1: 11% Low risk, 60% Other, 29% High risk
* Decile 2: 10% Low risk, 63% Other, 27% High risk
* Decile 3: 8% Low risk, 68% Other, 24% High risk
* Decile 4: 8% Low risk, 71% Other, 21% High risk
* Decile 5: 8% Low risk, 73% Other, 19% High risk
* Decile 6: 8% Low risk, 76% Other, 16% High risk
* Decile 7: 8% Low risk, 81% Other, 11% High risk
* Decile 8: 8% Low risk, 83% Other, 9% High risk
* Decile 9: 7% Low risk, 85% Other, 8% High risk
* Decile 10: 5% Low risk, 84% Other, 11% High risk
When we look at income, workers in low-paid jobs are more likely to be employed in occupations with a high risk of automation (Figure 27). In the UK, workers in the first quantile (deciles 1 and 2) of income distribution are about three times as likely to be at high risk than workers in the highest quantile (deciles 9 and 10). It is worth noting that the EU LFS might not be the most accurate source of information on income, as it records self-reported earnings. However, the findings do suggest that those who are at highest risk of job displacement may also be the ones with fewer financial resources to weather the disruption. The results are supported by previous research by Arntz et al.^(83)
The relationship between other demographic characteristics and employment in a high-risk job varies to a larger extent across the three countries. In terms of age, younger workers appear to be more at risk in the UK and France (Figure 28, page 56). While this is also the case in Italy, the difference is less pronounced. Previous UK research also found that young workers were proportionally more likely to be working in jobs at high risk of automation.^(84) However, the study suggested that younger workers do not stay in high-risk roles permanently, and many cycle out of at-risk occupations as their careers develop.
Figure 28. Breakdown of workers by automation risk category and age group
Note: Statistically significant: France (all years); Italy (all years); UK (all years).
This chart displays the percentage breakdown of workers by automation risk category (Low risk, Other, High risk) across various age groups (15-19, 20-24, ..., 70-74) for France, Italy, and the UK. The x-axis represents "Percentage of workers" from 0% to 100%.
For France:
* 15-19: 20% Low risk, 59% Other, 21% High risk
* 20-24: 13% Low risk, 64% Other, 23% High risk
* 25-29: 11% Low risk, 70% Other, 19% High risk
* 30-34: 11% Low risk, 72% Other, 17% High risk
* 35-39: 11% Low risk, 73% Other, 16% High risk
* 40-44: 13% Low risk, 71% Other, 16% High risk
* 45-49: 15% Low risk, 69% Other, 16% High risk
* 50-54: 17% Low risk, 68% Other, 15% High risk
* 55-59: 17% Low risk, 68% Other, 15% High risk
* 60-64: 18% Low risk, 67% Other, 15% High risk
* 65-69: 15% Low risk, 73% Other, 12% High risk
* 70-74: 10% Low risk, 76% Other, 14% High risk
For Italy:
* 15-19: 19% Low risk, 63% Other, 18% High risk
* 20-24: 14% Low risk, 60% Other, 26% High risk
* 25-29: 14% Low risk, 60% Other, 26% High risk
* 30-34: 15% Low risk, 60% Other, 25% High risk
* 35-39: 15% Low risk, 61% Other, 24% High risk
* 40-44: 15% Low risk, 62% Other, 23% High risk
* 45-49: 16% Low risk, 62% Other, 22% High risk
* 50-54: 17% Low risk, 61% Other, 22% High risk
* 55-59: 16% Low risk, 61% Other, 23% High risk
* 60-64: 15% Low risk, 64% Other, 21% High risk
* 65-69: 12% Low risk, 68% Other, 20% High risk
* 70-74: 11% Low risk, 68% Other, 21% High risk
For UK:
* 15-19: 11% Low risk, 58% Other, 31% High risk
* 20-24: 10% Low risk, 65% Other, 25% High risk
* 25-29: 10% Low risk, 72% Other, 18% High risk
* 30-34: 10% Low risk, 75% Other, 15% High risk
* 35-39: 9% Low risk, 77% Other, 14% High risk
* 40-44: 9% Low risk, 77% Other, 14% High risk
* 45-49: 10% Low risk, 77% Other, 13% High risk
* 50-54: 11% Low risk, 75% Other, 14% High risk
* 55-59: 11% Low risk, 75% Other, 14% High risk
* 60-64: 12% Low risk, 73% Other, 15% High risk
* 65-69: 12% Low risk, 72% Other, 16% High risk
* 70-74: 14% Low risk, 71% Other, 15% High risk
Similarly, in terms of educational attainment, workers in the UK with a lower secondary level of education are more disadvantaged than their counterparts in France and Italy (Figure 29, page 57). Having non-tertiary (upper secondary and post-secondary) educational attainment is also correlated with employment in a high-risk occupation. Surprisingly, in contrast to findings by Arntz et al., workers with tertiary education do not have a clear advantage in terms of their exposure to automation risk.^(85) This illustrates that a higher level of education does not necessarily safeguard workers against automation. As observed by Tolan et al., the so-called high-skill occupations, such as medical doctors and teachers, may be more exposed to AI progress than comparatively lower-skilled occupations, such as cleaners, waiters or shop salespersons.^(86) However, as shown later in the report (see 'A core group of skills can help at-risk workers to broaden their pool of transitions', page 71), there is a positive relationship between upskilling and the number of desirable career transitions that reduce the risk of automation.
Figure 29. Breakdown of workers by risk category and highest level of educational attainment
Notes: The 'upper secondary' category also includes post-secondary, non-tertiary education.^(87) Statistically significant: France (all years); Italy (all years); UK (all years).
This chart displays the percentage breakdown of workers by risk category (Low risk, Other, High risk) across different levels of educational attainment (Lower secondary, Upper secondary, Tertiary) for France, Italy, and the UK. The x-axis represents "Percentage of workers" from 0% to 100%.
For France:
* Lower secondary: 31% Low risk, 56% Other, 13% High risk
* Upper secondary: 18% Low risk, 64% Other, 18% High risk
* Tertiary: 3% Low risk, 80% Other, 17% High risk
For Italy:
* Lower secondary: 29% Low risk, 56% Other, 15% High risk
* Upper secondary: 12% Low risk, 56% Other, 32% High risk
* Tertiary: 2% Low risk, 81% Other, 17% High risk
For UK:
* Lower secondary: 18% Low risk, 63% Other, 19% High risk
* Upper secondary: 14% Low risk, 68% Other, 18% High risk
* Tertiary: 3% Low risk, 84% Other, 13% High risk
Part B: Helping high-risk workers transition to safer jobs
This section explores how workers who are at risk of automation can transition into safer jobs. We use granular data on occupations and skills to recommend desirable transitions and to provide insights on upskilling and potential skills gaps.
At-risk workers have fewer desirable transitions
We find that many workers will struggle to move out of high-risk jobs. Not only do these at-risk workers have slightly fewer transition options than lower-risk workers but many of their transitions are into jobs that are also at high risk of automation.^(88) Workers in sales and services, and clerical business and administration roles, are particularly likely to be affected by these two barriers to finding a lower-risk job. On a positive note, a person's level of education and training is positively associated with the number of transition options available to them, which points to the important role of upskilling in building workers' resilience to labour market disruptions. When a worker is moving jobs, they will first consider those occupations that require similar skills to their current job; we call such transitions 'viable'. Moreover, only a subset of the viable transitions will also be 'desirable' in that they will enable the worker to sustain a similar or higher standard of living. We found that workers in high-risk occupations have on average 26 per cent fewer desirable transitions compared to workers in lower-risk occupations^(89) (Figure 30). In terms of the median number of desirable transitions, the difference between lower-risk and high-risk occupations appears smaller, but it is still significant at 10 per cent^(90) (the median number of transitions being 30 and 27, respectively).
Figure 30. Lower-risk occupations have a higher average number of desirable transitions than high-risk occupations
Note: Error bars show 95 per cent confidence interval around the mean.
This bar chart compares the "Number of desirable transitions" (y-axis, 0 to 50) for "Lower risk" and "High risk" automation categories.
* Lower risk occupations show an average of approximately 42 desirable transitions.
* High risk occupations show an average of approximately 32 desirable transitions.
The chart visually represents that lower-risk occupations have a higher average number of desirable transitions compared to high-risk occupations.
Figure 31. The number of desirable transitions across all occupations
Note: Manufacturing and food and tobacco production occupations^(91) tend to have significantly more transitions compared to other occupations - such as sales and services occupations, many of which are at a high risk of automation.
This scatter plot displays the "Number of desirable transitions" (y-axis, 0 to 200) across occupations categorized by "High risk" and "Lower risk" on the x-axis. Different colored data points represent different occupational categories:
* Blue dots: Manufacturing
* Green dots: Food and tobacco production
* Purple dots: Sales and services
* Grey dots: Other
The chart shows that high-risk occupations (left side) generally have fewer desirable transitions, especially for "Sales and services" (purple dots). Lower-risk occupations (right side) show a wider spread, with "Manufacturing" and "Food and tobacco production" (blue and green dots) having a significantly higher number of desirable transitions, some exceeding 200. Specific examples like "Market vendor" and "Chocolate moulding operator" are labelled within the plot, with "Rubber products machine operator" at the very bottom right indicating a very high number of transitions.
If there is a leap forward in the development and adoption of more advanced robotics technology, some of the manufacturing and food production workers will likely see their risk of automation increase considerably. This, in turn, may reduce the disparity between the high- and lower-risk occupation transition options. Indeed, when automation risk estimates by Frey and Osborne have been used - which predict a relatively higher risk for occupations related to production and manufacturing as well - no major differences in the number of desirable transitions between high-and low-risk occupations were found, as long as automation risk of the destination occupations was not taken into account.^(93)
The desirable transitions for at-risk workers are not necessarily automation safe
Although the risk of automation varies across occupations, we found that jobs that require similar skills tend to face similar levels of risk. This means that even if an at-risk worker switches occupation, they may not necessarily reduce their exposure to automation risk. This increases the challenge of finding transitions for at-risk workers that are not only desirable but also lead to occupations that are safer from automation.
We show this challenge using a visualisation of the map of occupations in which the distances between occupations relate to their similarity (Figure 32). In this visualisation, occupations involving similar skills, types of work activities and work context are situated closer together. The proximities of occupations, therefore, approximately reflect the magnitude of reskilling and adapting that a job transition might entail.
Both automation risk and the shortage of bottleneck tasks are strongly localised, and 'neighbouring' occupations – which are likely to be each other's viable transition destinations – have similar exposure to automation. Indeed, the automation exposure of a worker's current occupation and their desirable destinations is strongly correlated^(94) (Figure 33, page 61).
Due to the localisation of risk, many high-risk jobs tend to concentrate in clusters (Figure 34, page 61). To escape automation, workers must leave the confines of their high-risk cluster and, as a result, forego many of their most readily available transition options. Approximately one-third of all desirable transitions and half of highly viable and desirable transitions originating from high-risk occupations end up in other high-risk occupations. Strikingly, one-third of high-risk occupations have no highly viable pathways to occupations in a lower-risk category – these include predominantly clerical support workers, such as transport and numerical clerks, and business and administration workers (e.g. accounting assistants and middle office analysts).^(96) As an exception to the observed localisation of risk, there are some high-risk occupations – mostly from sectors such as engineering and research; information technology and communications; education; and social work – that tend to be surrounded by many lower-risk occupations and hence have plenty of transition options to safer jobs.
Figure 32. Visualisations of the map of occupations showing strong localisation of both measures of automation
Notes: High-risk occupations have both a high overall automation risk and a low prevalence of bottleneck tasks, indicated by deep red in both panels. Annotations in the left panel indicate skills-based sectors.
The figure presents two scatter plots visualizing the 'map of occupations'. Occupations with similar skills and work contexts are clustered together.
Left Panel: Overall automation risk
This panel shows the overall automation risk on a continuous scale (y-axis, from 3.30 to 3.65). Different clusters of occupations are annotated by sector:
* Higher risk (higher y-values): ICT, Arts and media, Business and administration, Education.
* Mid-range risk: Engineers and researchers, Social Workers, Healthcare, Sales and services, Textile, clothing, leather footwear manufacturing, Manufacturing.
* Lower risk (lower y-values): Technicians, construction, transport and security, Animal care and husbandry, Food and tobacco production.
The color intensity indicates automation risk, with deeper red corresponding to higher risk.
Right Panel: Prevalence of bottleneck tasks
This panel shows the prevalence of bottleneck tasks (y-axis, from 0.0 to 1.0). Clusters of occupations are annotated by specific job titles:
* Higher prevalence (higher y-values): Data entry clerk, Digital media designer, Credit advisor, File clerk.
* Mid-range: Car leasing agent, Travel agent.
* Lower prevalence (lower y-values): Photographic developer.
The color intensity indicates prevalence, with deeper red corresponding to lower prevalence of bottleneck tasks.
RESULTS PART B: HELPING HIGH-RISK WORKERS TRANSITION TO SAFER JOBS
Figure 33. Exposure to automation – in terms of automation risk (left) and prevalence of bottleneck tasks (right) - at the origin occupation (x-axis) compared to the average exposure to automation across all corresponding desirable destinations (y-axis)
Note: High-risk origin occupations are highlighted in red, whereas grey dots correspond to lower-risk occupations; lines indicate linear regression estimates (p-value ≈ 0).
The chart displays two scatter plots:
1. Automation risk: Plots Origin occupation risk (x-axis) against Average destination risk (y-axis). High-risk origin occupations are shown in red, lower-risk in grey. A dashed line indicates a linear regression estimate.
2. Prevalence of bottleneck tasks: Plots Origin occupation prevalence (x-axis) against Average destination prevalence (y-axis). High-risk origin occupations are shown in red, lower-risk in grey. A dashed line indicates a linear regression estimate.
Figure 34. High-risk occupations tend to concentrate in clusters of occupations with similar characteristics
Note: Clusters are shown in various colours; grey circles correspond to lower-risk occupations.
This is a scatter plot or cluster diagram where different occupational groups are color-coded and labeled, with numerous grey circles representing lower-risk occupations. Key clusters include:
* ICT
* Business and administration
* Education
* Social workers
* Healthcare
* Logistics
* Sales and services
* Arts and media
* Engineers and researchers
* Technicians, construction, transport and security
* Textile, clothing, leather footwear manufacturing
* Animal care and husbandry
* Food and tobacco production
* Manufacturing
Figure 35. Average number of safe and desirable transitions for lower-risk and high-risk occupations
This bar chart shows the "Number of safe and desirable transitions" on the y-axis, against "Automation risk" categories (Lower risk and High risk) on the x-axis. The "Lower risk" category has a significantly higher average number of transitions (around 38), while the "High risk" category has a lower average number (around 22).
The distribution of automation risk across occupations exacerbates the disparity between high-risk and lower-risk jobs. While the high-risk occupations have 26 per cent less, on average, desirable transitions than lower-risk occupations, the difference increases to 49 per cent when we rule out transitions that would push the worker into another high-risk occupation (Figure 35). In terms of the median number of safe and desirable transitions, which is less influenced by the lower-risk occupations with especially numerous pathways, the difference still remains significant at 42 per cent (the median numbers of safe and desirable transitions for high-risk and lower-risk occupations are 15 and 26, respectively).
The tendency of automation risk to concentrate in specific areas of the occupational landscape is in line with observations from previous studies which used automation estimates developed by Frey and Osborne. The lack of highly viable transitions was also noted by Bechichi et al., who suggested that workers in the majority of high-risk occupations will need more than six months of retraining to transition to desirable lower-risk jobs, and about 20 per cent may require more than a year of training. The findings from these studies and our own suggest that there is a general tendency for the risks of automation to be concentrated in particular areas of the occupational landscape. This in turn severely reduces the pathways to safer employment for at-risk workers.
The findings of this section also underscore the importance of informing jobseekers about the automation risk of their potential career choices. Without this information, they are navigating blindly through a precarious labour market. While moving into another at-risk job may work as a short-term solution, especially given that the adoption of automation will not be uniform across different occupations and sectors, optimal career guidance has to be future-proof.
Making leaps to safe destinations
The finding that high-risk jobs are surrounded by other similarly high-risk destinations raises the likelihood that at-risk workers will have to transition to relatively unfamiliar jobs, potentially in other sectors. To investigate such transitions, we first used an unsupervised data-driven machine learning method called clustering to group occupations into categories that we call skills-based sectors and sub-sectors. The clustering procedure groups jobs that share similar worker requirements and work characteristics.
Figure 36. Transition matrix of skills-based sectors
|
Business and administration workers |
Sales and services workers |
ICT workers |
Arts and media workers |
Social workers |
Engineers and researchers |
Technicians, construction, transport and security workers |
Education workers |
Healthcare workers |
Logistics workers |
Textile, clothing, leather and footwear manufacturing workers |
Manufacturing workers |
Animal care and husbandry workers |
Food and tobacco production workers |
Fraction of sector's safe and desirable transitions |
| Business and administration workers (87) |
0.69 |
0.04 |
0.07 |
0.05 |
0.02 |
0.03 |
0.07 |
0.01 |
0.01 |
0.01 |
0 |
0 |
0 |
0 |
0.8 |
| Sales and services workers (48) |
0.25 |
0.65 |
0.01 |
0.03 |
0 |
0.01 |
0.03 |
0 |
0.01 |
0 |
0 |
0 |
0 |
0 |
|
| ICT workers (23) |
0.1 |
0 |
0.8 |
0.02 |
0 |
0.01 |
0.03 |
0 |
0 |
0 |
0 |
0.02 |
0 |
0 |
0.6 |
| Arts and media workers (15) |
0.2 |
0.01 |
0.03 |
0.73 |
0 |
0.02 |
0.01 |
0 |
0 |
0 |
0 |
0.01 |
0 |
0 |
|
| Social workers (11) |
0.48 |
0.03 |
0.01 |
0.04 |
0.15 |
0 |
0.02 |
0.15 |
0.12 |
0 |
0 |
0 |
0 |
0 |
|
| Engineers and researchers (9) |
0.05 |
0.02 |
0.06 |
0 |
0 |
0.69 |
0.13 |
0.01 |
0 |
0 |
0 |
0.02 |
0 |
0 |
|
| Technicians, construction, transport and security workers (7) |
0.06 |
0.02 |
0.01 |
0.01 |
0 |
0.28 |
0.54 |
0.01 |
0 |
0 |
0.01 |
0.03 |
0 |
0.05 |
0.4 |
| Education workers (5) |
0.29 |
0.02 |
0 |
0.02 |
0.01 |
0 |
0.01 |
0.66 |
0.01 |
0 |
0 |
0 |
0 |
0 |
|
| Healthcare workers (4) |
0 |
0 |
0.02 |
0.02 |
0 |
0.02 |
0 |
0 |
0.93 |
0 |
0 |
0 |
0 |
0 |
|
| Logistics workers (2) |
0.56 |
0.09 |
0 |
0.06 |
0 |
0 |
0.25 |
0 |
0 |
0.03 |
0 |
0 |
0 |
0 |
|
| Textile, clothing, leather and footwear manufacturing workers (2) |
0.17 |
0 |
0.08 |
0 |
0 |
0.17 |
0.08 |
0 |
0 |
0 |
0.5 |
0 |
0 |
0 |
0.2 |
| Manufacturing workers (2) |
0 |
0 |
0 |
0 |
0 |
0.33 |
0 |
0 |
0 |
0 |
0 |
0.67 |
0 |
0 |
|
| Animal care and husbandry workers (1) |
0 |
0 |
0 |
0 |
0 |
0 |
0.17 |
0 |
0 |
0 |
0 |
0 |
0.83 |
0 |
|
| Food and tobacco production workers (1) |
0 |
0.01 |
0 |
0 |
0 |
0.07 |
0.18 |
0 |
0 |
0 |
0 |
0.07 |
0 |
0.66 |
0.0 |
Notes: Numbers indicate the fraction of safe and desirable transitions originating from high-risk occupations within a sector (rows) and terminating in lower-risk occupations (columns). Each row sums to 1. The numbers in brackets indicate the number of high-risk occupations within that skills-based sector.
We found that one-third of all desirable transitions out of high-risk occupations that both decrease automation risk and increase the proportion of bottleneck tasks are towards occupations that reside in different skills-based sectors (e.g. from sales and services towards business and administration occupations). Among the other transitions that keep the worker within their current skills-based sector, about one-half are directed to different sub-sectors (e.g. within sales and services, 18 per cent of transitions from the retail and sales sub-sector go to the customer representative sub-sector and 33 per cent to the food, cleaning and services sub-sector). Therefore, the majority of transitions out of high-risk occupations can be seen as moving at-risk workers away from their 'home ground'.
The matrix in Figure 36 provides an overview of the transitions between different skills-based sectors. Each row of the matrix shows the proportion of safe, viable and desirable transitions that go from high-risk occupations in one sector to lower-risk occupations in other sectors. Business and administration occupations stand out as the most likely destinations (10 per cent of all transitions), followed by technician, construction, transport and security occupations (5 per cent). While our skills-based sectors are not equivalent to industry-based sectors, there is a considerable degree of overlap between them. This suggests that a large fraction of the transitions away from automation risk may entail similar challenges to those that workers experience in making cross-sectoral transitions. These challenges include workers having no personal contacts in the desired area of work and dealing with employers who have difficulty recognising job candidates' transferable skills.
As high-risk workers have to move further from their current occupation, their destination occupations tend to be more dissimilar to their current job, in terms of the required skills and work characteristics, than is the case for lower-risk workers who are moving. This is reflected by the large disparity between high-risk and lower-risk workers in the likelihood of transitions with a particularly good job fit (Figure 37, page 64). Lower-risk occupations have almost three times as many highly viable safe transitions as high-risk occupations. This means that workers in high-risk occupations will have a harder time finding a job similar to theirs that also reduces their risk of automation. Consequently, they will likely have to make greater leaps to safe destinations when moving jobs.
Figure 37. Distributions of the similarity of origin occupations to their average safe and desirable destinations for lower-risk and high-risk occupations
Notes: The criterion for a safe destination is defined here as not being in the 'high risk' category. The vertical line at similarity equal to 0.4 corresponds to the threshold for highly viable transitions. Distributions are significantly different (Kolmogorov-Smirnov test, p-value = 0; Mann-Whitney U test, p-value = 0).
This chart shows violin plots or box plots representing the distribution of "Average similarity to destination occupations" (x-axis) for "Lower risk" and "High risk" occupations. A vertical dashed line at 0.4 indicates the "Threshold for highly viable transitions". The distributions show that lower-risk occupations generally have higher similarity scores to desirable destinations than high-risk occupations.
In essence, at-risk workers generally face the difficult task of finding an occupation that is sufficiently similar to their current role that it is a viable transition, but also sufficiently dissimilar such that it has a lower risk of automation. Similar conclusions for the US occupations, using the Frey and Osborne estimates of automation risk, were reached by Dworkin, who found a significant negative relationship between job automatability and workers' upward mobility towards safer jobs. Retraining for cross-sectoral transitions is particularly challenging and this underscores the need to provide additional support for at-risk workers to escape automation.
Some at-risk workers will need more support than others
By examining the high-risk jobs more closely, we identified occupations that have a disproportionately small number of feasible transitions out of automation compared to the average high-risk job. Workers in (clerical) business and administration, sales and services and, perhaps surprisingly, arts and media occupations are particularly vulnerable for this reason. The multimedia artist and animator roles that predominantly make up the latter group of occupations are likely to be protected from automation by the general expectation for creative outputs to originate, at least in part, from an artist. However, this result also suggests that workers in the creative industries who are simply executing someone else's creative vision will need to adapt, as the algorithms for manipulating digital media become more advanced.
Occupational groups with a small number of transition options
The average high-risk occupation has 22 desirable transitions to lower-risk occupations. This decreases to 17 transitions if we use a stricter condition for identifying safe transitions that rules out destination occupations with higher automation risk or a lower prevalence of bottleneck tasks. However, these are just averages, and the number of transitions for a given high-risk job varies widely, ranging between none at all to more than 100 (Figure 38, page 65). In terms of major occupational groups, the occupations with the greatest number of transitions are managers, professionals and technicians, whereas elementary, clerical and services and sales workers have the smallest number of transition options (Table 9, page 65; see also Table 10, page 68 for specific examples of occupations).
Figure 38. Histogram showing the number of safe and desirable transitions of high-risk occupations that simultaneously reduce automation risk and increase the prevalence of bottleneck tasks
Note: The mean is equal to 17 transitions; the median is equal to 12 transitions.
This histogram plots the "Number of safe and desirable transitions" (x-axis) against the "Number of high-risk occupations" (y-axis). It shows a right-skewed distribution, with many occupations having a low number of transitions, and fewer occupations having a high number of transitions. The highest bars are between 0 and 20 transitions.
Table 9. Average number of safe and desirable transitions for different ISCO major occupational groups
| Major occupational group |
ISCO code |
Number of high-risk occupations |
Safe and desirable transitions |
| Managers |
1 |
19 |
29.6 |
| Professionals |
2 |
72 |
19.8 |
| Technicians and associate professionals |
3 |
48 |
19.5 |
| Service and sales workers |
5 |
21 |
13.2 |
| Clerical support workers |
4 |
50 |
8.0 |
| Elementary occupations |
9 |
5 |
4.0 |
| Plant and machine operators and assemblers |
8 |
2 |
1.5 |
Note: Differences between all group comparisons (except professionals vs. technicians and associate professionals) are statistically significant according to the Kruskal-Wallis H-test (p-value < 0.01).
Across skills-based sectors (Figure 39, page 66), we found that in addition to sales and services and a subset of (clerical) business and administration occupations, the high-risk arts and media jobs (that predominantly include roles related to multimedia and animation), emerged as having the smallest number of safe and desirable destinations (seven transitions per occupation, on average). Interestingly, the two high-risk occupations from the manufacturing skills-based sector are also closely linked to this area of work, namely motion picture film developer and photographic developer, with zero and three transitions, respectively. This suggests these occupations have rather specialised skills that, while making them unique, also set them apart from other occupations. This can also be seen in the occupation map in Figure 34, page 61. Given the present context of the COVID-19 pandemic, as the measures to quell the spread of coronavirus have hit arts and entertainment workers particularly hard (along with the sales and services sector; see Feature Box 3, page 69) these results underscore the importance of supporting the creative industries during the pandemic.
Figure 39. The average number of safe and desirable transitions of high-risk occupations across different skills-based sectors
This chart displays "Skills-based sector" on the y-axis (Arts and media workers, Sales and services workers, Business and administration workers, ICT workers, Social workers, Education workers, Engineers and researchers, Technicians, construction, transport and security workers) and "Number of safe and desirable transitions" on the x-axis.
It uses three types of markers:
* A green bar represents the "Average number of safe and desirable transitions".
* A patterned bar (green with white stripes) indicates the "Fraction of transitions that are highly viable".
* Individual white circles represent the "Number of safe and desirable transitions of individual occupations".
The chart shows varying average transition numbers and viability fractions across different skills-based sectors, with individual occupations having a wide range of transition numbers within each sector.
Variation within the most isolated occupational groups
We found that, even within occupational groups that appear to be the most isolated in terms of transition options, there can still exist a considerable variation that is driven by the differences in occupations' skills sets. For example, among transport clerks, there are no safe and desirable transitions for rail traffic controllers, whereas there are five such transitions for taxi controllers and ten such transitions for water traffic coordinators. The salient difference between the occupations appears to be skills related to communication and collaboration activities, which are more commonly required among taxi controllers and water traffic coordinators. The latter occupation, in addition, demands more skills related to organising, planning and scheduling. As a result of requiring these additional skills, taxi controllers and water traffic coordinators are better prepared to transition to safer roles in business and administration and in sales and services. Note that all three occupations - rail traffic controllers, taxi controllers and water traffic coordinators - are in the same ISCO four-digit unit group, and hence a less granular analysis would have obfuscated these differences.
Influence of the viable, desirable and safe transition criteria in reducing workers' options
Besides gaps in skills sets, other reasons for a reduced range of transition options include incompatible salaries or education and experience levels. For example, human rights officers and psychologists have zero and one viable transitions, respectively, largely due to the high annual earnings of these occupations. Across all occupations, however, salary had only a moderate effect on transition options. For the median high-risk occupation, only about 10 per cent of viable and safe transitions were rejected because of differences in education and experience, and 10 per cent of transitions had an incompatible salary at the destination occupation. The requirement for the destination occupations to be of lower risk of automation had the strongest effect, removing about 50 per cent of the transitions that crossed the viability threshold. In some cases, this is much higher; as a particularly stark example, 15 out of 16 desirable transitions for cashiers were rejected because of automation risk.
Overall, only 3 per cent of high-risk occupations had no safe and desirable destinations (Table 10, page 68). Note, however, that our transition recommendation algorithm can still rank the destination transitions in terms of their feasibility even if all of them are below the viability threshold. Therefore, no occupation has to be excluded when delivering practical recommendations.
Table 10. High-risk occupations with the least (left) and most (right) safe and desirable transition options (corresponding to the lowest and highest 10 per cent)
| Least transitions |
|
|
Most transitions |
|
|
| ESCO occupation |
ISCO code |
Transitions |
ESCO occupation |
ISCO code |
Transitions |
| Payroll clerk |
4313 |
0 |
Food analyst |
3111 |
109 |
| Amusement and recreation attendant |
9629 |
0 |
Child day care centre manager |
1341 |
83 |
| Human rights officer |
2619 |
0 |
Corporate training manager |
2424 |
74 |
| Tourist animator |
2659 |
0 |
Maintenance and repair engineer |
2141 |
73 |
| Motion picture film developer |
8132 |
0 |
Industrial engineer |
2141 |
65 |
| Rail traffic controller |
4323 |
0 |
Credit manager |
3312 |
59 |
| Library assistant |
4411 |
0 |
Tour operators manager |
3339 |
54 |
| Bingo caller |
4212 |
1 |
Employment programme coordinator |
2422 |
54 |
| Attraction operator |
9629 |
1 |
Financial manager |
1211 |
49 |
| Typist |
4131 |
1 |
Social worker |
2635 |
47 |
| Music director |
2652 |
1 |
Pipeline route manager |
4323 |
44 |
| Tote operator |
4212 |
1 |
Asset manager |
3311 |
42 |
| Bookmaker |
4212 |
1 |
Headteacher |
1345 |
40 |
| Psychologist |
2634 |
1 |
Labour relations officer |
2423 |
40 |
| Chaplain |
2636 |
1 |
ICT operations manager |
1330 |
39 |
| Market vendor |
5211 |
1 |
Academic support officer |
2359 |
38 |
| Cashier |
5230 |
1 |
Specialised seller |
5223 |
37 |
| Ship pilot dispatcher |
4323 |
1 |
Credit risk analyst |
3312 |
37 |
| Coroner |
2619 |
1 |
Risk manager |
2412 |
37 |
| Odds compiler |
4212 |
1 |
ICT security consultant |
2529 |
37 |
| Street food vendor |
5212 |
1 |
Insurance agency manager |
1346 |
37 |
Figure 40. Mean exposure to impact from COVID-19 for occupations in different skills-based sectors
Notes: Dots correspond to individual occupations. The vertical dashed line indicates the average exposure score across all high-risk occupations.
This scatter plot shows "Skills-based sector" categories on the y-axis (Sales and services workers, Technicians, construction, transport and security workers, Social workers, Arts and media workers, Engineers and researchers, Business and administration workers, Education workers, ICT workers) against an unnamed x-axis (likely related to number of transitions or similar, though not explicitly labeled). The "Exposure score" for individual occupations is plotted, and a vertical dashed line indicates "Average exposure score across all high-risk occupations". "Average exposure score across all high-risk occupations" is indicated by a red dashed line. The data points (dots) show "Exposure score individual occupations".
Feature Box 3: COVID-19 appears to be raising the hurdles for at-risk workers
COVID-19 has not only put some workers into unemployment but also may have sped up the automation process and reduced the number of viable transitions for many other workers. Workers who before the pandemic were already at high risk of automation with a relatively small number of transition opportunities may now be in a particularly precarious position if their job became targets for accelerated automation by employers rushing to mitigate risks to their business operations.
By estimating the potential exposure of occupations to the impacts from COVID-19 as a combination of the physical proximity to other people and the inability to work remotely, we identified a number of occupations - most of them in the sales and services sector - that are exposed to both automation and COVID-19 (Figure 40). At-risk workers in the food, cleaning and services sub-sector are in a particularly precarious situation (Figure 41, page 70). Specifically, service roles such as stewards, tourist information officers and ticket sales agents, retail and sales roles such as cashiers and promotions demonstrators, and some customer representative roles such as tote operators and market vendors who were already in a below-median number of safe transition options and above-median exposure to COVID-19 risks. In response to the pandemic, some of the major UK retailers have already announced job cuts and of stores are substantial job cuts order to focus on online shopping. However, it remains to be seen what the long-term economic response to COVID-19 will be.
A wide-ranging labour market shock like COVID-19 also affects the range of destinations for high-prioritised workers. We discuss this in more detail in Feature Box 5 on page 81.
Figure 41. Most of the high-risk sales and services workers are also at an increased risk of accelerated automation, with the workers in the food, cleaning and services sub-sector having especially high exposure to impacts from COVID-19
Note: The dashed line indicates the average exposure score across all high-risk occupations.
This scatter plot shows "Number of safe and desirable transitions" on the x-axis and "Exposure score" on the y-axis. Different skills-based sub-sectors are represented by different colored dots:
* Shop and services managers (pink)
* Retail and sales workers (purple)
* Customer representatives (light blue)
* Food, cleaning and services workers (dark blue)
* Wholesale merchants (teal)
Key occupations are labeled, such as "Steward/stewardess", "Usher", "Hotel concierge", "Cashier", "Ticket issuing clerk", "Sales engineer", and "Commercial sales representative". A dashed horizontal line indicates the average exposure score across all high-risk occupations.
High-risk workers with less training and work experience have lower mobility
Higher levels of education and experience are strongly associated with a wider range of transition options for high-risk workers (see Figure 42). There is a twofold difference in the median number of transitions between occupations that may require a secondary school qualification and minimal previous work experience (referred to as 'job zone 2' occupations in the O*NET database) and occupations that typically require a slightly more advanced level of experience and a vocational qualification or an associate's degree (job zone 3 occupations). Strikingly, for occupations in job zone 4, where workers typically require an undergraduate level of training, the advantage is four times that of job zone 2.
The number of safe and desirable transitions is also positively correlated with each of the three factors that underpin the job zone estimate, namely level of education, related work experience and on-the-job training. Therefore, all avenues of training - through either experience or education - appear to be associated with better worker mobility.
Interestingly, there are a few outlier occupations that have many more transition options than would be expected given their training and education levels. For example, aircraft cargo operations coordinators, sales assistants, car leasing agents and ticket issuing clerks have between two and four times the number of transitions typical for their job zone. This indicates that at a presumably similar level of training, as measured by the job zones, some skills sets can provide a much wider range of career transitions than others. In the following section, we explore which skills may help to expand the range of transition options generally across all workers at high risk of automation.
A core group of skills can help at-risk workers to broaden their pool of transitions
Upskilling is a costly investment of time and resources and it is therefore important to target this investment in the right direction. We identified a number of skills that can help all at-risk workers to increase their number of safe and desirable transitions. These skills were broadly related to management, communications, and information analysis and evaluation functions.
For this purpose, we leveraged the ESCO framework of skills and our job transition recommendation algorithm to measure the effect of adding a single skill to a worker's range of transition options. First, we pre-selected 100 core skills that reflect the central competencies for a large number of occupations and which, therefore, would be expected to have a positive impact on workers' career prospects. We tested each of these skills by adding them to the at-risk workers' skills sets and measuring the change in the number of transition options (see Feature Box 4, page 72). While the present analysis is restricted to these 100 core skills, the same approach could be used to evaluate any of the 13,485 ESCO skills and, as we are using NLP, potentially even skills that are not part of the ESCO framework.
Figure 42. Higher-level job zones are associated with a higher number of transition options for high-risk occupations
This box plot displays "Job zone" categories (1, 2, 3, 4, 5) on the x-axis, representing increasing levels of training and experience, and "Number of safe and desirable transitions" on the y-axis. The plot shows that as the job zone level increases, the median and spread of safe and desirable transitions also increase, indicating that higher-level job zones are associated with more transition options.
Feature Box 4: Upskilling a hotel concierge worker to broaden their transition options
Adding one core skill to a hotel concierge's skills set unlocked between 0 (for about one-third of the additions) and more than 10 new safe and desirable transitions (Figure 43). While the median number is 1 new transition, the most effective skill (managing staff) creates 11 new job transition opportunities. As expected, these new transition destinations are predominantly management roles:
- accommodation manager
- advertising assistant
- camping ground manager
- client relations manager
- court administrator
- ICT help desk manager
- membership manager
- publishing rights manager
- restaurant manager
- shop manager
- shop supervisor
Other effective skills for broadening concierges' options include the skills to develop professional networks (nine new transitions), build business relationships (eight), follow company standards (eight), maintain relationships with suppliers (seven) and use different communication channels (seven).
Figure 43. Histogram showing the number of new safe and desirable transitions after adding 100 different core skills to the concierge's skills set
This histogram plots the "Number of new safe and desirable transitions" (x-axis) against the "Number of skills" (y-axis). It shows a distribution where adding most skills results in 0 or 1 new transitions, but a few skills (up to 12) can unlock a significantly higher number of transitions. The highest frequency is for 0 new transitions.
Most effective core skills across all at-risk workers
The most effective core skills can, on average, unlock two to three new transition options per occupation (Table 11, page 73). Among these skills, there is a strong emphasis on management, communication, information analysis and evaluation, as well as compliance-related competencies. Specific examples are:
- Management skills - specifically to manage staff, budgets and projects;
- Communication skills - specifically to build and maintain business relationships, use different communication channels and liaise with managers and authorities;
- Information analysis and evaluation skills - specifically to execute feasibility studies, assess financial viability, analyse risk and perform research;
- Skills related to complying with company guidelines, work health and safety standards and environmental legislation.
In contrast, adding specific core knowledge (e.g. in electrical engineering or physics) wasn't as effective in increasing the number of potential transitions. This is perhaps unsurprising, as domain knowledge will generally differ more substantially across occupations.
Table 11. Top quartile of the most effective core skills for upskilling at-risk workers
| ESCO skill |
Avg |
Med |
ESCO skill category |
ESCO skill subcategory |
| Manage staff |
3.19 |
2 |
Management skills |
Supervising people |
| Manage budgets |
2.98 |
2 |
Management skills |
Allocating and controlling resources |
| Maintain relationship with suppliers |
2.82 |
2 |
Communication, collaboration and creativity |
Liaising and networking |
| Adhere to organisational guidelines |
2.79 |
2 |
Assisting and caring |
Protecting and enforcing |
| Follow company standards |
2.63 |
2 |
Assisting and caring |
Protecting and enforcing |
| Develop professional network |
2.54 |
1 |
Communication, collaboration and creativity |
Liaising and networking |
| Build business relationships |
2.46 |
1 |
Communication, collaboration and creativity |
Liaising and networking |
| Liaise with managers |
2.43 |
1 |
Communication, collaboration and creativity |
Liaising and networking |
| Maintain relationship with customers |
2.32 |
1 |
Communication, collaboration and creativity |
Liaising and networking |
| Use different communication channels |
2.31 |
2 |
Communication, collaboration and creativity |
Liaising and networking |
| Liaise with local authorities |
2.29 |
1 |
Communication, collaboration and creativity |
Liaising and networking |
| Manage health and safety standards |
2.15 |
1 |
Assisting and caring |
Protecting and enforcing |
| Assess financial viability |
2.15 |
1 |
Information skills |
Analysing and evaluating information and data |
| Execute feasibility study |
2.12 |
2 |
Information skills |
Analysing and evaluating information and data |
| Ensure compliance with environmental legislation |
2.09 |
1 |
Assisting and caring |
Protecting and enforcing |
| Perform scientific research |
2.02 |
1 |
Information skills |
Conducting studies, investigations and examinations |
| Perform project management |
2.01 |
1 |
Management skills |
Organising, planning and scheduling work and activities |
| Perform risk analysis |
2.00 |
1 |
Information skills |
Analysing and evaluating information and data |
| Apply organisational techniques |
1.98 |
1 |
Management skills |
Organising, planning and scheduling work and activities |
| Apply health and safety standards |
1.97 |
1 |
Assisting and caring |
Protecting and enforcing |
| Identify customer's needs |
1.97 |
2 |
Communication, collaboration and creativity |
Obtaining information verbally |
| Create solutions to problems |
1.96 |
1 |
Communication, collaboration and creativity |
Solving problems |
| Manage contracts |
1.82 |
1 |
Communication, collaboration and creativity |
Negotiating |
| Ensure public safety and security |
1.77 |
1 |
Assisting and caring |
Protecting and enforcing |
| Analyse production processes for improvement |
1.66 |
1 |
Information skills |
Analysing and evaluating information and data |
| Perform market research |
1.65 |
1 |
Information skills |
Conducting studies, investigations and examinations |
Notes: Avg = average number of new safe and desirable transitions; Med = median, all values significantly different from 0, Wilcoxon Signed-Rank test, p-value\<10^-5.
At first glance, it may be surprising that information analysis and evaluation skills can broaden workers' options and help them to secure lower-risk jobs, particularly because so much analysis can now be done by machines. Crucially, however, the skills in this group rely on using human judgement and applying that judgement to cognitive reasoning. These skills generally involve critically evaluating the credibility and reliability of data sources and making and defending judgements based on evidence and external criteria. Many other information-based skills that do not require human judgement do not have the same broadening effect on workers' transition options. For example, skills related to calculating and estimating, documenting and recording, and monitoring, inspecting and testing opened up, on average, between 2.8 and 1.7 times fewer transitions than the skills within information analysis and evaluation.
Two other important aspects of core skills appear to be interacting with and directing other people, as highlighted by the effectiveness of communication and management skills. Among the broader groups of management skills, those that involve supervising people and organising, planning and scheduling the work of groups and individuals had a stronger average effect (2 new transitions on average) than skills for allocating and controlling resources (1.6 transitions) or recruiting employees (0.7 transitions; this skill might be required in a smaller number of roles, which could explain its lesser effect). It is important, however, to note the caveat that the nature of the required management skills and activities may change as lower-skilled jobs are automated away.
Finally, the effectiveness of compliance skills in broadening workers' options suggests that human oversight of various processes can be an effective route to jobs at lower risk of automation.
Taken together, our observations underscore the role of non-routine activities requiring advanced cognitive reasoning, human judgement and working with other people in protecting workers against automation. They also echo our earlier findings on the impact of different types of work activities on automation risk.
The most effective skills for increasing transitions, identified above, are consistent with those found in other studies. Manyika et al. predicted that workers in future occupations will require more social and emotional skills and advanced cognitive capabilities to manage people, communicate and apply expertise. Bechichi et al. observed that managing and communication skills constitute the greatest skills gap for transitioning out of occupations at high risk of automation. Our skills also overlap those that Bakhshi et al. predicted would grow in demand over the next decade, including interpersonal, higher-order cognitive and systems skills as well as administration and management skills.
Effectiveness of upskilling varies across occupations
Evaluation of the upskilling impact can also be focused on more specific transition pathways to uncover how the efficacy of core skills varies across occupations in different skills-based sectors (Table 12, page 75).
While management skills are effective across all occupations, we found that their impact differs depending on the sector. For example, managing budgets is particularly effective at raising transition options for workers in business and administration, sales and services and arts and media. However, the increase in transitions for business and administration workers, for this particular skill, is around 40 per cent greater than it is for sales and services workers (4 and 2.8 new transitions on average, respectively) and 160 per cent greater than for arts and media workers (1.5 transitions). This suggests that 'one-size-fits-all' programmes for retraining will be suboptimal, and instead workers in different sectors should be supported by carefully tailoring their training to achieve the best return in terms of increased resilience to automation shocks.
The composition of the most effective type of upskilling may also differ across occupations. For example, information skills such as performing risk analysis, carrying out scientific research, executing feasibility studies and assessing financial viability are among the most effective skills for ICT workers (notably, these information skills are related to research and systems analysis rather than more basic tasks related to computers and data that we found increased automation risk). However, for sales and services or arts and media workers, upskilling in this direction is two to three times less effective. This emphasises the importance of tailoring upskilling efforts for each sector to achieve the best outcome.
Table 12. The top six most effective core skills for upskilling at-risk workers in the four skills-based sectors that have the largest number of occupations at high risk of automation
| Business and administration workers |
|
Sales and services workers |
|
| ESCO skill |
Avg |
ESCO skill |
Avg |
| Manage budgets |
4.03 |
Manage staff |
3.54 |
| Manage staff |
3.79 |
Maintain relationship with customers |
3.40 |
| Maintain relationship with suppliers |
3.64 |
Adhere to organisational guidelines |
3.27 |
| Liaise with managers |
3.41 |
Follow company standards |
3.27 |
| Build business relationships |
3.30 |
Maintain relationship with suppliers |
3.10 |
| Develop professional network |
3.28 |
Manage budgets |
2.81 |
| ICT workers |
|
Arts and media workers |
|
| ESCO skill |
Avg |
ESCO skill |
Avg |
| Adjust engineering designs |
3.57 |
Manage staff |
2.13 |
| Perform risk analysis |
3.43 |
Develop professional network |
1.73 |
| Perform scientific research |
2.87 |
Perform project management |
1.53 |
| Execute feasibility study |
2.57 |
Manage budgets |
1.53 |
| Assess financial viability |
2.30 |
Perform market research |
1.47 |
| Manage staff |
2.22 |
Apply organisational techniques |
1.47 |
Note: Avg = average number of new safe and desirable transitions; all effects of shown skills are significantly different from 0, p-value\<0.01. The full list of skills and their impact is provided in the 'Supplementary online data' (see Appendix, page 83).
The differences in the effectiveness of particular skills are likely driven by workers' existing skills sets and work characteristics, which in turn determine their location in the occupational landscape (Figure 34, page 61) and thus their 'neighbourhood' of occupations. Adding just one skill can only moderately increase the similarities of their skills sets to those of other occupations, and the additional transition options must already be quite close to their current job. Notably, the transition matrix between skills-based sectors shown in Figure 36 (page 63) indicates that business and administration roles are in relatively close proximity to occupations in other skills-based sectors, which could explain the effectiveness of management and communication skills in broadening workers' options.
More generally, skills that facilitate transitions to lower-risk occupations are an insurance mechanism against automation, and opportunities for acquiring them should be actively pursued and supported. The core skills that we have uncovered could be naturally gained on the job if more delegation and independent decision-making were encouraged. Alternatively, these skills could also be acquired via more informal routes (e.g. volunteering).
RESULTS PART B: HELPING HIGH-RISK WORKERS TRANSITION TO SAFER JOBS
Figure 44. Transition matrix for all viable transitions between the 1,627 occupations analysed in this report
Notes: Each green pixel is a pathway between two occupations, with light green indicating viable and dark green indicating highly viable transitions. Different skills-based sectors are indicated by squares.
The image shows a large grid, or transition matrix, where both the x-axis and y-axis are labeled "Skills-based sectors". The sectors listed on both axes include: Healthcare: Social workers - Education, Arts and media, Business and administration, Sales and services, ICT workers, Engineers and researchers, Technicians, construction, transport and security workers, Manufacturing, Food and tobacco production, Textile, clothing and footwear, and Animal care and husbandry. The matrix is filled with green pixels, indicating viable transitions between these sectors. A legend specifies "Viable" (light green) and "Highly Viable" (dark green) transitions. Several squares highlight transitions within or between specific sectors (e.g., Healthcare to Healthcare, Sales and services to Sales and services, ICT workers to ICT workers).
Towards tailored support for specific transition pathways
Our methodology can be used to create detailed skills gap assessments for a worker wishing to transition between any two occupations (Figure 44). This assessment could broaden the tools of organisations who are charged with helping at-risk workers, as pinpointing precise skills gaps will enable more tailored training recommendations. This assessment can also be carried out for collections of transitions to provide a more macroscopic view of the most prevalent skills gaps.
RESULTS PART B: HELPING HIGH-RISK WORKERS TRANSITION TO SAFER JOBS
Case study: Detecting skills gaps for a shop assistant
To illustrate how skills gaps can be detected, we consider the case of a shop assistant who is wishing to move to an occupation that is at lower risk of automation. Shop assistants perform various duties, such as advising customers, selling products and ordering and refilling stock. Our estimates indicate that generally, shop assistants have a relatively low salary and, importantly, face a high risk of automation. While the most obvious choices among the viable transitions are retail managers and shelf fillers, another destination among the most viable options, and one associated with a substantially higher salary, is a merchandiser. Visual merchandisers specialise in the promotion of the sale of goods and their presentation in retail outlets.
Table 13 shows how well the skills set of visual merchandisers aligns with that of shop assistants. Only a couple of the skills specified by ESCO overlap perfectly between both occupations (shown in green). However, by using NLP, we can construct and compare semantically meaningful representations of the skills descriptions from both skills sets and rank them in terms of pairwise semantic similarity. This allows us to detect partially matching skills (shown in yellow in Table 13). For example, the skill of coaching a team on visual merchandising, which is required for a visual merchandiser, is very similar to the skill of supervising merchandise displays, which is required for a shop assistant. Both skills involve working with other people on the visual display of items in the store. Another partial match is detected between the more general skill of communicating with customers and identifying their needs and the skill of communicating to staff about visual displays.
Table 13. Skills gap analysis for a transition from shop assistant to visual merchandiser
|
Skills for origin occupation (shop assistant) |
Skills for destination occupation (visual merchandiser) |
Semantic similarity |
Matching score |
| 0 |
Maintain relationship with suppliers |
Maintain relationship with suppliers |
1.00 |
1.00 |
| 1 |
Maintain relationship with customers |
Maintain relationship with customers |
1.00 |
1.00 |
| 2 |
Supervise merchandise displays |
Coach team on visual merchandising |
0.85 |
0.25 |
| 3 |
Carry out active selling |
Merchandising techniques |
0.85 |
0.24 |
| 4 |
Identify customer's needs |
Liaise with appropriate staff for visual display |
0.84 |
0.17 |
| 5 |
|
Change window displays |
0.79 |
0.02 |
| 6 |
|
Assess visual impact of displays |
0.78 |
0.01 |
| 7 |
|
Negotiate with suppliers for visual material |
0.78 |
0.01 |
| 8 |
|
Develop store design |
0.77 |
0.01 |
| 9 |
(Not shown because semantic similarity is too low) |
Assemble visual displays |
0.74 |
0.00 |
| 10 |
|
Have computer literacy |
0.71 |
0.00 |
| 11 |
|
Execute visual presentation changes |
0.68 |
0.00 |
| 12 |
|
Conduct research on trends in design |
0.68 |
0.00 |
| 13 |
|
Interpret floor plans |
0.59 |
0.00 |
Notes: The table shows the skills set required for the destination occupation together with the best matching skills from the origin occupation (only origin skills that have a semantic similarity higher than 0.80 are displayed). Perfect matches are shown in green, partial matches in yellow and poor matches (gaps) in red. Matching score is a filtered semantic similarity value to reduce the score of lower-quality matches.
RESULTS PART B: HELPING HIGH-RISK WORKERS TRANSITION TO SAFER JOBS
Below a certain semantic similarity threshold, we rejected the partial matches in order to reduce low-quality pairings of origin and destination skills (shown in red in Table 13). The destination skills below this threshold can, therefore, be regarded as the skills gap. Moreover, the ranking of the destination occupation’s skills in terms of semantic similarity values can be used to suggest which skills might be the least familiar to the worker. In this case, it appears that the skills least familiar to the shop assistant are interpreting floor plans, conducting research on trends in design and executing visual presentation changes.
This approach could be incorporated within a tool and used by career advisors to quickly pinpoint potential gaps in jobseekers’ skills and to facilitate the identification of suitable training opportunities. The granularity of the ESCO skills framework opens up the possibility of providing very specific and, hence, actionable advice on upskilling. While too much detail can be overwhelming – most ESCO occupations have more skills than are shown in this example – the ranking of skills in terms of their semantic similarity helps to interrogate this information effectively. Importantly, the ranking works by placing the destination occupation’s skills in the context of the workers’ skills set, thus providing information not only about gaps but also about the skills that the worker may already possess. This could help to boost workers’ confidence, as they – as well as employers – often find it difficult to recognise their transferable skills.
Finding the most prevalent skills gaps
Our methodology can also identify the most prevalent gaps across multiple transitions. This information could inform upskilling efforts and training provision for a larger group of workers. A recent case of large-scale reskilling in the UK was an initiative to prepare hospitality workers displaced by the COVID-19 pandemic for jobs in the care sector.
To demonstrate this approach, we assessed the typical skills gaps in transitions for workers leaving high-risk occupations within the sales and services skills-based sector. We differentiated between pathways that left workers within (safer) sales and services occupations and pathways that moved them into the business and administration skills-based sector. As established earlier in the report, these were the two destinations for at-risk sales and services workers uncovered most frequently by our transition recommendation algorithm.
For the pathways that remained within the sales and services sector, the most prevalent gaps were for skills related to control of expenses, ensuring compliance with purchasing and contracting regulations, maximising sales revenues and recruiting employees (Table 14, page 79). These skills could be matched in less than 15 per cent of the transitions where they were required by the destination occupation. Slightly smaller but still substantial gaps were detected for managing budgets and managing staff, which could be matched in about 20 per cent and 25 per cent of cases, respectively. Additionally, the knowledge of law (e.g. employment law and embargo regulations) appears to be difficult to match.
For the pathways that move the worker out of sales and services and into business and administration occupations, skills gaps are larger – which would be expected from cross-sectoral transitions – and they are also different in nature (Table 15, page 80). They include the likes of knowledge about corporate social responsibility, various skills related to planning such as planning objectives, events, health and safety procedures, following company standards, training employees as well as liaising with managers and presenting reports. Each of these can be matched in less than one-third of the transitions. More broadly, there appear to be potential gaps in knowledge related to law (e.g. contract law), finances, and business and management (project and cost management) as well as broader work activities related to directing operational activities. However, we presently cannot ascertain the precise level at which these skills and knowledge should be mastered.
To summarise, by assessing two different sets of pathways for the at-risk sales and services workers, we could differentiate between the need to bolster skills for recruiting and managing staff and for managing budgets for transitions within the sales and services sector and the need for more advanced management knowledge in addition to skills for planning and for managing stakeholders when transitioning to the business and administration sector.
Similar analysis at different levels of granularity can be carried out for various other pathways, depending on the desired use case. We expect that the insights will be relevant for all considered European countries.
RESULTS PART B: HELPING HIGH-RISK WORKERS TRANSITION TO SAFER JOBS
Table 14. Skills gaps analysis across all pathways out of high-risk occupations in the sales and services skills-based sector to safe and desirable destinations within the same sector
| Destination skills |
Prevalence |
Matching score |
| Maintain customer service |
0.31 |
0.86 |
| Identify customer's needs |
0.25 |
0.78 |
| Communicate with customers |
0.29 |
0.78 |
| Maintain relationship with customers |
0.32 |
0.77 |
| Guarantee customer satisfaction |
0.21 |
0.76 |
| Maintain relationship with suppliers |
0.18 |
0.67 |
| Implement marketing strategies |
0.18 |
0.65 |
| Assist customers |
0.13 |
0.63 |
| Implement sales strategies |
0.18 |
0.59 |
| Monitor customer service |
0.12 |
0.56 |
| Use customer relationship management software |
0.12 |
0.51 |
| Provide customer follow-up services |
0.14 |
0.48 |
| Characteristics of services |
0.22 |
0.46 |
| Characteristics of products |
0.22 |
0.45 |
| Comply with food safety and hygiene |
0.13 |
0.45 |
| Product comprehension |
0.21 |
0.44 |
| Perform market research |
0.13 |
0.43 |
| Have computer literacy |
0.23 |
0.42 |
| Greet guests |
0.18 |
0.38 |
| Handle customer complaints |
0.22 |
0.36 |
| Negotiate sales contracts |
0.11 |
0.35 |
| Create solutions to problems |
0.14 |
0.34 |
| Ensure customer focus |
0.11 |
0.28 |
| Manage staff |
0.24 |
0.27 |
| Manage budgets |
0.18 |
0.21 |
| Maximise sales revenues |
0.19 |
0.13 |
| Recruit employees |
0.12 |
0.13 |
| Ensure compliance with purchasing and contracting regulations |
0.16 |
0.09 |
| Control of expenses |
0.12 |
0.01 |
Notes: Only skills in the 95th percentile of prevalence are shown. Prevalence is the fraction of transitions in which the skill is needed. Skills with matching score < 0.33 (one-third) are highlighted in red.
RESULTS PART B: HELPING HIGH-RISK WORKERS TRANSITION TO SAFER JOBS
Table 15. Skills gaps analysis across all pathways out of high-risk occupations in the sales and services skills-based sector to safe and desirable destinations in the business and administration sector
| Destination skills |
Prevalence |
Matching score |
| Maintain customer service |
0.09 |
1.00 |
| Implement marketing strategies |
0.09 |
0.81 |
| Use different communication channels |
0.09 |
0.75 |
| Communicate with customers |
0.10 |
0.74 |
| Build business relationships |
0.09 |
0.74 |
| Identify customer's needs |
0.19 |
0.69 |
| Implement sales strategies |
0.09 |
0.68 |
| Perform market research |
0.10 |
0.65 |
| Comply with food safety and hygiene |
0.17 |
0.62 |
| Handle customer complaints |
0.16 |
0.50 |
| Manage budgets |
0.33 |
0.49 |
| Manage staff |
0.40 |
0.45 |
| Manage contracts |
0.14 |
0.41 |
| Create solutions to problems |
0.21 |
0.35 |
| Present reports |
0.16 |
0.26 |
| Develop professional network |
0.21 |
0.26 |
| Plan medium-to long-term objectives |
0.15 |
0.25 |
| Plan events |
0.09 |
0.25 |
| Advertising techniques |
0.11 |
0.21 |
| Product comprehension |
0.11 |
0.20 |
| Contract law |
0.09 |
0.17 |
| Manage health and safety standards |
0.11 |
0.15 |
| Analyse data about clients |
0.10 |
0.14 |
| Strive for company growth |
0.09 |
0.11 |
| Ensure cross-department cooperation |
0.10 |
0.08 |
| Follow company standards |
0.19 |
0.05 |
| Liaise with managers |
0.16 |
0.03 |
| Supervise daily information operations |
0.09 |
0.03 |
| Train employees |
0.12 |
0.00 |
| Plan health and safety procedures |
0.14 |
0.00 |
| Corporate social responsibility |
0.19 |
0.00 |
Notes: Only skills in the 95th percentile of prevalence are shown. Prevalence is the fraction of transitions in which the skill is needed. Skills with matching score < 0.33 (one-third) are highlighted in red.
RESULTS PART B: HELPING HIGH-RISK WORKERS TRANSITION TO SAFER JOBS
Feature Box 5: COVID-19 impacts the range of transitions for at-risk workers
By assessing workers’ typical physical proximity to other people while on the job and the extent to which their work can be done remotely, we established that a number of at-risk occupations in the sales and services skills-based sector are particularly exposed to risks associated with COVID-19. However, the impacts of COVID-19 will also affect the potential destinations of these workers. Two-thirds of their safe and desirable transitions remain within the sales and services sector, and only about 40 per cent of these transitions are to occupations with a smaller potential impact from COVID-19 (Figure 45). The safer destinations predominantly include roles in the customer representative sub-sector as well as some wholesale merchant and shop and services manager roles that have significantly lower direct contact with other people and more tasks that can be performed remotely.
In the case of a sector-wide downturn, many of the transitions to automation-safe sales and services occupations might not be available, and workers will have to consider cross-sectoral transitions. Two-thirds of the occupations in the sales and services sector have such transitions, and the vast majority of them go to business and administration occupations. Of these, about 70 per cent would reduce a worker’s exposure to COVID-19. Therefore, pathways to business and administration destinations may present safer alternatives for those workers who have these options available.
Figure 45. Transitions from high-risk occupations in the sales and services skills-based sector to other sectors, and the impact from COVID-19 on the transition destinations (relative to the origin occupations)
Note: Only the transitions for which exposure scores to COVID-19 were available are included.
The chart is a stacked bar chart illustrating transition destinations and the impact of COVID-19.
On the left, "Sales and services" (100%) represents 480 transitions originating from 42 high-risk sales and services occupations. This bar is divided into three segments for "Transition destinations (skills-based sectors)":
* 64% Sales and services
* 27% Business and administration
* 9% Other sectors
On the right, "Impact from COVID-19 on destination occupations" is represented by two segments:
* 50% Reduced impact from COVID-19 (corresponding to the Sales and services transitions)
* 50% Increased impact from COVID-19 (corresponding to the Business and administration and Other sectors transitions), specifically, "50% of all transitions out of at-risk sales and services occupations increase the impact from COVID-19".
Conclusions
In this report we have used state-of-the-art data science and machine learning methods to construct, to the best of our knowledge, the most detailed open framework for mapping transitions out of high-risk occupations. We have also developed a novel approach for identifying potential skills gaps when moving between jobs. In addition, we have assessed the automation risk of European occupations, and we have identified the key demographic characteristics of at-risk workers in France, Italy and the UK. We have also found the types of tasks and skills that can potentially safeguard workers from automation and those that can broaden the transition options for those at risk.
Automation is just one of several trends that are disrupting the future of work, and the ongoing coronavirus pandemic has highlighted the importance of preparing for sudden labour market shocks. A map of career transition pathways is an essential tool to plan for, and respond to, an uncertain future of work. Moreover, by assessing the overall range of viable career transitions for different occupations, it is possible to identify and assist those workers who have a particularly limited number of transition options. These workers may find it especially challenging to adapt to economic shocks that eliminate certain classes of occupations, and we can identify core skills that would broaden their options and thereby increase their resilience to labour market disruptions.
We believe the insights from this research may be of use to policymakers as they develop strategies to help places and people build their resilience to uncertainty and change in the labour market. They could also be used to design better support services for career transitions and target them more effectively. It might also be possible to create tools aimed directly at workers to help them understand and evaluate their options as well as tools for employers that might help them find suitable candidates for jobs beyond their usual recruitment pools.
However, while these machine learning methods have the potential to assist workers, they must be more thoroughly validated before being recommended to jobseekers and those who are tasked with helping them. Over the next year, we aim to validate and trial the map of career transitions, and we are actively seeking partners to work with us. This work will involve seeking feedback on the transition pathways, testing different methods for delivering insights about career transitions and enriching our framework with more localised data on jobs. Through this work, we aim to broaden the information that is available to individuals, businesses and public services and, thereby, drive change that helps to connect people to good work.
Appendix
Methodology
O*NET to ESCO crosswalk
The process for generating the crosswalk from O*NET to European multilingual classification of Skills, Competences, Qualifications and Occupations (ESCO) occupations is described in Figure 46. Our approach combined automated mapping of occupations with manual validation.
Automated mapping strategies primarily involved applying natural language processing (NLP) techniques to identify occupations with similar job titles and descriptions. Similarity in this context refers to semantic similarity and was calculated by comparing sentence embeddings generated by Sentence-BERT, a recent neural network model that outputs high-quality, semantically meaningful numerical representations of text.
In our approach, semantic similarity was evaluated twice. First, we compared a given ESCO occupation with its most likely ONET matches (these are also referred to as ‘constrained’ matches and were derived by extrapolating from existing crosswalks between the US 2010 Standard Occupational Classification (SOC) and the International Standard Classification of Occupations 2008 (ISCO-08). In the second instance, we measured similarity of an ESCO occupation to all ONET occupations in case the best matching ONET occupation was not included in the set of most likely ONET matches. Table 16 provides an example of calculating similarity between O*NET and ESCO occupations.
Figure 46. Process for generating the crosswalk from O*NET to ESCO occupations
The diagram illustrates a flow for generating the crosswalk.
Initial Step:
* Identify constrained matches: For each ESCO occupation, use existing US 2010 SOC to ISCO-08 crosswalk to identify most likely O*NET matches. This is visually represented with "US 2010 SOC" and "ISCO-08" boxes feeding into this step.
Parallel Paths after "Identify constrained matches":
Path 1: Evaluate constrained matches
* Evaluate constrained matches: For each potential match, calculate similarity* of ESCO and O*NET occupations.
* This leads to "Record most suitable match if confident".
Path 2: Evaluate all potential matches
* Evaluate all potential matches: Calculate similarity* of ESCO and every O*NET occupation.
* This leads to "Record match with the highest similarity*".
Manual Review and Final Assignment:
Both "Record most suitable match if confident" and "Record match with the highest similarity*" feed into:
* First sweep of manual review: Rank results and identify most suitable match.
* This leads to "Record matches".
* Second sweep of manual review: Compare and assign recommended O*NET occupation.
Similarity Composite Metric:
A box titled "*Similarity is a composite metric which reflects cosine similarity of Sentence-BERT embeddings and comprises:" shows:
* "Highest pairwise similarity among all known job titles" (40%)
* "Median pairwise similarity between all known job titles" (30%)
* "Similarity of occupation descriptions" (30%)
Table 16. Worked example of calculating similarity between O*NET and ESCO occupations
|
ESCO occupation (ID) |
ONET occupation (ONET code) |
| Official title |
Maritime pilot ('389') |
Pilots, ship ('53-5021.03') |
| Known job titles |
['maritime pilot', 'ship steerswoman', 'ship pilot', 'marine helmsman', 'pilot of maritime vessels', 'marine pilot'...] |
['pilots, ship', 'area relief pilot', 'bar pilot', 'barge pilot', 'boat pilot', 'canal driver' ...] |
| Exact job title matches |
['maritime pilot', 'ship pilot', 'marine pilot'] |
['maritime pilot', 'ship pilot', 'marine pilot'] |
| Description |
'Maritime pilots are mariners who guide ships through dangerous or congested waters, such as harbours or river mouths. They are expert ship handlers who possess detailed knowledge of local waterways.' |
'Command ships to steer them into and out of harbors, estuaries, straits, or sounds, or on rivers, lakes, or bays. Must be licensed by U.S. Coast Guard with limitations indicating class and tonnage of vessels for which license is valid and route and waters that may be piloted.' |
Calculation of Overall Similarity:
The overall similarity is calculated as:
1.0 (Max title similarity) x 0.4
+ 0.66 (Median title similarity) x 0.3
+ 0.71 (Description similarity) x 0.3
= 0.81 (Overall similarity)
Additional considerations for assigning O*NET occupations to ESCO
Automatically identified potential O*NET matches were manually validated by the authors. For a number of occupations, additional research was required. This involved reading occupation descriptions and job requirements. We used the following considerations to decide between multiple potential matches:
- ‘Constrained’ occupations (i.e. occupations that fit existing O*NET to ISCO mapping) were given preference.
- A higher number of shared job titles was assumed to indicate a better match between occupations.
- General O*NET occupational codes (e.g. 11-9039.00 ‘... all other’) were avoided if possible.
- We attempted to take into account the ISCO-08 skill level (i.e. the first unit of ISCO, which reflects the ranking of occupations from managerial to elementary) when assigning the corresponding O*NET occupations.
The final mapping between O*NET and ESCO also contains information about our level of confidence in the assigned match. There are three levels of confidence:
- A score of 2 indicates that the best ‘constrained’ O*NET occupation was also the most semantically similar across all occupations (31 per cent of matches).
- A score of 1 indicates that the two automatically identified options disagree but the reviewers have agreed on the best O*NET match following two rounds of manual review (65 per cent).
- A score of 0.5 indicates that reviewers disagreed with the initial reviewer’s assignment and there was no consensus on the most suitable ONET match (4 per cent of cases). In this case, the ESCO occupation in question was assigned to an ONET occupation suggested by the second reviewer.
APPENDIX METHODOLOGY
Figure 47. Structure of ESCO occupational classification
Note: Asterisks denote occupations that are not split further
The diagram illustrates a hierarchical structure of ESCO occupational classification:
* 436 ISCO-08 occupations
* Branches into two paths:
* 1471 ESCO level 5 occupations*
* 230 ESCO level 5 occupations (with more granular levels)
* Branches into two paths:
* 1033 ESCO level 6 occupations*
* 31 ESCO level 6 occupations
* Branches into two paths:
* 130 ESCO level 7 occupations*
* 6 ESCO level 7 occupations
* Leads to 41 ESCO level 8 occupations*
Occupations included in the analysis
In this report we provide automation risk estimates for 1,627 ESCO occupations. Other ESCO occupations were not included in the analysis for the following reasons.
In its current form, the ESCO occupations pillar has a complex multilevel structure. At each level there are some occupations that further split into more granular groups. Out of the 2,942 occupations profiled in ESCO, we used 1,701 that were directly linked to four-digit ISCO-08 occupations (occupations inside the shaded rectangle in Figure 47), and these can be thought of as the five-digit ISCO occupations. The remaining occupations are nested under these broader occupations.
We also omitted 21 ESCO occupations that refer to roles in the armed forces, such as artillery officers and special forces officers.
In addition, 53 occupations were further excluded because the 26 O*NET occupations that they were mapped to were not featured in Brynjolfsson et al. These mostly included general occupational codes not classified elsewhere (e.g. ‘managers, all other’).
Measuring occupation similarity
The basis of our job transition recommendations is an estimation of the similarity between different ESCO occupations with respect to several features from both ESCO and ONET occupational frameworks (see Figure 48, page 86 for an overview). Specifically, we calculated four measures that capture the similarity of occupations in terms of (1) essential ESCO skills; (2) optional ESCO skills; (3) typical work activities as specified by the categories of the official ESCO skills hierarchy; and (4) the physical, interpersonal and structural work characteristics specified by the ONET work context features. Below, we provide more details on the methods that we used for comparing these features.
APPENDIX METHODOLOGY
Figure 48. Overview of the career transition recommendation algorithm for identifying safe and desirable transitions out of occupations at risk of automation
Note: Steps 4 and 5 in this diagram have been summarised for reasons of clarity; see the ‘Methodology’ section on page 18 of the main text for additional details.
The diagram illustrates a five-step process:
1. Build detailed occupation profiles (Occupational data):
* Skills, knowledge, attitudes and values (ESCO skills pillar)
* Types of work activities (ESCO skills hierarchy)
* Interpersonal, physical and structural work features (ONET work context)
* Education and experience (ONET job zones)
2. Measure occupation similarity (Analysis steps):
* Overlap of essential skills* (NLP-adjusted overlap) from "Skills, knowledge, attitudes and values"
* Overlap of optional skills* (NLP-adjusted overlap) from "Skills, knowledge, attitudes and values"
* Alignment of work activity types (Vector similarity) from "Types of work activities"
* Alignment of work context features (Vector similarity) from "Interpersonal, physical and structural work features"
* All these measures feed into "Aggregate measures by equally weighted averaging".
* *includes skills, knowledge, attitudes and values from the ESCO skills pillar
3. Identify viable transitions (Outputs):
* "Aggregate measures by equally weighted averaging" feeds into "Calibrate viability threshold".
* "Calibrate viability threshold" leads to "Select transitions above the viability threshold".
* "Education and experience" feeds into "Select destinations with similar level of education and experience".
* Both "Select transitions above the viability threshold" and "Select destinations with similar level of education and experience" lead to "Viable transitions".
4. Identify desirable transitions (Analysis steps):
* "Official data on annual earnings" (Salary) leads to "Select transitions with a limited loss of earnings".
* "Select transitions with a limited loss of earnings" leads to "Desirable transitions".
5. Identify safe transitions (Analysis steps):
* "Automation risk" leads to "Select destinations with a lower risk of automation".
* "Select destinations with a lower risk of automation" leads to "Safe and desirable transitions".
Final Output:
* "Desirable transitions" and "Safe and desirable transitions" together lead to "Safe and desirable transitions" (an overall output).
Essential skills
At the most granular level of detail, we compared occupations in terms of their essential skills (see Figure 11, page 29 for examples). Methods for measuring the overlap between two sets of discrete elements typically assume that each unique element is completely different from the others. We expected that this assumption may not always hold for the 13,000 ESCO skills, as we might encounter closely related skills or even skills that are practically synonyms (e.g. skills to ‘maintain ship logs’ and to ‘maintain voyage logs’). Therefore, we used methods from NLP – a subfield of machine learning – and developed a novel approach to measure the extent to which two occupations share similar skills.
APPENDIX METHODOLOGY
Figure 49. Illustration of the procedure for calculating the NLP-adjusted overlap between the skills sets of two occupations
The diagram illustrates a four-step process for calculating NLP-adjusted overlap:
Step 1: Generate Sentence-BERT embeddings of ESCO skills descriptions.
* Input: Skill 1, which generates an embedding like [0.1, 0.5, 0.1, ...].
* Input: Skill 2, which generates an embedding like [0.2, 0.4, 0.8, ...].
Step 2: Compare and find best pairwise one-to-one matches of skills.
* This step involves comparing embeddings from Skill 1 and Skill 2.
Step 3: Calculate 'matching scores' by filtering similarity values.
* Example: Skill 1 matched with Skill 1 has a score of 1.00. Skill 2 matched with Skill 3 has a score of 0.30.
Step 4: Compute the NLP-adjusted overlap by averaging scores across destination job’s skills.
* This step uses the matching scores to compute the final overlap, e.g., 0.43.
The diagram also shows a table with "Origin skills set", "Destination skills", "Score", and "NLP-adjusted overlap" with example values.
NLP-adjusted overlap for comparing skills sets
Our method, which we call the NLP-adjusted overlap, leverages the flexibility of NLP to account for partial semantic overlaps of skills descriptions. To this end, we used Sentence-BERT, which generates text embeddings that have been optimised for finding semantically similar sentences.
To calculate the NLP-adjusted overlap of skills between two occupations (Figure 49), we generated sentence embeddings of all skills descriptions, evaluated their pairwise semantic similarity on a scale from 0 to 1 using cosine similarity and identified the best one-to-one matches of skills from the origin and destination occupations, skills sets (Figure 50, page 88). The similarities of the best-matching pairs were additionally filtered to calculate the final ‘matching scores’ (Figure 51, page 89), which were then averaged across the destination skills to yield the NLP-adjusted overlap. Figure 50 (page 88) shows in greater detail the procedure for finding the best-matching skill pairs. The approach is largely inspired by the word movers distance method, which finds the dissimilarity of two documents by comparing the embeddings of all the words in both documents.
APPENDIX METHODOLOGY
Figure 50. Procedure for finding the best pairwise skill matches
Notes: This is Step 2 in Figure 49 (page 87). The arrows in Step 2c indicate the final selected pairs of skills. ‘Occupation 2’ has one skill left over, which will have a different impact on the final similarity value depending on whether the transition is from occupation 1 to occupation 2 or vice versa.
The diagram illustrates the process of finding the best pairwise skill matches in three steps:
2α. Calculate cosine similarities between all pairs of skills from both occupations.
* A grid (matrix) is shown with "Occupation 1" (rows, 4 skills) and "Occupation 2" (columns, 5 skills) with similarity scores ranging from 0.54 to 0.97.
* Example: 'occupation 1' has four skills and 'occupation 2' has five skills.
2b. Sort all skill pairs in descending order.
* A list of skill pairs is shown with similarity scores, sorted from highest (0.97) to lowest (0.54).
2c. Go through the list and select a pair if neither of the two skills have been selected before.
* This step shows selected pairs as dotted lines:
* Skill 1 (occupation 1) -> Skill 4 (occupation 2) with similarity 0.97
* Skill 2 (occupation 1) -> Skill 1 (occupation 2) with similarity 0.85
* Skill 0 (occupation 1) -> Skill 3 (occupation 2) with similarity 0.74
* Skill 3 (occupation 1) -> Skill 2 (occupation 2) with similarity 0.71
2d. Stop when there are no more unselected skills for either of the parents.
We observed that the quality of matches rapidly deteriorated as the cosine similarity between skills description embeddings fell below 0.80. To reduce the influence of low-quality skill matches on the final similarity value, we applied a thresholding of the cosine similarity values (Figure 49, Step 3, page 87). We used a sigmoidal filtering function with heuristically found parameters to smoothly threshold cosine similarities with values below approximately 0.80:
f(x) = 1 / (1 + exp(- (ax+b)))
where x is the cosine similarity value, a = -50 and b=-43.5 (Figure 51, page 89). The parameters of the filtering function may need to be readjusted if another sentence embedding model is used.
APPENDIX METHODOLOGY
Figure 51. Filtering function f(x) for smooth thresholding of cosine similarities to yield the final matching scores
Note. This is Step 3 in Figure 49 (page 87).
The chart shows a sigmoid curve plotting "Matching score, f(X)" (y-axis, from 0.0 to 1.0) against "Cosine similarity" (x-axis, from 0.0 to 1.0). The curve starts near 0.0 for cosine similarity values below 0.7, then rises sharply between 0.7 and 0.9, and flattens out near 1.0 for cosine similarity values above 0.9. This illustrates how lower cosine similarity values are heavily suppressed (thresholded) while higher values are preserved or boosted towards 1.0.
By summing up the matching scores (i.e. the outputs of the filtering function) and dividing the sum by the total number of skills of the destination occupation, we arrived at the final NLP-adjusted overlap value. Note that this is an asymmetrical similarity measure, meaning that its value depends on the direction of the transition. In this way, we are accounting for skills shortages in cases where the two occupations have a different number of required skills. In Figure 49 (page 87), the origin occupation has fewer required skills, and as a result the NLP-adjusted overlap in the opposite direction would be, in fact, 50 per cent higher (0.43 vs. 0.65).
Table 17 shows a real-world example of comparing two occupations using the NLP-adjusted overlap. In this particular case, there are only two skills that are perfectly matching, and a simple overlap measure would yield a similarity score of only 14 per cent. However, using the NLP-adjusted overlap, we can find several other partial matches that raise the final similarity score to 0.42. Note that this value can still be easily interpreted to indicate a skills overlap of about 40 per cent.
Optional skills
Some workers may also possess skills that have been designated as optional by ESCO. To take this into account, we evaluated another version of the NLP-adjusted overlap that also includes the optional skills of the origin occupation. We compared the full skills set of the origin occupation, featuring both essential and optional skills, and the essential skills set of the destination occupation. In this way, we have assumed that workers are only required to fill the essential destination job requirements, and thus this similarity measure will always be equal to or higher than the NLP-adjusted overlap of essential skills only.
Work activities
Occupation similarity in terms of work activities was captured using the recently released official ESCO skills hierarchy. This hierarchy specifies a categorisation of skills at three levels, where the categories at the lowest level are based on the intermediate work activities of O*NET. Skills in the same category can therefore be seen as pertaining to the same type of work activity.
To estimate the extent to which occupations share a similar profile of work activities, we constructed a feature vector with its elements representing the relative intensity of each type of activity and compared the alignment of these vectors across all ESCO occupations.
APPENDIX METHODOLOGY
Table 17. Real-world example of comparing two occupations using the NLP-adjusted overlap
|
Skills for origin occupation (software analyst) |
Skills for destination occupation (system configurator) |
Semantic similarity |
Matching score |
| 0 |
ICT system user requirements |
ICT system user requirements |
1.00 |
1.00 |
| 1 |
Service-oriented modelling |
Service-oriented modelling |
1.00 |
1.00 |
| 2 |
Define software architecture |
Integrate system components |
0.91 |
0.88 |
| 3 |
Software architecture models |
Analyse software specifications |
0.91 |
0.87 |
| 4 |
Analyse ICT system |
ICT performance analysis methods |
0.89 |
0.76 |
| 5 |
Design information system |
ICT infrastructure |
0.88 |
0.57 |
| 6 |
Manage ICT legacy implication |
Migrate existing data |
0.86 |
0.42 |
| 7 |
Monitor system performance |
Replicate customer software issues |
0.84 |
0.22 |
| 8 |
Process-based management |
Configure ICT system |
0.82 |
0.09 |
| 9 |
|
Collect customer feedback on applications |
0.78 |
0.01 |
| 10 |
|
Create flowchart diagram |
0.75 |
0.00 |
| 11 |
(Not shown because semantic similarity is too low) |
Interpret technical texts |
0.71 |
0.00 |
| 12 |
|
Develop automated migration methods |
0.68 |
0.00 |
| 13 |
|
Cognitive psychology |
0.65 |
0.00 |
Notes: The table shows the destination occupation’s skills set together with the best-matching skills from the origin occupation (only origin skills that have semantic similarity higher than 0.80 are displayed). Perfect matches are shown in green, partial matches in yellow and poor matches (gaps) in red.
Similarity of occupational feature vectors
For each occupation, we constructed a work activity feature vector with 75 elements where each element corresponds to a particular category from the second level of the ESCO skills hierarchy (Figure 52, page 91). The value of each element was set to the number of occurrences of its corresponding skill category in the occupation’s essential skills set. For our purposes, we only counted essential skills that, moreover, were indeed designated as ‘skills’ items by the ESCO skills pillar categories (as opposed to ‘knowledge’, ‘attitudes’ or ‘values’ items).
The feature vectors were then normalised to unit vectors, and we calculated pairwise Euclidean distances between all vectors, applied min-max normalisation to rescale the distances between zero and one, and converted the normalised distances to similarities:
simij = 1 - (dij - minij (dij)) / (maxij (dij) - minij (dij))
where dij is the Euclidean distance between work activity vectors of occupations specified by the indices i and j. Alternatively, the similarity may be computed using other distance metrics, such as cosine similarity. If one preferred to use non-normalised work activity vectors, the Euclidean distance would allow more nuanced measurements between different pairs of orthogonal vectors compared to cosine similarity.
APPENDIX METHODOLOGY
Figure 52. Construction and comparison of occupation feature vectors
Diagram showing the five-step process for constructing and comparing occupation feature vectors:
1. Construct a feature vector for each occupation by counting the occurrences of each skill category.
2. Normalise the feature vector to a unit vector.
3. Calculate Euclidean distances between all vectors.
4. Apply min-max rescaling of all distances to the range between 0 and 1.
5. Subtract the distances from 1 to obtain similarities.
The diagram also includes an example of a feature vector (showing [0, 4, 6, 0, 2, 0, 7, 0, 3, 0] for an occupation with four skills from skill category 1), a normalised vector ([0, 0.37, 0.56, 0, 0.19, 0, 0.66, 0, 0.28, 0]), and a heatmap visualizing the similarities between occupations, with a color scale ranging from -1.0 to 1.0 (labeled 'Occupation similarity').
Work context
Comparison of work context features, similar to the case of work activities, was based on the construction of a feature vector for each ESCO occupation. Work context feature vectors had 57 elements, where 14 elements corresponded to interpersonal work characteristics, 30 elements corresponded to physical work characteristics and 13 elements corresponded to structural characteristics. After rescaling each work context feature to range between 0 and 1 (they were originally reported on a scale between 1 and 5 or, in a few cases, between 1 and 3), we followed the same steps as when comparing work activity feature vectors.
Combined similarity measure
The four similarity measurements were combined via a simple equally weighted average (Figure 53, page 92). The aim of using different similarity measures was to assess occupational proximity at varying levels of resolution and obtain a comprehensive view of the relationships between the occupations. Manual assessment of occupations’ nearest neighbours determined by the combined similarity measure provided generally satisfactory results (Table 18, page 93).
Calibration of viable transitions
We used the hierarchy of occupations inherent in the ESCO data set to derive a data-driven threshold for viable transitions along with an additional indicator for transitions that are highly viable.
Data-driven viability threshold
We set the threshold for viability to correspond to the typical similarity between closely related occupations that belong to the same ISCO unit group. For example, shop assistants and sales processors are both in the ISCO unit group 'Shop sales assistants' with the four-digit code 5223, and it is reasonable to assume that the transition between these two occupations should be viable. We calculated the average within-group occupation similarity for each ISCO unit group that had more than one occupation (using the combined similarity measure) and used the distribution of these within-group averages to make a judgement on the viability threshold (Figure 54, page 94). In the interest of obtaining more robust estimates of within-group averages, we used all occupations from the ESCO framework. Interestingly, there was considerable variation across different ISCO unit groups, and hence we set the viability threshold as the mean minus one standard deviation of these within-group averages (rounded to the first decimal point). This yielded a viability threshold equal to 0.30 (cf. red line in Figure 54, page 94), with approximately 80 per cent of the ISCO unit group averages being above this threshold.
Table 18. Four examples of the top five most similar occupations found using the combined occupation similarity measure
| Occupation |
Matching occupation |
Similarity |
| Land-based machinery technician |
Industrial machinery assembler |
0.43 |
|
Diesel engine mechanic |
0.42 |
|
Container equipment assembler |
0.39 |
|
Rotating equipment mechanic |
0.36 |
|
Power tool repair technician |
0.35 |
| Choreographer |
Artistic coach |
0.43 |
|
Fight director |
0.42 |
|
Dancer |
0.39 |
|
Performance artist |
0.36 |
|
Répétiteur |
0.35 |
| Early years teacher |
Montessori school teacher |
0.86 |
|
Freinet school teacher |
0.83 |
|
Early years teaching assistant |
0.82 |
|
Primary school teaching assistant |
0.79 |
|
Primary school teacher |
0.77 |
| Shop manager |
Supermarket manager |
0.83 |
|
Shop supervisor |
0.68 |
|
Retail department manager |
0.68 |
|
Retail entrepreneur |
0.53 |
|
Trade regional manager |
0.51 |
Figure 53. Similarity matrices illustrating the relationships between the 1,627 occupations in terms of the four assessed occupational aspects (top row) and their combination (bottom row)
Notes: The four measures were combined using an equally weighted average. The matrices are ordered according to the skills-based sectors and sub-sectors; the colourbar pertains to all matrices.
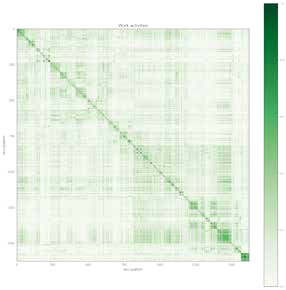
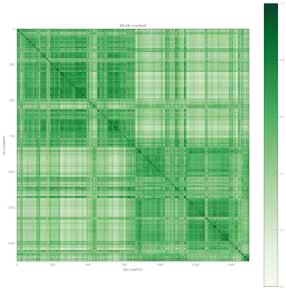
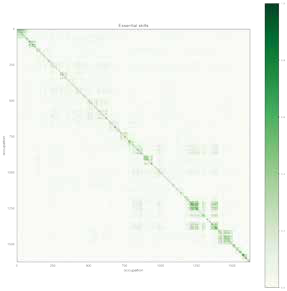
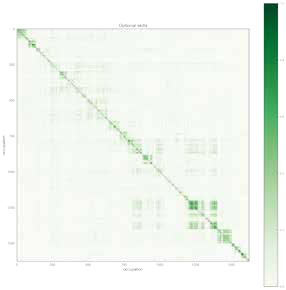
Diagram element: Equally-weighted average (indicated by an arrow pointing downwards)
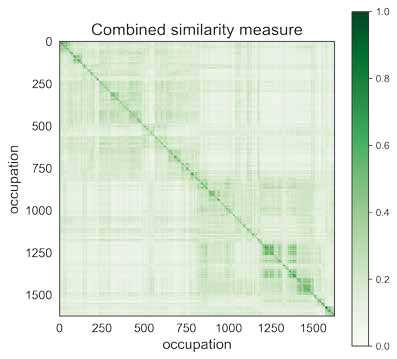
Figure 54. Derivation of the viability threshold
Notes: The graph shows the distribution of the average within-group occupation similarities for all ISCO four-digit unit groups that have more than one ESCO occupation. The red line indicates the chosen viability threshold (corresponding to mean minus one standard deviation). The green lines denote the average within-group occupation similarities for the ISCO four-digit unit groups.
Bar chart showing 'Number of unit groups' (y-axis, 0 to 60) against 'Within-group similarity (ISCO unit groups)' (x-axis, 0.2 to 1.0). The bars show a distribution peaking around 0.5-0.6 similarity. A red dashed vertical line at approximately 0.3 indicates the "Threshold for viable transitions". Green vertical lines mark the average within-group occupation similarities for ISCO four-digit unit groups.
Figure 55. Illustration of the calibration of the occupational similarity indicator for highly viable transitions
Flowchart illustrating the process:
* ISCO unit group (four-digit code) leads to Broad ESCO occupation groups.
* From Broad ESCO occupation groups, multiple paths emerge:
* Broad ESCO occupation leads to Narrower occupation, with a 'Within-group similarity' of 0.35 (depicted by a speedometer icon).
* Broad ESCO occupation leads to Narrower occupation, with a 'Within-group similarity' of 0.71 (depicted by a speedometer icon).
* Broad ESCO occupation leads to Narrower occupation, with a 'Within-group similarity' of 0.68 (depicted by a speedometer icon).
* These 'Within-group similarity' values feed into an Aggregate within-group similarities step (depicted by a bar chart icon).
* This aggregated value is then used to Set threshold to mean minus one standard deviation, which ultimately defines the Highly viable threshold (depicted by a highlighted box).
Figure 56. Derivation of the highly viable transition indicator
Notes: The graph shows the distribution of the average within-group occupation similarities for all broad ESCO occupation groups. The red line indicates the chosen viability threshold (corresponding to mean minus one standard deviation). The green lines denote the average within-group occupation similarities for the broad ESCO occupation groups.
Bar chart showing 'Number of broad ESCO groups' (y-axis, 0 to 45) against 'Within-group similarity (broad ESCO occupation groups)' (x-axis, 0.2 to 1.0). The distribution peaks around 0.6-0.7. A red dashed vertical line at approximately 0.4 indicates the "Threshold for highly viable transitions". Green vertical lines mark the average within-group occupation similarities for the broad ESCO occupation groups.
Figure 57. Distribution of the combined occupation similarity measure (between all ESCO occupations)
Note: The viability threshold is shown in red and the indicator for highly viable transitions is shown in blue.
Bar chart showing 'Number of comparisons (millions)' (y-axis, 0.0 to 1.2) against 'Occupation similarity' (x-axis, 0.0 to 0.6). The distribution peaks around 0.1-0.2. A red dashed vertical line at approximately 0.3 indicates the "Threshold for viable transitions". A blue dashed vertical line at approximately 0.4 indicates the "Threshold for highly viable transitions".
Calibration of desirable transitions
Estimation of occupations' annual earnings
In order to find career transitions that can accommodate a comparable standard of living, the expected earnings of workers in different ESCO occupations had to be estimated. As, to the best of our knowledge, there is no official source of earnings statistics for ESCO occupations, and the EU Labour Force Survey provides information only at the three-digit ISCO occupation level, this is an open challenge. For this report, we produced indicative estimates of annual earnings for each ESCO occupation based on data for workers in the UK from the Annual Survey of Hours and Earnings (ASHE), published by the Office for National Statistics.
Specifically, we used Table 14.7a from the 2019 ASHE, which specifies the annual pay for occupations at the four-digit level of the UK SOC system. We translated the UK earnings data to the ESCO framework using the UK SOC coding index, which specifies the correspondence between various job titles and their UK SOC and ISCO four-digit codes. For each four-digit ISCO code, we identified all corresponding UK SOC codes from the coding index and looked up their annual pay figures in the ASHE data. The earnings estimate was calculated as the average median annual pay across all corresponding UK occupations weighted by the number of samples collected by ASHE (see Table 19 for an example). Finally, for each ESCO occupation, we assigned the earnings estimate of its corresponding four-digit ISCO code.