Nesta is a research and innovation
foundation that designs, tests and
scales solutions for the biggest
challenges of our time.
Driven by a vision to improve the lives of millions of people,
our focus up to 2030 is on three missions: breaking the link
between family background and life chances, halving obesity
and cutting household carbon emissions.
We work with partners to develop high-potential solutions and
test them as they evolve, drawing on expertise in qualitative
and quantitative research, data science, behavioural science
and design.
Once confident in the effectiveness of a solution, we take
it to scale. We create national policy proposals, develop
consumer-facing products and services, build and spin out
commercial ventures and harness the power of the arts.
We work with two specialised units: BIT applies a deep
understanding of human behaviour to help clients achieve
their goals. Challenge Works designs and runs challenge
prizes to spark innovation in science, technology and society.
Find out more at nesta.org.uk
If you'd like this publication in an alternative format such as
Braille or large print please contact us at:
[email protected]
Authors
John Barber, Patricia Beloe, Shyamolie Biyani, Clare Brennan,
Anish Chacko, Max Hadley, Cailin Lees-Murphy, Lydia Leon,
Elena Mariani, Ryu Matsuura and Harry Wilde
Click the Nesta icon on any page to return to the contents
Executive summary
- Around two-thirds of adults in the UK live with excess weight, with prevalence doubling over the last 30 years. Our food environment has played a major role, driving us to overconsume less healthy food and drink. Large supermarket retailers account for over 80% of total calories we buy in Great Britain, making them a critical partner in improving the healthiness of diets.
- The government's healthy food standard (announced in 2025), is one of the most ambitious policies to date aimed at improving the food environment. It builds on Nesta's proposal to set health targets for large retailers to improve the overall healthiness of their food sales. In this report, we used more recent 2024 food purchasing data (versus 2021) and a more refined modelling approach from our previous work to make our methods as robust as possible.
- Our updated modelling further strengthens confidence in our original findings. We continue to recommend a health target based on a sales-weighted average converted nutrient profiling model (cNPM) score. This cNPM score captures the overall healthiness of a retailer's sales. We believe this score gives retailers flexibility in how they improve the healthiness of products (such as by targeting different nutrients like salt, sugar, and calories) and helps incentivise action across a wide range of their sales.
- We found that if all 11 major retailers achieve a health target of 69 (slightly better than the best performer in 2024), this could reduce the prevalence of adult obesity by 19% and childhood obesity by 23% in Great Britain, in line with our previous estimates.
- We modelled different ways in which retailers could meet a health target with marginal to no impact on their revenue (±0.1% change): through selling more of healthier products and less of unhealthier products, as well as improving the recipes of unhealthy foods via reformulation. Our assumptions were informed by the best available evidence as well as our extensive engagement with the food industry through trials, partnerships, and during the development of our original targets policy proposal.
- We found that all 11 large retailers can meet a cNPM target of 69 by making practically feasible and revenue-neutral shifts. The sector as a whole (across all 11 retailers) could reach this target by sales-shifting or reformulating around 5% of all food products. These sales and reformulation shifts are generally lower than estimates from our previous publication, adding to our confidence that a cNPM target of 69 is realistic for businesses while generating large public health benefits.
- Our model showed that 10 of the 11 large retailers could meet the target of 69 using even smaller sales and reformulation shifts than the sector-wide shifts of 5%. When we modelled even smaller portfolio shifts, we saw that the 11th retailer still makes significant progress towards the target (even if not quite hitting it), meaning that the overall public health impact of the policy remains similar to if all 11 retailers meet the target.
- The portfolio changes in this report are illustrative only: the policy provides retailers flexibility in how they meet a given target, and is designed to drive incremental improvements across a wide range of products, which add up to meaningful changes in overall diets. These changes are likely to be barely noticeable to consumers over time. Importantly, they do not rely on sustained behaviour change, which can be less effective in reducing obesity. Our analysis illustrating the types of changes that consumers might see in a typical weekly food shop suggests it is possible for consumers to make small but meaningful healthy swaps without increasing their food spend, even in households on lower incomes.
- We recommend that the healthy food standard be legislated and implemented within this Parliament, starting with mandatory reporting, followed by enforceable targets. A target of 69 represents a credible balance between ambition and feasibility and could be achieved within three years of implementation to drive a large public health impact.
Introduction: strengthening the evidence base for the government's healthy food standard
In the UK, around two-thirds of adults are living with excess weight and obesity. These conditions increase the risk of disease, reduce economic productivity and limit quality of life, costing UK society an estimated £126 billion a year, including £12 billion to the NHS, and £31 billion in lost economic output.
In the last 30 years, the number of adults living with obesity has doubled. One of the main causes of the rise in obesity is changes to our food environment: that is, how our food is promoted, advertised and displayed to us, how much it costs us and how convenient it is to buy. Right now, our food environment drives us to overconsume unhealthy food and drink, even though most of us want to eat well and be healthy. Large supermarket retailers play a particularly important role, accounting for over 80% of the calories we purchased in Great Britain (GB).
But obesity is preventable. Evidence shows that the most effective approaches to tackling obesity are those which improve our food environment and make the healthy option the easier option for everyone, as compared to policies that rely on an individual's will, such as health education campaigns. The healthy food standard, part of the 10 Year Health Plan for England, is one of the most ambitious obesity policies announced to date and has the potential to significantly improve the healthiness of our food environments.
The policy builds on Nesta's proposal for retailer targets and expands it to all large companies in the food sector, including food eaten out of home, such as in restaurants or on the go. Once legislated by the government, the healthy food standard will require large food businesses to report on the healthiness of their food sales and meet a mandatory target for improvement (see next page).
What is the government's healthy food standard?
Mandatory reporting
![Mandatory reporting icon]
Mandatory reporting
on the healthiness of
food sales for all large
food companies
Health targets
![Health targets icon]
Mandatory healthy
targets to increase the
healthiness of food sales
for all large businesses
As part of the 10 Year Health Plan for England, the government has committed to introducing mandatory healthy food sales reporting for all large companies in the food sector by the end of this Parliament. Government will use this reporting to set mandatory health targets to increase the healthiness of food sales for all large businesses. The targets element of this proposal was based on Nesta's health targets for supermarkets policy.
Food businesses will have the freedom to work out how to achieve the target, such as through reformulation, changing store layouts, introducing new healthy products, or changing customer loyalty schemes, amongst other tactics. An independent economic assessment found this could be achieved without significant cost to business or consumers.
What is Nesta's recommendation for retailer health targets?
This report presents an update to our original obesity impact estimates of setting mandatory health targets for the 11 largest retailers, where we buy over 80% of our calories. As part of our original report, we recommended that the health score for retailers should be calculated using the nutrient profiling model (NPM), a recognised metric used in legislation that measures how healthy food and drink products are, based on calorie content, salt, sugar, saturated fats and other nutrients.
In our previous report, we estimated that if a healthy food standard was set at or around 69 converted NPM points (near to the current best performer), this could lead to a reduction in obesity by around one fifth. In this report, we update these obesity impact estimates using a more robust modelling approach. Our findings suggest similar levels of obesity impact, and we continue to recommend retailer targets as a highly effective policy.
We have also previously estimated the potential impact of applying health targets to food purchased out of home.
The government is expected to consult on the detailed design of the policy, including the large food businesses in scope.
To support this process and the subsequent implementation of the healthy food standard, we have reassessed the potential public health impact and feasibility for large retailers to achieve a range of health targets using a more robust modelling approach. We continue to focus on food purchased from the UK's 11 largest grocery retailers, which comprise over 80% of food calories purchased in Great Britain. This gives the mandatory targets policy a much broader scope compared to existing restrictions on the placement, promotion, and advertising of foods high in fat, salt, and sugar, which apply to about 25% of the food calories we purchase to eat at home.
Based on our updated modelling and ongoing policy work at Nesta, we continue to recommend setting a sales-weighted average converted nutrient profiling model (cNPM) retailer health target of 69 (see Box 1 below). This target is slightly higher than the current best-scoring retailer. We believe a target of 69 strikes the right balance between driving ambitious reductions in obesity while remaining achievable for the largest retailers.
The sales-weighted average cNPM score we recommend is a robust and holistic measure of the overall healthiness of a retailer's food sales. Using this approach, each product's NPM score is weighted by how much of it is sold (in kilos), so products that sell in higher volumes contribute more to the retailer's overall score. All references to a 'health target' in this report refer to this application of a retailer's SWA cNPM score, calculated using the 2004-05 UK NPM.
Box 1: What is the nutrient profiling model score?
The nutrient profiling model score is a holistic measure of the health of food that assigns an integer score to food products based on their nutritional content (energy, sugar, saturated fat, sodium (salt), protein, fruit, vegetables and nuts; and fibre).
Scores range from -15 (most healthy) to +40 (least healthy). The NPM was originally developed to determine the suitability of products for advertising to children. In line with the 2004-05 UK NPM, food products are defined as 'less healthy' if they have an NPM score of 4 or more. The government has proposed updates to the 2004-05 NPM, with a consultation launched in March 2026.
Examples of how scoring works on the converted nutrient profiling model (cNPM)
Scale from least healthy to most healthy. Non-converted NPM score is presented in brackets.

To improve interpretability, we have used a formula developed by the University of Oxford to scale NPM scores on a range of 1 (least healthy) to 100 (most healthy). We refer to this scaled score as converted NPM (cNPM) through the report.
Targets using the continuous NPM scale incentivise improvements across a company's wider product range, rather than concentrating shifts around binary cut-offs of 'healthy' and 'not healthy'. Because the NPM captures incremental changes, even small improvements in a product's healthiness can contribute to progress. By contrast, a binary healthiness definition, such as high in fat, salt and sugar (HFSS), is more likely to encourage shifts only in products close to the HFSS cut-off.
Using the NPM also gives companies flexibility over which nutrients (such as salt, sugar, and calories) they target and to what extent, for example, by making many small changes across multiple nutrients or one larger change to a single nutrient.
Read more about Nesta's approach to metrics here.
What we did: three changes we made in our modelling approach
We made three key updates to the modelling approach used in our original report on health targets for retailers. Further details on these updates can be found in our technical appendix.
1. Updated the underlying data and refined our data processing methods, using the latest available GB household food purchase data from 2024 instead of 2021
We have used a more recent dataset on food purchases from 2024 in our analysis, compared to 2021 (which was the latest dataset available at the time of our previous report). The data was acquired for our analytical requirements from Worldpanel by Numerator, an international market research company. All analysis and interpretation were undertaken independently of Worldpanel by Numerator.
The Worldpanel dataset used in our modelling within this report comprises food and drink purchases taken into the home. We do not model changes in consumption of food eaten outside the home (including food-to-go items such as sandwiches sold by grocery retailers), data for which is collected in a separate dataset.
Using the latest 2024 data helps ensure our analysis better reflects current consumer purchasing habits. The earlier 2021 data was likely influenced by changes in consumer purchasing during the Covid-19 pandemic and associated lockdowns. For example, the volume of food and drink purchased in restaurants has increased since 2021 but decreased in supermarket retailers, in part reflecting the easing of Covid-19 restrictions on the hospitality sector.
We also refined how we process the data to better suit our modelling needs, as set out in our technical appendix. These changes allowed us to create a more comprehensive product-level dataset for all foods that would be subject to a retailer health target. Following these updates (for example, we now include ice-creams in our modelling), we have updated some of our previous estimates, such as for the overall healthiness of food sales from large retailers.
Box 2: How population diets and the food sector have changed from 2021 to 2024?
Our analysis shows that the following two key aspects of GB food purchasing have remained consistent from 2021 to 2024, meaning that our recommendation to implement health targets for large supermarkets continues to be relevant and supported by the evidence:
- Large retailers still account for the vast majority (over 80%) of the total calories purchased in GB, and over 90% of the calories bought to eat at home. This means that regulation targeting retailers continues to represent the single biggest opportunity to reduce calorie intake and, in turn, obesity.
- The overall healthiness of food sales for the 11 largest retailers has remained stable at 66 sales weighted average cNPM. This is despite restrictions on location promotions for unhealthy foods coming into force in October 2022. This suggests we need more ambitious policies (like the healthy food standard) to make real gains in the healthiness of foods.
2. Refined our approach to assessing feasibility for businesses by identifying the most efficient routes for individual retailers to reach a given target
We updated our modelling so that it now identifies the most 'efficient' ways each retailer could meet a health target, using the two main levers available: (i) changing product recipes via reformulation to make them healthier, and (ii) shifting product sales from unhealthier products to healthier products. Our updated approach aligns better with the likely pressures and commercial realities retailers face to increase our confidence that this policy is workable in the real world.
While our previous model applied average changes across a random selection of products, the model now identifies targeted, 'efficient' actions for specific products. This means the model chooses the smallest number of portfolio changes needed for a retailer to meet the target, better reflecting how businesses are likely to behave in practice. For example, our model now prioritises actions such as reformulating a smaller number of higher-calorie staple products (such as baked goods like croissants or pastries) or increasing sales of healthier items that already sell in large volumes (like fruits and vegetables).
In practice, different businesses could, and likely would, reach the same target through many different combinations of reformulation and sales shifts (Figure 1 on the next page). In this report, we provide impact estimates on potential calorie and obesity reductions from one such efficient combination. To reflect the fact that this is just one of very many ways that retailers can feasibly reach the target, we also include examples of different combinations of actions to demonstrate how individual retailers might meet the target. The full assumptions and health impact of these different illustrative scenarios can be found in the technical appendix.
Figure 1: Our model finds one possible 'efficient' combination of reformulation and sales shifts (from a huge range of possible combinations) for each retailer to reach a given health target. Size of circles are illustrative only.
Additionally, in our previous model, we applied our reformulation and sales shift assumptions to individual retailer portfolios and then tested whether the sector as a whole could reach our recommended target of 69. In the updated model, we instead tested the feasibility of each of the top 11 retailers individually achieving different target levels (68, 69, 70) within a range of reformulation and sales shift limits.
3. Refined and tested a range of assumptions about the levels of reformulation or product sales shifts that businesses might realistically implement to meet a health target
As in our previous work, we assumed retailers can improve the healthiness of their sales using two levers: reformulation and sales shifts (Figure 2). In reality, retailers would have flexibility in the portfolio changes they make to reach a target. As before, we did not directly model other actions that retailers could take, such as changing the portion sizes of food. We also continued to only model scenarios that do not change a retailer's revenue by more than +-0.1% (previously +-1%), reflecting the need to particularly limit cost impacts on both consumers and businesses during the ongoing cost of living crisis.
Figure 2: Similar to our previous work, our updated model allowed businesses to use two main mechanisms (reformulation and sales shifts) to try to reach a given health target.
In our updated model, we set limits on the extent of reformulation and sales shifts that retailers could use to meet a given target. In general, these limits were as strict as, or stricter than, those in our previous model. Crucially, our findings show that all but one retailer can meet a target of 69 with changes well within these limits; only the retailer with the least healthy baseline needs to approach the maximum levels allowed in the model.
Given the limited evidence base, such as on typical or technically feasible reformulation thresholds for different food categories, there is inherent uncertainty in some of the assumptions underlying our model. This is a common challenge when modelling the impacts of food policies, particularly where reformulation is a key component. Our approach to developing our model assumptions has been to draw on our partnerships and trials with the food industry, existing literature, and original analysis where possible (see Box 3).
In this report, we present the potential impact of a retailer-targets policy on calories consumed and obesity prevalence, where all 11 largest retailers achieve a target of 69 under a set of feasible but ambitious reformulation and sales shift constraints. We also tested many different scenarios with smaller limits on reformulation and sales shifts, which showed that most of the top 11 retailers can achieve a target of 69 with much smaller changes than the maximum limits allowed in our main model. Details on our full assumptions and the resulting public health impacts for these different scenarios can be found in the technical appendix.
Box 3: Our approach to setting model assumptions and constraints
In our updated modelling, we set a series of 'maximum' limits on how retailers could use sales shifts and reformulation to achieve our recommended target of 69 SWA cNPM. However, almost all retailers are able to meet the health target with significantly smaller shifts than these maximums.
|
|
|
Target SWA cNPM score for each business |
| Lever 1 – reformulation |
Maximum % of eligible products that a business can reformulate*
roughly ~65% of all unique products |
Up to 20% |
In reality, many retailers can achieve the target with smaller shifts than the maximums allowed *As a share of ~65% of all unique reformulable products. Exact share can differ for each retailer. In the model, a product could see both reformulation and sales shifts. |
|
Maximum increase in cNPM score for products that reformulate |
Up to 10 |
|
| Lever 2 – sales shifts |
Maximum % of products that a business can sales shift |
Up to 15% |
|
|
Maximum range of sales shifts for individual products |
Up to ±10% |
|
| Constraint: Revenue neutrality |
Maximum change in revenue after applying levers |
±0.1% |
|
From our full product-level dataset, we first identified a subset of foods that we thought could reasonably be reformulated by manufacturers. For example, we excluded categories not suitable for reformulation, like oils or fruit and vegetables, as well as ingredients like flours and sugars. After applying these exclusions, we calculated roughly 80% of products (making up 65% of food sales) could potentially be reformulated.” We modelled reformulation shifts only on these 'eligible' foods.
We then assumed (i) the share of products that a business could reformulate and (ii) the improvement in cNPM score for each eligible product that was reformulated.
Our input assumptions on reformulation are pragmatic, informed by a review of limited evidence on the topic, our extensive engagement and trials with food industry partners, as well as original analysis. We spoke with nutritionists to determine the likely level of reformulation possible in certain categories. We also studied the Public Health England voluntary reformulation programmes for sugar, salt, and calories to understand what an ambitious yet feasible level of reformulation by industry could be. For example, we found that baked crisps have a roughly 14 cNPM point improvement on traditional fried crisps. While a cNPM gain of 10 is ambitious, we have also tested smaller cNPM shifts, results for which can be found in the technical appendix.
2. Setting assumptions on lever 2 – sales shifts
The model also allows retailers to increase sales of healthier products or decrease sales of less healthy products. We set limits on (i) the share of products that could experience a sales shift and (ii) the range of positive and negative percentage sales changes for each product where sales are assumed to shift.
Our assumptions were based on the current evidence on how retailers employ promotions and marketing to drive sales in practice and conversations with experts. Evidence suggests that 20-30% of food products in four of the major UK retailers are on promotion at any point, suggesting that retailers could reasonably expect to achieve similar levels of sales shifts in order to meet a health target. There is also evidence that putting products on promotion can encourage consumers to increase purchases by about 18%, suggesting that our maximum sales shift depth of up to 10% for an individual product is within reasonable bounds.
3. Constraints on revenue impact
In order to reflect the ongoing importance of limiting the impact of potential policies on consumer prices during the ongoing cost of living crisis, we set a stricter limit on the revenue changes a business might see due to changes in their business practices to meet a given health target (±0.1%) compared to our initial model (±1%).
Our findings from the updated modelling
Key finding 1 – all 11 retailers can meet a target of 69, which could lead to a 19% reduction in adult obesity
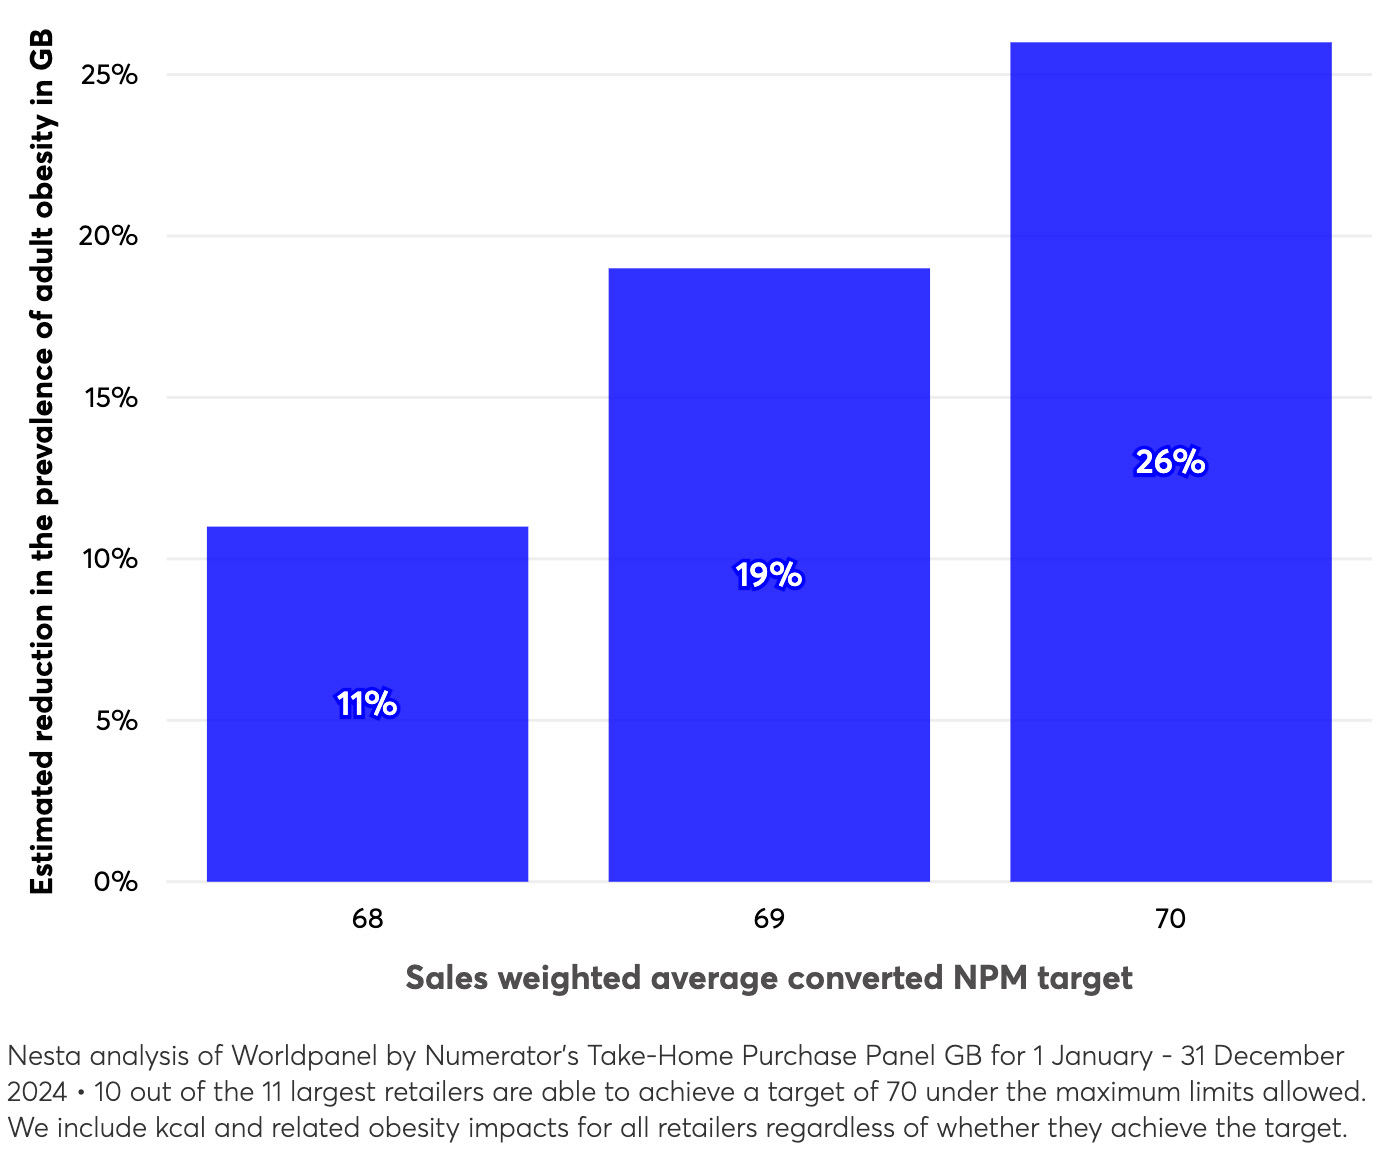
Our modelling indicates that all 11 major retailers should be able to achieve a health target of 69 SWA CNPM within the reformulation and sales shift limits allowed in our model. This would lead to a potential reduction of 19% in the prevalence of adult obesity in Great Britain, implying a fall in adult obesity rates from ~30% to 24%.
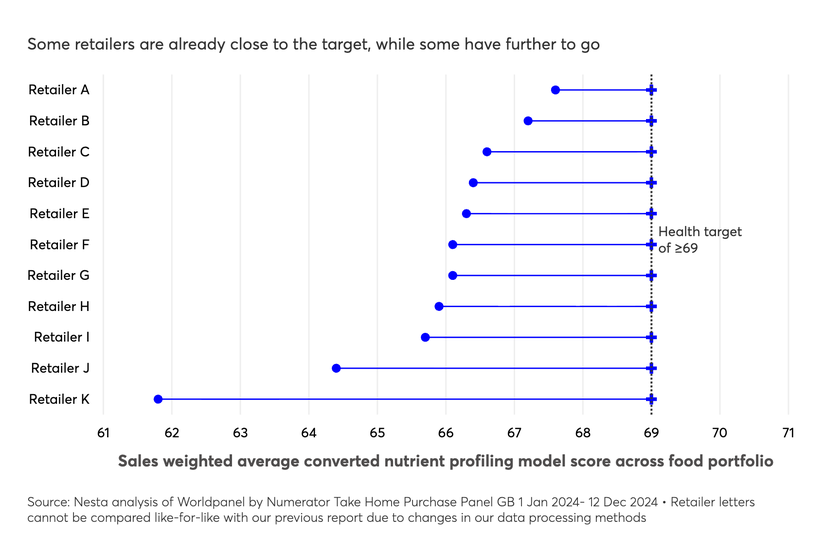
We consider 69 SWA cNPM to be an ambitious yet achievable target, striking a balance between business feasibility and potential public health impact. This target is slightly higher than the healthiest retailer in 2024, ensuring that all retailers are incentivised to improve their portfolios. Some retailers will need to make significantly larger improvements than others to reach this target, but this is crucial if we want to improve the food environment for all consumers (Figure 3). Setting an ambitious target for all retailers is key to driving improvement across the country and enabling equitable access to healthy food: ensuring the healthy choice can be the easy choice, no matter where you shop.
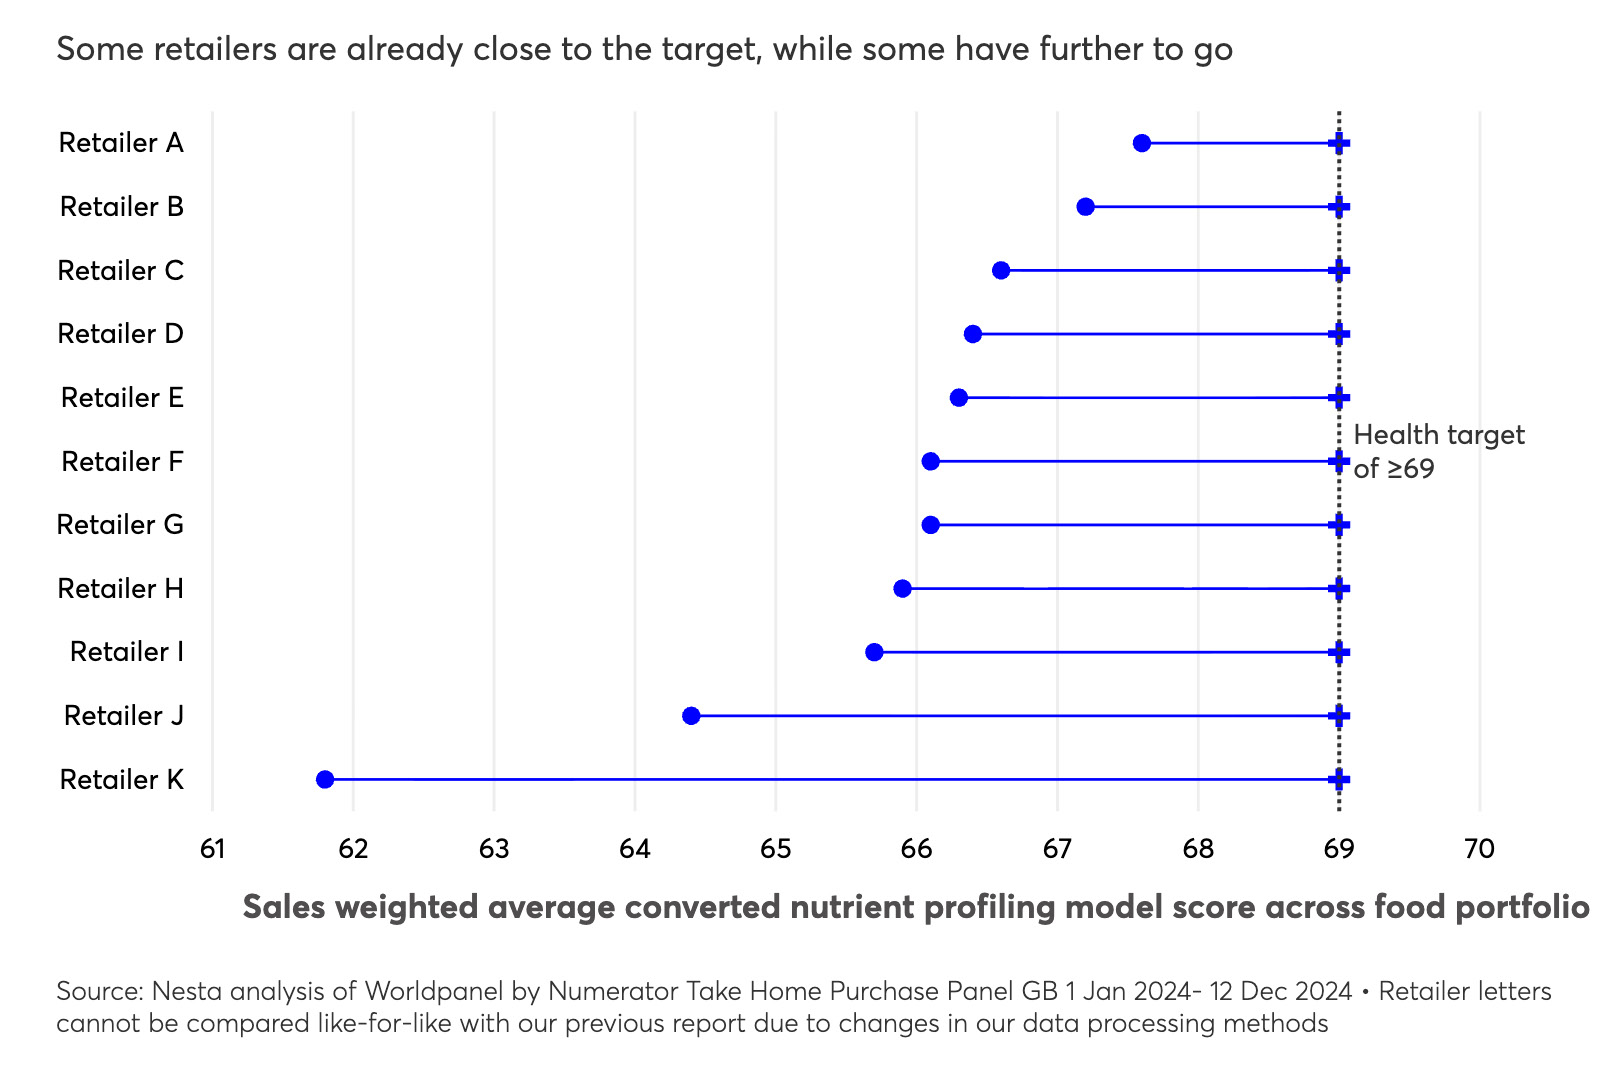
Source: Nesta analysis of Worldpanel by Numerator Take Home Purchase Panel GB 1 Jan 2024-12 Dec 2024. Retailer letters cannot be compared like-for-like with our previous report due to changes in our data processing methods
If all 11 retailers were to achieve a health target of 69, this could also significantly reduce childhood obesity in Great Britain by 23% (Figure 4). This means the healthy food standard remains one of the most impactful policy options to tackle obesity in both adults and children, and the most impactful option being currently developed by the government.
We did not model impact for Wales as the latest National Survey for Wales dataset was not available at the time of analysis.
Reductions in adult obesity driven by this policy could generate societal benefits of around £20 billion each year in Great Britain, including through improved economic productivity and lower healthcare costs (Figure 5).
Figure 5: Implementing a health target of 69 could lead to large social, economic, and health benefits
- 3% fewer calories (79 kcal) per adult per day
- 19% lower adult obesity in Great Britain
- 23% lower child obesity in Great Britain
- £20 billion annual benefits in Great Britain from reduced adult obesity
Across all four scenarios we tested, we found even if fewer retailers met a target of 69, the policy would still lead to significant reductions of around 15-20% in the prevalence of adult obesity in GB. This is because all retailers make significant improvements in the healthiness of their portfolios, even if they do not achieve the full target.
Importantly, our estimates only capture the health and economic impacts driven by reduced obesity. We assumed a share of reformulation is driven by reductions in calories, which in turn leads to reductions in obesity prevalence. We did not model other positive health benefits that the policy might drive, such as from lowered sugar or saturated fat consumption.
Retailers might also focus their efforts on other nutrients that don't directly impact obesity, such as salt, which could lead to larger reductions in cardiovascular diseases or stroke incidence. However, since retailers must still hit the same cNPM target, the overall public health benefits would likely be similar to our estimates, even if the impact on obesity is lower.
The health impact of this policy also depends on the level at which the target is set. For instance, setting a target of 68 would lead to smaller health benefits, while a target of 70 would lead to larger ones (Figure 6). Indeed, the government could increase the target over time to both reflect and drive continuous improvements in the healthiness of food sales, while providing retailers with sufficient time to make the changes required to meet the target.
Figure 6: A higher target can have increasingly greater impact on adult obesity in GB
The feasibility of retailers to reach a target differs, and also depends on the time-frame for implementation

Nesta analysis of Worldpanel by Numerator's Take-Home Purchase Panel GB for 1 January - 31 December 2024. 10 out of the 11 largest retailers are able to achieve a target of 70 under the maximum limits allowed. We include kcal and related obesity impacts for all retailers regardless of whether they achieve the target.
Modelling shows that 10 of the 11 largest retailers can meet the target while remaining well below the model's maximum limits on portfolio changes. As discussed previously, these maximum limits were: reformulating up to 20% of eligible products by up to cNPM 10 points, and sales shifting up to 15% of all products by ±10% (full assumptions are in Box 3). These changes also don't need to happen all at once: retailers can make incremental improvements over several years to meet the target, depending on the implementation timelines set out by the government.
Only the retailer with the least healthy portfolio needs to achieve reformulation and sales shifts close to the maximum allowed in the model to reach the target. The maximum shift levels in our model gave this retailer enough flexibility to achieve the target, but they are much higher than the shifts the rest of the retailers need to make.
The modelled reformulation and sales shifts needed for the 11 largest retailers to achieve a target of 69 vary for each retailer, and are generally smaller than the model maximums. When we aggregated these shifts across all 11 retailers, we found that the sector can meet a target of 69 by reformulating or sales shifting around 5% of all products (see Table 3 in the technical appendix).
In our model, a maximum of 20% of 'reformulatable' eligible products, equating to 16% of all products across all retailers, could be reformulated. Each retailer has a different share of reformulatable products depending on their current product mix, from 50% to >70%.
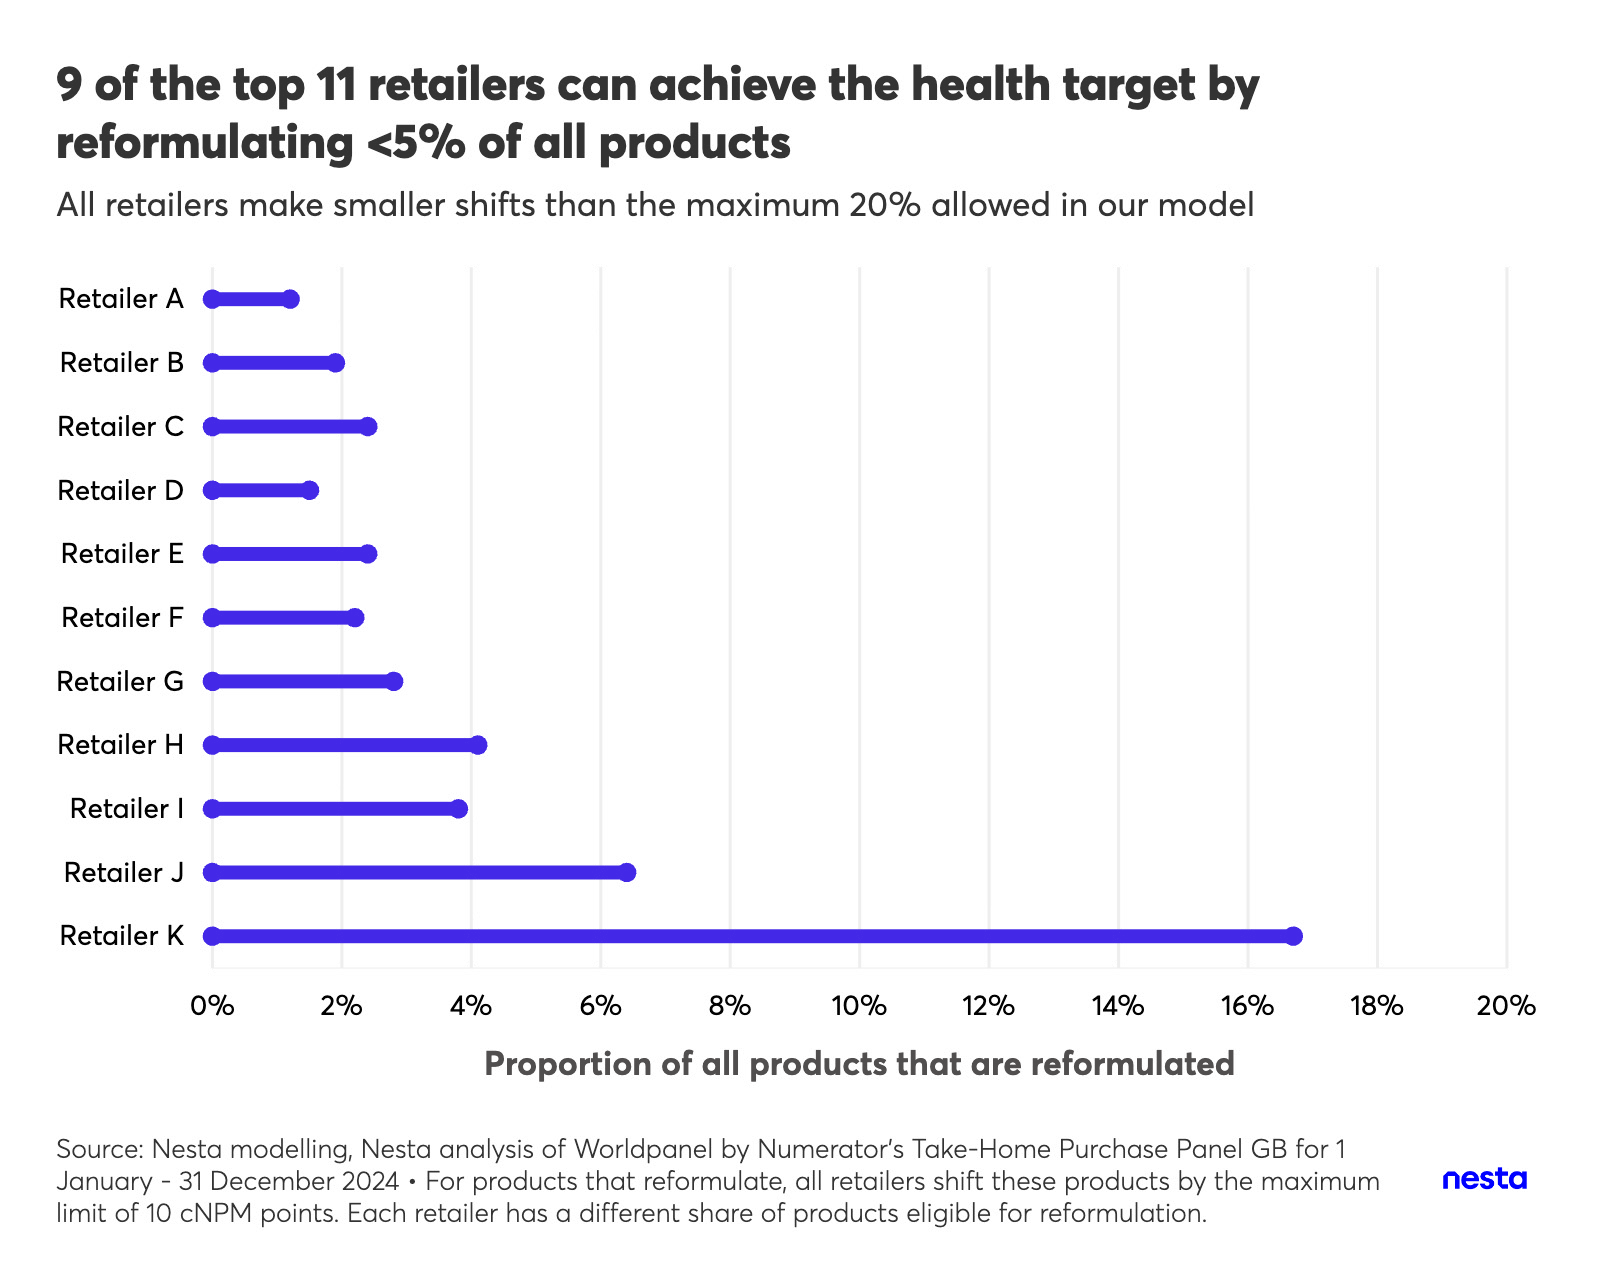
Source: Nesta modelling, Nesta analysis of Worldpanel by Numerator's Take-Home Purchase Panel GB for 1 January - 31 December 2024. For products that reformulate, all retailers shift these products by the maximum limit of 10 cNPM points. Each retailer has a different share of products eligible for reformulation.
For our main reported model, all retailers were found to reformulate products by adding 10 cNPM points on average. Across different model scenarios, we found that the model chooses to make reformulation shifts over sales shifts as these can be more efficient in improving scores. As outlined ahead, most retailers can achieve a target of 69 with shifts less than cNPM 10.
Sales shifts
In our model, a maximum of 15% of all products for each retailer could be sales shifted by a maximum of 10% in either direction.
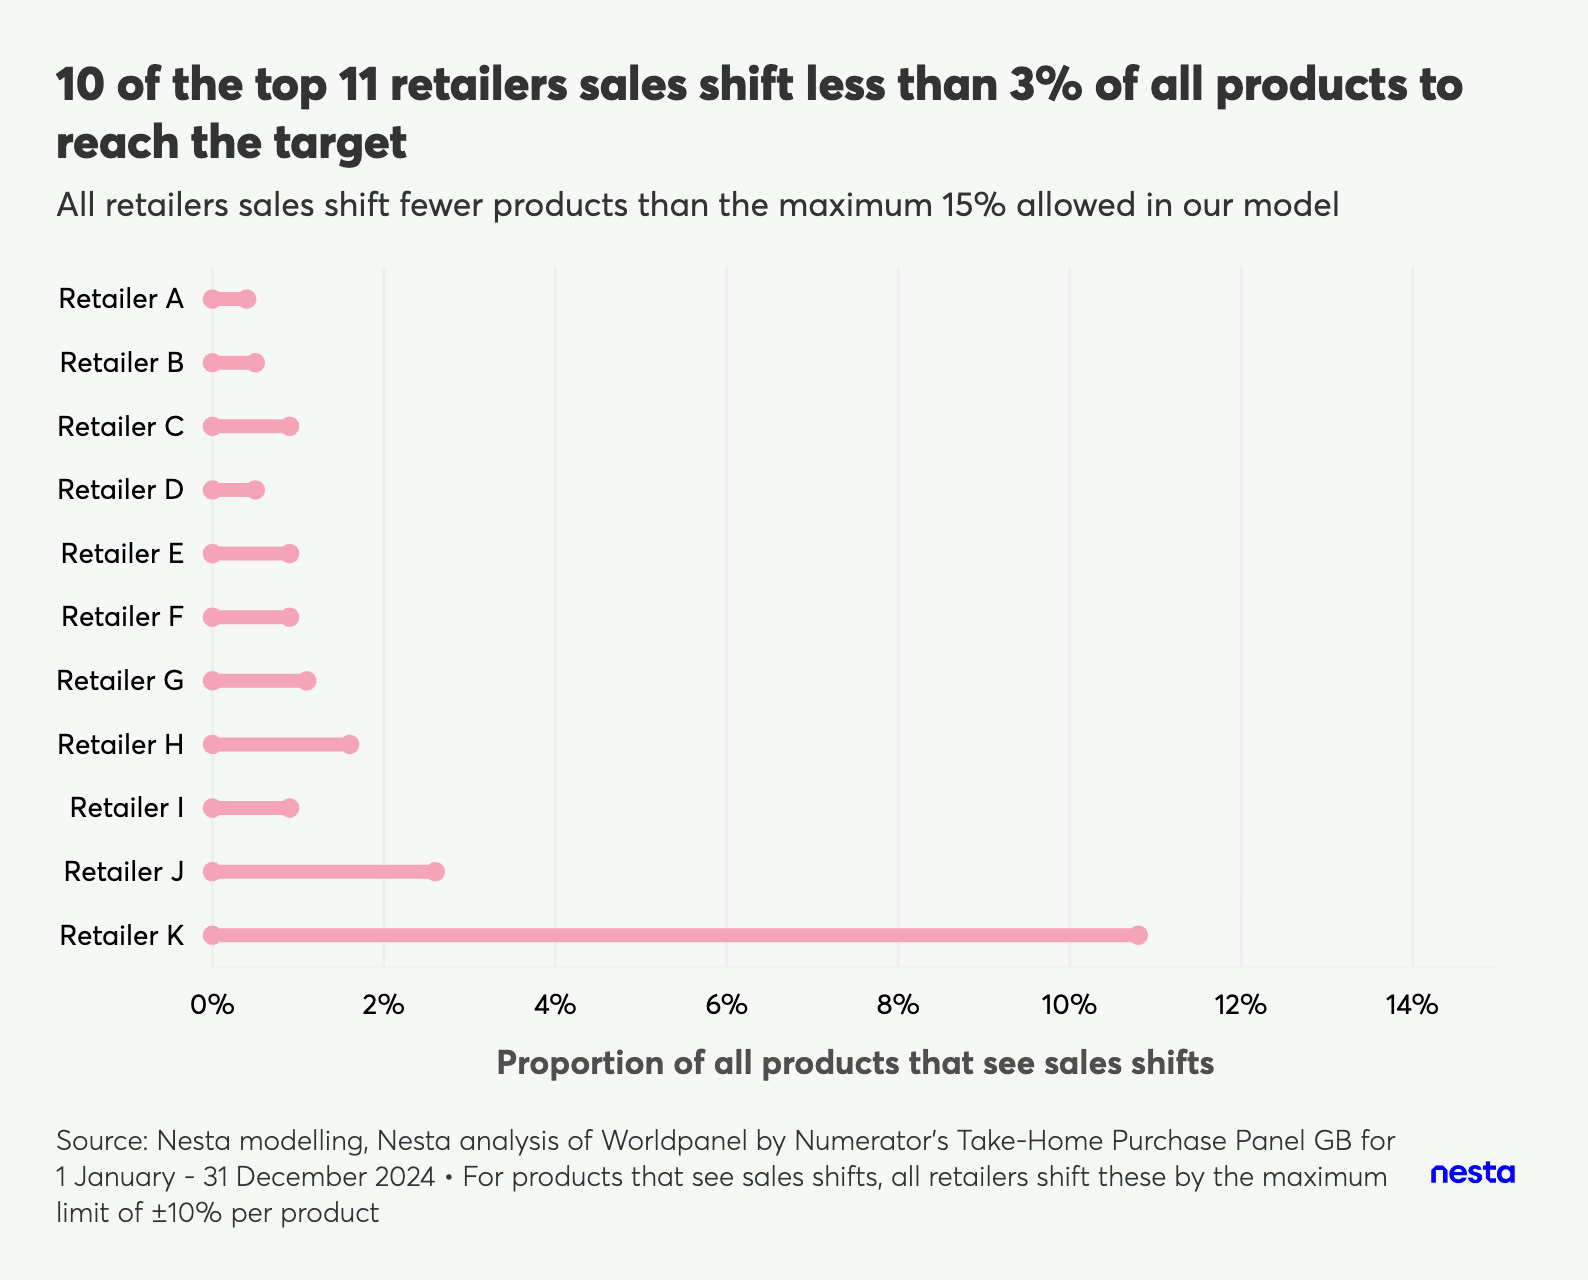
Source: Nesta modelling, Nesta analysis of Worldpanel by Numerator's Take-Home Purchase Panel GB for 1 January - 31 December 2024. For products that see sales shifts, all retailers shift these by the maximum limit of ±10% per product.
In the modelled scenario, we found that all retailers shift sales by an average of ±10% per product, as the model likely prioritises making larger shifts in a fewer number of products.
We also tested what happens if we applied much stricter limits on the reformulation and sales shifts that retailers can make to reach a target of 69 (three scenarios outlined in the technical appendix). We found that 10 of the 11 retailers could still meet this target in stricter limits across all the parameters we tested, while the 11th retailer also made significant progress (35-70% of the target improvement) towards the target. We found that applying stricter model limits still led to similar levels of health impact on calories and obesity, suggesting that most retailers can significantly improve the healthiness of their portfolios within even smaller shifts than those reported in our main model.
On the next page, we show illustrative combinations of how a selection of retailers could make smaller shifts that prioritise varying levels of sales shift and reformulation changes than those allowed by our main reported model to get to a target of 69. We also illustrate how a single retailer (using Retailer B as an example) can achieve the target using different combinations of sales shifts and reformulation. We provide more details on the different ways in which individual retailers could achieve a health target of 69 in the technical appendix.
Meeting the health target
Retailers have flexibility in how they meet the health target, and can reach a target of 69 in generally smaller shifts than we previously estimated.
Legend:
Share of products that reformulate
Share of products that sales shift
Visual Scale:
4 6 8 10
Darker blues represent larger improvements in a product's CNPM score and lighter blues are smaller improvements.
Darker pinks represent larger sales shifts for a given product and lighter pinks are smaller sales shifts.
± 5% ± 10%
*In all illustrative scenarios, the change in cNPM score and sales shifts per product are the volume weighted averages of the respective changes across all products reformulated or sales shifted
Depending on the healthiness of their current sales, retailers can reach a target of 69 within even stricter limits on reformulation and sales shifts
Illustrative reformulation and sales shifts for 3 retailers to reach a health target of 69
Where each grey block represents 1% of a retailer's full food portfolio
- Retailer A (baseline 68)
- (Visual representation of blue and pink blocks)
- Retailer F (baseline 66)
- (Visual representation of blue and pink blocks)
- Retailer K (baseline 62)
- (Visual representation of blue and pink blocks)
Each individual retailer has flexibility in how they achieve the target, using a different combination of reformulation and sales shifts
Illustrative reformulation and sales shifts for Retailer B (baseline 67) to reach a target of 69
Where each grey block represents 1% of a retailer's full food portfolio
- Modelled option 1
- (Visual representation of blue and pink blocks)
- Modelled option 2
- (Visual representation of blue and pink blocks)
- Modelled option 3
- (Visual representation of blue and pink blocks)
As noted earlier, our impact estimates assume each of the 11 retailers follows one efficient route to reach the target within the model constraints. In practice, there are a huge number of combinations of reformulation and sales shifts that could achieve the same outcome, which we consider to be one of the most important strengths of this policy.
A key benefit of this policy is that it gives businesses flexibility in how they meet a health target, using strategies they already deploy, such as reformulation, shifting sales through marketing and product placement, or changing portion sizes. Retailers can combine these approaches in different ways, depending on their product mix, commercial strategy and customer base.
For example, some retailers may focus on reformulating popular ready meals or snacks, while others may prioritise increasing sales of healthier products such as fruit and vegetables. Using a sales-weighted average cNPM score also allows flexibility in how businesses reformulate products: improvements could come from a large reduction in one nutrient, such as sugar, or from smaller changes across several nutrients.
Interestingly, our modelling suggests that combining reformulation and sales shifts is more effective to reach a target than relying heavily on a single lever. For example, we found it can be much harder for retailers to meet the target if they rely mainly on sales shifts with little reformulation.
Key finding 4 – retailer targets can drive small yet meaningful improvements in the healthiness of food baskets, in a manner that is barely noticeable to consumers
We recommend setting a health target across a retailer's entire food portfolio. Because the target is based on a sales-weighted average, retailers have the flexibility to either make small changes across a wide range of products or larger changes in a few products. These changes, driven via reformulation and sales shifts, are likely to be less noticeable to consumers, in turn helping improve diets without relying on consumers to actively change their food choices. As mentioned, we only modelled scenarios where portfolio changes do not impact a retailer's turnover by more than ±0.1% to limit potential downstream increases in consumers' spend.
To meet the health target, retailers can use familiar, effective levers to reshape the food environment, such as restricting prominent placement or price promotions of less healthy foods. As a result, retailer targets can have a sustained effect on diets by helping to overcome the well-established intention-behaviour gap, where people may want to eat more healthily, but do not consistently do so. This gap may be particularly pronounced for people on lower incomes, who face tighter constraints on their time and attention, suggesting health targets might be beneficial in reducing diet-related health inequalities.
Box 4: How we developed the illustrative shopping baskets for a typical GB consumer and a consumer on a lower income
We developed two baseline shopping baskets: one for a typical consumer in GB and one for a consumer on a lower income. The GB basket reflects a typical mix of products that contribute the most calories to an adult's weekly shop, with a baseline overall health score of 66 SWA cNPM, similar to the average across the 11 retailers in 2024. The weekly cost matches published estimates of weekly spend on food reported in the 2024 Family Food survey. The lower-income basket has a lower baseline health score of 65 SWA cNPM, which matches the average purchases from low-income households across the 11 retailers in 2024. This basket amounts to an overall spend that is in line with published statistics for the ONS Family Spending Workbook from 2024.
We then show examples of baskets that represent an improvement of 3 cNPM points, resulting in a health score of 69 for the typical GB consumer and 68 for consumers on lower incomes. For the typical GB consumer, we show 2 baskets after meeting the health target: one that relies more on reformulation, and one that relies more on sales shifts.
The baskets contain 22 products, of which seven change between the scenarios. These changes include reformulated products, shifting sales towards healthier alternatives, or slightly smaller portion sizes. Whilst we do not directly include portion size in our modelling, this is a lever available for retailers and therefore we include it in the consumer baskets as a potential route to change.
Many of these adjustments are relatively small and would be unlikely to significantly change the nature of a consumer's weekly shop. Further detail on how the baskets were constructed can be found in the technical appendix.
Figure 7: Retailer targets can drive small yet meaningful improvements in what people eat, with retailers having flexibility in using either (1) more reformulation or (2) more sales shifts
Illustrative weekly shopping basket for an average consumer in GB
Legend:
* Reformulation
* Product swap
* Portion size
CURRENT SHOP
- Pain au chocolat
- Chicken thighs
- White toastie bread
- Sweet and sour chicken w/ rice
- Milk chocolate bars
- Ready salted crisps
- Mozzarella
- Honey nut corn flakes
- Custard creams
- Chocolate layered desserts
- Hash browns
- Fusilli pasta
- Apples
- Bananas
- Free range eggs
- Lemon curd yoghurt
- Brown onions
- Carrots
- Broccoli
- Baked Beans w/ sausages in tomato sauce
- Plain flour
- Salted butter
TOTAL COST: £30
CNPM SCORE: 66
HEALTHIER SHOP 1 WITH MORE REFORMULATION
- Pain au chocolat
- Chicken thighs
- White toastie bread
- Chicken shawarma w/ rice
- Chocolate chip nougat bars
- Ready salted crisps
- Mozzarella
- Frosted flakes cereals
- Custard creams
- Chocolate layered desserts
- Hash browns
- Fusilli pasta
- Apples
- Bananas
- Free range eggs
- Lemon curd yoghurt
- Brown onions
- Carrots
- Broccoli
- Baked Beans w/ sausages in tomato sauce
- Plain flour
- Salted butter
TOTAL COST: £29
CNPM SCORE: 69
HEALTHIER SHOP 2 WITH MORE SALES SHIFTS
- Pain au chocolat
- Chicken thighs
- White and fibre bread
- Chicken tikka masala w/ rice
- Milk chocolate
- Baked salted crisps
- Mozzarella
- Honey nut corn flakes
- Custard creams
- Chocolate and hazelnut pudding
- Hash browns
- Fusilli pasta
- Apples
- Bananas
- Free range eggs
- Light banana custard yoghurt
- Brown onions
- Carrots
- Broccoli
- Baked Beans w/ sausages in tomato sauce
- Plain flour
- Salted butter
TOTAL COST: £29
CNPM SCORE: 69
Current shop derived from Nesta analysis of Worldpanel by Numerator's Take-Home Purchase Panel GB for 1 January - 31 December 2024. See Box 4 for more details.
We also illustrated how the policy might impact the weekly shopping baskets of families on lower incomes. Research shows households in the most deprived communities tend to, on average, consume a higher share of their calories from less healthy products. One potential concern is that switching to more expensive, healthier alternatives could increase costs for lower-income households. Our findings suggest that it is possible for these households to achieve the same improvement in overall healthiness of their basket while staying within the same overall budget, with the same number of healthier swaps as a typical consumer (Figure 8).
Figure 8: It is possible for households on lower incomes to buy a healthier food basket without increasing costs
Illustrative weekly shopping basket for a consumer on a lower income in GB
Legend:
* Reformulation
* Product swap
* Portion size
CURRENT SHOP
- Lightly fruited cake
- Medium sliced white bread
- Salted butter
- Spaghetti bolognese
- Milk chocolate bar
- Chicken drumsticks
- Bourbon creams
- Ready salted crisps
- Frosted flakes cereal
- Cheese slices
- Cheese and tomato pizza
- Ham slices
- Granulated sugar
- Baking potatoes
- Carrots
- Baked beans in tomato sauce
- Apples
- Bananas
- Fusilli pasta
- Free range eggs
- Plain flour
TOTAL COST: £21
CNPM SCORE: 65
HEALTHIER SHOP
- Fruited malt loaf
- Medium sliced white bread
- Salted butter
- Spaghetti bolognese
- Milk chocolate bar
- Chicken drumsticks
- Bourbon creams
- Ready salted crisps
- Frosted flakes cereal
- Mozzarella
- Cheese and tomato pizza
- Cooked ham slices
- Granulated sugar
- Baking potatoes
- Carrots
- Baked beans in tomato sauce
- Apples
- Bananas
- Fusilli pasta
- Free range eggs
- Plain flour
TOTAL COST: £21
CNPM SCORE: 68
Current shop derived from Nesta analysis of Worldpanel by Numerator's Take-Home Purchase Panel GB for 1 January - 31 December 2024. See Box 4 for more details.
Considerations for policymakers while implementing a health target for retailers
The healthy food standard represents a step change in how we tackle obesity by targeting the food that's promoted, advertised and available to us. Our updated modelling results continue to evidence that mandatory targets for retailers is a landmark opportunity to improve our food system, but we need the government to swiftly implement the policy to turn the tide on the nation's health for good.
The government must act swiftly to introduce the healthy food standard in full this Parliament
At Nesta, we recommend that legislation required to implement the healthy food standard, including both mandatory reporting and targets, is introduced as soon as possible and within this Parliament to prevent the potential impact of the policy being lost to dilution and delay. The legislation should set out the overall framework for the policy, including mandating large food businesses to report on the healthiness of their sales, and outline a clear but reasonable timeline for an implementation and enforcement regime for health targets across sectors.
The first key step to mandatory targets is to establish data reporting on the healthiness of food sales. Through data collection, the government would have a more up-to-date view of the healthiness of food sold by large businesses. The government can use this data to set an appropriate health target which drives meaningful improvement from the baseline, along with a realistic timeline for enforcement of the target. Indeed, evidence shows it is targets that will drive impact on obesity prevalence.
The government should consider starting to implement the policy within large supermarket retailers, which account for over 80% of the calories consumed in the UK. Most major retailers already have the data infrastructure needed to move quickly towards a target. To maintain a level playing field, the government should also look to introduce targets for the out-of-home sector, while carefully managing the operational burden on those businesses. By ensuring all applicable large food businesses are captured by this regulation, the government can ensure every major player in the food system is contributing to a healthier nation.
We have also seen that businesses are often proactive in responding to upcoming policies. As with the Soft Drinks Industry Levy, when government intention is clearly stated, businesses might begin to reformulate products or adjust their product mix well ahead of the formal enforcement of a policy. With the government announcing the healthy food standard in 2025, it is possible that businesses might start to make
progress towards health targets even before the final target levels are set in legislation. For example, Asda, one of the largest retailers in the UK, has set a healthiness target across the business and started to test ways to meaningfully shift consumer purchasing in trials with Nesta.
We think enforcement mechanisms, including penalties for missing the target, should be introduced once mandatory data reporting is fully established and a specific health target has been set using actual business data collected via that reporting. This approach would ensure the target is reflective of business sales, rather than relying on consumer survey data, such as that used in our modelling. Ultimately, these penalties are at the discretion of the regulator.
The government must choose a retailer target that balances feasibility for retailers, public health impact, and the timelines for enforcement
Our recommendation is that the government should set the mandatory target at a level that is achievable and pragmatic for large food businesses, while still driving meaningful improvements in population health. For example, our analysis shows that a target of 69 SWA cNPM for large retailers, set slightly higher than the current healthiest major retailer, would encourage substantial but achievable improvements across retailers. We estimate that this target could be feasibly met by all retailers within three years of the target being in force.
The health target could be implemented in a phased way that reflects improvements across the sector. For example, as retailers make progress and health scores across the retail sector improve, the government could increase the level of ambition of the target. However, the government would likely need to set higher targets over a longer timeframe to allow businesses sufficient time to adjust and deliver the required changes.
The government must also decide which retailers will face a mandatory target and how this target is set. While our analysis focused on the top 11 retailers, we also tested the potential impact if a mandatory target were set for 2 additional large food businesses that are regulated by the Grocery Code Adjudicator. The baseline SWA cNPM of these 2 additional businesses was considerably lower at 50 and 53, compared to a sector average baseline of 66 SWA cNPM or even the unhealthiest large retailer. Our findings suggested that these businesses cannot reach a target of 69 under the scenarios we tested. However, because these businesses have a small proportion of market share, the overall impact of the policy remains similar, resulting in a reduction of obesity prevalence in GB by 20%. Full results for all 13 businesses can be found in the technical appendix.
The healthy food standard is a landmark opportunity to improve our food system. Our updated modelling reinforces the case for retailer health targets as a feasible, ambitious, and impactful policy to improve the UK's food environment. Using the latest purchasing data and an updated modelling approach, we found that all 11 top retailers can meet a health target of 69 with smaller changes than previously estimated, while still delivering very meaningful reductions in obesity of 19%.
As the UK government moves forward with the healthy food standard, setting clear, ambitious, and pragmatic targets for retailers and other food businesses will be an important step towards making healthier food the easier choice. If we get this right, this policy could open a new chapter in our efforts to improve our health and make a meaningful change to obesity in the UK.
Endnotes
Background
In February 2024, Nesta published the report ‘Targeting the health of the nation: health targets for supermarkets'. The government subsequently announced the healthy food standard, part of the 10 Year Health Plan for England, which expanded our recommendations to all large companies in the food sector, including out-of-home (OOH). Subject to consultation and subsequent legislation, the healthy food standard will require large food businesses to report on the healthiness of their food sales and meet a minimum mandatory target for healthy food sales.
To support the implementation of the healthy food standard, we updated our impact estimates for retailer health targets using the most recent available data on food purchases. We also refined our modelling approach and underlying model assumptions to find more efficient yet realistic methods for businesses to achieve a given health target. Our technical appendix explains these updates, as well as our analytical approach to model the impact of targets on population health.
Summary of the project methodology
Figure 1: Our modelling consisted of five components
The diagram shows a process flow with five main steps, starting from "Hierarchical mixed effect model (for reformulated products)", which feeds into "Step 1: Data preparation".
The five steps are:
* Step 1: Data preparation (Missing volume imputation, nutritional cleaning, adult apportionment)
* Step 2: Establishing baselines (Daily adult calories, sales weighted average nutrient profiling model scores)
* Step 3: Sales modelling (linear optimisation) (Mimic efficient ways in which retailers might use reformulation and sales shifts to achieve a given target within revenue neutrality)
* Step 4: Impact on obesity prevalence (Range of calorie and obesity impacts for adults and children, in GB, England, and Scotland)
* Step 5: Illustrative shopping baskets (Baskets representing weekly shops before and after a health target was achieved)
The research consisted of five components (Figure 1):
- Preparing the underlying dataset for analysis from Worldpanel by Numerator's Take-Home Service for Great Britain (GB) for our modelling needs
- Establishing a baseline of daily calories purchased by GB adults and summary statistics on the healthiness of retailer sales in 2024
- Modelling different levels of reformulation and sales shifts in retailers' portfolios using a linear optimisation model to reach a given health target
- Modelling the impact on adult and childhood obesity prevalence in GB based on the decrease in daily calories across different model assumptions
- Generating illustrative shopping baskets to visualise what a consumer might buy in a week before and after health targets are implemented
Step 1 - preparing the underlying dataset for analysis from Worldpanel by Numerator's Take-Home Service for Great Britain (GB)
This work used product-level, unweighted data acquired for our analytical requirements from Worldpanel by Numerator, an international market research company. The primary dataset comprises GB food and drink purchases taken into the home (Take Home) from 1st January to 31st December 2024 for a sample of approximately 30,000 households in Great Britain, and includes demographic, nutrition, price and volume data.
In order to create the complete dataset suitable for consistent analysis across large markets, Nesta independently linked product-level nutrition information with sales data. This enabled the calculation of sales-weighted nutrient profiling model (NPM) metrics, following the government's 2004-05 NPM methodology. For the purpose of modelling public health impact, Nesta used the 2019 Health Survey for England and the 2019 Scottish Health Survey obtained from the UK Data Service.
All analysis and interpretation were undertaken independently of Worldpanel by Numerator. All conclusions are exclusively those of Nesta and should not be attributed to, or interpreted as representing the views of Worldpanel by Numerator (hereafter referred to as 'Worldpanel').
Our original data processing methodology can be found in the previous report. We have since refined how we process the data to suit our modelling needs, as described below:
- Adding volume data where not reported: We imputed ~12% of product volume data that is typically not reported in the food & drink market, using a hierarchical process. We first extracted additional volume information from text fields within the dataset where available. We manually specified the weight values of eggs using standardised nutritional references. The remaining <5% of non-reported values were imputed from category medians.
- Updating how we process nutritional information:
- Since 2021, we have switched to using kilojoules as our default measure for energy content. We converted the kilojoules figures into calories and carried out additional validation checks. As a result, we increased the number of products with energy information by ~0.5%.
- We created a single point of reference nutrient profile for each product across the analysis period by taking the intra-product weighted median of nutrient information available in the Worldpanel data. This approach is specific to our analytical requirements. Using the median minimises outlier influence, and the weighted calculation ensures data points contribute proportionately to their popularity, providing a more consistent basis for measurement of a product's nutrition, compared to our 2021 approach.
- As part of our preparation of the product-level dataset for analysis, we removed products with implausible nutrition values based on calorie density (kcal/100g > 900) and nutrient density (> 100g/100g for each nutrient) for all nutrients that are included in our NPM score calculations.
- We also increased the volume of in-scope foods sold by retailers through a review of foods and liquids categories. This meant we included items like cooking oils and ice creams, which were previously excluded.
- Identifying categories in scope of the policy: We expanded the number of categories in scope to better align with current legislative categories. As a result, we included product categories such as ice creams that were previously out of scope. This also meant more high-calorie products are included in our baseline daily calories figures compared to those published using 2021 data.
- Identifying the largest retailers in scope of the policy: Although the main part of our analysis remains focused on the top 11 retailers with at least 1.5% market share each, we also included scenarios with all businesses that were available to us that are regulated by the Grocery Code Adjudicator (GCA), regardless of market share. This expanded the number of businesses included from 11 to 13.
- Assessing the population in scope of the policy: To ensure the reference population remained consistent throughout our model flow, we refined our approach to report the policy's impact on calories for the adult population only, using a methodology for apportioning household calories to adults only.
Our updated analysis aims to strengthen the evidence base for our recommendation of a mandatory health target. It is important to note that, due to internal data processing changes and a shift in the analysis's scope, the findings in this current publication cannot be directly compared on a retailer-by-retailer basis with our previous findings.
Data limitations
Worldpanel data is the industry standard for food purchase behaviour in the UK. Due to the self-reported methodology of the purchasing panel, we would expect some differences between our baseline figures when compared to internal industry figures. Worldpanel data methodology relies on panelist self-reported purchases of food and drinks taken into the home. There is some general recognition in the literature that survey participants can under-report their consumption/ purchase of food (see, for example, Macdiarmid & Blundell, Gemming et al or Ravelli & Schoeller). To ensure our analysis is representative of the GB population, we applied Worldpanel's gross-up weights to the final purchase-level data. These weights account for household, response and purchase representativeness in the survey and thus ensure accurate population-level estimates of purchase characteristics and quantities. However, it is our opinion that underestimation could still be possible given the self-reported nature of the underlying data collection prior to weighting.
We applied Worldpanel's survey weights in order to represent GB households' purchasing behaviours. However, because we are using a sample to infer population trends, some sampling uncertainty will be present due to the methodology design. While we are confident our estimates are an accurate representation of the population, we cannot provide a precise confidence interval. Given the data's widespread use across government and academia, we view this limitation as minor.
Nutritional information (for example, calories, saturated fats, sugar, etc) in Worldpanel data is taken from a variety of different sources, including collecting known values, fieldwork, web scraping and a third party, which collectively account for about 69% of take-home food and drink volume. For products where nutritional information was not available or complete through one of these methods, related primarily to inherent market reasons (such as loose or count-based markets, like loose produce and bakery items), Worldpanel either clones information from the same products (for example, multipack vs single pack) (approximately 16% of take-home food and drink volume), compiles using the McCance and Widdowson Composition of Foods Integrated dataset (approximately 1.4% of take-home food and drink volume), or imputes from a category average (approximately 14% of take-home food and drink volume).
Step 2 - establishing a baseline of daily calories purchased by adults and the baseline healthiness of retailer sales in 2024
Baseline for daily calories purchased by adults in GB in 2024
Worldpanel by Numerator's Take-Home Service for GB records food purchases for the full household, with a count of the number of adults and children (by gender and age) living in each surveyed household. We previously developed a methodology to estimate the share of daily calories purchased per adult (aged 18+) from the overall household purchases for our analytical needs, which we continue to use in this work. A summary is below; the full methodology can be found on pages 2 and 3 in our previous publication.
- We estimated the proportion of calories consumed by all adults in a given household by using an adult equivalent conversion factor, which benchmarks energy intake based on the calorie requirements for different ages and genders.
- For each household, we estimated the total calories purchased by all adults by multiplying the proportions calculated in step 1 by the total calories purchased by the household.
- We multiplied these estimates by the population weights provided by Worldpanel to estimate the total annual calories purchased across the full GB adult population.
- We divided this total figure by the number of adults in GB (using the Office for National Statistics 2024 mid-year estimates), and by the number of days in a year to estimate daily calories purchased per adult in GB.
We did not observe how food is distributed within households in the data collected, so it was not possible to know the exact share of calories purchased by each household member. Our approach was based on assuming the average energy requirements for different age and gender groups are the same across all households. As a result, our method may in some cases have over- or under-estimated the share of calories consumed by each individual, but it provided a robust framework for analysing the adult population as a whole.
Baseline for healthiness of retailers' portfolios in sales-weighted average converted nutrient profiling model (SWA CNPM) scores
The nutrient profiling model score is a holistic measure of the health of food that assigns an integer score to food products based on their nutritional content (energy, sugar, saturated fat, sodium (salt), protein, fruit, vegetables and nuts; and fibre). Scores range from -15 (most healthy) to +40 (least healthy). To improve interpretability, we have used a formula developed by the University of Oxford to scale NPM scores on a range of 1 (least healthy) to 100 (most healthy). We refer to this scaled score as converted NPM (cNPM) through the report.
Figure 2: Examples of how scoring works on the converted nutrient profiling model (cNPM)
Scale from least healthy to most healthy. Non-converted NPM score is presented in brackets.
The scale ranges from 1 (least healthy) to 100 (most healthy), with examples:
* Chocolate ice cream: 36 cNPM (17 NPM)
* Chicken thighs: 70 cNPM (0 NPM)
* Carrot: 82 cNPM (-6 NPM)
We calculated the cNPM scores of products after processing the data as previously described. We then weighted these cNPM scores by the volume of products (in kilos). Sales weighting ensured that products that have a higher volume of sales contributed more to average scores than those that are less frequently purchased. Another advantage of sales weighting by volume in kilos is that it accounts for changes in portion size and multipacks (see Box 1 for a worked example). Weighting health metrics by sales volume is standard practice among government and academic publications.
As part of our data processing, we normalised all volume information to kilograms using the specific gravity mapping published in Table 4 of the Government's 2018 NPM review (a routine step for non-solid products where volumes are provided in litres, eg, oils).
We only modelled the impact of a target using the SWA cNPM score, which is Nesta's recommended metric to set retailer health targets. We no longer model other metrics, such as energy density or proportion of unhealthy products, which we included in our previous report.
Box 1: How does sales weighting work in practice?
Consider an example of three products with the following cNPM values: product A is 50, product B is 25, and product C is 80. The unweighted average is the sum of these values divided by three, which is 52.
However, imagine that 50 kilos of product A are sold, 100 kilos of product B and 10 kilos of product C. The sales weighted average is calculated by multiplying the NPM score of each product by its total weight sold. We then sum the result (50 x 50 + 25 x 100 + 80 x 10 = 2,500 + 2,500 + 800 = 5,800) and divide by the total volume sold (50 + 100 + 10 = 160 kilos), yielding ~36. The weighted figure is lower (less healthy) than the unweighted one, as it reflects the fact that the lower cNPM (less healthy) product has a much higher sales volume.
Using the same example above, imagine that product B used to be sold in packs of 100g, which means that 1,000 units were sold. Imagine the size of the pack has been reduced to 90g. If 1,000 units continue to be sold, the total volume sold becomes 90kg. Under this scenario, the sales weighted average is 37, which is higher (healthier) than the one calculated when product B had a larger pack size.
Step 3 - modelling different levels of reformulation and sales shifts in retailers' portfolios using an optimisation model to reach a given health target
We updated our modelling approach so that it identified the most efficient ways a retailer could meet a health target using two levers (reformulation and sales shifts), and estimated the impact of these changes on calories purchased per adult per day.
While our previous model applied average changes needed across a randomised selection of products, our updated linear optimisation model instead focused on identifying the most efficient potential actions that each individual retailer could take to achieve the target, which we believe better reflects how businesses are likely to behave.
In practice, different businesses could, and likely would, reach the same target through many different combinations of reformulation and sales shifts (Figure 3). To reflect the fact that this is just one of very many ways that retailers can feasibly reach the target, we also included examples of different combinations to demonstrate how individual retailers might meet the target.
The primary purpose of this optimisation model was to investigate the feasibility of the largest retailers achieving a range of SWA cNPM targets. It examined whether these goals can be met through realistic reformulation and sales shifts, and to what extent they generate meaningful public health benefits with minimal revenue impact. However, any implementation in the real world will require careful monitoring and enforcement of implementation by the government to assess both progress against targets and any unintended consequences of the policy. We discuss some of the limitations of the model later in this technical appendix.
Figure 3: Our model finds one possible 'efficient' combination of reformulation and sales shifts (from a huge range of possible combinations) for each retailer to reach a given health target. Size of circles are illustrative only.
The diagram shows three concentric circles, representing different combinations of reformulation and sales shifts:
* The outermost circle: All possible combinations of reformulation and sales shifts
* The middle circle: All combinations to reach a target
* The innermost circle: 'Efficient' combinations to reach target
An arrow points from the innermost circle to a text box: Example 'efficient' combination from our model included in this report.
We continued to only model scenarios which did not lead to significant changes in a retailer's revenue, reflecting the importance of minimising costs to business and consumers of the policy during the ongoing cost of living crisis. As before, we did not model potential actions beyond reformulation and sales shifts, such as changing the portion sizes of foods.
Figure 4: We continue to model two main mechanisms (reformulation and sales shift) for businesses to achieve the health target
The diagram illustrates two main mechanisms retailers use to achieve health targets from a Baseline SWA cNPM score to a Target SWA cNPM score for each business:
- Lever 1: Reformulation - Change product recipes to make them healthier
- Lever 2: Sales shifts - Sell more healthier products and less unhealthier products, such as by changing advertising, promotions, availability, and placement
These levers operate while ensuring revenue neutrality.
In our previous approach, we applied our reformulation and sales shift assumptions to individual retailer portfolios and then tested whether the sector as a whole could reach our recommended target of 69. In the updated model, we instead tested the feasibility of each of the top 11 retailers individually achieving the target level within a range of reformulation and sales shift limits.
We set constraints so that retailers can make changes up to these reformulation and sales shift limits, but not beyond them. In general, most of these limits were either as strict or stricter than those in Nesta's previous model that had been tested with industry and sector stakeholders.
Our modelling evaluated four different scenarios with varying thresholds for reformulation and sales shifts to assess the feasibility of each of the 11 retailers achieving the targets under these constraints. In the main report, we reported impact estimates from the main model, which allowed the maximum levels of reformulation and sales shift changes to meet a target of 69.
We tested three targets for each scenario and for each of the 11 largest retailers. For each business, we evaluated whether they met the target and what level of reformulation and sales shifts (within the model's defined constraints) were required to meet the target. If they did not meet the target, we identified the highest SWA cNPM score the business could achieve under the constraints.
Box 2: What are the 'maximum' possible reformulation and sales shifts allowed in our model to meet a given target?
We used the maximum levels of shifts for each scenario as the inputs to the model (in the table below), alongside a pre-specified target level (68, 69 or 70).
| Scenario |
Maximum % of eligible products reformulated |
Maximum cNPM gain per reformulated product |
Maximum % of products sales shifted |
Maximum % of sales shift per product |
| A |
10% |
4 |
10% |
±5% |
| B |
10% |
6 |
10% |
±5% |
| C |
10% |
8 |
15% |
±10% |
| D (main model results in report) |
20% |
10 |
15% |
±10% |
For instance, assume Retailer Z has a portfolio of 1000 products, a baseline SWA cNPM of 67, the target is 69 and we are looking at the main scenario reported (Scenario D). Out of 1000 products, only 800 can be reformulated. The remaining 200 products are ingredients or produce and we assumed they cannot be reformulated. Our model would be allowed to choose up to 160 (20% of 800 eligible) products to remove up to 10 cNPM points from. It could also choose up to 150 products (15% of 1000) to change their sales (by up to 10% in either direction). Products can be chosen for reformulation and/or sales shifts.
Across scenarios, we found that many retailers could reach the target using smaller shifts than the maximum allowed reformulation and sales shifts. Only the least healthy business, Retailer K, needs to make much higher shifts to reach a target of 69. This is why we report results from Scenario D, which allows Retailer K to meet the target. However, 10 of the 11 retailers can get to 69 in much smaller shifts than those set out as maximum constraints in Scenario D.
For example, Retailer A in Scenario A could achieve a target of 69 by reformulating 7.5% of all products by 4 cNPM points, and sales shifting 2% of all products (out of 10% allowed) by ±5%. On the other hand, Retailer K needed a higher level of reformulation (10 cNPM points) on more products (~17% of all products) and more sales shifting (11% of all products by ±10%).
Using the optimisation model outputs, we then estimated what impact the modelled portfolio changes for each retailer, under each scenario and target level, would have on calories bought by consumers. Due to the nature of the NPM, retailers might improve the cNPM score of products by changing the composition of any associated nutrient, such as calories, saturated fats, salt, or sugar. However, we focused on evaluating the potential impact of the changes on calories, as this is the key mechanism to impact obesity. Our model did not capture positive health benefits from changes in other nutrients, such as lowered cardiovascular disease or stroke incidence from reduced salt intake.
There is limited real-world evidence on how retailers might choose nutrients for reformulation, or to predict how changes in the cNPM score relate to changes in nutrient density, including calories. Indeed, it is difficult to identify how individual nutrients contribute to an improvement in the cNPM score during reformulation, given how interrelated these nutrients are (for example, a reduction in sugar density will also lead to a reduction in calorie density of a product). In our previous report, we demonstrated that there is a positive correlation between the cNPM score and the density of nutrients like calories, sugar, saturated fats, and salt/sodium. Of these nutrients, the relationship between cNPM and calories was the strongest, suggesting that reducing calorie density is the most effective way to directly improve cNPM scores.
In our optimisation model, we simulated product reformulation by improving the cNPM score of eligible foods. To calculate how increases in cNPM translate to changes in product calories, we used a mixed-effects hierarchical regression model using statistical weights to reflect the relative contribution of products to their categories (ie, products selling in higher volumes would have a larger impact on the model). The regression model analysed the strength of the relationship (the 'correlation coefficient') between calorie density and cNPM at varying levels (category and sub-category). In the Worldpanel dataset, each product is assigned to a sub-category and a higher-level category: for example, a specific branded mustard jar is assigned to the sub-category "mustard” and the higher-level category of "condiments.” The regression model calculated the correlation coefficient for each sub-category, using the higher-level category when the relationship at the sub-category level is unclear.
The category level coefficient was then used to predict the change in energy density at the product level due to changes in the cNPM score. For example, a 2 cNPM point gain resulted in a reduction of 40 calories per 100g for salad dressings and 4 calories per 100g for baked beans. We then calculated the new calorie content of products by multiplying the energy density by the product's volume.
We were able to produce statistically significant coefficients for over 70% of products, representing ~68% of product sales, using this model. For the remaining products with unclear correlations, we conservatively assumed no relationship, ie, any reformulation applied to a specific product did not lead to changes in its calorie content.
Summary of key assumptions underlying the optimisation model
We made a series of assumptions on how businesses might change their portfolios in order to achieve a given target. These are based on our extensive engagement with retailers, including running trials, reviewing evidence and desk research, and making pragmatic assumptions where research is limited. Following is a non-exhaustive description of some of the critical assumptions we made in our modelling:
- Product reformulation does not negatively affect consumer demand or purchasing behaviour, such as due to a change in consumer taste or experience when consuming a food. When a reformulated product is introduced, it fully replaces the original version, with consumer demand shifting entirely to the new formulation. This draws on real-world evidence, including the UK's successful voluntary salt reduction programme, where gradual reductions in salt content were implemented over several years and led to meaningful nutritional improvements without disrupting consumer purchasing behaviour. Consumers adapted to these changes without significantly altering their purchasing patterns. In addition, systematic reviews and meta-analyses of reformulation initiatives show that reformulated products are well accepted and continue to be purchased at similar levels.
- Costs for implementing the business-level levers are not passed on to consumers and do not affect product demand, thus leading to no price changes for the products. Reformulation efforts following government regulation in Canada and Chile have shown no change in prices to consumers. We also assumed that the trend of demand for a product doesn't change.
Summary of key results from the linear optimisation model
As detailed above, we modelled four scenarios in which a retailer could achieve a range of health targets. Depending on the baseline healthiness of their food sales, some retailers can achieve a target of 69 in much smaller changes than other retailers (Table 2 on the next page).
Table 2: The modelled minimum changes per retailer to meet the health target of cNPM 69 where the minimum is the first scenario from A, B, C, D where the retailer meets the target
| Retailer |
Baseline healthiness of portfolio (SWA cNPM) in 2024 |
Number of scenarios in which retailer meets target |
Minimum reformulation shifts: Share of all products reformulated |
Minimum reformulation shifts: Mean cNPM gain per reformulated product |
Minimum sales shifts: Share of all products sales shifted |
Minimum sales shifts: Change in sales per product |
| A |
68 |
4 |
7.5% |
4 |
2.5% |
±5% |
| B |
67 |
3 |
6% |
6 |
1% |
±5% |
| C |
67 |
3 |
8% |
6 |
4% |
±5% |
| D |
66 |
3 |
5.5% |
6 |
1.5% |
±5% |
| E |
66 |
3 |
8.5% |
6 |
9% |
±5% |
| F |
66 |
3 |
8% |
6 |
7.5% |
±5% |
| G |
66 |
2 |
4% |
8 |
2% |
±10% |
| H |
66 |
2 |
6% |
8 |
3% |
±10% |
| I |
66 |
2 |
5.5% |
8 |
2% |
±10% |
| J |
64 |
2 |
8.5% |
8 |
11.5% |
±10% |
| K |
62 |
1 |
16.5% |
10 |
11% |
±10% |
We also modelled the average shifts required to meet a given target across the full sector, ie, across all 11 large retailers (Table 3).
Table 3: The average shifts required for the full sector (across all 11 retailers) towards a given sales weighted average cNPM target (69, 69, 70) for the four model scenarios
| Metric |
Model limit |
Target: 68 |
Target: 69 (recommended) |
Target: 70 |
| Scenario A |
|
|
|
|
| Number of retailers meeting target |
Of 11 retailers |
7 |
1 |
0 |
| % sector-wide progress towards target |
N/A |
91% |
72% |
50% |
| Share of all products reformulated |
10% |
6% |
8% |
8% |
| Mean cNPM gain per reformulated product |
4 |
4 |
4 |
4 |
| Share of all products sales shifted |
10% |
4% |
9.5% |
10% |
| % change in sales per shifted product |
±5% |
±5% |
±5% |
±5% |
| % change in revenue |
±0.1% |
+0.03% |
+0.01% |
-0.07% |
| Metric |
Model limit |
Target: 68 |
Target: 69 (recommended) |
Target: 70 |
| Scenario B |
|
|
|
|
| Number of retailers meeting target |
Of 11 retailers |
9 |
6 |
0 |
| % sector-wide progress towards target³ |
N/A |
95% |
91% |
71% |
| Share of all products reformulated |
10% |
3.5% |
7.5% |
8% |
| Mean cNPM gain per reformulated product |
6 |
6 |
6 |
6 |
| Share of all products sales shifted |
10% |
1.5% |
6.5% |
10% |
| % change in sales per shifted product |
±5% |
±5% |
±5% |
±5% |
| % change in revenue |
±0.1% |
+0.01% |
+0.05% |
-0.01% |
| Scenario C |
|
|
|
|
| Number of retailers meeting target |
Of 11 retailers |
10 |
10 |
8 |
| % sector-wide progress towards target³ |
N/A |
99% |
98% |
96% |
| Share of all products reformulated |
10% |
2% |
4% |
7.5% |
| Mean cNPM gain per reformulated product |
8 |
8 |
8 |
8 |
| Share of all products sales shifted |
15% |
1.5% |
3% |
7% |
| % change in sales per shifted product |
±10% |
±10% |
±10% |
±10% |
| % change in revenue |
±0.1% |
+0.04% |
+0.03% |
+0.03% |
| Scenario D (main reported scenario) |
|
|
|
|
| Number of retailers meeting target |
Of 11 retailers |
11 |
11 |
10 |
| % sector-wide progress towards target³ |
N/A |
100% |
100% |
99% |
| Share of all products reformulated |
20% |
1.5% |
3.5% |
6% |
| Mean cNPM gain per reformulated product |
10 |
10 |
10 |
10 |
| Share of all products sales shifted |
15% |
0.5% |
1.5% |
3% |
| % change in sales per shifted product |
±10% |
±10% |
±10% |
±10% |
| % change in revenue |
±0.1% |
+0.03% |
+0.04% |
+0.05% |
*To calculate total shifts, we added the share of all products reformulated and share of all products sales shifted. For example, in the highlighted scenario, 5% of all products are intervened on (3.5% of products reformulated and 1.5% of products sales shifted). In reality, this share is likely to be lower as the same product can be both reformulated and sales shifted.
Highlighted cells represent results for our main scenario (D) and recommended target level (69).
Step 4 – approach to model the impact of reduced calorie intake on obesity prevalence and associated benefits
We followed 5 steps to estimate the reductions in adult and childhood obesity prevalence due to changes in calorie intake. This methodology is consistent with Nesta's approach to model impact on calories and obesity in our Blueprint for halving obesity and other policy work.
- Estimate changes in the adult population's mean daily calorie consumption using the model outputs
- Estimate changes in calorie consumption for adults living with excess weight
- Estimate changes in calorie consumption for children living with excess weight
- Model the resulting changes in the prevalence of adult and childhood obesity
- Estimate the associated benefits to society from reduced adult obesity prevalence
1: Estimate changes in adult calorie consumption using the optimisation model's outputs
One of the outputs from the optimisation model was the reduction in overall calories purchased per adult per day due to the improvement in the healthiness of food sold by the top 11 retailers. This was calculated for all adults in GB. If a specific retailer did not meet a given target, we included calorie reductions resulting from portfolio changes that got the retailer as close to the target as possible.
We assumed that changes in calories purchased are equal to changes in calories consumed (ie, zero food waste). While some evidence suggests around 25% of food by weight is wasted, we assumed zero food waste in line with approaches used commonly, such as in the 2021 National Food Strategy.
2: Estimate changes in calorie consumption for adults living with excess weight
Evidence suggests that the impact of changes in the food environment is unlikely to be evenly distributed across the population, with groups with a higher baseline calorie intake likely to see higher reductions in their calorie intake from a given policy intervention. We therefore only modelled changes in body weight from reduced calorie intake for populations living with excess weight (Body Mass Index higher than 25). We did not model changes in body weight for healthy or underweight populations. Instead, we assumed these populations would fully compensate for any reductions in calorie intake by eating more calories from other sources, as they are more likely to experience physiological hunger cues triggered by a calorie deficit.
We calculated baseline calorie needs for the full adult population and the adult excess weight population using 2019 health survey data for England (Health Survey for England, HSE) and Scotland (Scottish Health Survey, SheS) and validated formulas relating body weight, height, sex and age to calorie intake required for body weight maintenance. We used the ratio of these baseline calorie needs (1.05) to scale the population calorie reduction to that of the excess weight group. For example, if the model led to a reduction of 100 calories/day for the full population, we would scale this to 105 calories/day for the population living with excess weight.
We then accounted for compensation effects for the excess weight population. Evidence suggests that people might substitute lowered calorie intake by eating additional calories from alternate sources, leading to a smaller net impact on calories. Therefore, we applied a 23% compensation rate using evidence from Robinson et al., 2022. For example, if the policy was estimated to reduce daily energy intake by 105 calories for the excess weight population, we reduced this by 24 calories so that the net reduction in daily energy intake was actually 81 calories. This was in line with our approach to estimate the impact on obesity in Nesta's Blueprint for halving obesity, which assessed the impact of over 30 policies to reduce obesity.
3: Estimate changes in calorie consumption for children living with excess weight
For children, we scaled down the reductions in the adult excess weight population's calorie intake based on the gender and age of the child, using the recommended dietary intake of children. The effect of the policy on children is therefore assumed to be smaller than the adult reduction by a factor that is proportional to the age and sex of each child. Similarly to the adult methodology, we applied 100% compensation to healthy and underweight groups, and 23% compensation to the excess weight population.
4: Model the resulting changes in adult and childhood obesity
We then estimated the change in overall adult and child obesity rates due to reduced calorie intake. We used two different adult and child models for this, and calculated reductions in obesity after applying compensation (our main results) and without applying compensation.
For adults, we used a Nesta model, based on the commonly used Hall et al model. This model simulates how individuals' body weight changes due to a sustained reduction in calories. We assumed that weight loss would occur over a three-year period to account for the lag between reduced calorie intake and body weight loss. Projected obesity impact estimates, therefore, are three years after a given target is met by retailers.
For children, we used Henry equations to calculate individuals' body weight following a reduction in children's calorie intake. Henry equations are a mathematical tool to calculate the calories needed for a child to maintain their healthy weight, given their age, gender, height, baseline weight and levels of physical activity. In our modelling, we calculated what the resulting body weight (and BMI) for a child over a five-year period would be if the daily calorie intake was reduced, whilst holding all other factors constant. More details on our methodology for child obesity modelling can be found here.
We ran the above adult and child obesity models for England and Scotland separately using data on BMI, height, and weight from the HSE 2019 and SheS 2019. In order to estimate obesity reduction for GB, we took the population-weighted average of each nation's specific obesity reduction estimates. We assumed that the reduction in obesity prevalence for Wales was the same as in England, as the National Survey for Wales data was not available to us at the time of modelling.
5: Estimate the associated benefits to society from reduced obesity prevalence
Finally, we calculated the estimated number of adults and children who would no longer live with obesity as a result of the policy. For this step, we took the most up-to-date 2024 estimates of the prevalence of adult and child obesity from the published official statistics from England, Wales and Scotland. We multiplied these prevalence percentages with the estimated total adult and childhood population using 2024 mid-year population estimates to estimate the number of adults and children living with obesity. To this, we applied our estimated percentage reductions in adult and child obesity prevalence. We then summed these figures to obtain the estimated number of people in GB who would no longer live with obesity following implementation of the policy.
Model outcomes – shifts required to achieve a given target and the resulting impact on public health
We tested three increasingly ambitious target levels (68, 69, 70) from an average sector baseline of 66 SWA cNPM. We also ran the optimisation model across four combinations of model constraints relating to reformulation and sales shifts as outlined above (scenarios A-D). Results from these different optimisation model scenarios and subsequent impact on calories and obesity reduction estimates for the policy are below.
Table 4: Potential obesity impact of retailer targets across different target levels and modelling scenarios
| Metric |
Target: 68 |
Target: 69 (recommended) |
Target: 70 |
| Scenario A: Model limits 10% eligible products reformulate by maximum 4 cNPM per product; 10% products shift sales by maximum ±5% per product |
|
|
|
| Number of retailers meeting target |
7 |
1 |
0 |
| % sector-wide progress towards target |
91% |
72% |
50% |
| Reduction in calories consumed per adult per day |
52 kcal |
61 kcal |
63 kcal |
| Reduction in adult obesity rates over 3 years |
GB: 13% England: 13% Scotland: 13% |
GB: 15% England: 15% Scotland: 15% |
GB: 16% England: 16% Scotland: 16% |
| Decrease in number of adults living with obesity in GB (millions) |
2.0 million |
2.4 million |
2.5 million |
| Associated social value of reduced adult obesity in GB (£ billion) |
£13.1 billion |
£15.5 billion |
£16.2 billion |
| Scenario B: Model limits 10% eligible products reformulate by maximum 6 cNPM per product; 10% products shift sales by maximum ±5% per product |
|
|
|
| Number of retailers meeting target |
9 |
6 |
0 |
| % sector-wide progress towards target |
95% |
91% |
71% |
| Reduction in calories consumed per adult per day |
54 kcal |
81 kcal |
86 kcal |
| Reduction in adult obesity rates over 3 years |
GB: 13% England: 13% Scotland: 14% |
GB: 19% England: 19% Scotland: 18% |
GB: 20% England: 20% Scotland: 19% |
| Decrease in number of adults living with obesity in GB (millions) |
2.1 million |
3.1 million |
3.2 million |
| Associated social value of reduced adult obesity in GB (£ billion) |
£13.5 billion |
£19.8 billion |
£20.7 billion |
| Scenario C: Model limits 10% eligible products reformulate by maximum 8 cNPM per product; 15% products shift sales by maximum ±10% per product |
|
|
|
| Number of retailers meeting target |
10 |
10 |
8 |
| % sector-wide progress towards target |
99% |
98% |
96% |
| Reduction in calories consumed per adult per day |
46 kcal |
79 kcal |
112 kcal |
| Reduction in adult obesity rates over 3 years |
GB: 11% England: 11% Scotland: 12% |
GB: 19% England: 19% Scotland: 18% |
GB: 26% England: 26% Scotland: 24% |
| Decrease in number of adults living with obesity in GB (millions) |
1.8 million |
3.0 million |
4.2 million |
| Associated social value of reduced adult obesity in GB (£ billion) |
£11.7 billion |
£19.5 billion |
£27.1 billion |
| Scenario D: Model limits 20% eligible products reformulate by maximum 10 cNPM per product; 15% products shift sales by maximum ±10% per product |
|
|
|
| Number of retailers meeting target |
11 |
11 |
10 |
| % sector-wide progress towards target |
100% |
100% |
99% |
| Reduction in calories consumed per adult per day |
45 kcal |
79 kcal |
114 kcal |
| Reduction in adult obesity rates over 3 years |
GB: 11% England: 11% Scotland: 12% |
GB: 19% England: 19% Scotland: 18% |
GB: 26% England: 27% Scotland: 25% |
| Decrease in number of adults living with obesity in GB (millions) |
1.8 million |
3.0 million |
4.3 million |
| Associated social value of reduced adult obesity in GB (£ billion) |
£11.5 billion |
£19.5 billion |
£27.5 billion |
Highlighted cells represent results for our main scenario (D) and recommended target level (69)
Complexities and limitations of the optimisation model
Our modelling aimed to examine a few potential routes through which retailers could achieve a given health target, through a mix of reformulation and sales shifts. In practice, businesses could reach the same target through many different combinations of reformulation and sales shifts not covered in our modelling scenarios. Indeed, our model provided a view into the likely scale of change required to meet a target, but it was not a forecasting exercise. It was not intended to be a predictive model of the exact manner in which each retailer would choose to achieve a given target.
Making such portfolio changes in the real world can have complexities that our model did not fully capture. For example, we did not account for growth in retailers' sales or volume of products or costs to retailers of making portfolio changes. We also did not incorporate changes in customer food preferences or customer pushback to changing baskets, which might mean we underestimated the scale of portfolio changes needed from retailers. However, we developed illustrative consumer baskets, described below, which showed that the changes in purchasing are likely to go largely unnoticed by consumers, while still delivering substantial public health benefits.
Additionally, the potential to reformulate or shift sales is likely to be specific to a given product. We put constraints on the overall maximum of reformulation or sales shifts at a portfolio level and also excluded categories that cannot be reformulated, such as produce (such as meat, fish, fruit, vegetables, and eggs) and ingredients (such as oils and sugar). However, applying the constraints at the overall portfolio level meant the model might be less accurate when looking at individual products. For example, a product might be chosen for intervention when, in reality, it is unlikely that the product's recipe would be changed or sales would shift by the amount the model suggested, and vice versa. There is likely some under- and over-estimation, but we believe this affects a small share of products and our assumptions instead reflect a reasonable approximation of average market shift.
Expanding the target to all businesses regulated by the Grocery Code Adjudicator (GCA) results in minimal additional impact
We also analysed the potential impact of expanding targets from the 11 largest retailers to the top 14 retailers regulated under the GCA. The GCA regulates 14 businesses, of which we had data for 13 (2 additional to the 11 already considered in our main analysis). The baseline SWA cNPM of these 2 additional businesses was considerably lower at 50 and 53, compared to a sector average baseline of 66 SWA cNPM or even the unhealthiest large retailer. Our findings suggested that these businesses cannot reach any of the target levels even with the highest reformulation and sales shifts we investigated (Table 5).
The additional 2 businesses in our data had small market shares of less than 1.5% of the total retail grocery market share each, versus the top 11 retailers that each have at least 1.5% market share. Because of this, including them in our analysis makes a negligible change to the modelled impact of targets on national adult obesity prevalence (less than 1%).
Table 5: Impact of retailer targets when expanded to 13 businesses regulated by the GCA for scenario D
| Metric |
Target: 68 |
Target: 69 (recommended) |
Target: 70 |
| Scenario D: Model limits 20% eligible products reformulate by maximum 10 cNPM per product; 15% products shift sales by maximum ±10% per product |
|
|
|
| Number of retailers meeting target (of 13) |
11 |
11 |
10 |
| Reduction in calories consumed per adult per day |
50 kcal |
84 kcal |
119 kcal |
| Reduction in adult obesity rates over 3 years |
GB: 12% England: 12% Scotland: 13% |
GB: 20% England: 20% Scotland: 19% |
GB: 28% England: 28% Scotland: 25% |
| Decrease in number of adults living with obesity in GB (millions) |
1.9 million |
3.2 million |
4.4 million |
| Associated total social value of reduced adult obesity in GB (£ billion) |
£12.5 billion |
£20.5 billion |
£28.7 billion |
Step 5 – creating illustrative consumer baskets before and after implementing a retailer targets policy
We developed illustrative shopping baskets to demonstrate how consumers might experience changes in their food shop after retailers implement targets using a different mix of levers (across reformulation, portion size, and product swaps) as retailers have the flexibility to use a variety of strategies to meet the target. We developed baskets for the average GB consumer and for a consumer on a lower income to illustrate how targets might be experienced by different population groups.
1: Illustrative current and future shopping baskets for an average GB consumer
For the current 2024 customer basket, we aimed to construct a basket representing the highest-selling categories to eat at home, bought from the 11 largest retailers. We used Worldpanel data to calculate the proportion of calories purchased from different food categories across the 11 retailers in scope. In our analysis, we aggregated the 164 food categories in Worldpanel data into 22 higher-level categories comprising similar types of foods. For example, we combined different types of protein (chicken, beef, pork, etc) or different variations of biscuits (everyday biscuits, healthier biscuits, children's biscuits). These 22 categories represent the categories that contribute most to calories purchased and the largest sales volume of retailers.
We ensured that the cost of the basket fell within £1 of the actual average weekly spend of an individual's food shop. To calculate this spend, we used the Family Food FYE 2024 figure of £32.30 per person per week spent on household food and non-alcoholic drinks. We adjusted this to be food-only by removing spend on milk (£1.52), soft drinks (£1.41) and water (19p), to yield a final spend of £29.18 per person per week on food.
We then selected illustrative, popular products under each high-level category to include in the GB basket from the website of a large retailer. While doing this, we ensured that each representative product's calorie content matched the estimated weekly calories purchased for that given category, that the cost of the full basket was within £1 of the total budget (£29.18), and the basket's SWA cNPM was 66 (same as the sector average in 2024). To calculate the average cNPM score for a basket, we took the volume-weighted average cNPM from all 22 products in that basket.
Finally, we designed two alternative future baskets to illustrate the types of changes that customers might experience if their food basket improves by 3 SWA cNPM (from the baseline of 66 to a target of 69). We selected 7 of the 22 basket products to shift via reformulation (increasing cNPM score), product size (reducing volume in kilos), and sales swaps (finding an alternative, similar product with a higher cNPM). Our primary aim was to ensure the future baskets hit an SWA cNPM of 69, rather than focusing on changes in specific nutrients.
2: Illustrative current and future shopping baskets for a consumer on a lower income
We followed a similar process as the GB baskets to generate the current and future shopping baskets for a consumer on a lower income, using a subset of Worldpanel data. We defined consumers on lower incomes in the Worldpanel data using the Office of National Statistics social grade system, which is a socio-economic classification based on people's social and financial situation.
We used the Family Spending Workbook 2024 to estimate the difference between the weekly benchmark spend for GB households (£70.5) and GB lower-income households (£50.7). We applied the 28% difference between these household spends to the per-person weekly food spend estimate for the general population from the Family Food Survey 2024 (£29.18) to calculate the per-person weekly spend on food for populations on lower incomes to be £21 (ie, baseline less 28% of £29.18).
We then selected representative products, as we did for the GB basket, to reflect purchasing patterns by category for lower-income consumers using a subset of the Worldpanel data. This basket costs £21 per person per week, with an SWA cNPM of 65, reflecting that consumers on lower incomes have a slightly less healthy shopping basket, as we saw in our analysis of the Worldpanel data. We selected 7 products to change using reformulation, sales shifts, and portion sizes (explained above) that achieve a future SWA cNPM of 68, which is the same absolute improvement in 3 cNPM points as in the general population basket.
Appendix – additional supporting data tables
Appendix table 1: The minimum changes per retailer to meet a health target of cNPM 68 across all four scenarios tested where minimum is the scenario with the smallest cNPM gain per reformulated product
| Retailer |
Baseline healthiness of portfolio (SWA cNPM) in 2024 |
Number of scenarios in which retailer meets target |
Share of all products reformulated* |
Mean cNPM gain per reformulated product |
Share of all products sales shifted* |
Change in sale per product |
| A |
68 |
4 |
0.5% |
4 |
0.2% |
±5% |
| B |
67 |
4 |
2% |
4 |
0.5% |
±5% |
| C |
67 |
4 |
4.5% |
4 |
2% |
±5% |
| D |
66 |
4 |
3.5% |
4 |
1% |
±5% |
| E |
66 |
4 |
6.5% |
4 |
2.5% |
±5% |
| F |
66 |
4 |
6.5% |
4 |
3% |
±5% |
| G |
66 |
4 |
8% |
4 |
3% |
±5% |
| H |
66 |
3 |
6.5% |
6 |
1.5% |
±5% |
| I |
66 |
3 |
6% |
6 |
0.5% |
±5% |
| J |
64 |
2 |
5% |
8 |
2.5% |
±10% |
| K |
62 |
1 |
11.5% |
10 |
3.5% |
±10% |
*Where share of all products reformulated and all products sales shifted are rounded to nearest 0.5%
Appendix table 2: The minimum changes per retailer to meet a health target of cNPM 70 across all four scenarios tested where minimum is the scenario with the smallest cNPM gain per reformulated product
| Retailer |
Baseline healthiness of portfolio (SWA cNPM) in 2024 |
Number of scenarios in which retailer meets target |
Share of all products reformulated* |
Mean cNPM gain per reformulated product |
Share of all products sales shifted* |
Change in sale per product |
| A |
68 |
2 |
5% |
8 |
2% |
±10% |
| B |
67 |
2 |
6.5% |
8 |
2.5% |
±10% |
| C |
67 |
2 |
8% |
8 |
4% |
±10% |
| D |
66 |
2 |
5% |
8 |
2.5% |
±10% |
| E |
66 |
2 |
8.5% |
8 |
4% |
±10% |
| F |
66 |
2 |
7.5% |
8 |
4% |
±10% |
| G |
66 |
2 |
8% |
8 |
6% |
±10% |
| H |
66 |
1 |
8.5% |
10 |
3% |
±10% |
| I |
66 |
2 |
8% |
8 |
13% |
±10% |
| J |
64 |
1 |
11.5% |
10 |
5% |
±10% |
| K |
62 |
0 |
N/A |
– does not meet target |
|
|
*Where share of all products reformulated and all products sales shifted are rounded to nearest 0.5%
Appendix table 3: Each retailer can achieve a target of 69 cNPM using a different combination of reformulation and sales shifts
| Retailer |
Number of scenarios in which retailer meets target |
Scenario |
Share of all products reformulated¹²* |
Mean cNPM gain per reformulated product |
Share of all products sales shifted* |
Change in sale per product |
| A |
4 |
A |
7.5% |
4 |
2.5% |
±5% |
|
|
B |
4% |
6 |
0.5% |
±5% |
|
|
C |
1.5% |
8 |
0.5% |
±10% |
|
|
D |
1% |
10 |
0.5% |
±10% |
| B |
3 |
B |
6% |
6 |
1% |
±5% |
|
|
C |
2.5% |
8 |
1.0% |
±10% |
|
|
D |
2% |
10 |
0.5% |
±10% |
| C |
3 |
B |
8% |
6 |
4.0% |
±5% |
|
|
C |
3.5% |
8 |
1.5% |
±10% |
|
|
D |
2.5% |
10 |
1% |
±10% |
| D |
3 |
B |
5.5% |
6 |
1.5% |
±5% |
|
|
C |
2% |
8 |
1% |
±10% |
|
|
D |
1.5% |
10 |
0.5% |
±10% |
| E |
3 |
B |
8.5% |
6 |
9% |
±5% |
|
|
C |
3.5% |
8 |
1.5% |
±10% |
|
|
D |
2.5% |
10 |
1% |
±10% |
| F |
3 |
B |
8% |
6 |
7.5% |
±5% |
|
|
C |
3% |
8 |
1.5% |
±10% |
|
|
D |
2% |
10 |
1% |
±10% |
| G |
2 |
C |
4% |
8 |
2% |
±10% |
|
|
D |
3% |
10 |
1% |
±10% |
| H |
2 |
C |
6% |
8 |
3% |
±10% |
|
|
D |
4% |
10 |
1.5% |
±10% |
| I |
2 |
C |
5.5% |
8 |
2% |
±10% |
|
|
D |
4% |
10 |
1% |
±10% |
| J |
2 |
C |
8.5% |
8 |
11.5% |
±10% |
|
|
D |
6.5% |
10 |
2.5% |
±10% |
| K |
1 |
D |
16.5% |
10 |
11% |
±10% |
*Where share of all products reformulated and all products sales shifted are rounded to nearest 0.5%
Technical appendix endnotes
- Each individual retailer has a different proportion of products eligible for reformulation based on their current product mix.
- Sector averages are calculated by taking a weighted average of the business specific optimised results, where the sales volumes of each retailer is used to ensure they contribute to the average proportionally to their market share. We include retailers which do not meet the specific target level, as they still make significant progress towards the target.
- Calculated as the difference between baseline and achieved sector-level SWA cNPM score, divided by the difference between baseline and target SWA cNPM score.
- Subgroups were defined according to the NHS BMI thresholds for underweight, healthy weight, overweight, obese and severely obese.
- Although more recent health survey data is available (from 2021 until 2023), those collections used a mixed method of body weight and height collection, incorporating both self-reported and interviewer-collected measurements. This change resulted in a significantly lower rate of valid BMI values compared to the 2019 survey. In 2024, full interviewer-collected measurements resumed, however full data for 2024 had not been published for use at the time of our analysis.
- We used the recommended dietary intake for male and female children for ages from 1 to 18 years from Table 8 in the Scientific Advisory Committee on Nutrition's Dietary Reference Values
- As mentioned, we assumed the same percentage reductions in obesity for Wales as those in England
- Calorie figures are the population mean without compensation. The impact on calories of all businesses is included (not just those that meet the target)
- Modelling includes 23% compensation applied on the calorie intake reduction for the excess weight population
- Alternate surveys such as The Living Cost & Food Survey and Family Spend Survey do not include the required breakdown of per person spend on food. The Family Food FYE 2024 dataset was the most suitable as it provides detailed individual spending figures and is officially recognised by the government.
- Although household income is available in the Worldpanel data, we chose to use social class as a proxy for lower income instead (see the full rationale in our previous publication). Here, we use data for Social Class E, which includes unemployed and lowest grade occupations, as well as workers without a regular income or those in receipt of income benefits. Full descriptions of the social classes can be found here.
- Each individual retailer has a different proportion of products eligible for reformulation based on their current product mix.
58 Victoria Embankment
London EC4Y 0DS
+44 (0)20 7438 2500
[email protected]
X @nesta_uk
@nestauk.bsky.social
f nesta.uk
in Nesta
nesta_uk
www.nesta.org.uk
ISBN: 978-1-916699-52-6
Nesta is a registered charity in England and Wales with company number 7706036 and charity number 1144091. Registered as a charity in Scotland number SCO42833.
Registered office: 58 Victoria Embankment, London EC4Y 0DS.