FutureFit is a major training and research project led by Nesta and supported by Google.org.
FutureFit is focused on creating an effective adult learning system to help tackle inequality and social exclusion. In partnership with some of Europe's largest unions, leading researchers, employers and adult learning experts, FutureFit is reskilling workers at risk of job displacement and conducting a large evaluation about what works, so that solutions can be scaled.
Nesta is an innovation foundation. For us, innovation means turning bold ideas into reality and changing lives for the better. We use our expertise, skills and funding in areas where there are big challenges facing society.
To find out more, visit: www.nesta.org.uk/project/futurefit
If you'd like this publication in an alternative format such as Braille or large print, please contact us at [email protected]
Authors
Chrystalla Kapetaniou
Charles McIvor
June 2020
Acknowledgements
Olivia Chapman, Beatrice Bekar,
Georgie Whiteley, Juan Casasbuenas,
Genna Barnett, Kate Sutton,
Laurie Smith, Madeleine Gabriel
For more information about this report, please contact:
Chrystalla Kapetaniou
[email protected]
Executive summary
Greenhouse gas emissions have increased substantially since the Industrial Revolution, causing average global surface temperatures to rise to about 1.0°C above pre-industrial levels during the last hundred years (IPCC, 2018). The effects of the climate crisis, including rising sea levels, population displacement and extreme weather, are already being experienced around the world. Underlining its commitment to tackling the climate crisis, the UK has set a target of net-zero greenhouse gas emissions by 2050. The path towards achieving net-zero emissions requires a significant reduction in emissions over the next few decades across all the sectors that produce them.
A transformation towards a greener economy in the UK will lead to significant changes across sectors and occupations, which could increase inequalities between individuals, industries and regions. The shift to 'green growth' will be a significant challenge for regions with a major concentration of 'brown sector' industries, and for individuals currently working in these industries, while regions with a major concentration of 'green sector' industries will flourish. Although jobs may be lost or transformed in the brown sector, the 'greening' of the labour market will create new jobs in the green sector that could produce employment gains and prevent net job losses (ILO, 2015).
However, it is not clear which industries comprise the green sector or the brown sector; these categories can include different industries in different countries at different times (ILO, 2011). Recognising that the opportunities and risks vary by industry, a new taxonomy - the 'Eco-Transformation of Industries Matrix' - has been developed to quantify and gain insights into the level of risk for each industry and the related implications for employment and reskilling in the UK.
This report provides a thorough examination of the scale of the challenge in the UK regarding employment and adult learning, and offers guidance about the actions needed to achieve an efficient, inclusive and fair transition to a net-zero economy. Based on data from various sources and data analytics, the report will:
- Classify industries in the UK based on the 'Eco-Transformation of Industries Matrix'.
- Assess the impact of the green transformation on the labour market.
- Examine the role of adult learning in supporting a successful green transformation.
- Provide policy recommendations for a smooth transition to a green economy.
Our main findings include:
1. We suggest a new taxonomy of sectoral patterns for the UK: the 'Eco-Transformation of Industries Matrix'.
This report details a method for classifying industries using a taxonomy for the purpose of relevant analysis, rather than relying on the conventional method of pre-selecting specific industries as either green or brown. The 'Eco-Transformation of Industries Matrix', inspired by the International Labour Organization's (ILO's) four categories of green employment effects, analyses industries in the UK based on the current level of their environmental friendliness. All industries were classified into one of four different categories – leaders, neutrals, followers and laggards – according to two variables: the level of carbon emissions and environmental activities.
Leaders
Industries in this category are the most eco-friendly, as they do not produce high levels of carbon emissions and are intensively involved in activities that directly protect the environment across the economy.
Neutrals
Industries in this category produce low levels of carbon emissions but are not involved in activities that directly protect the environment. They are part of the green sector but are not influenced by new climate-crisis policies.
Followers
Although they are producing high levels of emissions, followers are also intensively involved in activities that are intended to protect the environment and could thus create green jobs.
Laggards
Industries in this category produce high levels of carbon emissions and are not involved in activities aimed at protecting the environment.
2. The transition to a net-zero economy is likely to have a significant impact on employment and could result in sectoral disparities.
Followers and laggards, or the brown sector, are responsible for about 93 per cent of UK emissions and accounted for 45 per cent of total employment in 2018. Industrial sectors and transportation and storage account for about 90 per cent of total emissions. Leaders and neutrals, or the green sector, are responsible for 7 per cent of UK emissions and account for about 55 per cent of total employment. The net impact of the green transition on employment will depend on the number of new jobs it will create in the environmental goods and services sector (EGSS). However, employment in this sector is rather small, accounting for just 1.3 per cent of total employment in the UK.
3. The cross-sectoral and regional dimensions of the transition are critical.
The shift to green growth will be a significant challenge for regions with a major concentration of laggards and followers, while regions with a concentration of leaders and neutrals will flourish. Regions in industrial transition – including Northern Ireland, the East Midlands and West Midlands, where about 50 per cent of jobs are with laggards and followers – will require the most support and strategic development to reduce their dependence on fossil fuels and invest in environmental activities.
4. Reskilling and upskilling need to include every individual.
About half of all employees in the UK are likely to experience an elevated risk of displacement or job transformation. Male, younger and lower-educated workers are over-represented in these sectors. These workers will need to learn new skills to move from being precarious to being prepared. However, participation in adult learning is not distributed equally among individuals. The participation rate of leader employees in adult learning is about 21 per cent, compared to only 11 per cent for laggard employees. To increase participation in adult learning, learning must fit individual needs, characteristics, preferences and habits. For the UK to reap the benefits of a green economy, regional and national institutions must provide the right conditions for investment in an inclusive and fair adult learning system.
5. A deliberate set of policy actions needed for the UK to unlock the potential of the green economy.
There is no silver bullet solution for helping the people most affected by the transition to the net-zero economy. It will require using data more consistently so that workers and students understand what career opportunities to pursue, particularly when it comes to jobs that will grow or disappear under a net-zero economy. Learning from Nesta's work, the UK should support upskilling and explore how a missions-oriented approach could help tackle some of the biggest issues in the green economy workforce transition. Finally, skills policy must not work in isolation but support inclusive innovation more broadly, ensuring businesses have the skills support needed to develop and adopt eco-innovations.
1. Introduction

In previous centuries, economic growth has largely come at the expense of the environment. The amount of carbon dioxide – the primary greenhouse gas, accounting for more than 80 per cent of all greenhouse gases and the main contributor to the climate crisis – in the atmosphere has increased since the start of the Industrial Revolution in 1750. Industrialisation, deforestation and large-scale agriculture have exacerbated climate change and the effects of the climate crisis are already being experienced around the world.
Underlining its long-term commitment to tackling the climate crisis, the UK amended the pre-existing target of the Climate Change Act (2008), which was to reduce greenhouse gas emissions by 80 per cent from 1990 levels by 2050, setting a new target of net zero by 2050. The transition to sustainable development will be a catalyst for creative destruction* (Schumpeter, 1943), which will offer unprecedented opportunities and challenges: influencing existing industries, encouraging the development and expansion of new industries and even destroying existing ones.
Although jobs may be lost or transformed in highly polluting sectors, new jobs in the green sector* or in industries that engage in environmental activities could produce employment gains and prevent net job losses (ILO, 2015; OECD, 2017). However, the green sector and brown sector* are theoretical concepts that only provide an abstract conceptualisation of one part of the economy, and they can include different industries in different countries at different times (ILO, 2011). Understanding the relationship between environmental transition and industry is critical in order to affect a country's ability to develop well-functioning labour markets and encourage the emergence and diffusion of a new period of growth.
This report develops the 'Eco-Transformation of Industries Matrix', inspired by the International Labour Organization (ILO, 2011), to quantify the level of risk and opportunity for each industry and offer a richer understanding of the ways in which industries and regions are influenced in the context of the net-zero economy. Using the UK government's definition of the green economy* as one based on a 'thriving low-carbon and environmental goods and services sector' (HM Government, 2011: 3), this report classifies industries based on two variables: intensity of carbon emissions and intensity of activities that produce goods and services for the protection of the environment (or 'environmental activities'). The first measure, carbon emissions intensity, has been used by various organisations and institutions, including the OECD, to determine the greenness of sectors and identify the sectors are likely to face the strongest pressures in the wake of climate change mitigation policies (OECD, 2012; 2017). However, according to the ILO (2011), it is not only the environmental impact that should receive attention when identifying the green sector and green jobs**; the degree of industries' involvement in activities that protect the environment should also be considered. Based on a segregation of industries according to these two criteria, we develop a new taxonomy that classifies industries into leaders, neutrals, followers and laggards, and applies these categories within the UK (Veugelers, 2017).
The taxonomy allows us to: measure current employment within the green economy at a sectoral, regional and national level; identify inequalities between individuals, industries and regions; and highlight areas in which upskilling and reskilling should be prioritised. This taxonomy could be used to conduct periodic evaluations of industries in order to identify progress and suggest relevant actions. In addition, education providers could determine which types of workers will face the greatest challenges, so they can provide customised learning programmes to meet learners' specific needs.
Based on the taxonomy, the report shows that green growth will be a significant challenge for regions with a major concentration of high-polluting industries and for individuals who are currently working in these industries. A transformation towards a greener economy in the UK will lead to significant changes across sectors and occupations, which could increase inequalities between individuals, industries and regions.
regions. The reskilling and upskilling of workers are considered vital for an inclusive and fair transition. Adult learning is central to providing opportunities and eliminating barriers for learners as they move towards green jobs. For a successful green transition, the dominant goals of policy need to be supporting industries and regions in their restructuring activities and helping workers to move from a precarious position to a prepared one. The transition to the green economy is a major government priority. Announcements made in the 2020 Budget recognise the importance of the climate crisis and set out actions to reduce carbon emissions. These actions include: investment in electric vehicles; heat decarbonisation in homes and other buildings; carbon capture in at least two UK sites; tree planting; and at least doubling the Energy Innovation Programme to support the research, development and demonstration of low carbon energy, transportation, agriculture and waste. Within the Industrial Strategy, the Department for Business, Energy and Industrial Strategy (BEIS) has developed Sector Deals (directly linked to the clean growth Grand Challenge), which will cost-effectively decarbonise energy while also securing new jobs and growth for the UK economy. Despite these significant measures, more will need to be done to support a green transition, particularly in ensuring a smooth transition for people employed in sectors with high emissions.
While actions to create a net-zero economy imply long-term radical changes to the broader systems in which we live and operate, the forceful, immediate responses to COVID-19 have shown that human societies are capable of transforming themselves overnight (Haley et al., 2020; WEF, 2020a). Like our response to the coronavirus, we must make fundamental changes for the green transition. This requires global-to-local responses, long-term thinking, science-driven policies and the protection of the most vulnerable individuals (WEF, 2020b).
Based on the collection and analysis of secondary data, this report aims to explore the impact of a transition to net-zero emissions on the UK workforce and the implications of this impact for policymakers, education providers and businesses. As such, the report will:
- Classify industries in the UK based on the new taxonomy, the 'Eco-Transformation of Industries Matrix'.
- Assess the impact of the green transformation on the labour market.
- Examine the role of adult learning for a smooth reallocation of workers from declining to expanding sectors.
- Recommend policy actions to unlock the potential of the green economy.
*Creative destruction
Creative destruction is the 'process of industrial mutation that incessantly revolutionizes the economic structure from within, incessantly destroying the old one, incessantly creating a new one' (Schumpeter, 1942: 82-83).
*Green sector
The green sector consists of industries with low carbon emissions (ILO, 2011).
*Brown sector
The brown sector consists of industries with high carbon emissions (ILO, 2011).
*Green economy
A green economy is an economy in which a sufficient level of output is generated without producing a level of CO₂ emissions that contributes to significantly increasing the risk of raising the Earth's average temperature (ILO, 2011: 20).
*Environmental goods and services sector (EGSS)
The environmental goods and services sector (EGSS) consists of 'activities which produce goods and services to measure, prevent, limit, minimise or correct environmental damage to water, air and soil, as well as problems related to waste, noise and eco-systems' (OECD/Eurostat, 1999: 9).
*Green jobs
Green jobs refers to employment provided by the green sector or the EGSS.
2. Emissions neutrality and sectoral implications

As greenhouse gas emissions have global consequences, actions have already been taken at international, national and regional levels. As a first step in addressing this issue, the United Nations Framework Convention on Climate Change (UNFCCC) was set up in 1992 as the main forum for international action on the climate crisis. In 2015, the UNFCCC's international climate negotiations delivered a global agreement – the Paris – aiming to limit the global temperature rise in the 21st century to less than 2°C, and ideally to only 1.5°C, above pre-industrial levels. The Paris Agreement has already been signed by 195 UN member countries.
Despite these globally co-ordinated actions, there are very large differences in per capita emissions across countries (see Figure 1). The UK has emissions of 5.8 tonnes per capita: much lower than some other countries with similar standards of living, such as Germany (9.73 tonnes per capita), the United States (16.2 tonnes per capita) or Australia (17 tonnes per capita), suggesting that industries, national regulations and technological choices could all make a difference.
Figure 1: CO₂ emissions per capita worldwide, 2017 (tonnes)
A world map shows countries shaded by their CO₂ emissions per capita, with a legend indicating values from 0 to 50 tonnes. Greenland is shown in white with "No data".
Source — Ritchie and Roser (2020).
Since 1990, greenhouse gas emissions have fallen by 43 per cent in the UK: the most substantial emissions reduction in the G7. However, the effects of the climate crisis have already been felt in the UK, as the average sea level in UK waters has risen by around 16cm in the last 100 years, while average temperatures in England between 2008 and 2017 were around 0.8°C higher than in the 1970s (Met Office, 2018).
The Climate Change Act commits the UK government by law to reducing emissions by at least 100 per cent of 1990 levels by 2050. The environmental transformation will have a major impact on how production is organised and managed, and how it affects labour markets. However, we do not know enough about the impact of a transition to net-zero emissions on different industries and in different contexts.
2.1 Defining environmental friendliness across industries
While the green transition could have a significant impact on industries and jobs, it is not possible to generalise findings to all industries and regions. There is no widely accepted standard definition of green jobs, and it is not clear which industries make up the green sector, which can include different industries in different countries at different times (ILO, 2011).
Building on prior work by the ILO (ILO, 2011), Nesta has developed a new taxonomy – the 'Eco-Transformation of Industries Matrix' in the UK – based on the environmental friendliness across industries*. The taxonomy is also intended to explore disparities across industries and evaluate their progress towards net-zero emissions. Practitioners and policymakers can use the taxonomy to shape industry strategies and policy decisions.
Industries are categorised according to their environmental friendliness, using the UK government's definition of the green economy as one based on a 'thriving low-carbon and environmental goods and services sector' that leads to reduced environmental damage and increased energy security, resource efficiency and climate-crisis resilience (HM Government, 2011: 3).
All economic activities are classified into four categories according to two variables: the level of carbon emissions (CO₂/output) and the level of environmental activities (output in the EGSS/output) (see Figure 2). By combining these two variables into a matrix, stakeholders can identify the employment size of these four categories, gaining insights into the level of risk for each industry and the related employment effects of green policies.
Figure 2: The 'Eco-Transformation of Industries Matrix'
A 2x2 matrix with "Level of environmental activity" on the Y-axis (Low to High) and "Level of carbon emissions" on the X-axis (Low to High).
- Top-Left (Low carbon emissions, High environmental activity): Leaders
- Top-Right (High carbon emissions, High environmental activity): Followers
- Bottom-Left (Low carbon emissions, Low environmental activity): Neutrals
- Bottom-Right (High carbon emissions, Low environmental activity): Laggards
Notes – Followers and laggards are considered to be brown sectors, as they are associated with high carbon emissions. Leaders and neutrals are considered to be green sectors, as they are associated with low carbon emissions. Leaders and followers are intensely engaged in activities that directly protect the environment.
Depending on its level of environmental friendliness, each industry can be placed in one of four different categories (see Appendix):
- Leaders: Industries in this category are the most eco-friendly, as they do not produce high levels of carbon emissions and are involved in activities that directly protect the environment across the economy.
- Neutrals: Industries in the 'neutral' category produce low levels of carbon emissions but are not involved intensively in activities that directly protect the environment. They are part of the green sector but are not influenced by new climate-crisis policies.
- Followers: Although they are producing high levels of emissions, followers are also involved in activities that are intended to protect the environment and could thus create green jobs.
- Laggards: Industries in this category produce high levels of carbon emissions and are not involved intensively in activities aimed at protecting the environment.
In the long run, it will be desirable for the followers, laggards and neutrals to become leaders.
*Environmentally friendliness across industries
This report defines environmentally friendly industries as those with low carbon-emission intensity and a high level of environmental activity.
2.2 The eco-transformation of industries
Many carbon-intensive industries will see a high proportion of jobs lost or radically transformed due to the net-zero emissions by 2050 target, although others may remain broadly unchanged. Although jobs may be lost or transformed in the brown sectors, new jobs in the EGSS, otherwise known as the eco-industry, could produce employment gains and prevent net job losses (ILO, 2015). While it is difficult to predict the number of future green jobs, as they are still at an early stage of development, data on carbon emissions and environmental activity allows the amount of disruption during the move towards net-zero emissions to be assessed across industries (see Figure 3).
Figure 3: The four categories of environmental friendliness across industries
A 2x2 matrix similar to Figure 2, with "Level of environmental activity" on the Y-axis (Low to High) and "Level of carbon emissions" on the X-axis (Low to High). Each quadrant lists example industries.
-
Leaders (Low carbon emissions, High environmental activity):
- Education
- Professional, scientific and technical activities
- Public administration and defence; compulsory social security
- Arts, entertainment and recreation
-
Followers (High carbon emissions, High environmental activity):
- Manufacturing
- Construction
- Other service activities
- Electricity, gas and water supply
- Agriculture, forestry and fishing
-
Neutrals (Low carbon emissions, Low environmental activity):
- Human health and social work activities
- Administrative and support service activities
- Information and communication
- Financial and insurance activities
- Real estate activities
-
Laggards (High carbon emissions, Low environmental activity):
- Wholesale and retail trade, repair of motor vehicles and motorcycles
- Accommodation and food service activities
- Transportation and storage
- Mining and quarrying
Notes – Industries in each category are ranked based on the size of each industry, by employment. Followers and laggards are considered to be brown sectors, as they are associated with high carbon emissions. Leaders and neutrals are considered to be green sectors, as they are associated with low carbon emissions. Leaders and followers are intensely engaged in activities that directly protect the environment.
Source — Calculations based on data from Eurostat (2020a, 2020b, 2020c), OECD (2020) and ONS (2019a).
The follower industries include: agriculture, forestry and fishing; manufacturing; electricity, gas and water supply; construction; and other services. Followers could be viewed as industries that will be forced to move towards structural change within their sector. For example, the agricultural industry is taking action to protect the environment through crop management practices, such as improved fertiliser management. Significant progress has also been made in reducing carbon emissions from energy supply, driven by a decrease in the use of coal for electricity generation and a positive trend towards the production of renewable energies. However, with only about 11 per cent of energy derived from renewable sources, the UK has one of the lowest proportions in Europe (Eurostat, 2020d). Further dramatic changes are needed to reduce the production of emissions in these industries.
The laggard industries include: mining and quarrying; wholesale and retail trade, and repair of motor vehicles and motorcycles; transportation and storage; and accommodation and food service activities. These industries need to reduce their impact on the environment. Retailers and wholesalers, for example, need to start working with farmers, fishers and manufacturers to source products with a smaller carbon footprint, and design their stores to use less energy and deploy more renewables. In addition, accommodation and food service activities need to reduce their impact on the environment. In the hotel sector, for example, this includes waste collection and energy consumption. Investing in environmentally friendly activities could lead to increased employment, while preventing net job losses, and reducing emissions could avoid potential future penalties, such as increased carbon taxes, or closures.
Leader industries are those with low emission intensity (below median level). As part of the EGSS and the green sector, leaders are currently investing in environmental activities and providing jobs. For example, consultants provide expert assessment and advisory services concerning the management of environmental issues, while education providers provide environment-related education. Leaders include the following industries: professional, scientific and technical activities; education; arts, entertainment and recreation; and public administration and defence, and compulsory social security.
More incentives need to be given to neutrals to make them become environmentally friendly, as their role is critical to supporting the transition. For example, real estate is central to urban development and also to the creation of an environmentally sustainable future. However, the sector lags behind other industries in its response to environmental challenges, as its environmental activities are limited. To counter this gap, governments could establish long-term policies that provide incentives for investment in green buildings, such as tax exemptions for green employment gains. Neutrals include the following industries: information and communication; financial and insurance activities; real estate activities; human health and social work activities; and administrative and support service activities.
3. The green economy and employment considerations
The environmental transformation will change the ways in which production is organised and managed and affect labour markets across industries. The likely concentration of job losses related to the transition to green growth is a significant challenge for any industry and region. It is likely that industries in the brown sector will face significant changes and employees in that sector may lose their jobs. There may be employment gains in industries that contribute to achieving a sustainable economy, such as industries that are involved in activities to protect the environment. An examination of the current distribution of employment among sectors is critical for the green transition. This section explores the nuances of a transition to a net-zero economy using the 'Eco-Transformation of Industries Matrix' and considers how it will affect industries and regions differently in the UK.

3.1 Emissions in the UK and employment implications
The possible effects of greening the economy on employment are concerning. The transition towards green growth will potentially lead to a decrease in employment or changes of jobs in the sectors with the largest adverse environmental impacts, but there could also be an increase in employment in the sectors with positive environmental impacts. For example, a tax on CO₂ emissions will lead to a loss or reduction of employment in coal-fired power stations and the oil and gas sector, and other jobs in carbon-intensive industries will be transformed, while new jobs related to the protection of the environment will be created. In this respect, identifying the share of employment in each of the four industry categories will help to identify the sectors that are likely to face the largest challenges and opportunities in the wake of climate-crisis mitigation policies.
Figure 4: Level of carbon emissions and employment in the UK by industry, 2018 (%)
A line graph showing two cumulative shares: "Cumulative share of carbon emissions intensity" (dark green line) and "Cumulative share of total employment" (grey line), plotted against industries arranged from "High level of carbon emissions" to "Low level of carbon emissions" on the X-axis. The Y-axis ranges from 0 to 100.
Industries on the X-axis (left to right): Transportation and storage, Electricity, gas and water supply, Mining and quarrying, Agriculture, forestry and fishing, Manufacturing, Construction, Wholesale and retail trade, repair of motor vehicles and motorcycles, Other service activities, Arts, entertainment and recreation, Public administration and defence; compulsory social security, Human health and social work activities, Administrative and support service activities, Education, Professional, scientific and technical activities, Information and communication, Real estate activities, Financial and insurance activities.
The dark green line (carbon emissions) rises steeply on the left side, indicating that a few industries contribute to a high percentage of total carbon emissions. The grey line (employment) rises more gradually, showing that employment is more distributed across industries.
Source — Calculations based on data from Eurostat (2020a, 2020b) and OECD (2020).
Figure 4 shows the concentration of employment across industries based on the level of carbon emissions intensity. Industries with a high level of carbon emissions (brown sector) are responsible for about 93 per cent of UK emissions and account for 45 per cent of total employment (2018 figures). Industrial sectors, transportation and storage and wholesale and retail trade account for about 90 per cent of total emissions intensity. Transportation and storage had the highest emissions intensity, followed by: electricity, gas and water supply; mining and quarrying; agriculture, forestry and fishing; manufacturing; and construction. It is notable that carbon emissions intensity is high in some of the biggest sectors in terms of employment – namely, wholesale and retail trade, repair of motor vehicles and motorcycles, manufacturing and construction – which together account for about 30 per cent of total employment. This pattern implies that these industries will need to reduce carbon emissions and adapt their production processes to new green technologies.
The sectors with carbon emissions intensity below the median level (green sector) are responsible for 7 per cent of UK emissions, while accounting for about 55 per cent of total employment. Carbon emissions intensity is significantly low in some big sectors in terms of employment – such as professional, scientific and technical activities, human health and social work activities and education – which together account for about a third of total employment.
Figure 5 shows the concentration of employment across industries based on the level of environmental activity. In contrast with the brown and green sectors, employment in industries with high levels of environmental activity is rather small when measured by the number of employees involved in the eco-industry as a whole. It is noticeable that the electricity, gas and water supply industry was the highest contributor to employment in the EGSS, with 221,946 jobs (or 55 per cent of employment in the EGSS), highlighting that green jobs in other industries are limited. The industry making the second highest contribution to employment in the environmental economy was agriculture, reporting about 16,435 jobs (or 4 per cent of employment) in the EGSS.
The contribution of industries to environmental activities is still very low. Not all industries are involved in the EGSS. The eco-industry sector in the UK is small, accounting for 1.3 per cent of total employment in 2018, while EU averages stood at 2.1 per cent (Eurostat, 2020c; ONS, 2019a). An increase in jobs related to waste water management, waste management, the protection and remediation of soil, groundwater and surface water, water management and the management of energy resources could lead to the reduction of emissions and employment gains. Environmental regulations, coupled with innovation, will lead to a growing eco-industry and, ultimately, to greater employment opportunities. For example, adapting infrastructure, including water conservation and the generation of renewable energy, could lead to employment gains and prevent net job losses.
Figure 5: Level of environmental activity and employment in the eco-industry (EGSS) in the UK, 2018 (%)
A line graph showing two cumulative shares: "Cumulative share of environmental activities intensity" (dark blue line) and "Cumulative share of employment in EGSS" (light brown line), plotted against industries arranged from "High level of environmental activity" to "Low level of environmental activity" on the X-axis. The Y-axis ranges from 0 to 100.
Industries on the X-axis (left to right): Electricity, gas and water supply, Agriculture, forestry and fishing, Construction, Arts, entertainment and recreation, Manufacturing, Professional, scientific and technical activities, Other service activities, Public administration and defence; compulsory social security, Education, Administrative and support service activities, Mining and quarrying, Human health and social work activities, Wholesale and retail trade; repair of motor vehicles and motorcycles, Transportation and storage, Accommodation and food service activities, Information and communication, Financial and insurance activities, Real estate activities.
The dark blue line (environmental activities intensity) rises steeply on the left side, indicating that a few industries perform a high percentage of environmental activities. The light brown line (employment in EGSS) rises more gradually, showing that EGSS employment is more distributed.
Source — Calculations based on data from Eurostat (2020a, 2020b, 2020c), OECD (2020) and ONS (2019a).
Figure 6: Share of employment across categories of eco-transformation in the UK, 2010 and 2018
Two pie charts, one for 2010 and one for 2018, illustrating the percentage share of employment in different categories of eco-transformation.
Legend:
* Environmental activities in leaders (dark green)
* Leaders (excluding environmental activities) (light green)
* Environmental activities in followers (dark blue)
* Followers (excluding environmental activities) (light blue)
* Neutrals (brown)
* Laggards (light brown)
2010 Pie Chart:
* Environmental activities in leaders: 0.2%
* Leaders (excluding environmental activities): 24.3%
* Environmental activities in followers: 1%
* Followers (excluding environmental activities): 26.3%
* Neutrals: 21.7%
* Laggards: 26.5%
2018 Pie Chart:
* Environmental activities in leaders: 0.2%
* Leaders (excluding environmental activities): 23.9%
* Environmental activities in followers: 1.1%
* Followers (excluding environmental activities): 26.8%
* Neutrals: 20.5%
* Laggards: 27.5%
Source — Calculations based on data from Eurostat (2020a, 2020b, 2020c), OECD (2020) and ONS (2019a).
Figure 6 shows employment in the UK in 2010 and 2018 across all the four categories of the taxonomy. In 2018, 8.6 million people were employed in leader industries, corresponding to 27 per cent of total employment, and 8.8 million people were employed in the neutral category, corresponding to approximately 28 per cent of total employment. Laggards and followers each account for about 24 per cent and 21 per cent of total employment respectively.
Labour markets have experienced only a slight growth in the share of green-sector employment, with simultaneous loss of employment in the brown sectors, particularly in followers. The share of total employment in green sectors increased slightly, from about 53 per cent in 2010 to 55 per cent in 2018. In contrast, the share of brown-sector employment fell from approximately 47 per cent in 2010 to 46 per cent in 2018. The shift towards a service- and knowledge-based economy has led to the increase in leaders and the fall in the brown sector (particularly in laggards) (see Figure 6).
Leaders and followers engage intensively in environmental activities compared to the other sectors, but still to a limited extent. In 2018, the share of employment in these activities in the followers category represented about 5 per cent of employment in the category and only around 1.1 per cent of total UK employment, while for leaders the share was about 0.6 per cent and 0.2 per cent of total UK employment. The biggest increase of jobs in environmental activities between 2010 and 2018 was in followers, which increased from 288,930 jobs to 343,233. Employment in these activities in the leader category decreased from 54,665 to 54,196. The total number of jobs in environmental activities in the UK remains significantly low, and the creation of new jobs in this area should be promoted.
3.2 Emissions across regions and employment implications
Emissions per capita vary noticeably across regions. The Committee on Climate Change (CCC) has advised that the net-zero greenhouse gas target for 2050 meets the UK's obligations under the Paris Agreement to maintain the expected rise in global average temperature at less than 2°C. However, the CCC has recommended different targets for different regions based on their respective circumstances: a 95 per cent greenhouse gas reduction by 2050 in Wales, a net-zero target by 2045 in Scotland and a net-zero target by 2050 in England and Northern Ireland (CCC, 2019a). Analysis of CO₂ emissions shows large differences across the UK. Per capita, emissions are higher in Wales, reflecting its greater industrial base compared to the rest of the UK.
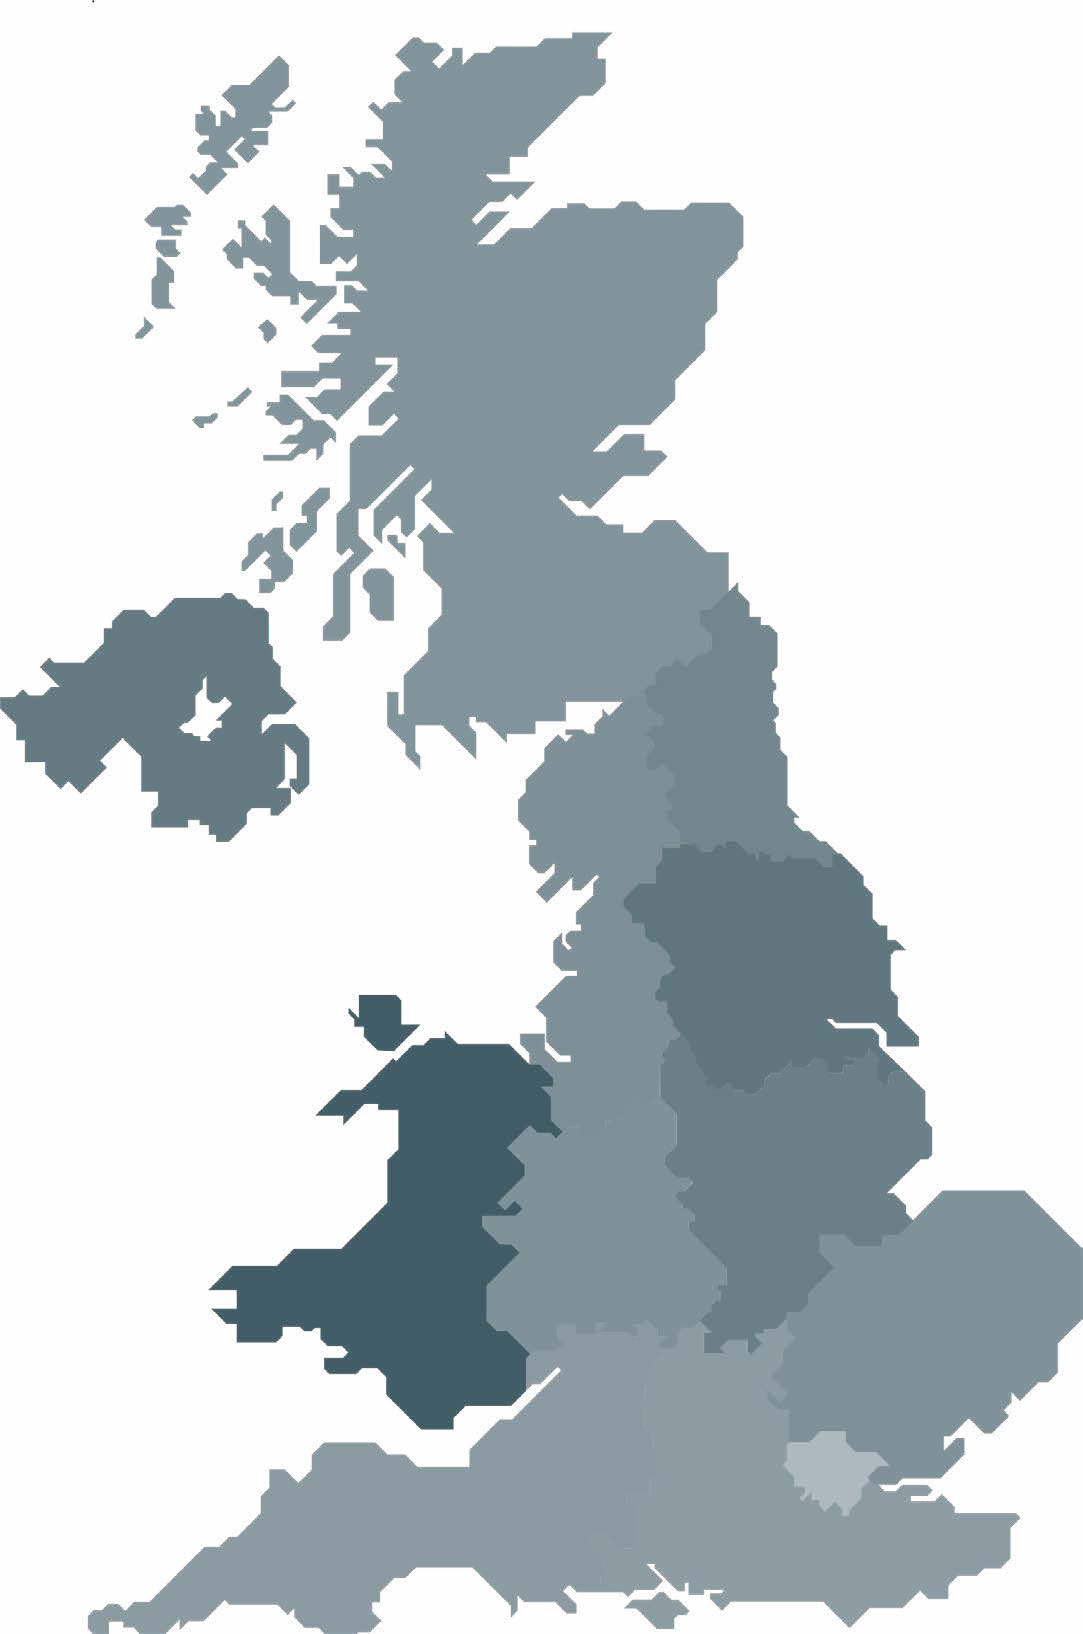
Figure 7: CO₂ emissions per capita across regions of the UK, 2017 (tonnes)
A map of the UK and Ireland, with regions shaded by CO₂ emissions per capita, with a legend indicating values from 3.4 to 7.9 tonnes.
Source — ONS (2019b).
Per capita, emissions in Greater London are significantly lower than the average in England, predominantly because of its extensive public transport system and its service-based economy. According to the ONS (2019b), both the highest and lowest emissions per capita were found in Greater London. The City of London was responsible for emitting 97.9 tonnes of carbon dioxide per capita per year, compared to 2.3 tonnes in Hackney (ONS, 2019b). The main factor behind high carbon footprints could be the low population density of the City, but may also be due to people's high salaries. According to Sager (2019), higher-income individuals are more responsible for the climate crisis due to their lifestyle consumption emissions (e.g. sports cars, yachts and private jets).
Figure 8: Employment by region and category of eco-transformation in the UK, 2018 (% of total employment)
This stacked bar chart visualizes the percentage of total employment in each UK region, broken down by categories of eco-transformation (Leaders, Neutrals, Followers, Laggards). Each region has a bar showing the distribution of employment across these categories.
Figure 9: Employment concentration across categories of eco-transformation in the UK, 2018 (% of total employment)
| Regions |
Green sector |
Leaders |
Neutrals |
Brown sector |
Followers |
Laggards |
| Northern Ireland |
2.41 |
2.30 |
2.50 |
2.98 |
3.83 |
2.45 |
| Scotland |
8.21 |
8.15 |
8.25 |
8.31 |
8.73 |
8.05 |
| Wales |
4.05 |
4.17 |
3.95 |
4.61 |
5.74 |
3.92 |
| North East |
3.32 |
3.17 |
3.45 |
3.55 |
3.98 |
3.28 |
| North West |
10.31 |
10.50 |
10.15 |
11.51 |
11.35 |
11.60 |
| Yorkshire and the Humber |
7.51 |
7.52 |
7.50 |
8.31 |
8.83 |
7.98 |
| East Midlands |
5.95 |
6.01 |
5.90 |
7.85 |
8.95 |
7.18 |
| West Midlands |
7.62 |
7.48 |
7.74 |
9.25 |
10.62 |
8.41 |
| East of England |
8.83 |
9.09 |
8.62 |
9.44 |
9.29 |
9.53 |
| London |
20.36 |
19.86 |
20.75 |
12.09 |
7.55 |
14.88 |
| South East |
13.76 |
13.92 |
13.63 |
13.26 |
12.10 |
13.97 |
| South West |
7.68 |
7.84 |
7.55 |
8.86 |
9.05 |
8.74 |
Source — Calculations based on data from Eurostat (2020a, 2020b, 2020c), OECD (2020), ONS (2019a, 2019c, 2020).
The cross-sectoral and regional dimensions of the transition are critical. The share of employment in brown sectors is not evenly spread across the UK. Regions in industrial transition, including Northern Ireland, the East Midlands and West Midlands – where about 50 per cent of jobs are in high-emissions sectors – will require the most support and strategic development to increase the efficiency of brown sectors, reduce their dependence on fossil fuels and invest in the EGSS. London, where about 68 per cent of employees already work in the green sector, will be one of the areas least hit.
The green sector is concentrated in particular regions, leading to regional inequalities. Such inequalities are likely to significantly worsen, with London (with more than 20 per cent of jobs in the green sector) decoupling from the rest of the UK. In contrast, employment in the brown sector is less unevenly spread across the UK (see Figure 8 and 9). However, it is clear that some regions have a significantly higher concentration of brown jobs, and particularly jobs in the follower category, than green jobs. It seems that disparities across regions in employment are significant and green policies could strengthen inequalities of opportunity.
Although it is most relevant to apply the taxonomy at the national level, rather than the regional level, due to the role of country-specific interactions and institutions in the transition, the matrix could be applied to the four nations to identify potential variations. The green sector may include different industries in different nations, depending on different technologies, different employment structures or the spatial distribution of various natural resources across the four regions.
There are very large differences in emissions across the UK, particularly in power supply and agriculture, due to the different size of industries. In Northern Ireland, agriculture accounted for about 30 per cent of total emissions, compared to about 10 per cent in the rest of the UK, due to the large agricultural sector and the high proportion of livestock-based farming. In contrast, net emissions from Scotland in this sector were about 0 per cent because the large forests absorb emissions (CCC, 2019a).
At about 35 per cent of the total, Wales had a higher proportion of emissions from power than the UK as a whole. This contrast is mainly due to continued emissions from Aberthaw coal-fired power station, which alone accounted for more than 50 per cent of Welsh power emissions. In Scotland, however, emissions from power made up less than 10 per cent of the total. In fact, 2017 marked the first year of coal-free electricity generation in Scotland. Scottish renewable generation contributes approximately 25 per cent of the UK total. In Scotland, renewable energy from wind is continually increasing and is currently supplied to almost 100% of homes in Scotland and the North of England (WEF, 2019).
The industrial structure of a given region can influence the size of its emissions. Some sectors and regions could suffer if appropriate policies are not put in place to mitigate the effects of this major structural change. Therefore, the government should make a broader assessment of potential ways to ensure that the overall transition promotes inclusive growth and creates jobs across the country. While BEIS has played an important role in reducing emissions since it was formed, for example by leading the Clean Growth Strategy, such action needs to involve all government departments and agencies, to ensure that emissions are reduced across all regions and sectors, and that investments support those employees who will be most vulnerable during the transition (CCC, 2019b).
4. Reskilling and upskilling to prepare workers for the green economy
Shifting the economy towards less polluting and more resource-efficient activities by 2050 will lead to significant changes in jobs and skills requirements. These changes 'translate to new skill sets, updates of curricula or even new qualifications'.
For example, the dissemination of green technologies requires skills in technology production, operation and maintenance. The UK will need a new approach to both training young people and upskilling employees in the workforce to have sufficient capacity to compete in the green economy.
Source — Cedefop, 2018:3.
4.1 The profile of workers in the four categories of eco-transformation and implications for adult learning
We must determine which types of workers tend to work in each category, in order to identify suitable retraining services that could help them readjust to new jobs or industries and minimise the resulting adjustment costs. Figure 10 shows that 68 per cent of of workers in the leaders category are high-skilled employees, compared to 27 per cent for the laggards, while the majority of low- and medium-skilled employees work in the brown sector. The share of older workers (55-74 years) across the most and least polluting industries was comparable, while the share of younger workers (up to 39 years of age) was higher in the brown sector. This difference suggests that many younger workers still see brown jobs as viable and in some cases necessary career paths.
Figure 10: The profile of workers in the four categories of eco-transformation in the UK, 2018
A 2x2 matrix, similar to Figure 2, with "Level of environmental activity" on the Y-axis (Low to High) and "Level of carbon emissions" on the X-axis (Low to High). Each quadrant lists statistics about the profile of workers within that category.
-
Leaders (Low carbon emissions, High environmental activity):
- 57% Women
- 20% Older adults
- 43% Younger adults
- 68% High-skilled
- 28% Medium-skilled
- 4% Low-skilled
- 21% Adult learning
-
Followers (High carbon emissions, High environmental activity):
- 26% Women
- 21% Older adults
- 44% Younger adults
- 40% High-skilled
- 50% Medium-skilled
- 10% Low-skilled
- 12% Adult learning
-
Neutrals (Low carbon emissions, Low environmental activity):
- 59% Women
- 19% Older adults
- 44% Younger adults
- 59% High-skilled
- 34% Medium-skilled
- 7% Low-skilled
- 21% Adult learning
-
Laggards (High carbon emissions, Low environmental activity):
- 42% Women
- 18% Older adults
- 52% Younger adults
- 27% High-skilled
- 58% Medium-skilled
- 15% Low-skilled
- 11% Adult learning
Source — Calculations based on Eurostat (2020a, 2020b, 2020c, 2020e), ILO (2020), OECD (2020) and ONS (2019a).
In addition, the majority of employees in the brown sector were men, unlike the green sector: 74 per cent of all employees in followers were men, while only about 40 per cent in neutrals and leaders were men. However, the diversity of employees across these sectors differs in a few instances. For example, workers in some of these sectors are mainly older workers (e.g. agriculture), underlining the need to avoid a one-size-fits-all approach.
Current participation in adult learning is a strong predictor of future learning (Smith et al., 2019). However, current participation in the UK is low and varies considerably across the four groups. The participation rate in leaders is about 21 per cent, compared to only 11 per cent in laggards. Adults with the lowest qualifications, especially men in routine and manual jobs (laggard and follower industries), are the least likely to learn new skills. Training is more often available to staff who are already highly skilled, in leader and neutral industries. The concentration of lower- and medium-skilled workers and younger and male workers in the brown sector has important implications for the expected size of the upcoming industrial transformation through upskilling and reskilling. Employees displaced from these sectors could face difficulties reintegrating into employment, as lower-qualified workers tend to experience large post-displacement difficulties (OECD, 2012). Learning new skills will be necessary to reintegrate these workers into the labour market.
As Chapman (2020) states, 'Learning should not be a linear activity, or exclusively for those who have money or spare time. For everyone to thrive in work, training needs to be re-imagined to ensure learning fits individual needs and circumstances'. There are many different kinds of adult learners and they have many different learning needs. There is no one-size-fits-all solution, and it is vital to examine potential ways of increasing participation in upskilling and reskilling by different types of learners. It is crucial to adapt the design or approach of a learning experience according to the characteristics and needs of individual learners, including migrants, young and older workers, and low-skilled employees (Casasbuenas & Bekar, 2020).
21% of leaders participate in adult learning
11% of laggards participate in adult learning
4.2 The transition to green growth and preparation for future skills demands
The definition of green skills is very fluid and there is not enough evidence about future green skills needs (Cedefop, 2018). According to the ILO (2018), green skills include:
- Technical, occupationally specific skills, including sales, engineering and marketing.
- Semi-technical transferable skills, including customer handling, project management and research.
- Soft skills, both cognitive and non-cognitive, including communication, problem-solving, teamwork, collaboration and creativity.
These skills are relevant not only to the green transition but also to a number of diverse and interacting sources of structural change, such as the ageing population, automation and the shift towards a service- and knowledge-based economy, which are expected to have major impacts on future skills needs (Bakhshi et al., 2017). Therefore, transition to green growth and preparation for future skills demands will need to be facilitated, alongside other megatrends.
As only 11 per cent of people in laggard industries – the least environmentally friendly industries – participate in adult learning, their skills are more likely to become obsolete over time (OECD, 2019). To gain a greater understanding of lifelong learning*, also referred to as adult learning (for adults aged 25-64), and address the challenge of upskilling and reskilling, Nesta has designed FutureFit (a training and research project) in partnership with trade unions, researchers and adult learning experts from across the Nordic and Benelux regions. Although this programme involves training for many workers in many different sectors, it can still inform decision-makers about how to empower at-risk employees with the skills they need for tomorrow and how to evaluate 'what works'.
*Lifelong learning
Lifelong learning is defined as 'all learning activity undertaken throughout life, with the aim of improving knowledge, skills and competence, within a personal, civic, social and/or employment-related perspective' (European Commission, 2001: 9).
'Lifelong learning is something that many people talk about, but few really practice. The question then becomes – how do we get more people to learn throughout their lives?'
Nesta's research highlights that, to address the challenge of upskilling and reskilling, we need to understand what motivates people to participate in adult education (Hughes et al., 2019) and remove the barriers that prevent people from participating. A variety of factors have a major influence on participation in education and training: 30.6 per cent of all adults in the UK do not wish to participate in adult learning, even though they have not experienced it, while about 17 per cent have not engaged in training and do wish to engage (Eurostat). In the UK, people who want to participate in adult education but do not, give the following reasons: clashes with work schedules (59.8 per cent), costs (45.2 per cent) and family responsibilities (38.4 per cent) (Kapetaniou, 2020).
It is of vital importance that industries are helped to develop the knowledge, skills and competences of their employees, to become more innovative and eco-friendly and to transform themselves into leaders. Leaders from the most environmentally friendly industries should indicate which skills contribute most to their green activities. Acquiring green skills should contribute to minimising carbon emissions and protecting the environment; adult education providers should adjust their programmes accordingly.
Without immediate action, there is a risk that people will be forced out of work altogether (Nesta, 2019). There is a need for greater and more comprehensive co-ordination of the measures for education and training. To increase participation in adult learning, education providers, trade unions, organisations and policymakers all need to work together to tackle the personal and systemic barriers to learning, such as clashes with work schedules and high costs. Increased investment in adult education is vital: enabling more courses to be available for those who cannot afford them; providing flexible courses for those with limited time; and focusing on the particular characteristics and needs of individuals, including migrants, older workers and low-skilled employees, to improve their learning experiences. This is important because it is not just the current workforce that needs to be retrained; the workforce of the future needs to be directed into areas of growth.
Source — Wikland, 2020 in Chapman et al., 2020.
5. Skills policy recommendations for the green economy
The transition to a green economy will not happen without government support. Whether it is the low cost of solar panels driven by the US government (Kavlak et al., 2018) or the low price of offshore wind driven by the UK (Department of Energy & Climate Change and Hendry, 2012), major progress towards developing a cleaner future has had direct and deliberate government involvement at each step. For the next step of the transition to a net-zero economy, we must look beyond innovations towards other drivers of change to boost the UK's competitiveness throughout the eco-transformation. To ensure individuals and regions are not left behind as the net-zero transition accelerates, upskilling, signposting and targeted support are needed. Developing the next generation of clean technologies and green businesses will require people with the right skills.

5.1 A data-driven approach to upskilling
All levels of government need to take a data-driven approach to upskilling, using data to inform individuals and guide educational institutions. Some of this data is already available, but it needs to be used consistently and in a co-ordinated way throughout the pipeline of skills programming. This point applies to data that is used for guiding students and workers, like the National Careers Service or the Find a job service. Having an integrated place for this information would simplify things for people throughout their lives. It could also include eco-badges, so that people know which jobs actively fight the climate crisis or are less likely to be disrupted by a net-zero transition. Nesta's data-driven skills taxonomy can help students, workers, employers, educators and policymakers learn more about the skills that are needed, and the value of those skills (Djumalieva & Sleeman, 2018).
1Create a national jobs and skills data commons, a framework that would include, for example, linking and accessing data on occupations and skills.
2Fund the development of a standardised taxonomy of skills to be used by national and local services, building on Nesta's own taxonomy of skills.
3Create an eco-jobs classification to indicate 'leader' jobs that actively help to fight the climate crisis and a 'laggard' and 'follower' or 'brown jobs' classification, so that people understand what employment may be negatively impacted by the climate crisis
5.2 New approaches to upskilling
Non-traditional education, or non-formal education (education delivered by independent private or non-profit educators), can offer a quicker and cheaper route to upskilling individuals. Employers use these routes four times more than further education colleges or higher education institutes to train their employees (Skills Commission, 2015). Unfortunately, the government does not provide the same level of support for people pursuing non-traditional education, which may limit the effectiveness of upskilling support and create unnecessary burdens for upskilling. New skills will be required, not only for existing occupations that are expected to experience either significant employment growth or a significant decrease due to the greening of the economy, but also for other occupations that are likely to undergo major changes in task content, such as legal professionals. New types of credentials and ways of approaching upskilling may be needed. The government worked with stakeholders through the Sector Deals to develop T Levels, which are already driving the growth of eco-innovation* in the aerospace, automotive, construction, offshore wind and nuclear sectors. A similar method could be used as here.
4Provide funding and expand other government support (e.g. childcare) for individuals who pursue training by non-traditional education providers, in addition to traditional ones.
5Create new, industry-led credentials for non-traditional education programmes.
6Fund training for people transitioning out of brown jobs to those sectors less affected by environmental change.
*Environmental innovation (or eco-innovation)
Environmental innovation is 'any innovation resulting in significant progress towards the goal of sustainable development, by reducing the impacts of our production modes on the environment, enhancing nature's resilience to environmental pressures, or achieving a more efficient and responsible use of natural resources' (European Commission, 2018a).
5.3 Taking a mission-oriented approach to skills policy
The UK's Grand Challenges programme is positioning the UK to be at the forefront of the green economy through investment in some of the biggest issues facing a net-zero transition: energy use by buildings; industrial carbon emissions; and transportation. This mission-oriented approach brings together relevant stakeholders to tackle a Grand Challenge – a major issue in society that cannot be solved with a single policy intervention or by one actor. The result is a co-ordinated set of policies and partnerships (e.g. regulation, business investment and procurement). A green-jobs Grand Challenge can complement this work. Research at Nesta's Innovation Growth Lab can support this, as it is working with countries around the world to explore different techniques for defining missions, convening communities, choosing the right policy mix and optimising processes. An example in the green jobs skills context could be doubling the share of employment in leader sectors by 2030 or transitioning a quarter of employees in laggard sectors to other jobs by 2030. This set of policy interventions must tackle the cost of training as well as other systemic barriers, like family responsibilities.
7Task a single organisation with leading this mission-oriented approach (e.g. the Industrial Strategy Grand Challenges), which brings together policymakers, employers, unions and training providers.
8Experiment with how existing skills programmes, and other complementary programmes, can be used to advance the missions (e.g. funding streams within existing programmes and a central pot for cross-cutting issues).
5.4 Supporting inclusive innovation in a green economy
Ensuring a smooth transition to a green economy and sharing the benefits of it across the UK will require an inclusive approach to innovation more generally. While national leadership is required, much of this change will happen in communities, requiring a more targeted approach and community-led economic responses in the pursuit of a sustainable future. Skills are important drivers of innovation; they are necessary for developing and adopting new technologies. Skills advisory panels help mayoral combined authorities and Local Enterprise Partnerships to understand their current and future skills needs and labour market challenges. However, more needs to be done to ensure a green transition is put front and centre of local skills agendas.
9Develop regional clusters of green innovation capacity, including funding green skills, research, and business innovation partnerships to act as growth centres for the transition to a net-zero economy.
10Accompany investment in eco-innovation with measures to upgrade skills to increase the chances of locals being able to do some of the jobs created by high-tech clusters.
Finally, the COVID-19 pandemic has created a dramatic short-term reduction in greenhouse gases, as countries try to contain the spread of disease. Once COVID-19 has passed, society is likely to shift back to some form of normality and emissions are likely to move back to pre-COVID-19 levels. However, the current pandemic shows that a collective endeavour involving international, national and local institutions, organisations and individuals is possible during global emergencies, and can have a major impact on the ability of countries to respond to crises. Similarly, a co-ordinated endeavour will be required to tackle the climate crisis: to achieve the transition to net-zero by 2050 without creating huge inequalities between individuals, industries and regions, organisations across the UK will have to work together.
Appendix: Methodology
The report develops the 'Eco-Transformation of Industries Matrix' to assess the level of environmental friendliness of industries across the UK based on two variables: the level of carbon emissions and the level of environmental activities.
The level of carbon emissions is based on the median of emissions intensity for all industries. A detailed, comprehensive computation of carbon emissions intensities (CO₂/output) was performed to determine an industry ranking by level of carbon intensity. With this ranking, the median of CO₂ emissions across industries was computed and industries are categorised as belonging to the brown sector (above the median) or the green sector (below the median). The assumption is that industries in brown sectors will face the biggest challenges, and jobs in these industries will be in transition.
The level of environmental activities is based on the median of environmental activities intensity for all industries. A detailed, comprehensive computation of environmental activities intensity (output in the EGSS)/output) was performed to determine an industry ranking by level of environmental activity. With this ranking, the median of environmental activity across industries was computed and industries are categorised as belonging to the high-intensity environmental activity (above the median) or to the low-intensity environmental activity (below the median). The assumption is that industries with high-intensity environmental activities have already started to become more environmentally friendly, thus generating new jobs.
Table A1: The four categories of eco-transformation in the UK by industry, 2018
| Industry |
Level of environmental activities |
Level of carbon emissions |
Category |
| Agriculture, forestry and fishing |
0.199 |
0.497 |
Follower |
| Mining and quarrying |
0.003 |
0.872 |
Laggard |
| Manufacturing |
0.032 |
0.281 |
Follower |
| Electricity, gas and water supply |
1.000 |
0.934 |
Follower |
| Construction |
0.092 |
0.096 |
Follower |
| Wholesale and retail trade, repair of motor vehicles and motorcycles |
0.000 |
0.078 |
Laggard |
| Transportation and storage |
0.000 |
1.000 |
Laggard |
| Accommodation and food service activities |
0.000 |
0.066 |
Laggard |
| Information and communication |
0.000 |
0.014 |
Neutral |
| Financial and insurance activities |
0.000 |
0.000 |
Neutral |
| Real estate activities |
0.000 |
0.004 |
Neutral |
| Professional, scientific and technical activities |
0.022 |
0.018 |
Leader |
| Administrative and support service activities |
0.008 |
0.041 |
Neutral |
| Public administration and defence; compulsory social security |
0.020 |
0.056 |
Leader |
| Education |
0.011 |
0.030 |
Leader |
| Human health and social work activities |
0.001 |
0.049 |
Neutral |
| Arts, entertainment and recreation |
0.066 |
0.058 |
Leader |
| Other service activities |
0.022 |
0.059 |
Follower |
| Median |
0.009 |
0.058 |
|
Notes – The two variables (intensity of carbon emissions and intensity of environmental activities) were normalised between 0 and 1 using the min-max normalisation technique. Followers and laggards are considered to be brown sectors, as they are associated with high carbon emissions. Leaders and neutrals are considered to be green sectors, as they are associated with low carbon emissions. Leaders and followers are intensely engaged in activities that directly protect the environment.
Based on the taxonomy, we are able to evaluate the impact of the transition towards a green economy on employment and adult learning, using various data sources (see Table A2).
Main data sources
Table A2: Main data sources
| Variables |
Sources |
| CO₂ emissions by industry |
OECD (2020) |
| Output by industry |
Eurostat (2020b) |
| EGSS output by industry |
Eurostat (2020c), ONS (2019b) |
| EGSS employment by industry |
Eurostat (2020c), ONS (2019b) |
| Employment by region and industry |
ONS (2019c; 2020) |
| Participation in education and training by age and industry |
Eurostat (2020e) |
| Employment by gender and industry |
Eurostat (2020a) |
| Employment by age and industry |
Eurostat (2020a) |
| CO₂ emissions per capita by region |
ONS (2019b) |
| Level of skills by industry |
ILO (2020) |
References
- Bakhshi et al. (2017). The Future of Skills: Employment in 2030. London: Pearson and Nesta. https://www.nesta.org.uk/report/the-future-of-skills-employment-in-2030/
- Casasbuenas, J., & Bekar, B. (2020). Make it FutureFit: Four ways to design better adult learning experiences. A practical guide to design adult learning experiences that are fit for the future world of work and skills. London: Nesta. https://www.nesta.org.uk/report/make-it-futurefit-four-ways-design-better-adult-learning-experiences/
- CCC(2019a). UK Net-Zero Advisory Group to the Committee on Climate Change. London: CCC. https://www.theccc.org.uk/wp-content/uploads/2019/05/UK-Net-Zero-Advisory-Group-Chair-Report.pdf
- CCC (2019b). Reducing UK emissions 2019 Progress Report to Parliament. London: CCC. https://www.theccc.org.uk/wp-content/uploads/2019/07/CCC-2019-Progress-in-reducing-UK-emissions.pdf
- Cedefop (2018). Skills for green jobs in the United Kingdom: an update [Unedited proof copy]. https://www.cedefop.europa.eu/files/uk_country_report_2018.pdf
- Chapman, O. (2019). Skills for all. Why we need to reboot the adult learning system. https://www.nesta.org.uk/blog/skills-all/
- Chapman, O., Barnett, G., & Bekar, B. (2020). How should we carry on learning throughout our lives? From a 'know-all' to a 'learn-all' attitude: setting the foundations for continuous adult learning in Sweden. https://www.nesta.org.uk/blog/futurefit-formally-launches-in-sweden
- Department of Energy & Climate Change, & Henry, C. (2012). Offshore wind industry to slash costs by over 30% in next seven years. https://www.gov.uk/government/news/offshore-wind-industry-to-slash-costs-by-over-30-in-next-seven-years
- Djumalieva, J., & Sleeman, C. (2018). Making sense of skills: A UK skills taxonomy. https://data-viz.nesta.org.uk/skills-taxonomy/index.html
- European Commission (2001). Making an European area of lifelong learning a reality. Luxembourg: Office for Official Publications of the European Communities. https://www.europarl.europa.eu/meetdocs/committees/cult/20020122/com(2001)678_en.pdf
- European Commision (2018). Eco-innovation in the United Kingdom. https://ec.europa.eu/environment/ecoap/sites/ecoap_stayconnected/files/field/field-country-files/uk_eio_country_profile_2016-2017.pdf
- Eurostat (2020a). Employment and unemployment [Database]. https://ec.europa.eu/eurostat/web/lfs/data/database
- Eurostat (2020b). Detailed breakdowns of main GDP aggregates (by industry and consumption purpose [Database]. https://ec.europa.eu/eurostat/web/national-accounts/data/database
- Eurostat (2020c). Environmental economy [Database]. https://ec.europa.eu/eurostat/statistics-explained/index.php?title=Environmental_economy_%E2%80%93_statistics_by_Member_State&oldid=438927
- Eurostat (2020d). Renewable energy statistics [Database]. https://ec.europa.eu/eurostat/statistics-explained/index.php/Renewable_energy_statistics
- Eurostat (2020e). Education and training [Database]. https://ec.europa.eu/eurostat/web/education-and-training/data/database
- Haley, C., Orlik, J., Czibor, E., Cuello, H., Firpo, T., Goettsch, M., Lou-Davina, G., & Smith, L. (2020). There will be no 'back to normal'. https://www.nesta.org.uk/blog/there-will-be-no-back-normal/
- Hughes et al., (2019). What Motivates Adults to Learn? A rapid evidence review of what drives learning new skills in the workplace. London: Nesta. https://media.nesta.org.uk/documents/Digital_Frontrunners_Motivation_to_Learn_report_final_published.pdf
- HM Government (2011). Skills for a green economy. London: HM Government. https://assets.publishing.service.gov.uk/government/uploads/system/uploads/attachment_data/file/32373/11-1315-skills-for-a-green-economy.pdf
- ILO (2011). Defining "green": Issues and considerations. Geneva: ILO. https://www.ilo.org/wcmsp5/groups/public/---dgreports/---inst/documents/publication/wcms_194180.pdf
- ILO (2015). Anticipating skill needs for green jobs. A practical guide. Geneva: ILO. https://www.ilo.org/wcmsp5/groups/public/---ed_emp/---ifp_skills/documents/publication/wcms_564692.pdf
- ILO (2018). Skills for a greener future: A global view. Geneva: ILO. https://www.ilo.org/wcmsp5/groups/public/---ed_emp/documents/publication/wcms_732214.pdf
- ILO (2020). ILOSTAT [Database]. https://ilostat.ilo.org/
- IPCC (2018). Global Warming of 1.5°C. An IPCC Special Report on the impacts of global warming of 1.5°C above pre-industrial levels and related global greenhouse gas emission pathways, in the context of strengthening the global response to the threat of climate change, sustainable development, and efforts to eradicate poverty. https://www.ipcc.ch/site/assets/uploads/sites/2/2019/06/SR15_Full_Report_High_Res.pdf
- Kapetaniou, C. (2020). Education for All. Making the case for a fairer adult learning system. London: Nesta. https://www.nesta.org.uk/report/education-all/
- Kavlak, G., McNerney, J., & Trancik, J. (2018). Evaluating the causes of cost reduction in photovoltaic modules. Energy Policy, 123, 700-710.
- Met Office (2018). UKCP18 Headline Findings. https://www.metoffice.gov.uk/binaries/content/assets/metofficegovuk/pdf/research/ukcp/ukcp18-headline-findings-2.pdf
- Nesta (2019). Precarious to prepared. A manifesto for supporting the six million most at risk of losing their jobs in the next decade. London: Nesta. https://media.nesta.org.uk/documents/Precarious_to_prepared._A_manifesto_for_supporting_the_six_million_most_at_risk_of_losing_their_jobs_in_the_next_decade_v5.pdf
- OECD/Eurostat (1999). The Environmental Goods and Services Industry: Manual on Data Collection and Analysis. Paris: OECD.
- OECD (2012). The jobs potential of a shift towards a low-carbon economy. Paris: OECD. https://www.oecd.org/els/emp/50503551.pdf
- OECD (2017). Employment implications of green growth: Linking jobs, growth, and green policies. Paris: OECD. https://www.oecd.org/environment/Employment-Implications-of-Green-Growth-OECD-Report-G7-Environment-Ministers.pdf
- OECD (2019). OECD Skills Strategy 2019. Paris: OECD. https://www.oecd-ilibrary.org/docserver/9789264313835-en
- OECD (2020). Air emissions accounts [Dataset]. https://stats.oecd.org/viewhtml.aspx?datasetcode=AEA&lang=en#
- ONS (2019a). Environmental goods and services sector (EGSS) estimates [Dataset]. https://www.ons.gov.uk/economy/environmentalaccounts/datasets/ukenvironmentalgoodsandservicessectoregssestimates
- ONS (2019b). UK local authority and regional carbon dioxide emissions national statistics: 2005 to 2017 [Dataset]. https://www.gov.uk/government/statistics/uk-local-authority-and-regional-carbon-dioxide-emissions-national-statistics-2005-to-2017
- ONS (2019c). Region by broad industry group (SIC) - Business Register and Employment Survey (BRES): Table 4 [Dataset]. https://www.ons.gov.uk/employmentandlabourmarket/peopleinwork/employmentandemployeetypes/datasets/
- ONS (2020). JOBS05: Workforce jobs by region and industry [Dataset]. https://www.ons.gov.uk/employmentandlabourmarket/peopleinwork/employmentandemployeetypes/datasets/workforcejobsbyregionandindustryjobs05
- Ritchie, H., & Roser, M. (2020). CO₂ and Greenhouse Gas Emissions. https://ourworldindata.org/co2-and-other-greenhouse-gas-emissions
- Sager, L. (2019). Income inequality and carbon consumption: Evidence from Environmental Engel curves. Energy Economics, 84(1), 104507.
- Schumpeter, J. (1943). Capitalism, Socialism, and Democracy. New York: Harper Brothers Publishers.
- Skills Commission (2015). Guide to the Skills System. London: Skills Commission. https://www.policyconnect.org.uk/sites/site_pc/files/report/625/fieldreportdownload/guidetotheskillssystem.pdf
- Smith, R., Egglestone, C., Jones, E., & Aldridge, F. (2019). Adult participation in learning survey 2019. Leicester: Learning and work institute. https://learningandwork.org.uk/resources/research-and-reports/adult-participation-in-learning-survey-2019/
- Veugelers, R. (2017). Missing convergence in innovation capacity in the EU: Facts and policy implications. Luxembourg: European Commission.
- WEF (2020a). Could COVID-19 give rise to a greener global future? https://www.weforum.org/agenda/2020/03/a-green-reboot-after-the-pandemic/
- WEF (2020b). How our responses to climate change and the coronavirus are linked. https://www.weforum.org/agenda/2020/04/climate-change-coronavirus-linked/
- WEF (2019). Scotland's new target: 100% renewable electricity in 2020. https://www.weforum.org/agenda/2019/07/scotland-wind-energy-new-record-putting-country-on-track-for-100-renewable-electricity-in-2020
- Figure 1: CO₂ emissions per capita worldwide, 2017 (tonnes)
- Figure 2: The 'Eco-Transformation of Industries Matrix'
- Figure 3: The four categories of environmental friendliness across industries
- Figure 4: Level of carbon emissions and employment in the UK by industry, 2018 (%)
- Figure 5: Level of environmental activity and employment in the eco-industry (EGSS) in the UK, 2018 (%)
- Figure 6: Share of employment across categories of eco-transformation in the UK, 2010 and 2018
- Figure 7: CO₂ emissions per capita across regions of the UK, 2017 (tonnes)
- Figure 8: Employment by region and category of eco-transformation in the UK, 2018 (% of total employment)
- Figure 9: Employment concentration across categories of eco-transformation in the UK, 2018 (% of total employment)
- Figure 10: The profile of workers in the four categories of eco-transformation in the UK, 2018
About Nesta
58 Victoria Embankment,
London, EC4Y 0DS
+44 (0)20 7438 2500
www.nesta.org.uk
[email protected]
www.facebook.com/nesta.uk
@nesta_uk
Nesta is a registered charity in England and Wales with company number 7706036 and charity number 1144091.
Registered as a charity in Scotland number SCO42833.
Registered office: 58 Victoria Embankment, London, EC4Y 0DS
ISBN: 978-1-84875-163-7
Footnotes


