FutureFit is a major training and research project led by Nesta and supported by Google.org
Working closely with trade unions, researchers and adult learning experts from across the Nordics and Benelux region, the project uses innovative training interventions and robust research to understand 'what works' to empower workers with the skills they need for tomorrow, and improve the wider adult learning system across Europe.
Nesta is an innovation foundation. For us, innovation means turning bold ideas into reality and changing lives for the better. We use our expertise, skills and funding in areas where there are big challenges facing society.
To find more, visit: www.nesta.org.uk/project/futurefit
Author
Chrystalla Kapetaniou
January 2020
Acknowledgements
This report benefited greatly from comments and feedback from Genna Barnett, Georgie Whiteley, Olivia Chapman and Beatrice Bekar from Nesta.
For more information about this report, please contact:
Chrystalla Kapetaniou
[email protected]
Executive summary
Rapidly changing developments in new technology have considerably changed the nature of work. The extent to which economies can reap the benefits from these changes will depend on the ability of institutions to provide the right conditions for investment in knowledge and skills. Yet, the current structure of the adult learning system in the UK is fostering social fragmentation. Access to, and participation in, adult learning has been determined by wealth, age, place of residence, and educational attainment. Participation is characterised by what the sociologist Robert Merton called the 'Matthew Effect' of accumulated advantage: those who already have opportunities, get more; while those who do not have opportunities are unable to gain any. Or, in other words: 'advantages beget advantages' (Rigney, 2010).
This report uses data from the European Statistical System to explore key learning patterns and progress. It provides a deeper and more thorough understanding of adult learning at the regional, individual and organisational levels and recognises leverage points and opportunities in the UK adult learning system. Rather than focusing solely on individuals, we believe that it is more appropriate to focus on the context of the system. Therefore, for the purposes of this report, we adopt the terms 'National Adult Learning System' and 'Regional Adult Learning System', as we believe that national and regional institutional relationships determine the participation of individuals in adult learning.
In our research, we wanted to explore questions such as: How has low-skilled, middle-skilled and high-skilled employment changed over time in the UK, and what are the implications for adult learning?; What are the characteristics of adult learners in the UK?; And what is the role of employers in adult learning and education?
Our key findings include:
-
1. Rise of the service economy:
Since the information and telecommunications revolution, the share of the service sector in total employment has increased significantly and the direct production of goods has been replaced by the production of knowledge-based and in-person services. This structural transformation has led to a marked concentration of economic activity in particular regions, worsening regional inequalities and increasing the importance of lifelong learning.
-
2. Growing inequality:
There are huge disparities in adult learning across the UK and between different social and economic groups. The huge differences in participation across the country are most keenly felt within individual regions. London has the greatest variation in participation of any region.
Non-participants in adult learning tend to fall into one or more of three groups: the elderly; those with low levels of education; and the unemployed. The participation rate for those aged 25-34 in the UK was 60.3 per cent compared to 39 per cent for those aged 55-64. For adults with tertiary-level education, the participation rate was around 68.1 per cent, while the rate for less qualified adults was only 28.1 per cent.
-
3. Industry plays a critical role:
Participation in adult education and training is mostly non-formal, job-related and employer-sponsored. 41.3 per cent of adults participated in job-related education, which is equivalent to approximately 80 per cent of participation in total adult learning (ALE) activities. However, the training efforts of many employers remain focused on young and highly skilled employees, increasing existing inequalities across individuals.
Significant individual, regional and interregional inequalities in the UK are putting the country's adult learning system under increasing strain. Our analysis suggests that participation in adult learning is associated with social and economic inequality at the organisational, local and regional levels. To ensure that every adult is given equality of opportunity in terms of access to adult learning, training providers, policymakers and organisations need to focus on devising effective national and regional adult learning systems.
1. Introduction
The greatest threat to employment is not automation but an inability to remain competitive.
Many studies predict that automation could dramatically boost economic growth and productivity. For example, a report by Accenture (2016) forecasts that automation will improve labour productivity by up to 40 per cent. Similarly, the Boston Consulting Group (2015) forecasts productivity improvements of 30 per cent over the next ten years. To quote Paul Kraugman, "Productivity isn't everything, but in the long run it is almost everything. A country's ability to improve its standard of living over time depends almost entirely on its ability to raise its output per worker".
The UK is behind many of its European counterparts when it comes to automation. According to the International Federation of Robotics (IFR, 2019), the most automated countries in the world include South Korea, Singapore, Germany, Japan, Sweden, Denmark and the USA. In 2017, there were just 85 industrial robots per 10,000 workers in the UK manufacturing sector. In contrast, Germany - Europe's most automated country - has 322 units per 10,000 workers, while the equivalent figure in the Czech Republic, the closest European country to the UK, is 119 units. That positions the UK behind 21 other countries, and means that it urgently needs to embrace technology and increase productivity.
The UK is also a long way behind in terms of productivity. According to the Office for National Statistics (2018), in 2016, output per hour worked in the UK was 15.1 per cent below the average for the other Group of Seven leading economies (Canada, France, Germany, Italy, Japan, the UK and the US).
Source International Federation of Robotics, 2017:2
The Business, Energy and Industrial Strategy Committee (2019:3) observes that: "The risk we face is not a robot takeover of our workplaces, but that our lack of adoption and the reluctance of businesses and the government to lead the way in the Fourth Industrial Revolution means other countries will seize the initiative and take advantage of new technologies, not least the growth and jobs they bring, while we are left behind."
The extent to which economies can reap the benefits of automation and boost their productivity will depend on the ability of institutions to provide the right conditions and infrastructure for investment in knowledge and skills, facilitating the transition of the workforce to the new world of work. The structure and functioning of a country's adult learning system is likely to be reflected not only in the effects on productivity but also in the impact of new technology on employment. Failure to understand the relationship between technological unemployment and adult learning may disrupt the emergence of a new period of growth.
For the purposes of this research, we adopt the term 'National Adult Learning System', which we define as the set of formal and social institutions whose interactions determine the participation of adult learners in training, and the learning and/or employment outcomes within a country. We also believe that, due to the diverse regional structure of adult training and education, it is critical to consider regional interventions and focus on regional adult learning systems, to ensure that disparities across and within regions are reduced. A 'Regional Adult Learning System' is derived from the institutional relationships that define adult learning within a region.
In our recent report Becoming FutureFit, which presents an exploratory analysis of adult learning (ALE) across Europe, we find that devising effective national adult learning systems, which help to tackle inequality and social exclusion, still seems to be a distant goal. Based on the findings of our report, we believe that significant regional and interregional inequalities in the UK are putting the country's adult learning system under increasing strain.
The report addresses three questions on adult learning in the UK. First, how has low-skilled, middle-skilled and high-skilled employment changed over time in the UK, and what are the implications for adult learning? Second, what are the characteristics of adult learners? Third, what is the role of firms in adult learning and education?
It uses data from the European Labour Force Survey to explore employment patterns in the UK. In addition, data from the European Statistical System, the Adult Education Survey (AES), the EU Labour Force Survey (EU-LFS) and the Continuing Vocational Training Survey (CVTS) are used to explore key learning patterns and progress. The AES and CVTS are conducted every five years, and the LFS annually.
It is clear that participation in adult education is characterised by what the sociologist Robert Merton called the Matthew Effect: those who already have opportunities, get more; while those who do not have opportunities are unable to gain any. It is reasonable to infer that individual characteristics are the single determinant of ALE participation. However, ALE participation, which is driven by socioeconomic characteristics at the individual level, is associated with social inequality at the organisational, regional and national levels.
2. Rise of the knowledge economy
Today's knowledge economy has seen a remarkable increase in the quantity and complexity of new technology. Together with demographic change, this is significantly affecting labour market trends. Over the past 50 years, the structure of the UK economy has been transformed. The UK has become a ‘post-industrial' economy, marked by a transition from a manufacturing-based economy to a service-based economy. Since 1970, manufacturing has fallen by more than 200 per cent, reducing jobs by more than five million; while the service sector increased by about 45 per cent and service jobs by seven million in 2018. Since the beginning of the 1990s, the share of the service sector in total employment has increased significantly, rising from 69 per cent to 82 per cent of total employment (see Figure 1). This transition is connected with the replacement of blue-collar manual labourers with high-skilled workers, as the direct production of goods is replaced by the production of services.
The literature on labour demand tends to refer to three levels of skill: low, middle and high. These three categories are used to group the eight basic categories of occupations listed in the International Standard Classification of Occupations (ISCO) (excluding those in the armed forces).
Figure 1. Employment by Industry in the UK, 1992-2018
This chart shows employment in thousands across various industries from 1992 to 2019. Industries include: Agriculture; Mining and quarrying; electricity, gas and water supply; Public Administration, Community, Social and other Services and Activities; Construction; Manufacturing; Trade, Transportation, Accommodation and Food, Business and Administrative Services. Service sectors show a general upward trend, while manufacturing and other goods production sectors show a decline or stability.
Source Adapted from ILO (2019)
Based on the aggregate levels of education presented in ILOSTAT, highly skilled workers include managers; professionals; technicians and associate professionals. Medium-skilled workers include clerical support workers; service and sales workers; skilled agricultural, forestry and fishery workers; craft and related trades workers; and plant and machine operators and assemblers. Low-skilled workers are those in the most basic occupations.
Figure 2. Changes in skills in the UK, 1992-2018
This chart illustrates employment changes by skill level (high, medium, low) within industry and services from 1992 to 2018. It shows a significant increase in high-skilled and medium-skilled employment in services, stable low-skilled employment in services, a decrease in medium-skilled industry jobs, and slight increases in high-skilled and low-skilled industry jobs.
Source Adapted from ILO (2019)
Figure 2 shows changes in employment in the UK between 1992 and 2018 for each of these skill groups by services and industry. The employment in the service sector increased significantly for both highly skilled and middle-skilled occupations, and remained about stable for low-skilled employees. In particular, highly skilled employment doubled in the service sector, from about seven million to around 13 million jobs. The picture is completely different in industry, where medium-skilled jobs have significantly decreased by around 45 per cent, while employment in highly skilled and low-skilled jobs increased slightly between 1992 and 2018.
Increases in the share of high-skilled occupational groups are associated with the advance of the knowledge economy. It is clear that labour markets have already experienced substantial growth in the proportion of highly skilled occupations, but simultaneous losses of low-skilled occupations.
The share of highly skilled occupations is 50 per cent of total employment, while the equivalent figure for low-skilled occupations is around 10 per cent. This expansion was mainly concentrated in various professional, scientific, technical, administrative and support service activities. This was a minor sector 30 years ago, but since then has increased by approximately 200 per cent, employing around four million people in 2018; it continues to increase.
Many knowledge-intensive services, including professional, scientific, technical, administrative and support service activities, are concentrated in particular regions, leading to regional inequalities. Such inequalities are likely to significantly worsen, with London, one of the main cities with high-skilled occupations, decoupling from the rest of the UK. For example, professional services are responsible for almost one million jobs in London (see Figure 3).
While regional inequalities will be significant, disparities within individual regions should not be ignored, as they could dramatically increase. For example, while London should be able to take advantage of economic growth through investment in high-skilled jobs, it also needs to ensure that low-skilled and medium-skilled individuals are not left behind. For everyone to thrive in work, the adult learning system needs to ensure that learning fits individual needs and circumstances (Chapman, 2019).
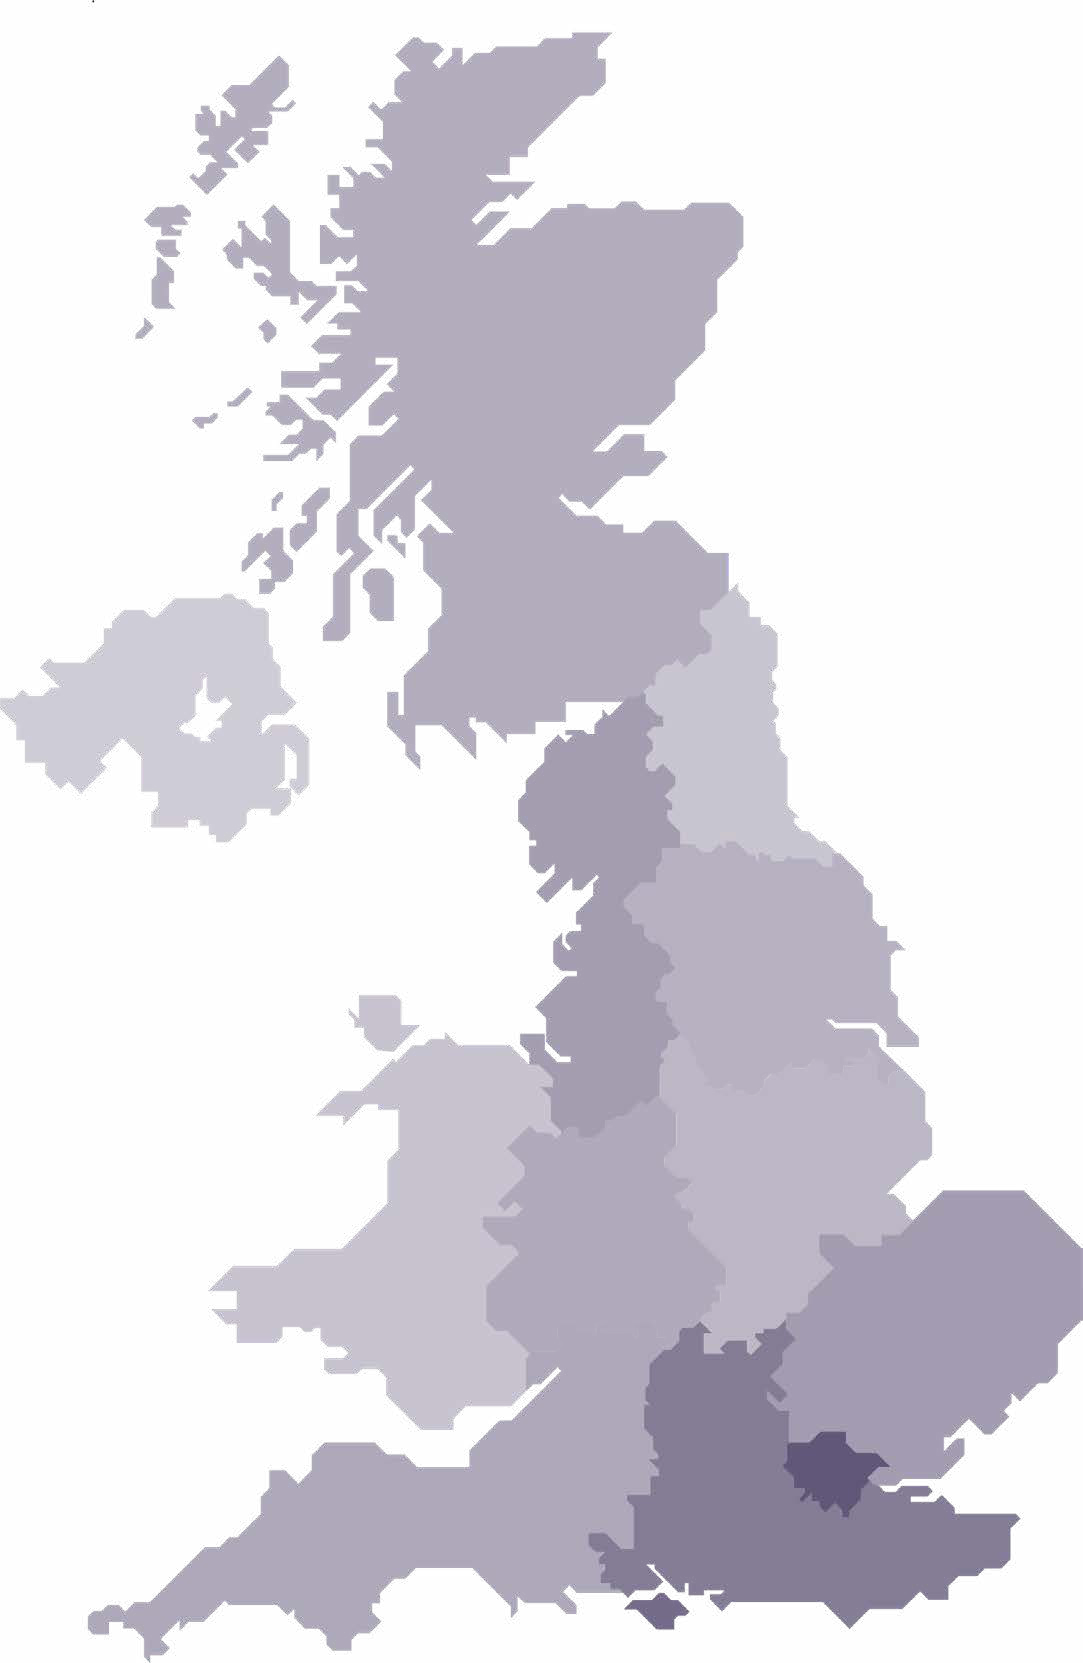
Figure 3. Employment concentration in professional, scientific, technical, administrative and support service activities in the UK, 2018
Source Adapted from Eurostat (2019a)
3. Adult learning in the UK
Adult learning is all learning activity undertaken throughout life, with the aim of improving knowledge, skills and competence, within a personal, civic, social and/or employment-related perspective.
A deeper and more thorough understanding of adult learning will help the leverage points and opportunities to be recognised, enhancing the outreach and impact of adult learning in the UK.
This section analyses adult learning at the regional, individual and organisational levels. National and regional characteristics shape adult learning and affect the level of participation. Therefore, rather than focusing solely on individuals when discussing the conditions which encourage adult learning, we believe that it is more appropriate to discuss them in the context of the ecosystem.
Source European Commission, 2001, p:9
3.1. Differences in overall participation rates across and within regions
The latest results from the LFS (with a reference period of four weeks) show that in 2018 the highest rates of adult participation in learning were in Sweden (29.2 per cent) and Finland (28.5 per cent); the participation rate in the UK, however, stood at only 14.6 per cent (see Figure 4).
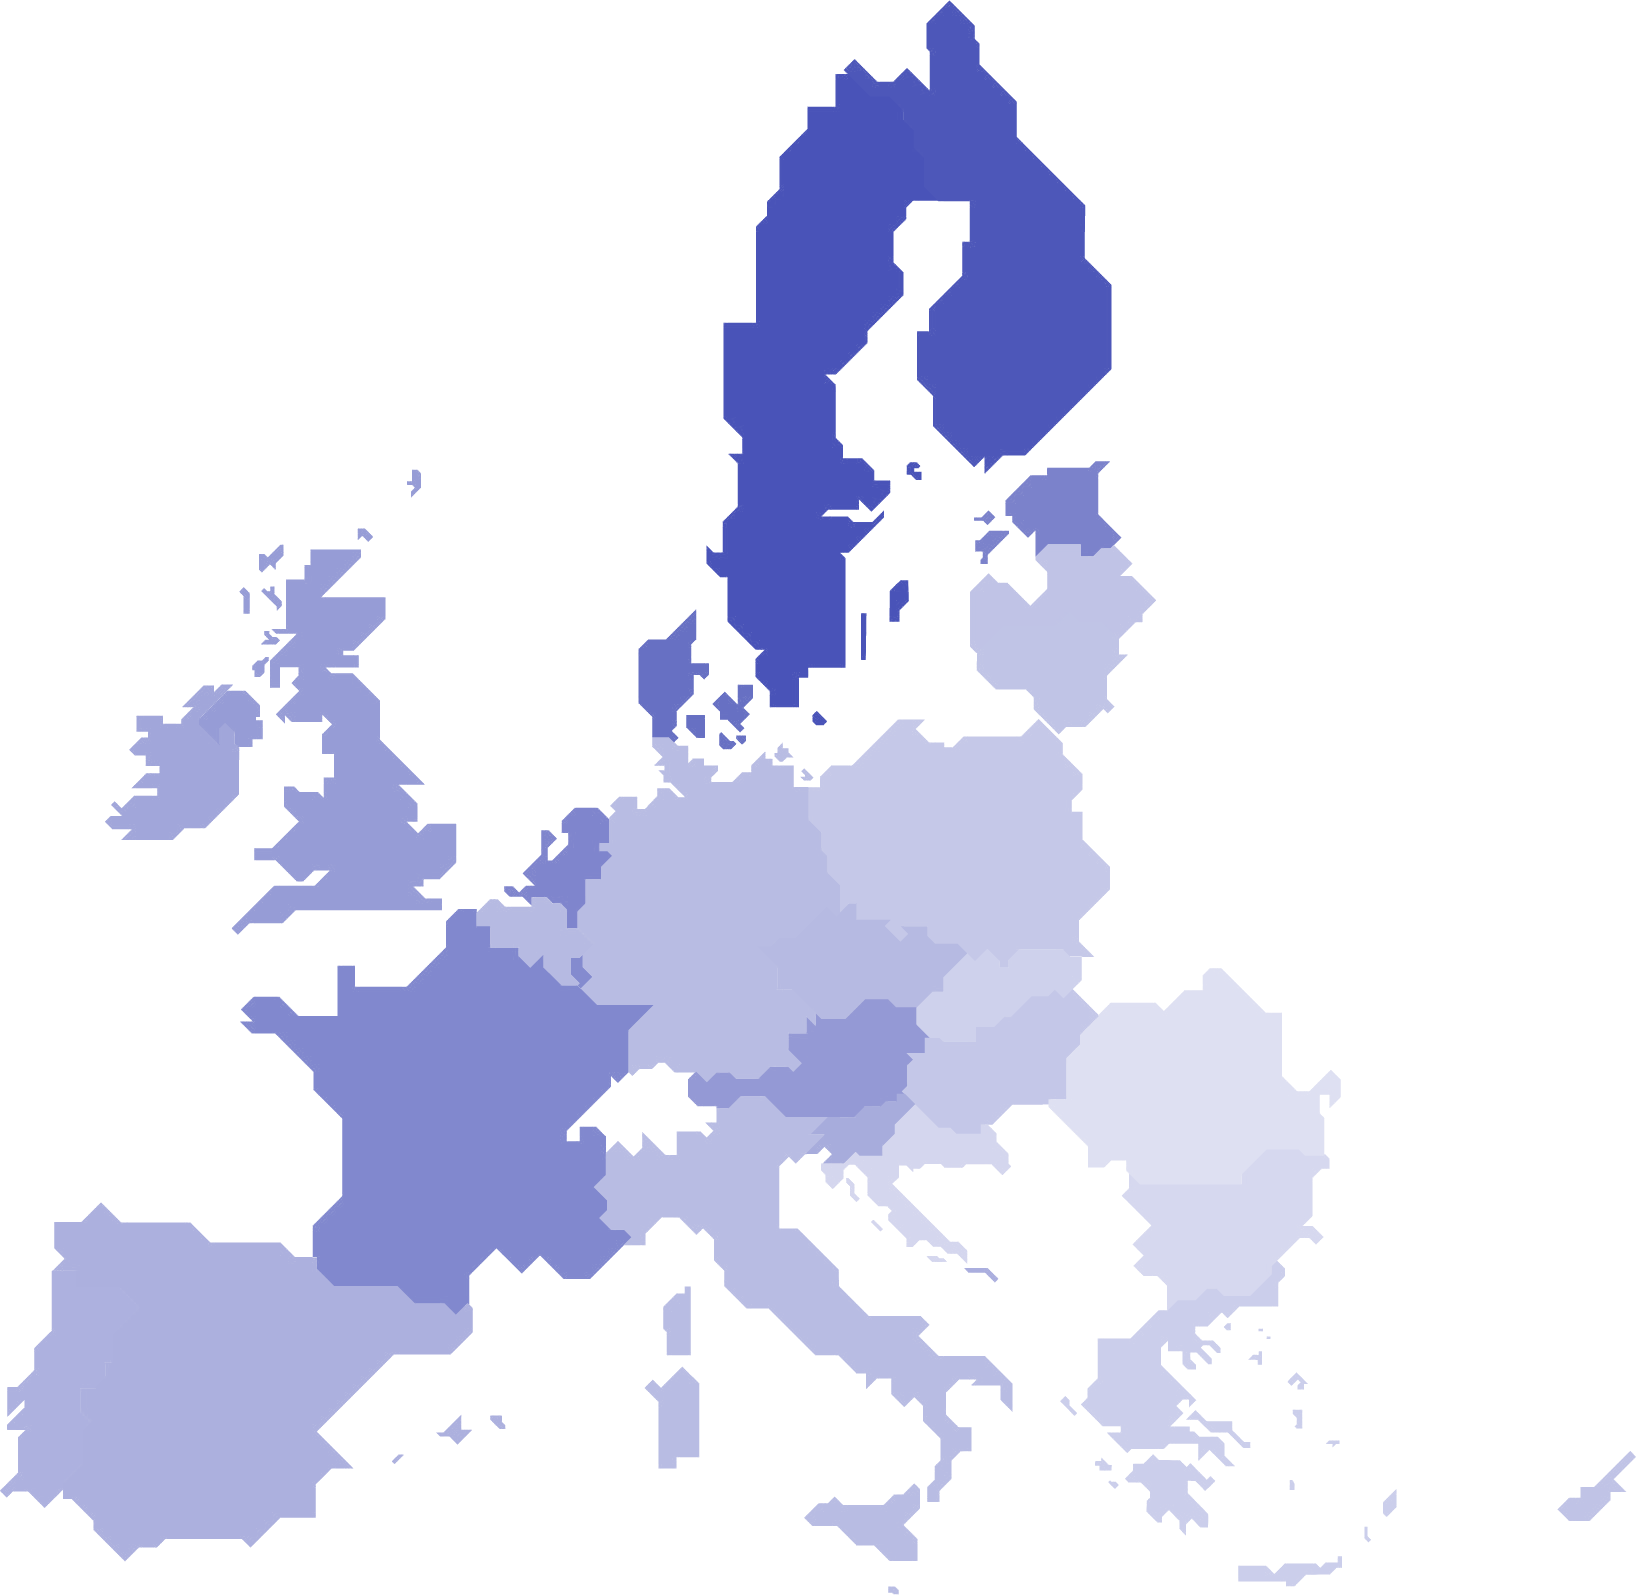
Figure 4. Adult participation in ALE in % of adults aged 25-64 in the EU 28, 2018
Source Adapted from Eurostat (2019b)
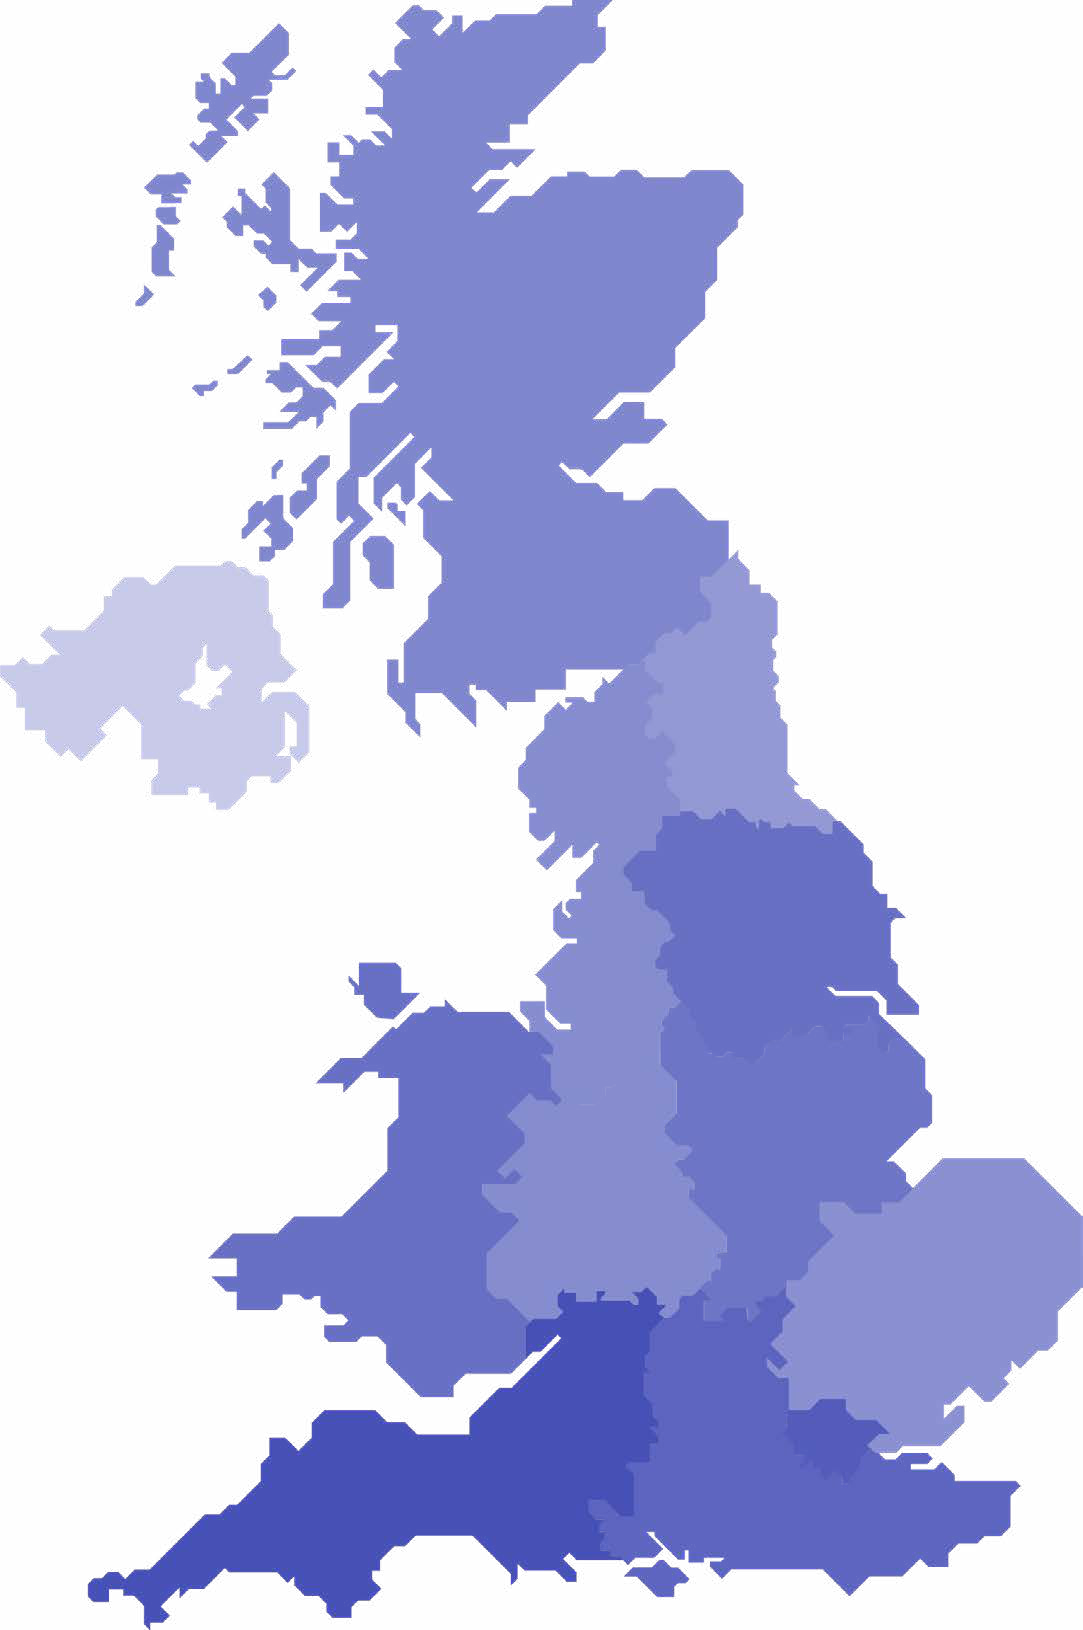
Figure 5. Adult participation in ALE in % of adults aged 25-64 within the UK, 2018
Source Adapted from Eurostat (2019b)
There are major differences in the rates of participation in adult learning in different parts of the UK. Some local factors, particularly those that relate to location, the local economy and the prevailing cultures of communities, are not easily addressed by central government, and the development of effective Regional Adult Learning Systems (RALS) is critical. The South West and London stood out from the other regions, reporting higher participation levels of about 16 per cent. In contrast, Northern Ireland reported participation of around 10 per cent (see Figure 5).
The huge differences in participation across the country are most keenly felt within individual regions. London has the greatest variation in participation of any region. The participation of adults in the west and north-west of outer London (18 per cent) was more than six per cent higher than in the east of inner London (12 per cent).
3.2. Differences in overall participation rates among individuals
There does not seem to be an equal distribution of adult learning participation among individual adult learners. The AES and LFS show that those with insufficient learning opportunities included the elderly and the less qualified. The AES, which measures participation in education and training within the preceding 12 months, reports that the participation of those aged 25-34 in the UK was 60.3 per cent, compared to 39 per cent for those aged 55-64 (see Figure 6). The figure for adults with tertiary-level education was around 68.1 per cent, while the rate for less qualified adults (those with less than primary or with primary and lower secondary education) was only 28.1 per cent. In addition, while 67.9 per cent of highly skilled occupations - including managers, professionals, technicians and associated professionals - participated in education and training, only around 40 per cent of skilled manual workers and elementary occupations did so.
Figure 6. Participation in ALE in % of adults aged 25-64 in the UK in 2016, by occupation, educational attainment level and age
This chart displays the percentage participation in adult learning (ALE) by occupation, educational attainment level, and age group in the UK for 2016. It shows higher participation for managers, professionals, technicians, and those with tertiary education, as well as younger age groups (25-34 years).
Source Adapted from Eurostat (2019b)
| Obstacles |
All |
From 55 to 64 years |
Less than primary, primary and lower secondary education |
| No need for (further) education or training |
74.4 |
78.4 |
73.4 |
| Schedule |
59.8 |
47.7 |
50.6 |
| Cost |
45.2 |
33.5 |
47.2 |
| Family responsibilities |
38.4 |
25.7 |
37.9 |
| Lack of employer's support or public services support |
32.5 |
22.4 |
27.3 |
| Distance |
30.3 |
34.2 |
30 |
| Other personal reasons |
22.1 |
26.1 |
36.5 |
| Prerequisites |
14.3 |
12.7 |
28.1 |
| Health or age |
14.1 |
25.5 |
30.5 |
| No suitable education or training activity (offer) |
8.2 |
12.3 |
11.7 |
| Negative previous learning experience |
4.9 |
7.1 |
11.9 |
| No access to a computer or internet |
3.0 |
6.5 |
7.3 |
Table 1. Obstacles to participation in ALE in the UK in 2016
Source Adapted from Eurostat (2019b)
According to Table 1, the most frequent obstacles to participation in lifelong learning in 2016 were existing work schedules (59.8 per cent) and cost (45.2 per cent). The lack of flexibility in training opportunities is also a barrier to ALE participation. According to the OECD (2019), training was delivered as distance learning to less than 15 per cent of participants.
Health/age was the obstacle with the highest variation of importance across individual characteristics. For example, it is an obstacle reported frequently by 30.5 per cent of less qualified adults, compared with 6.6 per cent of the highly educated, exemplifying negative attitudes towards participation in education in later life. It is also important to note that about 75% of adults believe that that there is not need for (further) education, illustrating negative attitudes towards participation in education. Raising awareness of the importance of reskilling and upskilling among adults could promote ALE across all individual socioeconomic groups.
3.3. Differences in overall participation rates among individuals within businesses
The AES reports that while 47.5 per cent of adults participated in non-formal learning, only around 11.9 per cent participated solely in formal activities provided by public organisations and recognised private bodies. Participation in adult education and training, according to the AES, is mostly of a non-formal, job-related and employer-sponsored nature, highlighting the role of businesses in adult education. 41.3 per cent of adults participated in job-related education, which is equivalent to about 80 per cent of participation in total ALE activities. 39.8 per cent of adults participated in job-related and employer-sponsored learning.
The training efforts of many employers remain focused on highly skilled employees; this only serves to increase existing inequalities (see Figure 7). The share of non-formal education and training activities that were job-related was significantly higher among the young and adults with tertiary-level qualifications.
In 2016, 49.7 per cent of people aged 25-34 participated in job-related, non-formal learning activities, in the 12 months preceding the survey. This share could be compared with the corresponding value for adults aged 55-64, where 27.2 per cent participated in such activities. At the same time, 54.9 per cent of people aged 25-64 with a tertiary-level qualification participated in job-related, non-formal learning activities, compared with 21.6 per cent of those with a low level of educational attainment.
In addition, inequalities exist between different occupations. While 58.3 per cent of highly skilled occupations - including managers, professionals, technicians and associated professionals - participated in job-related, non-formal education, only around 30 per cent of skilled manual workers and elementary occupations did so.
Figure 7. Participation in job-related education in the UK in 2016, by occupation, educational attainment level and age
This chart displays the percentage participation in job-related education by occupation, educational attainment level, and age group in the UK for 2016. It indicates higher participation rates for highly skilled occupations, individuals with tertiary education, and younger adults.
Source Adapted from Eurostat (2019b)
Figure 8. Skills targeted by CVT courses, and skills considered important by enterprises, in the UK in 2015
This chart compares the percentage of enterprises that consider specific skills important with the percentage of enterprises providing CVT courses for those skills in the UK in 2015. It shows that while some skills like technical/job-specific skills are well-matched by training, others like numeracy/literacy and general IT skills are considered important but less frequently covered by CVT courses.
Source Adapted from Eurostat (2019b)
According to the CVTS, an enterprise survey covering establishments with at least ten employees, employers make poor use of skills assessments (See Figure 8). Although the importance of some skills, including technical, practical or job-specific skills (35.7 per cent), customer handling (32.5 per cent) and teamwork (35.6 per cent), correlates with a significant provision of related training courses, this is not always the case.
Some skills, which are mainly those needed by less skilled workers, such as numeracy and/or literacy skills and general IT skills, are considered important, but only a very small proportion of enterprises with at least ten employees provide continuing vocational training (CVT) courses in these skills. Such mismatches imply that education providers are not offering courses which match the skills needs of employers, and that inclusiveness is not advocated.
Greater collaboration between employers and education providers could assist employers to thoroughly assess their skills needs and develop effective training programmes that address those needs for all individuals.
4. Conclusion
Why should society feel responsible only for the education of children, and not for the education of all adults of every age?
Source Erich Fromm
Advances in technology mean that automation can now enhance a firm's productivity, so its impact on employment cannot be discounted. However, there is still only a limited understanding of the ways in which new technology affects labour markets in the digital age. In 1930, John Maynard Keynes claimed that machines will take over all jobs from humans. Was he right? The answer is obviously yes but only in the following way: he correctly anticipated the impact of machinery on manufacturing employment but missed the fact that services could create as many jobs as are needed to employ the workers displaced from manufacturing (Kapetaniou & Pissarides, 2019). As demand for labour in the service sector increases, shifts in the labour market to knowledge-based and in-person services will be critical to the economy. As a result, demand for skills is changing within and between industries and regions, increasing the importance of lifelong learning.
Our analysis suggests that there are huge disparities in adult learning across the UK. More importantly, however, disparities also exist between different social and economic groups. Our findings suggest that ALE participation is associated with social and economic inequality at the organisational, regional and national levels. Therefore, rather than focusing solely on individuals when discussing the conditions which encourage adult learning, it is more appropriate to discuss them in the context of the national and/or regional adult learning system.
The report also calls for far greater investment in a strong national and regional adult learning system, aligned with the labour market. New jobs are created not only by individual firms, but through the collective endeavour of training providers, policymakers and organisations. This requires diverse and substantive sets of resources and expertise.
Overall, this report presents some challenges to individuals, to the practices of organisations and education providers, and to the policies of individual regions within the UK. To meet the demands of a fast-changing labour market, the government of the United Kingdom, training providers, and industry will need to make a greater effort to devise an effective adult learning system, which helps to tackle inequality.
References
- Accenture (2016). Why Artificial Intelligence Is the Future of Growth. https://www.accenture.com/t000101011000000__w__/au-en/_acnmedia/pdf-7/accenture-technology-trends-technology-vision-2016.pdf
- Boston Consulting Group (2015). The Robotics Revolution. https://circabc.europa.eu/sd/a/b3067f4e-ea5e-4864-9693-0645e5cbc053/BCG_The_Robotics_Revolution_Sep_2015_tcm80-197133.pdf
- Business, Energy and Industrial Strategy Committee (2019). Automation and the Future of Work. https://publications.parliament.uk/pa/cm201719/cmselect/cmbeis/1093/1093.pdf
- Chapman, O. (2019). Skills for all. https://www.nesta.org.uk/blog/skills-all/
- European Commission (2001). Making a European area of lifelong learning a reality. Luxembourg: Publications Office. http://ec.europa.eu/education/policies/lll/life/communication/com_en.pdf
- Eurostat (2019a). Employment and unemployment (database). https://ec.europa.eu/eurostat/web/lfs/data/database
- Eurostat (2019b). Education and training statistics indicator (database). https://ec.europa.eu/eurostat/web/educationand-training/data/database
- ILOSTAT (2019). Free and open access to labour statistics. https://www.ilo.org/ilostat-files/Documents/description_OCU_EN.pdf
- International Federation of Robotics (2017). The Impact of Robots on Productivity, Employment. and Jobs. A positioning paper by the International Federation of Robotics. https://ifr.org/img/office/IFR_The_Impact_of_Robots_on_Employment.pdf
- International Federation of Robotics (2019). Press Release. https://ifr.org/ifr-press-releases/news/brexit-uk-falling-back-in-global-automation-race-robot-sales-down-3
- Kapetaniou, C. & Pissarides, C. (2019). Robots' impact on employment. Unpublished manuscript.
- Kapetaniou, C. (2019). Becoming FutureFit. What we know about adult learning across Europe. London: Nesta, https://www.nesta.org.uk/report/becoming-futurefit/
- Keynes, J. M. (1930). Economic Possibilities for our Grandchildren. In Essays in Persuasion. New York: W.W. Norton & Co., 1963, 358-373.
- OECD (2019). Future-ready Adult Learning Systems - United Kingdom. Paris: OECD. http://www.oecd.org/unitedkingdom/Future-ready-adult-learning-2019-United-Kindgom.pdf
- Office for National Statistics (2018). International comparisons of UK productivity (ICP), final estimates: 2016. https://www.ons.gov.uk/economy/economicoutputandproductivity/productivitymeasures/bulletins/
- Rigney, D. (2010). The Matthew effect: How advantage begets further advantage. New York: Columbia University Press.
- Figure 1. Employment by Industry in the UK, 1992-2018
- Figure 2. Changes in skills in the UK, 1992-2018
- Figure 3. Employment concentration in professional, scientific, technical, administrative and support service activities in the UK, 2018
- Figure 4. Adult participation in ALE in % of adults aged 25-64 in the EU 28, 2018
- Figure 5. Adult participation in ALE in % of adults aged 25-64 within the UK, 2018
- Figure 6. Participation in ALE in % of adults aged 25-64 in the UK in 2016, by occupation, educational attainment level and age
- Figure 7. Participation in job-related education in the UK in 2016, by occupation, educational attainment level and age
- Figure 8. Skills targeted by CVT courses, and skills considered important by enterprises, in the UK in 2015
- Table 1. Obstacles to participation in ALE in the UK in 2016
Our Partners
Nesta is based in the UK and supported by a financial endowment. We work with partners around the globe to bring bold ideas to life to change the world for good. www.nesta.org.uk
If you'd like this publication in an alternative format such as Braille or large print, please contact us at [email protected]
Nesta runs two programmes in the Nordics and Benelux. These are Digital Frontrunners, an active network of over 300 future of work experts, policymakers and practitioners and FutureFit, a major training and research project involving unions, researchers and learning experts. In partnership with unions, FutureFit is focused on upskilling and reskilling workers and doing innovative, robust research about what works. The programmes are supported by Google and Google.org.
Partners in the FutureFit programme include:
- Auto-ja Kuljetusalan Työntekijäliitto (AKT)
- Demos Helsinki
- Finansförbundet
- HK Privat
- Hyper Island
- Ivaekst
- Palvelualojen ammattiliitto (PAM)
- Suomen ammattiliittojen keskusjärjestö (SAK)
- Teollisuusliitto
- Työväen Sivistysliitto (TSL)
- Unionen
- The Think Tank DEA
- The University of Gothenburg
- Vision
58 Victoria Embankment,
London, EC4Y 0DS
+44 (0)20 7438 2500
www.nesta.org.uk
[email protected]
www.facebook.com/nesta.uk
@nesta_uk
Nesta is a registered charity in England and Wales with company number 7706036 and charity number 1144091.
Registered as a charity in Scotland number SCO42833.
Registered office: 58 Victoria Embankment, London, EC4Y 0DS
ISBN: 978-1-84875-163-7
Delivered by Nesta.
Funded by Google.org.




