This report summarises CAR's modelling work for NESTA and WWF-Scotland in January-February 2024 exploring the costs and impacts of much higher installation rates of heat pumps in Scottish homes. It extends work we carried out previously for WWF-Scotland and aims to inform responses to the Scottish Government consultation on the Heat in Buildings Bill. As before, underpinning data comes from CAR's model, ScotCODE.
The report is structured around seven research questions drawn up by NESTA and WWF-Scotland.
RQ1: What proportion of Scottish homes would see bill savings, with and without capital costs?
Taking all Scottish homes together, under current energy prices (7.32p/kWh for gas, and 28.16p/kWh for electricity), just over one third of homes would see lower energy bills if they installed heat pumps and modest energy-efficiency measures (see table below). Typically, the energy-efficiency measures are just draught stripping and/or top-up loft insulation, but for some house types (e.g. solid-wall homes with oil heating), external wall insulation is also justified and cost effective.
|
House |
All |
Houses |
Flats |
| # homes |
|
2,495,000 |
1,620,300 |
874,700 |
|
|
|
|
|
|
# homes with lower bills |
852,000 |
742,500 |
109,500 |
|
% homes with lower bills |
34.1% |
45.8% |
12.5% |
| £/year |
Mean savings |
£460 |
£254 |
£323 |
| £/year |
Mean extra |
£302 |
£195 |
£107 |
|
|
|
|
|
|
# homes with lower TCO |
137,100 |
75,400 |
61,700 |
|
% homes with lower TCO |
5.5% |
4.7% |
7.1% |
| £/year |
Mean savings |
£29 |
£13 |
£25 |
| £/year |
Mean extra |
£2,486 |
£3,737 |
£1,535 |
Taking a simple average (mean) across all homes, the average saving per home – or those making savings – is £38 a month, or about £460 a year.
When up-front capital costs are incorporated, the proportion of Scottish homes witnessing overall bill savings falls dramatically, to just over 5% (when the capital costs are repaid annually over 15 years, with no interest or discounting). For these homes, the cost savings are also fairly marginal: just £2 a month on average, or around £24 a year. Conversely, with today's energy prices and capital costs and no Government support, taking the Total Cost of Ownership (TCO) into account, the other 95% of homes would see higher costs, on average around £210 a month.
RQ2: How do proportions change under different price scenarios?
We modelled the effects of four energy-price scenarios: today's prices (reflecting the current Ofgem 'caps'), and three future prices – showing the impact of different ratios of electricity to gas prices. All electricity prices exclude standing charges, since households will continue to pay standing charges for electricity whether or not they install heat pumps. Many commentators have called for de-coupling electricity prices from gas prices, and for reduced electricity prices, to make heat pumps more attractive. The four price scenarios are shown in the tables below.
'Wide' 2028 Scenario (no policy costs on Electricity)
The 'Wide' 2028 Scenario adjusts electricity prices downwards, in line with Cornwall Insights' expectations of a 29% reduction in wholesale electricity costs in winter by 2028. 51% of household electricity bills are wholesale costs, and prices are reduced to reflect this. There is no change to policy costs.
| Current prices |
p/kWh |
Factor: |
3.85 |
Economy 7 Peak |
Off peak |
| Electricity |
28.16 |
|
|
35.05 |
16.34 |
| Gas |
7.32 |
|
|
|
|
'Medium' 2028 Scenario (no policy costs on Electricity, and lower wholesale electricity costs by 2028)
The 'Medium' 2028 Scenario has the same reduction in wholesale costs, and in addition removes from electricity bills policy costs (charges levied by energy suppliers, e.g. to fund the Energy Company Obligation to fund energy efficiency work among households in fuel poverty, and the Climate Change Levy). These were estimated at 5.2p/kWh for electricity and 0.2p/kWh for gas in 2021.
| 'Wide' 2028 Scenario (no policy costs on Electricity) |
p/kWh |
Factor: |
3.28 |
|
|
| Electricity |
24.00 |
|
|
29.87 |
13.92 |
| Gas |
7.32 |
|
|
|
|
'Narrow' Scenario (no policy costs on Electricity, lower wholesale electricity costs by 2028, PLUS 22% saving)
The 'Narrow' 2028 Scenario again factors in lower wholesale costs, and removes policy costs, and in addition factors in a 22% saving on electricity prices thanks to Contracts for Difference (CfDs) being extended to existing power generators. This could be achieved by reform of the electricity market at no cost to government, and it is consistent with the range of savings to be achieved by extending CfD auctions to old renewable and nuclear generators, see UKERC’s report from 2022. This brings a reduction of £112 a year for typical bills. There is no change to gas prices, so this creates a 2:1 factor of electricity to gas prices per kWh.
| 'Medium' 2028 Scenario (no policy costs on Electricity, and lower wholesale electricity costs by 2028) |
p/kWh |
Factor: |
2.57 |
|
|
| Electricity |
18.80 |
|
|
23.39 |
10.91 |
| Gas |
7.32 |
|
|
|
|
| 'Narrow' Scenario (no policy costs on Electricity, lower wholesale electricity costs by 2028, PLUS 22% saving) |
p/kWh |
Factor: |
2.00 |
|
|
| Electricity |
14.64 |
|
|
18.22 |
8.49 |
| Gas |
7.32 |
|
|
|
|
Unsurprisingly, lower unit prices for electricity mean that more households would benefit from lower energy bills as a result of installing heat pumps (which use electricity in place of gas). The one third of homes that see lower energy bills at today's prices would increase to more than half under the ‘Wide' pricing scenario, to about 85% under ‘Medium' prices, and to about 19 out of 20 households under the 'Narrow' scenario – see table below.
Turning to houses (which are more likely than flats to be regulated to fit individual heat pumps under current Scottish Government proposals), just under half (46%) of these houses would see lower energy bills under today's prices, but this rises to two-thirds (70%) under the Wide scenario, and almost all of them (98%) under the Medium, and Narrow scenarios. (The same proportion of houses witness savings under the last two pricing scenarios.
|
All |
Standard tariffs |
|
|
|
|
Wide |
Medium |
Narrow |
| # homes |
2,495,000 |
|
|
|
|
# homes with lower bills |
1,376,500 |
2,120,700 |
2,382,300 |
|
% homes with lower bills |
55.2% |
85.0% |
95.5% |
| £/year |
Mean savings |
£384 |
£443 |
£566 |
| £/year |
Mean extra |
£170 |
£130 |
£142 |
|
# homes with lower TCO |
136,300 |
22,000 |
110,600 |
|
% homes with lower TCO |
5.5% |
0.9% |
4.4% |
| £/year |
Mean savings |
£8 |
£4 |
£14 |
| £/year |
Mean extra |
£2,066 |
£1,567 |
£1,185 |
More surprisingly, while the TCO – including capital costs – improves for all homes, the proportion achieving a net benefit (i.e. better than counterfactual) is virtually un-changed by moving from current energy prices to the lower-price scenarios. Although larger, energy bill savings under the future scenarios are still not enough to repay pay off the capital costs. This could be mitigated by a number of factors beyond this analysis (e.g. falling installation costs, or continued Government grants).
Still just over 5% of homes see savings in total costs. (This is partly because baseline costs would also fall because of lower electricity costs – both households that currently have electric heating, and also baseline, un-improved homes would also experience savings because of electricity use for lights and appliances. Lights and appliances costs are included to give a full picture of energy bills. See also ‘Why is there a dip', below.)
It is also surprising that modelling indicates even fewer households would see lower total costs if electricity costs fell to 18.8p/kWh: less than 1%, and the average savings they would see would be marginal.
In the final Narrow scenario with electricity prices of 14.6p/kWh, just over 4% of households see savings in total costs – still less than under the Wide scenario with a higher electricity price.
Why is there a dip in the number of homes with TCO savings in the Medium scenario?
The number of homes where the low carbon solution gives savings in annual energy bills increases as the gap narrows between the gas and electricity price. For example, the percentage of homes with lower bills increases from 34% in the current pricing scenario, to 95% with the narrow scenario. However, this is not so for TCO, because other factors are also at play.
When capital costs are also taken into account, it is the 250,000 electrically heated homes that largely make savings under the 'wide' price scenario. However, this stops being the case under 'medium' and 'narrow' prices (see explanation and chart below). Other homes make savings under the 'narrow' scenario, pushing the overall percentage making a TCO saving back up.
However, for homes that use electricity (storage heaters) in the baseline, the lower electricity prices benefit the baseline case more than the low carbon case, because all of their costs decrease, whereas for the low carbon solutions the capital costs are unaffected. (Note that this would change if capital costs fall or if an upfront grant were available – which is likely in Scotland in the future. In reality storage heaters are cost effective in the lower price scenarios only when there are no grants to meet capital costs.) For some homes there are TCO savings for the Wide scenario but not for the Narrow (as shown in the chart below). Also the low carbon solutions need less electricity because of efficiency savings, but the price per unit is higher because with a heat pump solution there is no longer a benefit from an Economy-7 tariff.
Chalet bungalow with cavity walls, no constraints, electric heating in the baseline (storage heaters)
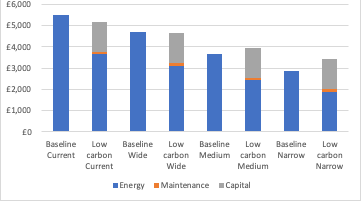
Note: energy costs here are total energy costs, including the cost of lights and appliances.
RQ3: What proportion of homes can capitalise on TOU tariffs, and how much do they save?
CAR's modelling also explored the benefits of using a Time-of-Use (TOU) tariff. For modelling purposes, Octopus's Cosy tariff was used, which is 40% cheaper in off-peak periods (4-7am and 1-4pm) and 60% more expensive from 4-7pm. Modelling assumed homes with TOU are pre-heated 2°C warmer in off-peak periods (including overnight from 4-7am), and allowed to cool 2°C below normal temperature from 4-7pm. This was not applied from May to September, when heating costs are lower. For homes with storage heating, the daily schedule was unchanged - except the storage heaters and the hot water cylinder were charged during the Cosy off-peak periods instead of the E7 overnight period.
The modelling indicated that most homes saw some benefit from TOU tariffs under all price scenarios, but that the energy-bill savings were modest: up to 13%. A good deal of benefit is obtained from the afternoon preheat, because as well as the benefit of cheap electricity there is an additional saving due to the heat pump being more efficient - outside temperatures are higher during the preheat (1-4pm) than during the peak period (4-7pm).
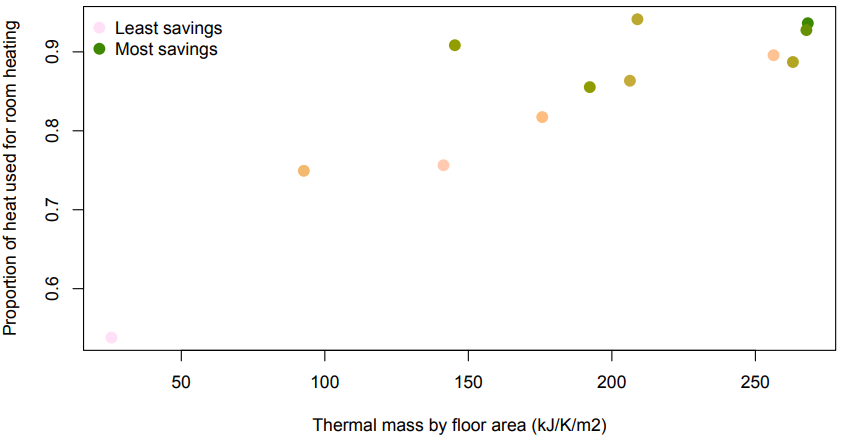
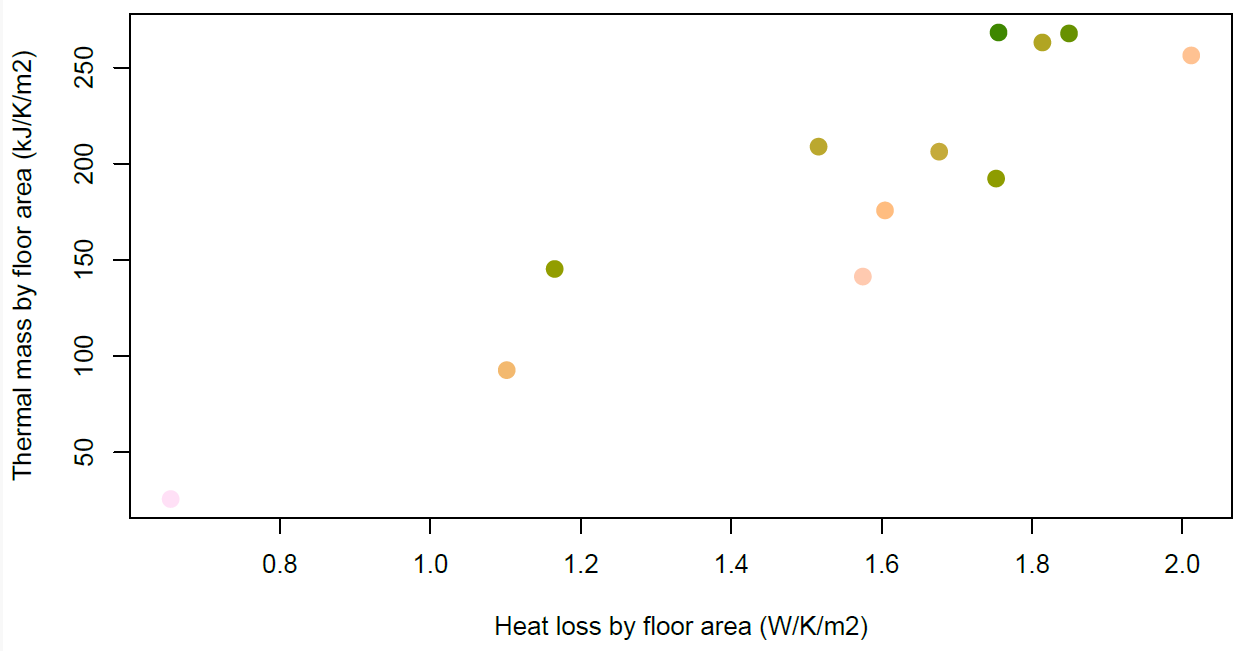
The overall outcome for each home depends on a range of factors, which are themselves correlated, so the effects are hard to disentangle. The benefit of the preheat is greatest for homes that can store a lot of heat - high thermal mass and low heat loss (see charts below). However, the effect on total bill is higher for homes where space heating demand is high and hot water demand is relatively low. The smallest savings are for the modern tenement flat, because it has a low space heating demand compared to hot water, as well as low thermal mass. Conversely, the highest savings are for the chalet bungalow with insulated solid walls, because this has high thermal mass, and low hot water demand; heat loss is medium.
Annual savings from the Cosy tariff and preheating: larger savings for proportionately more space heating and higher thermal mass
Annual savings from the Cosy tariff and preheating: again, larger savings for higher thermal mass, and also for higher heat loss
The vast majority of homes (96%) would see some benefit from a TOU tariff when they have low-carbon heating, but inevitably there is a wide range between homes in how much they save - see chart below. On average (simple mean) the bill saving would be £150 a year, or about 7% of the average baseline bill.
How the 12 archetypes are affected by TOU tariffs under different pricing scenarios
Standard tariffs and TOU tariffs
Revenue increased by 25% over the previous quarter.
Note that the number of homes benefitting from TOU does not change between energy-price scenarios – we compare here between homes that already have the Wide/Medium/Narrow energy prices.
RQ4: Do proportions change if Time-of-Use Tariffs are included?
As for the overall impact on Scottish homes of TOU tariffs linked to heat pumps on bills and TCO, the table below shows that more homes show bill savings, and they save more money each month than improved homes running on standard electricity tariffs. In summary, roughly 20% more homes see savings on TOU tariffs under the Wide scenario, about 7% more under the Medium scenario, and just over 2% more under the narrow scenario. (As before, in RQ2, more homes see lower bills without the TOU tariffs when they have decarbonised heating simply because the electricity price is lower.) For the last, although the effect on the number of homes is limited, the TOU tariff makes a more marked difference to the extent of average savings (£54 a month, compared to £47 a month under standard tariffs).
|
Home type |
|
Standard tariffs |
|
|
|
All |
|
Wide |
Medium |
Narrow |
| # homes |
|
2,495,000 |
|
|
|
|
|
|
TOU tariffs and preheat/cool-off |
|
|
|
|
|
|
|
|
|
# homes with lower bills |
1,936,400 |
2,286,200 |
2,440,900 |
|
|
% homes with lower bills |
77.6% |
91.6% |
97.8% |
|
| £/month |
Mean savings |
£35 |
£44 |
£54 |
|
| £/month |
Mean extra |
£17 |
£17 |
£22 |
|
|
|
|
|
|
|
|
# homes with lower TCO |
147,000 |
94,500 |
278,400 |
|
|
% homes with lower TCO |
5.9% |
3.8% |
11.2% |
|
| £/month |
Mean savings |
£1 |
£1 |
£2 |
|
| £/month |
Mean extra |
£146 |
£110 |
£83 |
|
TOU tariffs make only a small difference to the number of homes with lower TCOs under the Wide scenario, but this increases for the Medium scenario (more than four times as many), and under the Narrow scenario (two-and-a-half times as many). It also increases mean savings per home, although only a little.
As in the previous section, we assume here that homes using TOU tariffs are pre-heated 2°C in low-cost periods, and the temperature is allowed to fall 2°C during the peak period.
RQ5: What exclusions to the Heat in Buildings Bill would we suggest? Should there be a cost cap?
Based on CAR's modelling and 2022 energy and capital costs, insulating under the floor of homes with suspended timber floors was never cost effective (unless there is easy access to the underfloor void) – it did not repay the capital cost over 15 years. This is unlikely to have changed since, so even though insulating suspended timber floors is desirable for comfort reasons (in particular, in reducing cold draughts from the floor void), it seems unreasonable to insist on this in legislation. There may be an exception for dwellings where there is easy access to the floor void, which potentially makes floor insulation much simpler and more economical.
Considering house types that might qualify for exclusion from Heat in Buildings regulations, we note that almost all the house types we modelled witnessed savings in energy bills with all three of the Narrow, Medium and Wide tariffs scenarios for 2028 if they start out with electric heating. (Only the Modern tenement fails to achieve savings, and this sees no change to energy costs, partly because no energy-efficiency upgrades are justified.)
For homes that started out with non-condensing oil boilers, 10 out of 12 house types saw savings under the Wide pricing scenario (all but Types 10 and 12: the Modern tenement flat with timber frame, and the Top floor 4-in-a-block). (Again, for the Top-floor 4-in-a-block, not energy-efficiency upgrades were viable.)
Under the Medium pricing scenario, only Type 10 (the Modern tenement again) failed to achieve energy-bill savings. Meanwhile, under the Narrow scenario all house types achieved energy-bill savings.
Similarly, among homes starting out with non-condensing gas boilers, the same split of all-bar house Types 10 and 12 witnessing savings under the Wide pricing scenario, falling to all-but Type 10 under the Medium scenario, and all homes achieved savings under the Narrow scenario.
For homes starting with gas heating and the more common condensing boilers, five house types see savings under the Wide tariff scenario (Types 1, 2, 6, 7 and 8): the two detached homes, and the three bungalows. The Modern tenement flat and the Top-floor 4-in-a-block (Types 10 and 12) saw energy bills rise more than £200 a year. There are fewer losers when electricity costs are lower, and under the Medium scenario just Types 10 and 12 face higher energy bills.
Under the Narrow scenario none of the house types have higher energy bills. Arguably, then, there is a financial case for excluding Modern tenement flats and Top-floor 4-in-a-block flats from Heat in Buildings, or perhaps allowing them more time (or offering more government support) for them to upgrade – in particular because the Wide or Medium price scenarios are more likely changes by 2028 than the Narrow scenario. In practice this mirrors Scottish Government plans to regulate cleaner heating in areas suitable for heat networks to a different timetable, driven by the development of heat networks in these areas (e.g. through council-led heat network zoning).
There is no definitive evidence in this modelling for a cost cap. Naturally, any restriction on capital costs would reduce the number of homes that decarbonises heating. There are clear links between the homes incurring high capital costs, and those achieving the largest carbon (and running-cost) savings. This modelling suggests that at 2024 capital costs, the vast majority of homes in Scotland could undertake necessary energy-efficiency improvements and install a heat pump for less than £45,000. This figure could be used as a cap - for dwellings that are exceptionally difficult/expensive to upgrade.
RQ6: What about homes that were ‘below baseline' insulation before any upgrades? Would they show more cost-effective upgrade potential?
To make modelling feasible in this research, we assumed that all Scottish homes with cavity walls were already insulated, and all homes already had 100mm of loft insulation. We also assumed that all homes already had double glazing. In reality around 25% of Scottish homes lack one or other of these measures. In all cases it would be worthwhile upgrading insulation in accessible lofts, and in most cases it would also be worthwhile upgrading uninsulated cavity walls, before undertaking other measures and installing a heat pump – see table below. For double glazing the benefits are more marginal, because of the relatively high cost of installing double glazing (in most cases it would not be viable for purely cost reasons – with or without heat pumps – but it would still be desirable for comfort reasons).
| Savings from ‘Below-Baseline' Dwellings |
Annual energy savings (range, kWh) |
Annual cost savings (range) |
| Cavity-wall insulation |
1800-3700kWh |
£160-450 |
| Loft insulation* |
280-2300 kWh |
£80-300 |
| Double glazing |
380-1600 kWh |
£30-180 |
*Loft insulation shows savings increasing from 50mm of insulation to 100mm.
This means for the roughly 25% of Scottish homes that have less than our baseline insulation, Total Cost of Ownership of a heat pump would be reduced if they first insulated unfilled cavities and/or lofts with less than 100mm of insulation.
RQ7: What about savings from going beyond the cost-effective upgrades for Semi-Ds and the Mid-terrace house?
In prior modelling work for WWF-Scotland, we found that the Inter-war semi-detached house, the Modern semi-D, and the Mid-terrace house all struggle more than most to achieve bills savings. This is due to a combination of reasons: they are smaller and more efficient than average, reducing the benefits of energy efficiency; and they have a higher ratio of hot water to space heating demand (which is not affected by fabric upgrades). Consequently, in the current work, we explored the possibility of additional measures that could guarantee them lower energy bills. We sought to explore whether reduced electricity-prices would make any difference.
We modelled possible additional measures (applied alongside the cost-effective measures, and with heat pumps installed). We also modelled all three house types under current energy costs, and the three energy-price scenarios. This showed that higher up-front capital costs more than offset lower energy bills on almost all cases (see chart below for the Modern Semi-D with current energy prices), and this is made worse by lower energy prices.
Savings from extra measures – for Modern Semi-D with current energy prices
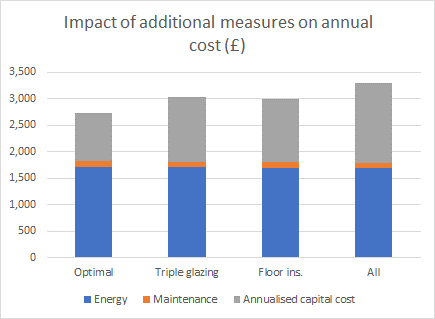
Energy bills savings are also lower than you might expect because part of the electricity bill is not related to heating (electricity for lights and appliances). External wall insulation for the Mid terrace does not make a large difference because it already has insulated cavity walls.
Extra loft insulation for the Inter-war semi-D does now make small savings under the Current and Medium-price scenarios. This is because energy prices are higher now than when we calculated optimised measures in 2022.
Turning to the effect of going beyond the cost-effective upgrades for these three house types under the 2028 pricing scenarios, the saving on annual energy bills compared to the cost-effective upgrade packages is shown in the table below. (Different upgrades achieve savings in energy costs depending on the house type.) Unsurprisingly, in all cases the savings are greatest under the Wide scenario, when electricity costs are highest. The largest savings are for the Mid-terrace house with external wall insulation, and the Inter-war semi-D with extra roof insulation and larger radiators. However, none of the measures repay their capital costs, and the gap between capital costs and savings gets larger with lower electricity prices, see table.
Savings from going beyond Cost Effective Upgrades, under three Price Scenarios
|
|
Saving in energy cost compared to cost-effective upgrades (£/year) |
|
|
|
|
Wide Scenario |
Medium Scenario |
Narrow Scenario |
| Inter-War Semi-D |
Top-up roof insulation |
40 |
31 |
25 |
|
Radiators 50% larger |
94 |
73 |
57 |
|
All |
126 |
99 |
77 |
| Modern Semi-D |
Triple glazing |
3 |
2 |
2 |
|
Floor insulation |
17 |
14 |
11 |
|
All |
22 |
17 |
13 |
| Mid-Terrace House |
External wall insulation |
147 |
115 |
90 |
Modelling Notes
The figures reported here include all 12 house types modelled in CAR's original analysis, with three different baseline heating systems (gas, oil, electric), with and without the constraints we modelled previously that restrict upgrades for certain types of home: heritage homes, space-constrained homes, and homes located on the coast. The 12 house types, their ages of construction, floor areas and the number of homes they represent is shown in the table below.
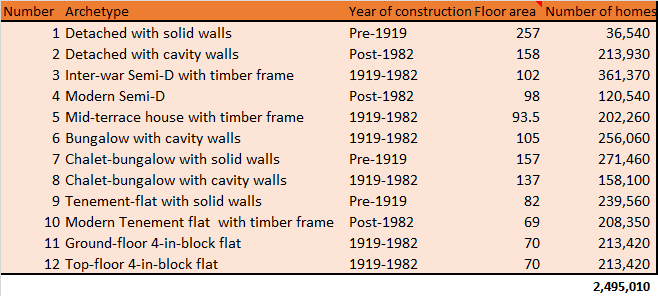
All energy efficiency measures and heat pumps were optimised using 2022 energy prices and capital costs.
ONS figures show the Consumer Prices Index including housing cost rose 7.9% in 2022 and 6.8% in 2023. This equates to a 15.2% increase in inflation from 2022, when we carried out the original modelling work for WWF-Scotland, to January 2024, when we updated costs. This is the uplift we applied to costs for this work.
Oil prices used in modelling were the 12-month average costs for Southern Scotland from Boiler Juice: 7.6p/kWh.
The SCHS indicates (and we modelled):
- For gas boilers, 75% are condensing
- For oil boilers, 37% are condensing.