We are Nesta: The UK's innovation agency for social good.
We design, test and scale solutions to society's biggest problems. Nesta's three missions are to give every child a fair start, help people live healthy lives and create a sustainable future where the economy works for both people and the planet. For over 20 years, Nesta has worked to support, encourage and inspire innovation. We work in three roles: as an innovation partner working with frontline organisations to design and test new solutions, as a venture builder supporting new and early-stage businesses and as a system shaper creating the conditions for innovation. Harnessing the rigour of science and the creativity of design, Nesta works relentlessly to change millions of lives for the better. Find out more at nesta.org.uk.
Executive summary
Nesta commissioned Frontier Economics to explore the impact of obesity and overweight on productivity in the UK. We estimate that the annual productivity costs in 2025 are £30.8 billion.
£30.8 billion
Productivity costs of obesity and overweight in the UK in 2025
While not the primary focus of this work, we also provide new estimates of the total economic and societal costs of obesity and overweight. Building on previous reports from Frontier Economics, we estimate the costs to healthcare, social care, individuals and family/carers associated with obesity and overweight. Taking these elements into account, the total costs of obesity and overweight in the UK in 2025 are estimated to be £126 billion.
| Cost area |
Description |
Obesity |
Overweight |
Total cost |
| Presenteeism |
Lower productivity for those in-work |
£9.7 bn |
£0 bn |
£9.7 bn |
| Inactivity |
Increased rate of unemployment or non-participation in the labour force |
£8.5 bn |
£3.6 bn |
£12.1 bn |
| Absenteeism |
Higher number of sick days |
£4.9 bn |
£3.4 bn |
£8.3 bn |
| Mortality |
Lost economic output due to early mortality |
£0.7 bn |
£0 bn |
£0.7 bn |
| Productivity costs |
|
£23.8 bn |
£6.9 bn |
£31 bn |
| NHS costs |
Financial cost of treating related illnesses |
£9.3 bn |
£3.3 bn |
£12.6 bn |
| Social care |
Financial cost of formal social care |
£1.0 bn |
£0.1 bn |
£1.2 bn |
| QALY losses |
Non-financial cost of reduced quality of life and mortality |
£63.2 bn |
£8.2 bn |
£71.4 bn |
| Informal care |
Non-financial opportunity cost of informal care |
£9.3 bn |
£1.3 bn |
£10.5 bn |
| Total cost |
|
£107 bn |
£19.8 bn |
£126 bn |
Source: Frontier Economics
Comparison with previous estimates
Previous studies which have considered the costs of obesity and overweight, including contributions from Frontier Economics, have provided varying estimates of these costs. Different studies have included different categories of costs, used slightly different methodologies or assumptions, and relied on different data sources, including newer data as it has become available. The table below compares the combined obesity and overweight estimates in this report with estimates from Frontier Economics' work for the Tony Blair Institute (TBI) in 2023. The TBI analysis estimated a total cost of £97.9 billion in costs, of which £83 billion were wider costs and £15 billion were productivity related. In contrast, we estimate wider costs of £96 billion and productivity costs of £31 billion.
The change in productivity costs is largely driven by the inclusion of a wider range of the drivers of productivity compared to the previous estimate, including presenteeism and early mortality, and have focused on a larger age group for people out of work due to obesity (those aged 40-64) than the previous estimate (50-64). We have also used the most recent figures for obesity and overweight and incorporated NICE guidelines on how to measure these conditions in people from minoritised ethnic groups. In addition, we split the calculations by obesity class where possible. Class I/II obesity is defined by a body mass index (BMI) ranging from 30.0 to 39.9, whereas Class III obesity refers to a BMI of 40.0 or above.
| Cost area |
This report |
TBI (2023) |
Key differences in this report |
| Inactivity |
£12.1 bn |
£8.8 bn |
Alternative estimate of costs due to obesity. TBI approach taken for overweight. |
| Absenteeism |
£8.3 bn |
£6.3 bn |
See next column. TBI approach taken for overweight. |
| Presenteeism |
£9.7 bn |
- |
Not considered in TBI (2023). |
| Mortality |
£0.7 bn |
- |
More conservative estimate focused on diagnosed, rather than estimated, prevalence of related illnesses. Improved estimates of overweight costs informed by real-world differences in health expenditure by weight status. TBI (2023) only estimated for individuals over 65. |
| NHS costs* |
£12.6 bn |
£19.2 bn |
All estimates in this report based on: - 2025 estimates of obesity/overweight prevalence - updated NICE definition of obesity and overweight using lower BMI thresholds for people from Black, Asian, and other minoritised ethnic groups - separate calculations for Class I/II obesity and Class III obesity where possible - 2025 prices |
| Social care |
£1.2 bn |
£0.5 bn |
TBI (2023) only estimated for individuals over 65. |
| QALY losses |
£71.5 bn |
£56.6 bn |
See next column |
| Informal care |
£10.5 bn |
£6.5 bn |
TBI (2023) only estimated for individuals over 65 We value the opportunity cost of time at DfT's suggested value of leisure time. |
| Total cost |
£126 bn |
£97.9 bn |
|
Source: Frontier Economics
Note:
* While the majority of health expenditure falls within the NHS, a portion is to be incurred by other healthcare providers, such as private hospitals and clinics.
Overall, this report has sought to improve the robustness of estimates for productivity and wider costs of excess weight. However, it should be noted that providing robust estimates of these impacts is challenging. Understanding causality – identifying the impacts due specifically to obesity and overweight, accounting for other individual characteristics and external factors – is a particular challenge. In addition, the quality of prevalence data is low outside England, and forecasts for future prevalence are highly uncertain.
Variation in productivity costs due to obesity across subpopulations
The productivity costs due to obesity vary significantly across the UK population. Our analysis suggests that costs vary:
- by BMI: individuals with a BMI above 40 account for 13% of the population with obesity but account for 36% of the total productivity costs;
- by nation: Scotland has the highest productivity costs per 1,000 inhabitants (£0.45 million per 1,000 inhabitants) and Northern Ireland the lowest (£0.34 million per 1,000 inhabitants);
- by deprivation: productivity costs among the most deprived 20% of the population (£0.44 million) are around 22% higher than the costs among the least deprived 20% of the population (£0.36 million); and
- by ethnicity: people with Black ethnicity have the highest productivity costs per 1,000 inhabitants (£0.67 million), which is over 76% higher than the costs for people with Mixed ethnicity (£0.38 million).
Future productivity costs
We estimate future costs using predictions of obesity prevalence until 2035 and population projections. We estimate that future productivity costs of obesity could be as high as £26.6 billion in 2030 and £29.1 billion in 2035. For overweight, future costs are driven by population growth only, as projected prevalence of overweight exhibits a slight decline over the next 10 years. We estimate that productivity costs of overweight are £7 billion in 2030 and £7.1 billion in 2035.
Together, the total productivity costs of obesity and overweight are estimated to be £33.7 billion in 2030 and £36.3 billion in 2035.
Potential avoided productivity costs if rates of obesity prevalence were lower
Previous analysis by Nesta shows that the impacts policies and interventions aimed at reducing excess weight have higher impact on reducing obesity prevalence compared to overweight prevalence. This is because many individuals currently living with obesity would move into the overweight BMI category rather than reaching a healthy weight, displacing those who would move from the overweight category into the healthy weight range. Nesta estimate that interventions that lead a given percentage reduction in obesity prevalence tend to lead to a one-tenth of the reduction in overweight prevalence.
We have modelled various scenarios assumed reductions in prevalence of obesity and overweight. We estimate a reduction in obesity prevalence of 1% (i.e. from 32.6% to 32.3%), combined with a corresponding reduction in overweight prevalence of 0.1%, would result in avoided productivity costs of £245 million (of which £238 is due to the reduction in obesity). Similarly, if obesity prevalence was to halve (to 16.3%) and overweight prevalence reduces by 5% (from 34.8% to 33.1%) the avoided productivity costs would amount to £12.3 billion.
We have also estimated the potential cumulative costs savings for the next ten years. These estimates compare the forecasted obesity and overweight rates against a counterfactual where obesity prevalence declines by 5% year-on-year from 2025, reaching 19.5% by 2035 for obesity, but overweight prevalence reduces by 0.5% per year, reaching 33.1% in 2035. We estimate that the 10-year cost savings would amount to a cumulative total of £81.7 billion for obesity and £1.1 billion for overweight, totalling £82.8 billion over the next 10 years.
Conclusions
This report provides up-to-date evidence on the costs of obesity and overweight in the UK in 2025. It shows how these costs vary across the population and explores the potential avoided costs if the prevalence of obesity and overweight can be reduced. Realising the 'prize' of these avoided costs depends upon effective policy interventions.
1. Introduction
Obesity rates are increasing in the UK. It is estimated that the prevalence of obesity has approximately doubled since 1993, when it was 15%. Obesity is associated with negative consequences, including;
- Productivity impacts due to higher rates of unemployment or economic inactivity, lower productivity for those in-work (“presenteeism”), higher number of sick days ("absenteeism") and lost economic output due to early mortality, creating economic costs for employees, employers and the wider economy.
- Physical and mental health deterioration, especially in the development of chronic diseases, mobility issues, and depression, leading to reduced life expectancy and quality of life.
- Healthcare costs, including higher medical expenditures by hospitals, governments, and insurance providers.
- Social care costs, including the opportunity cost of additional hours of care provided to individuals with excess weight.
- Social impacts ranging from stigma, discrimination, and exacerbating inequalities.
Nesta's Healthy Life Mission is to increase the average number of healthy years lived in the UK, while narrowing health inequalities. Nesta's goal is to halve the number of people with obesity in the UK by 2030.
This report, commissioned by Nesta, explores the impact of adult obesity and overweight in the UK on productivity and the economy.
- The annual productivity costs of excess weight to the UK;
- The variation in these costs across England, Wales, Scotland and Northern Ireland;
- The variation in these costs across ethnicities, deprivation and BMI thresholds;
- Consideration of costs over the next 10 years;
- The potential avoided costs if prevalence of obesity and overweight were lower.
For the purposes of this report, in line with NICE, obesity is defined as having a Body Mass Index (BMI) of 30 or higher, or 27.5 or higher for individuals of Asian, Middle Eastern, Black African or African-Caribbean family background. Overweight is defined as having a BMI of between 25 and 30, or 23 and 27.5 for individuals of Asian, Middle Eastern, Black African or African-Caribbean family background. This report analyses costs in adults aged 18 and over.
2. Impact framework
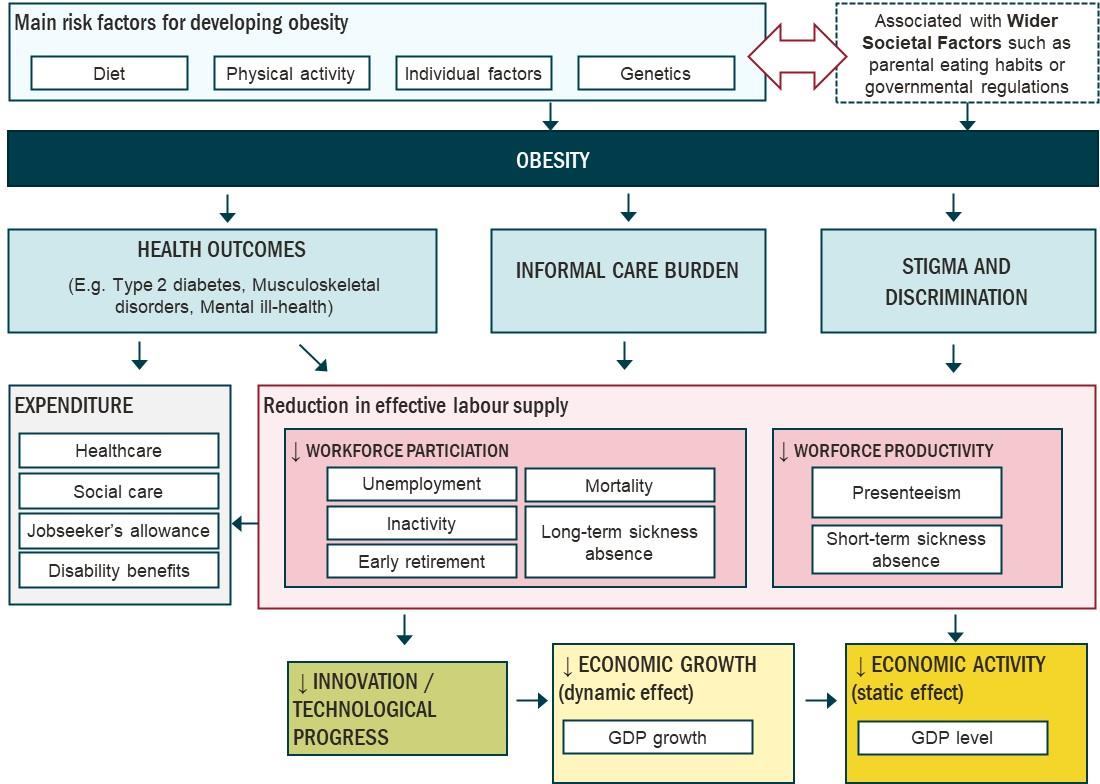
Our approach to exploring the productivity impact of excess weight in the UK was underpinned by an impact framework. Based upon reviewing academic, clinical and grey literature relating to obesity and in discussion with Nesta, we developed the impact framework shown in Figure 1.
Source: Frontier Economics
The framework starts by setting out risk factors to obesity. These include non-modifiable risk factors, such as genetics, as well as elements that individuals and policymakers could directly or indirectly influence, including diet and physical activity. The framework also includes wider societal factors such as the food environment or regulations on high fat, salt and sugar foods that are related with these risk factors and therefore have implications on the prevalence of obesity.
There are various channels through which obesity could lead to a reduction in the economy's effective labour supply. These include poorer health outcomes amongst people with obesity (e.g., obesity is a known risk factor for type 2 diabetes ), the informal care burden placed on family members or carers (which may reduce their available working hours), and the impact of stigma and discrimination from employers or colleagues. Together, these factors can contribute to a decline in overall labour force participation and in-work productivity, which have a direct negative impact on the UK's economic activity (static effect). We have modelled these costs in this report.
There may furthermore be economic growth impacts (dynamic effect). A deterioration in the population's general health driven by obesity translates, in economic terms, to a reduction in the effective labour supply available in the economy, which can in turn lead to a reduction in economic growth . We have not included costs associated with dynamic effects in this report.
This report attempts to estimate costs which are due to obesity. These are the additional or incremental costs, which are experienced by individuals with obesity relative to otherwise similar individuals with healthy-weight. For example, we consider the cost of sickness absence which is associated with obesity and not all sickness absence incurred by individuals with obesity.
We note that knock-on impacts for welfare payments (e.g. unemployment benefits, or disability-related benefits) were not directly costed in our study: following UK Government best practice, these are considered 'transfers' (from Government to individuals) and are not considered as societal costs. Nonetheless, these are likely to be significant – LCP estimates that the total annual benefit cost arising from people of obesity receiving enhanced benefits for sickness could be over £10 billion per year.
While the primary focus of this work is the productivity costs of obesity, we also consider the productivity costs of overweight and the wider societal costs of obesity and overweight. The following sections describe in more detail the costs which are explored in this report. Specific assumptions, calculations and evidence sources are provided in Annex A.
3. Productivity costs of obesity and overweight
We have estimated the productivity impacts associated with obesity at multiple levels: increased sickness absences; lower employment rates due to increased unemployment and inactivity rates (including early retirement); lower in-work productivity; and reduction in the workforce due to mortality. While not the primary focus of this report, we have also considered the productivity costs associated with overweight.
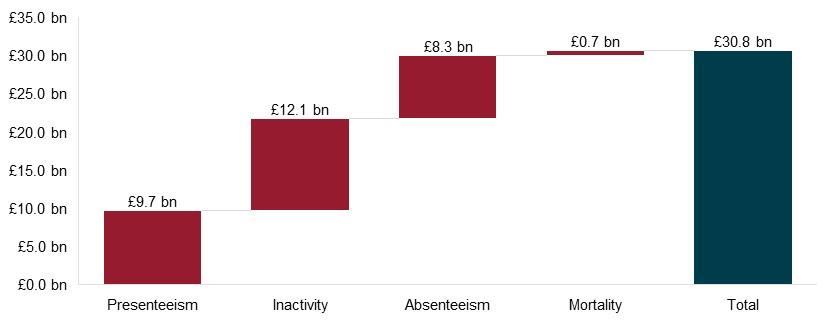
Figure 2 and Table 3 below shows how the £30.8 billion productivity cost of excess weight is split across the four dimensions we analysed. Inactivity leads to the highest cost at £12.1 billion (or around 39% of productivity costs), while mortality is estimated to cost around £700 million. When considering obesity only, presenteeism is the highest cost element at £9.7 billion.
Source: Frontier Economics
| Cost area |
Cost of obesity |
Cost of overweight |
Total cost |
| Presenteeism |
£9.7 bn |
NA |
£9.7 bn |
| Inactivity |
£8.5 bn |
£3.6 bn |
£12.1 bn |
| Absenteeism |
£4.9 bn |
£3.4 bn |
£8.3 bn |
| Mortality |
£0.7 bn |
NA |
£0.7 bn |
| Total |
£23.8 bn |
£6.9 bn |
£30.8 bn |
3.1 Costs due to lower in-work productivity
Obesity can lead to productivity costs when individuals are unable to perform at their full capacity due to their health condition. This reduction in productivity could potentially arise through various channels either directly associated with obesity or through related comorbidities. We analyse the extent to which workers with obesity are more prone to presenteeism relative to healthy-weight individuals.
Research suggests that sickness more broadly can manifest itself as presenteeism through a number of channels.
- Quantity of work: employees with health conditions may work more slowly or have to repeat tasks more frequently. For example, workers with obesity may experience arthritis or other musculoskeletal disorders which limit efficiency in manual labour roles.
- Quality of work: health conditions may affect concentration or create persistent distractions, reducing the quality of outputs. For example, workers with obesity that suffer from sleep apnoea will have lower sleep quality and have relatively more difficulty in maintaining concentration.
- Energy levels: workers suffering with depression may be more likely to suffer from fatigue and inhibit productivity more generally.
We draw on findings from Finkelstein et al (2010), who analysed presenteeism losses using the 2008 National Health and Wellness Survey of around 24,000 workers in the US. Respondents were asked “during the past 7 days, how much did your health problems affect your productivity while you were working?”. Scores are provided on a scale of 0 to 10, with 0 indicating "health problems had no effect on my work” and 10 indicating “health problems completely prevented me from working”. The authors then translated the score to a direct percentage productivity loss, i.e. a score of 3 would imply a 30% productivity loss.
The Finkelstein paper has numerous advantages. It has a strong sample size and follows a commonly-used empirical strategy to identify causation. Further, the outcome variable (productivity) is continuous, whereas other papers use binary outcome variables (i.e. “did health affect your ability to do work?”). Finally, they split their results into three obesity classes which are directly applicable to our analysis. Further details are discussed in Annex A.4.
While self-reported assessments are far from ideal measures of productivity, reliance on such an approach is common practice in this literature. Such surveys are prone to recall and recency bias, making it difficult to quantify productivity losses with precision. It is possible that there may also be an element of self-selection, whereby workers with obesity are disproportionately less represented in roles where their mobility or associated health problems are likely to have a higher impact on their productivity. Industry or occupation controls may not capture this effect fully. As such, presenteeism estimates should be treated with a degree of caution.
Presenteeism costs for obesity
We find that workers with Class I/II obesity and Class III obesity experience in-work productivity losses of 2.1% and 8.9% relative to healthy-weight individuals. This translates into an average cost per worker with obesity aged 18-64 of £992. Spreading this cost across the entire population with obesity aged 18+ results in an average cost per individual with Class I/II obesity of £369, and £1,692 per individual with Class III obesity.
We consider costs associated with presenteeism for the subset of individuals with obesity that are in employment. For this, we use the employment rate amongst individuals with obesity (as calculated in the previous section), and value each job at the median wage.
| Cost |
Class I/II |
Class III |
Total obesity |
| Lost presenteeism % |
2.1% |
8.9% |
3.1% |
| Cost in days |
5.3 |
22.3 |
7.8 |
| Cost per person |
£369 |
£1,692 |
£538 |
| Total cost |
£5.8 bn |
£3.9 bn |
£9.7 bn |
Source: Frontier Economics
Note: Based on a working year of 250 days
Total presenteeism costs amount to £9.7 billion per year in the UK, of which £3.9 billion is accounted for by employees with Class III obesity. The presenteeism costs are disproportionately driven by workers with Class III obesity, who account for over 40% of the total productivity losses, despite only constituting 13% of the workforce with obesity.
As shown previously in Figure 2, presenteeism is the highest cost component of obesity that we have explored. This is in line with findings from other research estimating the productivity costs of various health conditions. For instance, the presenteeism costs due to poor mental health are over three times higher than absenteeism. The presenteeism cost of obesity and associated chronic diseases constituted nearly half of the estimated $863 lost per person per year in the OECD.
Presenteeism costs for overweight
While not the primary focus of this report, we have also considered the presenteeism costs associated with overweight. The evidence used in our analysis of presenteeism costs due to obesity, Finkelstein et al (2010), also provides results for individuals who are overweight. This evidence does not find any productivity loss relative to healthy-weight individuals among workers who are overweight. As such, we do not include presenteeism costs for people with overweight. Beyond Finkelstein, presenteeism analysis throughout the literature tends to be focused on obesity rather than overweight, making a judgement on a reliable result for overweight more difficult. Where results do capture overweight, results are mixed regarding the impact on overweight on productivity.
3.2 Costs due to reduced employment rates
Obesity can lead to productivity costs to the extent it leads to a reduction in employment rates, either through higher unemployment or through decreased labour market participation (including early retirement). This section sets out the approach employed to estimate the reduction in employment rates amongst individuals due to obesity.
The relationship between obesity and employment outcomes has been widely examined in both academic and clinical literature. A consistent finding is that obesity is negatively associated with employment - individuals with obesity are less likely to be employed compared to those of healthy-weight. However, establishing a causal link remains challenging due to several empirical issues. These include omitted variable bias, where factors that are not always observable to the researcher, such as socioeconomic background may influence both obesity and employment, and simultaneity, since unemployment may contribute to obesity just as obesity may reduce employment prospects.
Several papers have attempted to estimate this effect. For example:
- Morris (2007) explores a sample of over 17,000 working-aged adults from the Health Survey for England. The author uses an instrumental variable approach, where obesity is instrumented by obesity prevalence in the individual's local area and finds that employment probability is 21 percentage points lower in females and 8.4 percentage points lower in males with obesity relative to healthy-weight individuals.
- Tunceli et al's (2006) longitudinal study attempts to address simultaneity by analysing the effect of past weight on future employment status. Examining a sample of around 4,200 US workers of two waves of the Panel Study of Income Dynamics, the authors find that men and women living with obesity during years 1986 to 1999 were 4.8 and 5.8 percentage points less likely to be employed relative to healthy-weight individuals in year 1999, respectively.
- Le Strat et al. (2020) analyse a large cross-sectional sample of over 35,000 workers using multivariate logistic regressions, controlling for factors such as socio-economics, physical and psychiatric disorders. The authors find an odds ratio of non-employment for individuals with obesity relative to health-weight individuals of 1.32, when socio-demographics were controlled for, and of 1.16 when physical and psychiatric disorders were additionally controlled for.
Meta-analyses exploring this topic show that findings can vary significantly depending on the approach employed. Kesaite and Greve (2023) express scepticism towards much of the existing literature reviewed in their meta-analysis, noting that many results rely heavily on strong statistical and theoretical assumptions. In contrast, Robroek et al's (2013) meta-analysis of longitudinal studies - which are arguably better suited to addressing issues of simultaneity - find evidence of a statistically significant relationship between obesity and reduced employment through disability. However, they report no statistically significant effects of obesity on employment outcomes via other pathways, such as unemployment (i.e. capable of working, actively seeking work, but unable to find any work) or early retirement.
Inactivity due to obesity
Given the range of findings in the literature and the relatively stronger evidence linking disability to reduced employment rates, we conservatively rely on results from Campbell et al. (2021). Exploring a sample of UK individuals aged 40-64, the authors use a two-stage Mendelian randomisation approach to circumvent omitted variable bias and reverse causality, thus more effectively determining the effect on employment due to obesity. The paper analyses genetic variations associated with BMI and finds that higher levels of BMI lead to a statistically significant reduction in employment rates through disability. Our estimation on the productivity cost associated with reduced employment rates are therefore uniquely focused on the reduced employment effects arising from disability that is linked with obesity.
We apply these findings conservatively. First, we assume individuals in the healthy-weight range have the highest possible BMI (of 24.9), and that individuals living with obesity have the lowest possible BMI for each obesity class, i.e. 30 and 40 for obesity Class I/II and Class III, respectively. Additionally, we limit our analysis to individuals aged 40-64 - we conservatively assume that the employment rate amongst individuals with obesity aged 18-39 is equal to those in the healthy-weight range. We do not extrapolate the same effects of BMI on employment for workers aged below 40 as labour market conditions are likely to be significantly different between the two groups, rendering this approach less reliable. We value each job at the median wage to provide an overall productivity cost associated with reduced employment via disability.
We estimate reduced employment rates of 74.1% for Class I/II (1.3% lower than healthy-weight workers) and 69.8% for Class III (5.7% lower). Obesity is therefore associated with an employment shortfall of over 266,000 jobs among workers aged 40-64, which translates into a cost of £8.5 billion per year or £839 per worker with obesity aged 18-64. Spreading this cost across the entire population with obesity aged 18+ results in a cost per person of £314 for Class I/II and £1,539 for Class III.
| Table 5 Inactivity costs due to obesity per year |
Class I/II |
Class III |
Obesity total |
| Cost |
|
|
|
| Employment rate differential, 40-64 |
2.5% |
10.7% |
3.7% |
| Cost per person with obesity |
£314 |
£1,539 |
£471 |
| Total cost |
£5.0 bn |
£3.6 bn |
£8.5 bn |
Source: Frontier Economics
Inactivity due to overweight
While not the primary focus of this report, we have also considered the inactivity costs associated with overweight. The Campbell paper reported the impact on employment outcomes due to a unit change in BMI. These statistically significant findings are observed when the full sample of workers is included. However, the relationship between BMI and employment exit is unlikely to be linear across the entire BMI range. For example, it is plausible that this relationship would be reversed when considering a sample containing only underweight and healthy-weight individuals.
Rather than re-estimating new figures, we have therefore directly applied the approach from Frontier's previous analysis for the Tony Blair Institute. This approach combines two estimates; one based on early retirement due to overweight, and another based on the estimated length of time missed from employment due to diabetes and other obesity-related health conditions. Using our updated salary data, the total cost of inactivity due to overweight divided by the number of individuals with overweight is £184. We apply this cost per person with overweight to the 2025 prevalence data for our inactivity estimate. This results in a cost of £3.6 billion, and a total obesity and overweight cost of £12.1 billion.
3.3 Costs due to increased sickness absence
Obesity and overweight can lead to productivity costs when it leads to increased sickness absence. We rely on published literature which estimates the increases in number of sick-days per year amongst workers with obesity and overweight compared to healthy-weight individuals.
Sickness absence due to obesity
Harvey et al (2010) explore a sample of 1,300 workers in London and find that the odds of short-term sickness absence were 1.6 times higher for workers with Class I obesity and 1.9 for Class II/III workers. Their cross-sectional econometric model uses a strong causal identification strategy and controls for a number of confounders, including demographics, medical and psychiatric disorders, and job satisfaction scores. Further, the magnitude of the results is similar to other evidence we have found, giving us confidence that our cost estimates are within a reasonable range.
We calculate that workers with Class I/II obesity lose an additional 3.6 days per year due to sickness absence relative to healthy-weight workers, while those with Class III obesity lose an additional 5.4 days. This is unsurprising when considering that health care costs for individuals with Class III obesity are higher than those of individuals with Class I/II obesity - it reflects that individuals with Class III obesity are more prone to infection, chronic illnesses, higher number of medical appointments, etc. which are linked with higher numbers of sick days.
We note that Class III obesity leads to significantly higher costs related to reduced employment rates relative to those with Class I obesity (roughly four times as much), while for sickness absence we observe smaller differences across classes. This pattern could be explained by a (non-random) selection into employment - those who remain employed despite living with obesity Class III may represent a healthier or more resilient subset of the broader population of individuals with Class III obesity.
Sickness absence associated with overweight
Although not the primary focus of this report, we have also considered the costs of sickness absence associated with overweight. To estimate these, we have applied the same approach as Frontier's previous analysis for the Tony Blair Institute (TBI), updated using the most recent salary data. The TBI analysis relies on the prospective approach from the Harvey et al paper, which suggests that individuals with overweight take an average of 2.5 additional sickness absence days per year.
Unlike the analysis of absence due to obesity, we have not used the cross-sectional results of the Harvey et al paper for overweight as they are potentially less robust. Since a full review of the literature of sickness absence for overweight individuals was not within the focus of this work, we have maintained continuity in approach with the TBI analysis.
The below table summarises the results of the absenteeism costs. We consider costs associated with increased sickness absence for the subset of individuals with obesity and overweight that are in employment. For this, we use the employment rate amongst individuals in obesity, and value each sick day at the median daily wage.
This equates to a cost of £251 per person with obesity in Class I/II and £410 per person with obesity in Class III. The total cost per year due to obesity is £4.9 billion, of which £4 billion is due to Class I/II obesity and £0.9 billion is due to Class III. The total cost due to overweight is £3.4 billion. The total cost per worker with obesity aged 18-64 (all BMI classes) is £492.
| Table 6 Absenteeism costs per year for obesity and overweight |
Overweight |
Class I/II |
Class III |
| Cost |
|
|
|
| Excess days lost |
2.5 |
3.6 |
5.4 |
| Cost per person |
£174 |
£251 |
£410 |
| Total cost |
£3.4 bn |
£4.0 bn |
£0.9 bn |
Source: Frontier Economics
Note: Based on a working year of 250 days
3.4 Costs due to early mortality
Excess weight has an economic cost if individuals die during working-age years who would have worked if otherwise healthy-weight. We draw on mortality statistics for the diseases with the strongest links to obesity, as well as their respective Population Attributable Fractions (PAFs) to understand the number of obesity-related deaths per each age group.
Mortality due to obesity
We estimate that obesity is responsible for around 23,000 deaths per year through associated diseases with the strongest links to obesity. These estimates are likely conservative, as the UK government has reported that obesity causes over 30,000 deaths per year. Although Class I/II account for more absolute deaths, the share of deaths among Class III is disproportionate relative to their share of overall obesity.
However, the number of obesity-related deaths among individuals aged less than 65 (i.e. assumed of working-age) is relatively low, at 3,423. We combine these with the employment rate of individuals with obesity and the average age of exit from the labour market in the UK to approximate the current and future employment lost as a result of current obesity-related mortality. We value lost employment at the median annual wage, and discount future lost employment based on Green Book discount rates.
The productivity costs due to obesity arising from excess mortality of working-age adults is low relative to the other cost areas. This is because over 85% of obesity-related deaths occur among individuals aged 65 and older and are assumed to be out of the workforce. Across the entire population with obesity, costs average £37 per person, resulting in a total cost of mortality in terms of productivity of around £700 million.
| Table 7 Mortality costs per year due to obesity |
Class I/II |
Class III |
Total obesity |
| Cost |
|
|
|
| Excess working-age deaths |
2,878 |
544 |
3,423 |
| Cost per person |
£36 |
£46 |
£37 |
| Total costs |
£0.6 bn |
£0.1 bn |
£0.7 bn |
Source: Frontier Economics
Mortality due to overweight
Several papers have considered the impact of overweight on all-cause mortality. The evidence generally finds no statistically significant relationship between all-cause mortality and overweight. As such, we do not attempt to calculate mortality costs due to overweight.
4 Productivity costs of obesity by subpopulation
The analysis described so far provides estimates for the total population and on an ‘average per person' basis. However, it is well established that obesity disproportionately affects certain groups, such as individuals living in the most deprived areas.
We estimated how obesity costs vary across the following subpopulations:
- Nations (England, Scotland, Wales, Northern Ireland)
- BMI Class (30-39, 40+)
- Deprivation (IMD quintile)
- Ethnicity (White, Black, Asian, Mixed, Other)
| Table 8 Overview of sources |
England |
Scotland |
Wales |
Northern Ireland |
| Prevalence |
|
|
|
|
| Overall obesity |
HSE 2022 |
SHS 2023 |
NHS Wales 2022/23 |
HSNI 2023/24 |
| Class III obesity |
HSE 2022 |
SHS 2023 |
PHW 2021/22 and 2022/23 |
HSNI 2023/24 |
| Age |
HSE 2022 |
SHS 2023 |
NHS Wales 2022/23 |
HSNI 2019/20 |
| IMD quintile |
HSE 2022 |
SHS 2023 |
NHS Wales 2022/23 |
HSNI 2019/20 |
| Ethnicity |
Nesta (HSE 2019) |
Frontier calculations |
Frontier calculations |
Frontier calculations |
Source: Frontier Economics
Note: Further details are presented in Annex A.3.
4.1 Breakdown of obesity costs by nation
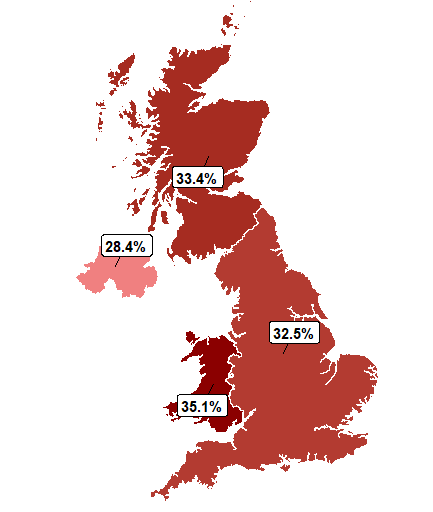
Figure 3 below shows the obesity prevalence by nation. Wales has the highest obesity prevalence (35.1%), followed by Scotland (33.4%), England (32.5%) and Northern Ireland has the lowest prevalence (28.4%).
Source: Frontier economics
Table 9 below presents the productivity costs by nation. England represents 85% of the total productivity cost of obesity, or £20.2 billion. Here, we also present the costs expressed in terms of the average cost per 1,000 inhabitants. The denominator for each subpopulation is the total number of individuals within the subgroup (i.e. all adults and all weights).
The average cost per 1,000 inhabitants is highest in Scotland at around £0.45 million, while the average cost per 1,000 inhabitants is lowest in Northern Ireland at £0.34 million. Despite having a lower overall obesity prevalence than Wales, the cost is more than offset by higher median salaries in Scotland.
| Table 9 Productivity costs due to obesity by nation |
England |
Scotland |
Wales |
Northern Ireland |
| Country |
|
|
|
|
| Obesity prevalence |
32.5% |
33.4% |
35.1% |
28.4% |
| Number of adults w/ obesity |
15,219,298 |
1,529,535 |
913,355 |
431,569 |
| Presenteeism costs |
£8.3 bn |
£0.8 bn |
£0.4 bn |
£0.2 bn |
| Inactivity costs |
£7.2 bn |
£0.8 bn |
£0.4 bn |
£0.2 bn |
| Absenteeism costs |
£4.2 bn |
£0.4 bn |
£0.2 bn |
£0.1 bn |
| Mortality costs |
£0.6 bn |
£0.1 bn |
£0.03 bn |
£0.02 bn |
| Total productivity costs |
£20.2 bn |
£2.1 bn |
£1.1 bn |
£0.5 bn |
| Proportion |
85% |
9% |
5% |
2% |
| Average cost per 1,000 inhabitants |
£0.43 m |
£0.45 m |
£0.42 m |
£0.34 m |
Source: Frontier Economics
4.2 Breakdown of productivity costs by class of obesity
Table 10 presents the costs per person disaggregated by BMI class. We find that prevalence of Class I/II is considerably higher than prevalence of Class III obesity. As a result, total costs are primarily driven by Class I/II obesity (£15.3 billion). Nonetheless, average productivity cost per person with obesity is significantly higher for individuals with Class III obesity (£3,687) relative to Class I/II (£971).
| Table 10 Cost per BMI Class |
Class I/II |
Class III |
| BMI Class |
|
|
| Obesity prevalence |
28.4% |
4.2% |
| Number of adults w/ obesity |
15,781,116 |
2,312,642 |
| Presenteeism costs |
£5.8 bn |
£3.9 bn |
| Inactivity costs |
£5.0 bn |
£3.6 bn |
| Absenteeism costs |
£4.0 bn |
£0.9 bn |
| Mortality costs |
£0.6 bn |
£0.1 bn |
| Total productivity costs |
£15.3 bn |
£8.5 bn |
| Proportion |
64% |
36% |
| Average cost per person with obesity |
£971 |
£3,687 |
Source: Frontier Economics
4.3 Breakdown of obesity productivity costs by deprivation quintile
Figure 4 below shows the variation in obesity prevalence by IMD quintile. We can see that total prevalence increases as deprivation increases – the most deprived quintile has an obesity prevalence of 39.5%, whereas the least deprived prevalence is 24.9%. The splits between BMI Classes are also unequal the prevalence of Class III obesity tends to increase as deprivation increases, ranging from 2% in the least deprived quintile to 5.7% in the most deprived quintile.
Bar chart showing obesity prevalence by IMD quintile. The x-axis shows categories: Least deprived, 2nd, 3rd, 4th, and Most deprived. The y-axis shows percentages from 0% to 45%. Each category has stacked bars representing Class I/II and Class III prevalence.
Key observations:
- Least deprived: Total prevalence 24.9% (Class I/II: 22.9%, Class III: 2.0%)
- 2nd: Total prevalence 31.1% (Class I/II: 27.8%, Class III: 3.3%)
- 3rd: Total prevalence 32.8% (Class I/II: 28.9%, Class III: 3.9%)
- 4th: Total prevalence 34.8% (Class I/II: 29.8%, Class III: 5.0%)
- Most deprived: Total prevalence 39.5% (Class I/II: 33.8%, Class III: 5.7%)
Overall, both Class I/II and Class III obesity prevalence increase with higher deprivation levels, with Class III showing a more pronounced increase.
Source: Frontier Economics
Table 11 presents the productivity costs of obesity disaggregated by IMD deprivation quintile. The costs per 1,000 inhabitants are reflective of both the prevalence rates as well as variations in average salary in each quintile. The cost is highest for the 4th most deprived cohort at £0.49 million and lowest for the least deprived group at £0.36 million. Despite a lower prevalence than the most deprived group, the higher average salary of the 4th most deprived group relative to the most deprived group more than offsets this difference. When accounting for the variance of salary and prevalence between quintiles, the costs for the 5th, 3rd and 2nd quintiles are proportionate to their relative sizes (each account for 20% of the population, as well as costs).
| Table 11 Productivity cost of obesity per IMD Quintile |
Most deprived |
4th |
3rd |
2nd |
Least deprived |
| IMD Quintile |
|
|
|
|
|
| Obesity prevalence |
39.5% |
34.8% |
32.8% |
31.1% |
24.9% |
| Number of adults w/ obesity |
4,381,136 |
3,862,408 |
3,635,070 |
3,453,719 |
2,761,424 |
| Presenteeism costs |
£2.0 bn |
£2.3 bn |
£1.9 bn |
£1.9 bn |
£1.6 bn |
| Inactivity costs |
£1.8 bn |
£2.0 bn |
£1.7 bn |
£1.7 bn |
£1.4 bn |
| Absenteeism costs |
£1.0 bn |
£1.0 bn |
£1.0 bn |
£1.0 bn |
£0.9 bn |
| Mortality costs |
£0.1 bn |
£0.1 bn |
£0.1 bn |
£0.1 bn |
£0.1 bn |
| Total productivity costs |
£4.8 bn |
£5.4 bn |
£4.8 bn |
£4.8 bn |
£4.0 bn |
| Proportion |
20% |
23% |
20% |
20% |
17% |
| Average cost per 1,000 inhabitants |
£0.44 m |
£0.49 m |
£0.43 m |
£0.43 m |
£0.36 m |
Source: Frontier Economics
4.4 Breakdown of productivity costs of obesity by ethnicity
Figure 5 below shows the variation in obesity prevalence across ethnic groups and obesity Class. It highlights large differences between ethnic groups in both the overall prevalence as well as the prevalence of Class III obesity. Individuals with Black ethnicity have the highest overall prevalence of obesity at 52.3%, while those with Mixed ethnicity have the lowest at 24.5%. However, individuals with “Other” ethnicity have the highest prevalence of Class III obesity (9%) while those with Asian ethnicity have the lowest Class III prevalence (2%).
Bar chart showing obesity prevalence by ethnicity. The x-axis shows ethnic groups: Black, Asian, Other, White, Mixed. The y-axis shows percentages from 0% to 60%. Each ethnic group has stacked bars representing Class I/II and Class III prevalence.
Key observations:
- Black: Total prevalence 52.3% (Class I/II: 42%, Class III: 10%)
- Asian: Total prevalence 35.9% (Class I/II: 34%, Class III: 2%)
- Other: Total prevalence 36.2% (Class I/II: 27%, Class III: 9%)
- White: Total prevalence 31.5% (Class I/II: 28%, Class III: 3.5%)
- Mixed: Total prevalence 24.5% (Class I/II: 22%, Class III: 2.5%)
Black ethnicity has the highest overall obesity prevalence. "Other" ethnicity has the highest Class III prevalence, while Asian ethnicity has the lowest Class III prevalence.
Source: Frontier Economics
Table 12 provides the ethnic breakdown of productivity costs of obesity. In a similar manner to IMD quintiles, we allow the median wage to vary by ethnicity using publicly available wage data to inform the differences. The average cost per 1,000 inhabitants is £0.67 million and £0.38 million for individuals with Black and Mixed ethnicity respectively. Compared to the split by IMD quintile, the variance in salaries between ethnic groups is much lower, and therefore relatively more of the variance in cost is driven by prevalence rates.
Interestingly, the average cost per 1,000 inhabitants is very similar for individuals with Asian and White ethnicity, despite the former having a higher overall obesity prevalence and higher median salary. This is driven by the fact that individuals with Asian ethnicity have the lowest rates of Class III obesity. Similarly, the average costs for individuals with Other ethnicity are higher than for Asian ethnicity due to a much higher prevalence of Class III obesity combined with a slightly higher median salary.
| Table 12 Productivity costs of obesity by ethnic group |
Black |
Other |
Asian |
White |
Mixed |
| Ethnicity |
|
|
|
|
|
| Obesity prevalence |
52.3% |
35.9% |
36.2% |
31.5% |
24.5% |
| Number of individuals w/ obesity |
1,078,813 |
391,009 |
1,729,958 |
14,528,976 |
365,001 |
| Presenteeism costs |
£0.6 bn |
£0.3 bn |
£0.8 bn |
£7.8 bn |
£0.2 bn |
| Inactivity costs |
£0.5 bn |
£0.3 bn |
£0.7 bn |
£6.9 bn |
£0.2 bn |
| Absenteeism costs |
£0.3 bn |
£0.1 bn |
£0.5 bn |
£3.9 bn |
£0.1 bn |
| Mortality costs |
£0.0 bn |
£0.0 bn |
£0.1 bn |
£0.5 bn |
£0.0 bn |
| Total productivity costs |
£1.4 bn |
£0.7 bn |
£2.1 bn |
£19.2 bn |
£0.6 bn |
| Proportion |
6% |
3% |
9% |
80% |
2% |
| Average cost per 1,000 inhabitants |
£0.67 m |
£0.61 m |
£0.43 m |
£0.42 m |
£0.38 m |
Source: Frontier Economics
5 Impact of obesity on economic growth
The productivity cost estimates reported above provide an indication of the impact of obesity on the level of economic output generated by the UK's economy each year. In addition, obesity may have implications for economic growth over time, particularly through:
- Changes in obesity prevalence: A change in obesity prevalence will lead to larger/smaller productivity effects. As economic growth is measured as the year-on-year change in a country's output, rising obesity rates contribute to slower growth during the period in which prevalence is increasing, while falling obesity rates contribute to higher growth. However, this effect would converge to zero once obesity rates stabilise.
- Population health improvement/deterioration: There is a body of literature exploring the long-run effect of the population's health on economic growth. It is well established that obesity has negative implications on individuals' health. As a result, it is plausible that higher (lower) rates of obesity levels may lead to lower (higher) economic growth via a deterioration (improvement) in the population's health.
We found limited evidence in the empirical literature on the effects of obesity on economic growth. The growth literature focuses on the effects of life expectancy (as measured by either life expectancy at birth or adult survival rates), which is one of the few objective cross-country measures that captures health. Further, Mayer (2001) notes that the impact of health on economic performance is a long-term phenomenon, making the effect difficult to identify empirically.
Research from the University of Oxford indicates that individuals with obesity are expected to live, on average, three years less than those of healthy-weight, rising to as much as ten years for individuals with Class III obesity. Combining these expected losses of life arising from obesity with the current obesity prevalence data in the UK suggests that obesity may be responsible for reducing the overall population life expectancy by around 1.27 years. To the extent this reduction in life expectancy is linked with reduced economic growth, it is plausible that obesity may influence long-term economic growth, even if prevalence stabilises.
Nonetheless, given the uncertainty surrounding these long-term dynamics, we have not attempted to quantify the potential effect of obesity on economic growth in this analysis.
6. Future productivity costs of obesity and overweight
Obesity rates in the UK have steadily increased over the past few decades. This upward trend has led to a sustained rise in the productivity costs associated with obesity.
Figure 6: Obesity prevalence, selected geographies over time
A line chart showing the increase in obesity prevalence from 1975 to 2015 for various regions (Africa, United Kingdom, Eastern Mediterranean, Australia, Europe, United States), with percentages on the y-axis (0-40%) and years on the x-axis. The UK line shows a steady increase from around 10% in 1975 to over 25% in 2015, mirroring a general upward trend across all shown geographies.
Source: Our World in Data
Note: The definition/measurement of obesity prevalence in this chart may not match the one used to quantify costs throughout our report.
In this section we explore how the productivity costs of obesity may evolve over the next 10 years, through to 2035. For this, we have allowed obesity prevalence to vary over time, while fixing the remaining inputs to the model (e.g. we do not allow any changes to employment rates, median salaries, average sickness absences, etc), and report all costs in 2025 prices. This approach allows us to isolate the effect of a growing obesity population, which is driven by both changes in population size, and critically, in the rates of obesity.
- Population forecasts are readily available from the ONS.
- Obesity prevalence forecasts are based on UK Cancer Research, which provides nation-level breakdowns of predicted obesity prevalence for individuals with overweight, BMI above 30 and above 40 separately.
We apply Cancer Research UK's growth rates in prevalence onto our own estimate of prevalence in 2025 to determine the annual change in the population with obesity until 2035. Full details are provided in Annex A.8.
Table 13 shows that the forecasted obesity prevalence is expected to continue increasing over time, reaching 34.6% in 2030 and 36.1% in 2035. The productivity cost of obesity is expected to reach £26.6 billion by 2030 and £29.1 billion by 2035. In contrast, the prevalence of overweight is projected to fall slightly, meaning that overweight costs are driven solely by population growth, reaching £7 billion in 2030 and £7.1 billion in 2035. The total productivity cost of obesity and overweight is therefore projected to be £36.3 billion in 2035.
| Table 13: Forecasted prevalence and costs of obesity and overweight |
|
|
|
| Year |
2025 |
2030 |
2035 |
| Prevalence, overweight |
34.8% |
34.4% |
34.1% |
| Prevalence, Class I/II |
28.4% |
29.7% |
30.6% |
| Prevalence, Class III |
4.3% |
4.8% |
5.5% |
| Presenteeism |
£9.7 bn |
£10.9 bn |
£12.0 bn |
| Inactivity |
£12.1 bn |
£13.2 bn |
£14.2 bn |
| Absenteeism |
£8.3 bn |
£8.8 bn |
£9.3 bn |
| Mortality |
£0.7 bn |
£0.7 bn |
£0.8 bn |
| Total cost |
£30.8 bn |
£33.7 bn |
£36.3 bn |
Source: Frontier Economics
These cost estimates are based on the best available predictions of obesity prevalence today. However, there is much uncertainty on the future of obesity prevalence and whether it will continue to follow the trends of recent years. The forecasts do not account for factors such as;
- A change in government policy which limits high-fat, sugar and salt food.
- A new medical technology which facilitates a faster rate of weight loss. For example, the impact of GLP-1 agonist medications and other medical innovations.
- Changes in population-level attitudes towards healthy eating and physical activities.
As such, the estimates we have presented are likely to closely relate to a “do nothing” scenario.
7. Potential avoided productivity costs of obesity and overweight
We have undertaken a scenario-based analysis on the costs which could be avoided if rates of obesity and overweight were lower than those currently observed in the UK. This might occur as a result of effective policy interventions, although we have not analysed any specific interventions.
Previous analysis by Nesta shows that the impacts policies and interventions aimed at reducing excess weight have higher impact on reducing obesity prevalence compared to overweight prevalence. This is because many individuals currently living with obesity would move into the overweight BMI category rather than reaching a healthy weight, displacing those who would move from the overweight category into the healthy weight range. Nesta estimate that interventions that lead to a given percentage reduction in obesity prevalence tend to lead to a one-tenth of the reduction in overweight prevalence.
We modelled 9 scenarios of reduction in obesity prevalence: 1%, 2%, 5%, 10%, 15%, 20%, 25%, 40%, and 50%. The corresponding reductions in overweight prevalence are one-tenth of each, i.e. from 0.1% to 5%. These represent percentage reductions, not percentage point reductions (i.e. a 10% reduction from 30% is 27%). These are reductions from the 2025 level of obesity and overweight prevalence.
Under each scenario, we calculated the reduction in productivity costs. For this exercise, we have assumed a linear relationship between the economic costs of obesity and overweight and the number of individuals with obesity and overweight. In other words, a reduction in obesity and overweight prevalence of 10% would result in productivity costs of obesity and overweight being reduced by 10%.
Table 14 below shows the avoided costs if obesity prevalence was reduced by 1%, 20% and 50%. In the same columns, overweight prevalence reduces by 0.1%, 0.2% and 5%. A full table with all scenarios is available in the Annex (Table 30). We estimate that if obesity prevalence in the UK was reduced by just 1% (and overweight prevalence by 0.1%), the productivity cost savings would amount to £245 million in 2025. More significant reductions would have larger impacts: the cost savings from a reduction in obesity of 20% and 50% (or 2% and 5% for overweight) would amount to £4.9 billion and £12.3 billion, respectively.
| Table 14: Potential avoided costs in the UK if obesity and overweight rates were decreased |
|
|
|
| Obesity prevalence reduction |
1% |
20% |
50% |
| (Overweight prevalence reduction) |
(0.1%) |
(2%) |
(5%) |
| Presenteeism |
£97 m |
£1.9 bn |
£4.9 bn |
| Inactivity |
£89 m |
£1.8 bn |
£4.4 bn |
| Absenteeism |
£52 m |
£1.0 bn |
£2.6 bn |
| Mortality |
£7 m |
£0.1 bn |
£0.3 bn |
| Total cost |
£245 m |
£4.9 bn |
£12.3 bn |
Source: Frontier Economics
Finally, the table below outlines the potential cost savings if obesity rates are reduced by 5% every year between 2025 to 2035, and 0.5% per year for overweight. At this rate of reduction, obesity prevalence would reduce by 7.4 percentage points to 25.2% by 2025, and by 13.1 percentage points to 19.5% by 2035. Overweight prevalence would reduce by 0.9 percentage points to 33.9% by 2030 and 1.7 percentage points to 33.1% by 2035. The reductions are 23% and 40% in relative terms for obesity, and 2.5% and 4.9% for overweight. The savings represent the difference between this reduction and a counterfactual where obesity and overweight follow the forecasted trends we presented in Section 6. A reduction of obesity and overweight prevalence by 5% and 0.5% per year could allow for savings of over £23.7 billion within 5 years and over £82.8 billion over the course of 10 years. The savings are especially strong in the second 5 years, where the difference in prevalence versus the baseline is on average over twice as large as during the first 5 years.
| Table 15: Estimated cumulative cost savings associated with annual reductions of 5% in obesity prevalence and 0.5% in overweight prevalence |
|
|
| Cost savings |
2025 to 2030 |
2025 to 2035 |
| Presenteeism |
£9.7 bn |
£34.0 bn |
| Inactivity |
£8.7 bn |
£30.4 bn |
| Absenteeism |
£4.7 bn |
£16.2 bn |
| Mortality |
£0.6 bn |
£2.1 bn |
| Total |
£23.7 bn |
£82.8 bn |
Source: Frontier Economics
Note: all figures relate to January 2025 prices
8. Wider costs of obesity and overweight
While not the primary focus of this work, we also consider the wider societal costs associated with obesity and overweight. These include:
- Costs to individuals with obesity. Reductions in health-related quality of life (HRQoL) due to obesity and overweight, both directly and due to obesity-related illness.
- Costs to the healthcare (i.e. NHS) and social care sector. Increased demand for healthcare and social care services from individuals with obesity and overweight.
- Costs to family and carers of individuals with obesity (informal social care). Increased burden of informal care for individuals with obesity and overweight.
To model these costs for obesity, we have closely followed the approach in Frontier Economics' previous work for Lily and Health Innovation Manchester (Cost of obesity in Greater Manchester, June 2024).
For overweight, we draw on the same data and followed the same methodology as for obesity, as the underlying evidence included readily available data for overweight. The only exception relates to healthcare, for which the available data did not allow us to model costs for overweight. For healthcare, we scale down the incremental cost estimates due to obesity according to the ratio as presented in a previous analysis which estimated health care expenditures associated with obesity and overweight separately. The results suggest that incremental healthcare costs of overweight, relative to normal weight, are approximately 33% of those of Class I/II obesity.
To apply these estimates for overweight, we require data on overweight prevalence. We draw on the same sources for the prevalence data for overweight by country as those outlined in Table 8, and find a UK overweight prevalence of 35%. As discussed in more detail in Annex A.3, the obesity prevalence rates are nowcasted to 2025 as some of the country-level surveys are several years old. The same approach is taken for overweight prevalence, where there has been a very slight reduction.
Below we present our estimates of wider costs of obesity and overweight. We find wider costs associated with obesity of £82.8 billion per year, with the largest cost component (77%) arising from QALY losses. The wider costs of overweight amount to £12.9 billion, approximately 16% of the equivalent costs of obesity. As part of this work, we have reviewed the available evidence on healthcare costs associated with mental ill health (see Annex A.9). We estimate that depression alone is responsible for £697 million of the incremental healthcare costs of obesity and overweight.
| Table 16: Wider costs associated with obesity and overweight in the UK in 2025 |
|
|
|
| Wider cost |
Overweight |
Obesity |
Total cost |
| Health care |
£3.3 bn |
£9.3 bn |
£12.6 bn |
| Social care |
£0.1 bn |
£1.0 bn |
£1.2 bn |
| QALY losses |
£8.2 bn |
£63.2 bn |
£71.5 bn |
| Informal care |
£1.3 bn |
£9.3 bn |
£10.5 bn |
| Total cost |
£12.9 bn |
£82.8 bn |
£95.7 bn |
Source: Frontier Economics
Note: Totals may not sum due to rounding.
As indicated above, our analysis suggests that the productivity costs of obesity and overweight in the UK in 2025 are £30.8 billion. Taking these wider costs into account, the total cost of obesity and overweight in the UK is estimated at £126 billion.
Below we provide a high-level overview of the approach taken. Further details can be found in the Annex, and in Frontier Economics' report for Lily and Health Innovation Manchester (Cost of obesity in Greater Manchester, June 2024).
Healthcare
We drew upon published data to estimate (i) the number of cases of obesity-related conditions which are due to obesity, and (ii) the average healthcare cost per case per obesity-related condition:
- Number of cases: we drew upon published data reporting the prevalence or incidence of obesity-related conditions. We also drew upon published data to estimate the proportion of all cases of these conditions which are due to obesity, rather than other factors. We used these two data sources to calculate the number of cases of each condition which are due to obesity. We also drew upon data which estimates the number of people who have more than one obesity-related condition (e.g. stroke and hypertension), which is called multi-morbidity. Where possible, we conservatively relied on diagnosed prevalence, rather than estimated prevalence, to focus on cases more likely to lead to direct healthcare costs.
- Average cost per case: we drew upon published data which estimates the average cost to the NHS of obesity-related conditions, per case per year. These estimates include the costs of multi-morbidity, for conditions where this data was available.
The overall healthcare costs are the product of these two components. Again, the differences compared to TBI include focusing on diagnosed, rather than estimated, illness. We also use improved estimates of overweight costs informed by real-world differences in health expenditure by weight status.
We focused on the costs of formal social care funded by local authorities. The cost of privately-funded social care is not included in our analysis. However, the 'opportunity cost' of providing informal social care, for example by family members of people with obesity, is considered below.
Two components were estimated:
- Care hours per person: we drew upon academic literature to estimate the average additional local authority funded formal social care needs due to obesity for individuals aged 65 and over. Care needs were estimated based on self-reported needs of individuals with BMI levels between 30 and 40, and are measured in terms of hours of care per year. These estimates take into account the fact that not all individuals with obesity aged 65 and over require social care services, which drives down the average. As the underlying literature for these estimates is based upon self-reported social care needs, we have applied a downwards adjustment to account for the fact that not everyone who requests formal social care support actually receives it.
- Cost of care per hour: we used well established sector estimates of the cost of delivering an hour of social care in England, adjusted to 2025 prices.
The product of the two components above gives our monetary estimate of annual social care costs funded by the local authority, per person with obesity aged 65 and over due to obesity.
We also consider the costs associated with social care services for adults below 65, which contrasting the TBI approach which excluded this cohort. For this, we rely on Greater Manchester healthcare data to compare the relative usage of social care packages between adults living with obesity below 65 to usage of those above 65. We apply this proportion to social care costs of older individuals to estimate costs of those below 65, recognizing that there is more uncertainty around social care costs due to obesity for individuals below 65 than for those above 65. When employing this approach, we are effectively assuming that the ratio of social care patterns amongst individuals below and above 65 in Greater Manchester is the same as across the UK.
Alongside – or as a substitute for – formal social care, many individuals rely upon informal care provided by family or friends. These are non-financial, 'opportunity costs', borne by these carers, based upon the time spent providing informal care which could have instead been spent in another way (e.g. additional work, or additional leisure). We estimated these costs in monetary terms by combining the following components:
- Informal care burden per individual: we drew upon published literature which estimates the number of hours of informal care required by individuals with obesity, compared with individuals not living with obesity.
- Average cost per case: these are non-financial costs borne by individuals. We convert these costs into monetary terms by valuing each hour of informal care provided at the DfT value of leisure time (£7.48).
The average cost per individual with obesity is the product of these two components. As above, the other key difference in our approach versus the TBI analysis is the inclusion of individuals aged under 65.
Individuals living with obesity experience poorer health-related quality of life (HRQoL) outcomes. These are non-financial costs, but can be valued in monetary terms. We estimated these costs by combining the following components:
- Quality of life loss per individual: we drew upon published literature which has considered the quality of life of individuals living with obesity, compared with individuals without obesity. This evidence explores how HRQoL compares for individuals with overweight, Class I/II and Class III obesity. HRQoL losses are reported as a reduction in Quality Adjusted Life Years (QALYs).
- Average cost per case: these are non-financial costs borne by individuals. We follow UK Government best-practice in valuing these QALY reductions. We value each QALY lost using the Green Book value of £70,000 per QALY, and update these to January 2025 prices (£84,928).
The overall costs to individuals are the product of these two components. Higher prevalence of obesity (due to NICE thresholds, adjustments for self-reported data) is the largest driver of the increase in estimated cost between our analysis and the TBI report.
Future and avoided wider costs
The tables below follow the approaches as laid out in the previous sections to calculate potential avoided wider costs and future wider costs of obesity and overweight.
If obesity prevalence were to reduce by 1% and overweight prevalence by 0.1%. this would entail avoided costs of £0.8 billion in 2025. Similarly, avoided costs would reach almost £42.1 billion if obesity prevalence rates halved and overweight prevalence reduced by 5%.
| Table 17: Potential avoided costs due to reduced prevalence of obesity and overweight |
|
|
|
| Obesity prevalence reduction |
1% |
20% |
50% |
| (Overweight prevalence reduction) |
(0.1%) |
(2%) |
(5%) |
| Presenteeism |
£97 m |
£1.9 bn |
£4.9 bn |
| Inactivity |
£89 m |
£1.8 bn |
£4.4 bn |
| Absenteeism |
£52 m |
£1.0 bn |
£2.6 bn |
| Mortality |
£7 m |
£0.1 bn |
£0.3 bn |
| Productivity costs |
£245 m |
£4.9 bn |
£12.3 bn |
| Health care |
£97 m |
£1.9 bn |
£4.8 bn |
| Social care |
£10 m |
£0.2 bn |
£0.5 bn |
| QALY losses |
£641 m |
£12.8 bn |
£32.0 bn |
| Informal care |
£94 m |
£1.9 bn |
£4.7 bn |
| Wider costs |
£0.8 bn |
£16.8 bn |
£42.1 bn |
| Total cost |
£1.1 bn |
£21.7 bn |
£54.3 bn |
Source: Frontier Economics
The table below shows the wider costs that would prevail if obesity and overweight prevalence follow their expected projections. In the case of overweight, the prevalence rate is due to decline over the next 10 years, meaning that the costs are entirely driven by obesity prevalence plus population growth. Wider costs of obesity and overweight could reach £105 billion per year by 2030 and £113 billion per year in 2035.
| Table 18: Future wider (and productivity) costs due to obesity and overweight |
|
|
|
| Cost area |
2025 |
2030 |
2035 |
| Presenteeism |
£9.7 bn |
£10.9 bn |
£12.0 bn |
| Inactivity |
£12.1 bn |
£13.2 bn |
£14.2 bn |
| Absenteeism |
£8.3 bn |
£8.8 bn |
£9.3 bn |
| Mortality |
£0.7 bn |
£0.7 bn |
£0.8 bn |
| Total productivity |
£30.8 bn |
£33.7 bn |
£36.3 bn |
| NHS costs |
£12.6 bn |
£13.6 bn |
£14.5 bn |
| Social care |
£1.2 bn |
£1.3 bn |
£1.3 bn |
| QALY losses |
£71.4 bn |
£78.8 bn |
£85.3 bn |
| Informal care |
£10.5 bn |
£11.4 bn |
£12.2 bn |
| Wider costs |
£95.7 bn |
£105.1 bn |
£113.3 bn |
| Total cost |
£126 bn |
£139 bn |
£150 bn |
Source: Frontier Economics
We demonstrate the cumulative cost savings which would arise if obesity prevalence falls by 5% per year over the next 10 years, and overweight prevalence falls by 0.5% per year, compared to the counterfactual where the rates prevalence continue their expected trajectories. The cumulative wider cost savings would reach over £80 billion by 2030 and almost £279 billion by 2035.
| Table 19: Cumulative cost savings of a 5% reduction in obesity prevalence and 0.5% reduction in overweight prevalence |
|
|
| Cost area |
2025 to 2030 |
2025 to 2035 |
| Presenteeism |
£9.7 bn |
£34.0 bn |
| Inactivity |
£8.7 bn |
£30.4 bn |
| Absenteeism |
£4.7 bn |
£16.2 bn |
| Mortality |
£0.6 bn |
£2.1 bn |
| Productivity costs |
£23.7 bn |
£82.8 bn |
| NHS costs |
£8.9 bn |
£30.9 bn |
| Social care |
£0.9 bn |
£3.2 bn |
| QALY losses |
£61.8 bn |
£215.7 bn |
| Informal care |
£8.5 bn |
£29.5 bn |
| Wider costs |
£80.2 bn |
£279.3 bn |
| Total |
£103.9 bn |
£362.1 bn |
Source: Frontier Economics
9. Limitations
The analysis described above is limited in a few respects.
As a general point, it is not always possible to distinguish impacts and costs which are generally associated with obesity from those which are specifically due to obesity. This is unsurprising, given the range of factors (including societal factors) which contribute to and are caused by obesity and the complexity of these relationships. We have attempted to mitigate this issue as far as possible, by basing our analysis on published literature which directly attempts to establish causality.
Body Mass Index (BMI) does not perfectly capture obesity.
It is well established that BMI is an imperfect measure of body fat as it does not distinguish, for example, muscle and fat. Despite this limitation, we rely on BMI as it is the most commonly used measure in the literature. The use of any alternative measure of body fat would lead to significant data limitation issues in our analysis.
The quality of the data for obesity prevalence is imperfect, especially for ethnicities.
England is the only country that reports obesity prevalence by ethnic group. We have been able to achieve prevalence data for the other nations using the population data and overall prevalence rates at our disposal. However, it is possible that the nation-level data is different to our calculations.
Measuring in-work productivity losses is challenging.
Presenteeism is measured using self-assessed surveys of productivity rather than any objective measure of outputs. As such, it is possible that the presenteeism costs could be either understated or overstated.
Forecasts of future obesity are uncertain.
Prevalence forecasts are based on statistical continuity with recent years, and therefore do not take into account potential future developments in policy, medicine or behaviour which may have a significant impact on future costs.
Nevertheless, we believe the analysis presented in this report provides a reasonable estimate of the productivity and economic impacts associated with obesity in the UK. These limitations also indicate areas where further work would be particularly valuable.
Annex A – Modelling assumptions and evidence sources
A.1 Glossary of terms
| Table 20: Definition of terms and concepts used |
| Term |
| Obesity |
| Overweight |
| Class I/II obesity |
| Class III obesity |
| Obesity prevalence |
| Employment rate |
| Economic activity rate |
| Presenteeism |
| Absenteeism |
| Early mortality |
| Odds |
| Odds ratio (obesity) |
| Causality |
| Correlation |
| Longitudinal study |
| Cross-sectional study |
| QALY |
| Omitted variable bias |
| Reverse causality |
| IMD quintile |
Source: Frontier Economics
A.2 General statistics
Population: Population data for the UK and each nation is taken from the ONS mid-year estimates. Forecasts are available from the ONS via the Principal Projection datasets. The relative share of population by ethnicity for England and Wales is available from the 2021 census, the 2022 census for Scotland, and the 2021 census for Northern Ireland. We assume that the population shares by ethnicity do not vary significantly over time and construct the UK ethnic splits using a weighted average of the nations' shares.
A.3 Obesity prevalence
Prices: The analysis was carried out in January 2025 prices using CPI data from the ONS (base = 2015). For consistency in prices across the analysis, all inputs are inflated to January 2025 prices and are adjusted according to the following formula.
Input2025 = Inputrefyear * CPI2025 / CPIrefyear
Discount rates: There are two discount rates used in the analysis, (i) health and life values to discount QALYs, and (ii) standard discount rate to discount all other future prices. Both discount rates (1.5% and 3.5%, respectively) are available from the Green Book 2022.
Labour data: We use the Labour Force Survey seasonally-adjusted national and regional headline indicators (September 2024 to November 2024). This provides the employment, activity and unemployment rates for the UK and each nation for individuals aged 16-64 and 16+.
Salaries: Median hourly pay and annual salaries are available for the UK and each nation from the Annual Survey of Hours and Earnings (2024) available via the ONS. In addition, we calculate median salaries by subgroup for both IMD quintiles and ethnic groups. For IMD quintiles, we proxy the median salary by the difference between mean household income across deciles. Median salaries by ethnicity are calculated using the median hourly pay in England as a proxy for the differences between ethnicities.
This section outlines our data sources for obesity prevalence. The data availability is generally good by country, obesity class, age and deprivation, with minimal assumptions/adjustments required to achieve prevalence calculations for each subpopulation.
The overall prevalence data is straightforward to use, however the more detailed disaggregation provided in the results require intermediate calculations. The subgroups we analyse are:
- BMI Class: Splitting Class III costs from Class I/II is important as Class III accounts for a disproportionate share of the costs, leading to higher costs per person. This
disaggregation was made possible due to the choice of literature which analysed the productivity effects of obesity by class.
- IMD quintiles: These split the population into five equally sized groups depending on a measure of relative deprivation across various indicators (such as income, education and crime). Obesity prevalence by deprivation is generally available, although some limitations and assumptions are highlighted below due to the lack of more recent data in some countries.
- Ethnicity: Data is available for England only. This means that our ethnicity cost disaggregation relies on the assumption that the relative obesity prevalence across ethnic groups in the other nations is equal to England. We do not consider this an overly strong assumption as we take additional steps to make sure that the assumed obesity prevalence rates are adjusted to (i) reflect the overall obesity prevalence in each country, and (ii) are consistent with the variation in demographic shares between ethnic groups in each country.
England
Prevalence data is obtained from the Health Survey for England 2022, Part 2. The tables provide the percentage of individuals aged 16 and over with Class I/II obesity and Class III obesity. The data is disaggregated by age group, sex, and IMD quintile.
Obesity prevalence data disaggregated by ethnicity was provided directly by Nesta as part of a previous analysis using HSE 2019 data. While the HSE 2019 data provides obesity prevalence across 11 ethnic groups, the Nesta analysis is more directly useful as it aggregates the 11 ethnicities into the 5 groups that are then used to compare to the obesity prevalence rates using the alternative NICE thresholds.
Wales
Welsh obesity prevalence data is available from the Adult Lifestyles by Year tables of the National Survey for Wales 2022/23. Obesity prevalence is available for BMI 30+ only. The Adult lifestyles by area deprivation tables contain the equivalent splits by IMD quintile. Separately, Public Health Wales reports Class III obesity for 2021/22 and 2022/23 combined.
Contrary to the other nations, Welsh prevalence data relies upon self-reported weight and height. This becomes a data integrity issue if there is systematic bias among individuals to report taller heights and lighter weights. An analysis by Nesta highlights that correcting for this bias would have increased the obesity rates in Wales in 2021-2022 from 25% to 32%. We assume that obesity prevalence is under-reported to the same extent in the latest data and scale our estimates upwards accordingly.
Class III is not available at the age nor IMD level. To compute these splits, we assume that the ratio of Class I/II prevalence to Class III prevalence is the same across each age group and IMD quintile. Nor is obesity data available by ethnicity for any class. We have assumed that the distribution of obesity by ethnicity is the same as England, then adjust for differences in population structure (i.e. the share of each ethnicity in the general population) and the overall obesity prevalence.
Scotland
Scottish obesity prevalence data is available from the Scottish Health Survey 2023. Disaggregation by age group and sex is readily available for both Class I/II and Class III categories of obesity. Although not available in the core tables, prevalence data by IMD quintile is downloadable from the Scottish Health Survey’s interactive tool.
Prevalence data by ethnicity is not available, therefore the same approach as the other countries is applied. The distribution of English prevalence rates by ethnicity are adjusted to reflect the Scottish ethnic distribution and overall obesity prevalence rates.
Northern Ireland
The source for obesity prevalence data in Northern Ireland is the Health Survey of Northern Ireland 2023/24. Disaggregation is available for sex and for broad weight category (i.e. Class I/II, Class III) only.
Obesity prevalence by age group and IMD quintile are available from the HSNI 2019/20 data. For both of these categories, we have assumed that the overall distribution between groups remains the same and scaled the data to match 2023/24 overall prevalence rates. Class III obesity data is not available for either category, and we have therefore assumed that the ratio of Class III prevalence to total obesity prevalence is constant across the age and IMD distributions.
Again, ethnicity prevalence data is unavailable for Northern Ireland. The same approach is taken as the Wales and Scotland.
| Prevalence |
England |
Scotland |
Wales |
Northern Ireland |
| Overall obesity |
HSE 2022 |
SHS 2023 |
NHS Wales 2022/23 |
HSNI 2023/24 |
| Class III obesity |
HSE 2022 |
SHS 2023 |
PHW 2021/22 and 2022/23 |
HSNI 2023/24 |
| Age |
HSE 2022 |
SHS 2023 |
NHS Wales 2022/23 |
HSNI 2019/20 |
| IMD quintile |
HSE 2022 |
SHS 2023 |
NHS Wales 2022/23 |
HSNI 2019/20 |
| Ethnicity |
Nesta (HSE 2019) |
Frontier calculations |
Frontier calculations |
Frontier calculations |
NICE adjustments to prevalence data
Obesity and overweight prevalence rates reported in the sources listed above use the HSE thresholds to define obesity and overweight, i.e. overweight is BMI equal to or above 25 and below 30, and obesity is BMI above 30. However, Nesta’s analysis has demonstrated that using the NICE definitions can have a significant impact on obesity prevalence rates. The NICE threshold for obesity is 27.5 for individuals of Asian, Middle Eastern, Black African or African-Caribbean family background, and between 23 and 27.5 for overweight for the same ethnicities. The remaining ethnicities (i.e. White and Other) follow the HSE thresholds.
For obesity prevalence, we have taken the English data by ethnicity and applied the adjustments that resulted from switching between HSE and NICE thresholds as provided in Nesta’s analysis, leading to higher prevalence rates than suggested by the raw data. For overweight, Nesta’s analysis has shown that the thresholds make minimal difference to overweight prevalence, since roughly the same number of individuals are reclassified upwards as overweight from healthy as are reclassified from overweight to obese. As such, we have used the HSE overweight prevalence data directly for all ethnicities since it is an accurate proxy of the prevalence that would prevail under the NICE thresholds.
A.4 Costs due to presenteeism
We present presenteeism costs of obesity based on the premise that individuals with obesity may experience higher rates of limited physical mobility, lost concentration, or fatigue relative to healthy-weight individuals. Below, we discuss some of the seminal papers in this field.
An analysis by Finkelstein et al (2010) (our chosen paper) finds that workers with obesity are significantly more likely to have productivity losses relative to healthy-weight individuals, especially in Class III. The results were based on a sample of over 24,000 workers covered under the Workplace Productivity and Activity Impairment survey, which asked: "during the past 7 days, how much did your health problems affect your productivity while you were working?" Scores are on a scale of 0 to 10, with each point on the scale assumed to translate to a 10% reduction in productivity, i.e. a score of 3 means a 30% reduction in productive work. The percentage reductions are annualised to days by multiplying by 250 days per year.
Gates et al (2008) use employment data from the Work Limitations Questionnaire and find that workers with obesity (BMI > 35) suffered 1.18 percentage points additional productivity losses relative to other employees. The WLQ is a self-administered survey measuring the degree to which health problems interfered with the respondent's ability to perform their job activities, with score scales ranging from 0 (none of the time) to 100 (all of the time). While this paper has more conservative results, the sample size is of 341 manufacturing employees only, making it very difficult to be reliable for external validity relative to other studies. The obesity threshold of 35 is not particularly useful for our purposes.
Goetzel et al (2010) also use the WLQ covering over 10,000 employees in multiple professions. They find that presenteeism rates were 12% higher for employees with obesity relative to healthy-weight workers, however when applied to a baseline presenteeism loss, the magnitude is much lower (i.e. 12% of 2% = 0.24%). We suspect that this is due to the choice of estimation strategy (uses non-parametric methods) which is a significant departure to the rest of the literature, and it is therefore unclear how much their approach can be relied upon.
Ricci and Chee (2005) estimate lost productive time in workers with obesity using the Work and Health Interview, which asks the self-reported health-related performance while at work. They found that workers with obesity were 6 percentage points more likely to report greater than 0 hours of health-related lost productivity relative to healthy-weight workers. While helpful for the general conclusion of lost productivity among workers with obesity, the dependant variable is a binary outcome, making it hard to compute a percentage productivity loss.
In a longitudinal survey of over 111,000 Australian workers by Keremat et al (2020), it was found that the prevalence of presenteeism was around 10 percentage points higher for workers with obesity relative to healthy-weight workers, while their multivariate analysis calculates that the odds ratio of presenteeism was 1.38 higher for workers with obesity vs healthy-weight workers. Again, the results were for a binary outcome variable of presenteeism covering questions such as "cut down the amount of time spent on work activities" or "were limited in the kind of work" and are therefore less applicable. It is clear that there is much uncertainty in the literature.
- Estimating a true effect is complicated by the fact that workers may self-select into particular professions based on their health status or other individual factors. This often cannot be adequately controlled for with industry-level dummy variables.
A.5 Cost due to reduced employment rate
Our approach to calculating the difference in employment rates between workers with and without obesity avails of estimates provided by Campbell et al (2021). This paper finds significant effects of obesity on the probability of not being employed due to sickness/disability for workers aged 40-64.
The paper uses a two-sample Mendelian randomisation approach. This approach exploits genetic variants (called SNPs) which have been shown to be strongly associated with obesity. The causal effect of BMI on employment outcomes can be assessed as this approach circumvents reverse causality and omitted variable bias. The paper combines the relationship between SNPs and BMI with the relationship between SNPs and job outcomes from the participants in their study sample. Employment outcomes were assessed using a logistic regression.
To apply their odds ratios to data on UK employment and obesity prevalence, we first need to determine the baseline share of the working-age population receiving disability benefits and not in employment. We determine this to be approximately 7%, based on an average of various sources.
- The IFS estimates that around 10% of working-age adults receive disability benefits.
- Approximately 1.6 million people in the UK receive ESA. The Employment Support Allowance is paid to individuals who have a disability or health condition that affects how much they can work.
- Around 3.6 million individuals receive PIP, of which one in six are in paid employment. The Personal Independence Payment is a benefit to help support additional living costs for people with a long-term disability and/or those who have difficulty doing everyday tasks because of their condition.
The odds ratios are applied to the estimated 7% of working-age individuals on disability, which when combined with our obesity prevalence estimates, allows us to calculate the difference in disability rates between individuals with and without obesity.
As shown in the table below, we calculate odds ratios of 1.44 for Class I/II and 3.0 for Class III for the increased likelihood of exit from employment via disability/sickness for individuals living with obesity aged between 40 and 64 relative to healthy-weight workers. This conservatively assumes the minimum possible difference in BMI between healthy-weight individuals and Class I/II and Class III workers.
Using 7% as the proportion of UK working-age adults on disability, we find that obesity results in an excess employment loss via sickness/disability of 2.5% for Class I/II and 10.7% for Class III obesity. For the remainder of the working-age population (aged 18 to 39) we conservatively assume that the employment rate amongst individuals with obesity is equal to those in the healthy-weight rate.
| Campbell results |
Sickness/disability |
| Odds ratio per BMI |
1.076 |
| 5 point increase |
1.44 |
| 15 point increase |
3.00 |
| Impact, Class I/II |
2.5% |
| Impact, Class III |
10.7% |
Source: Frontier Economics
A.6 Costs due to increased sickness absence
The Harvey et al (2010) paper was chosen due to it being a UK sample with good causal inference strategies and results that are directly applicable across obesity and overweight classes. Further, we are confident in the estimates that it provides as we have triangulated our cost estimates due to absenteeism using a number of different sources.
In terms of excess sick leave days taken per year, Insight Workplace Health report that workers with Class I/II and Class III take an additional 3.5 and 5 days per year, respectively. Similarly, the Institute of Advanced Studies Vienna reports that the likelihood of sickness absence relative to healthy-weight workers is 36% higher for Class I, 61% higher for Class II and 147% higher for Class III workers, which would translate to around 2.5 additional days for Class I/II and 8.8 for Class III.
For comparison, we have also considered direct cost estimates for absenteeism from studies in other geographies, namely the United States of America. For instance, one meta study finds that short-term sick leave days cost between $89 and $1,586 per person with obesity. Another study found costs to be as high as $1,755 per person.
A.7 Costs due to mortality
The excess deaths caused by mortality can be split between Class I/II and Class III using hazard ratios. Borrell and Samuel (2013) examine the association of BMI with all-cause mortality risks and find that the hazard ratio is statistically insignificant for Class I obesity (i.e. 1), 1.41 for Class II and 1.42 for Class III. We use our estimates of Class I and II prevalence to create a weighted average hazard ratio of 1.1. Excess deaths can be proportioned out according to the following formula, where E denotes excess deaths, p represents prevalence, and subscripts denote obesity Class (I/II or III):
E3 = E * (HR3 * P3) / (HR3 * P3 + HR12 * P12)
A.8 Nowcasted and forecasted obesity prevalence
Our analysis adjusts obesity prevalence data in two instances:
- Nowcasting outdated raw survey data to bring it in line with 2025 prevalence rates.
- Forecasting future prevalence rates beyond 2025.
Simply applying recent growth rates of prevalence may overestimate the true prevalence today. Rather, we use research conducted by UK Cancer Research. They run a univariate beta regression model to fit the predicted obesity prevalence rate for each nation, using "year" as the explanatory variable. They then determine prevalence projections using a weighted average of the predictions produced by the regression output and the average prevalence of the previous 10 years, with predictions given progressively less weight over time relative to observed data. Full details can be found in the underlying paper.
Nowcasting to 2025
As indicated in Table 8, the raw data for obesity prevalence is based on surveys that are in some cases a few years old. To bring prevalence data to 2025 levels, we calculate the compound annual growth rate as implied by the UKCR projections between the year of the survey and 2025 separately for each country and BMI class (i.e. 30+ and 40+). Under this approach, obesity prevalence for all BMI classes increases by around 1% per year for Class I/II in the years preceding 2025, and 4.1% for Class III obesity.
Forecasting to 2035
We use our calculated prevalence rates for 2025 as the baseline. We then apply the growth rate as calculated by CRUK for each year between 2025 and 2035 for every nation and BMI split (as above) separately.
A.9 Healthcare, formal and informal social care and QALY-related costs
We have closely followed the approach in our previous work for Lily and Health Innovation Manchester (Cost of obesity in Greater Manchester, June 2024) to estimate costs associated with healthcare, formal and informal social care costs, as well as costs to individuals associated with reductions in Health-related quality of life, updating the estimates based on data on disease prevalence and average earnings in the UK, and using January 2025 prices.
A more comprehensive explanation of the methodology to estimate each of these components can be found in our report “Cost of obesity in Greater Manchester, June 2024” . Nonetheless, below we provide a high-level summary of the approach employed.
Healthcare
We drew upon published data to estimate (i) the number of cases of obesity-related conditions which are due to obesity, and (ii) the average healthcare cost per case per obesity-related condition:
- Number of cases: we drew upon published data reporting the prevalence or incidence of obesity-related conditions. We also drew upon published data to estimate the proportion of all cases of these conditions which are due to obesity, rather than other factors. We used these two data sources to calculate the number of cases of each condition which are due to obesity. We also drew upon data which estimates the number of people who have more than one obesity-related condition (e.g. stroke and hypertension), which is called multi-morbidity. Where possible, we conservatively relied on diagnosed prevalence, rather than estimated prevalence, to focus on cases more likely to lead to direct healthcare costs.
- Average cost per case: we drew upon published data which estimates the average cost to the NHS of obesity-related conditions, per case per year. These estimates include the costs of multi-morbidity, for conditions where this data was available.
The overall healthcare costs are the product of these two components.
The data sources informing our assumptions and calculations are summarised in the following tables.
| Illness |
Cost per case per year - men (2025) |
Cost per case per year - women (2025) |
Source and notes |
| Diabetes |
£1,265 |
£1,073 |
PHE report - The health and social care costs of a selection of health conditions and multi-morbidities. Tables 3 and 4 Available here (2015 prices) |
| Hypertension |
£1,361 |
£1,003 |
see above |
| CHD |
£1,789 |
£1,437 |
see above |
| CHD and Diabetes |
£2,395 |
£1,951 |
see above |
| Breast cancer |
n/a |
£3,028 |
see above |
| Stroke |
£3,041 |
£2,431 |
see above |
| Stroke and Hypertension |
£3,789 |
£2,956 |
see above |
| Liver disease |
£4,528 |
£3,822 |
see above |
| Sleep apnoea |
£1,104 |
£1,104 |
Cost-effectiveness of using continuous positive airway pressure in the treatment of severe obstructive sleep apnoea/hypopnoea syndrome in the UK (see here, 2008 prices) |
| Depression |
£975 |
£1,064 |
see above |
| Musculoskeletal disorders |
£719 |
£719 |
HEE: A retrospective review of the influences, milestones, policies and practice developments in the First contact MSK model Available here (2011 prices) |
| Colorectal cancer |
£7,547 |
£7,209 |
see above |
| Ovarian cancer |
n/a |
£1,894 |
Bariatric surgery, lifestyle interventions and orlistat for severe obesity: the REBALANCE mixed-methods systematic review and economic evaluation, Table 50 Available here (2016 prices) |
| Kidney cancer |
£558 |
£558 |
see above |
| Oesophageal cancer |
£12,865 |
£12,865 |
see above |
Source: Frontier Economics
Note: Costs reported in this table are incremental costs derived from the listed conditions; for this, we have subtracted the 'baseline' costs included in the PHE report, which account for care and treatment received by individuals without these conditions.
Due to data limitations, we don't consider cost savings derived from treating depression or liver disease simultaneously with other obesity-related conditions. The impact of this is likely to be minor.
| Illness |
PAF – men |
PAF – women |
Source |
| Type 2 diabetes |
48% |
75.3% |
National Audit Office: Tackling Obesity in England (2001) |
| Hypertension |
26% |
45.4% |
see above |
| CHD |
14.4% |
18.3% |
see above |
| Osteoarthritis |
16.5% |
9.4% |
see above |
| Stroke |
6.2% |
7.2% |
see above |
| Colorectal cancer |
30.6% |
30.7% |
see above |
| Ovarian cancer |
n/a |
15.4% |
see above |
| Kidney cancer |
21.2% |
28.3% |
Brown et al. (2015). The fraction of cancer attributable to modifiable risk factors in England, Wales, Scotland, Northern Ireland, and the United Kingdom in 2015. British Journal of Cancer. Available here |
| Liver cancer |
23.4% |
23.1% |
see above |
| Breast cancer |
- |
8.4% |
see above |
| Oesophageal cancer |
31.6% |
17.0% |
see above |
Source: Frontier Economics
| Illness |
Prevalence – men |
Prevalence – women |
Source |
| Hypertension |
17.6% |
13.9% |
Frontier Economics based on Fingertips (available here) |
| Type 2 diabetes |
6.6% |
5.1% |
Frontier Economics based on Diabetes.org (available here) |
| Musculoskeletal disorders |
15.8% |
20.9% |
Office for Health Improvement and Disparities (available here) |
| Sleep apnoea |
2.6% |
2.6% |
Frontier Economics estimate of prevalence for all population based on prevalence amongst people living with obesity from Obstructive Sleep Apnoea in Obese Patients: a UK Population Analysis (see here) |
| Liver disease (diagnosed NASH) |
0.8% |
0.8% |
Frontier Economics based on Disease burden and economic impact of diagnosed nonalcoholic steatohepatitis (NASH) in the United Kingdom (UK) in 2018 (see here) |
| CHD (w/o diabetes) |
2.1% |
2.1% |
Frontier Economics based on Fingertips and Heron et al. (2019). Direct Healthcare Costs of Sedentary Behaviour in the UK. Journal of Epidemiology & Community Health, 73(7), 625-629. |
| CHD and Diabetes |
0.9% |
0.9% |
Heron et al. (2019). Direct Healthcare Costs of Sedentary Behaviour in the UK. Journal of Epidemiology & Community Health, 73(7), 625-629. |
| Stroke (w/o hypertension) |
0.9% |
0.9% |
Stroke.org (available here) |
| Stroke and Hypertension |
1.0% |
1.0% |
Wu et al. (2015). High Blood Pressure and All-Cause and Cardiovascular Disease Mortalities in Community-Dwelling Older Adults. Medicine (Baltimore). 2005, 94(47) |
| Colorectal cancer |
0.08% |
0.06% |
House of Commons Library (available here) |
| Ovarian Cancer |
- |
0.02% |
House of Commons Library (available here) |
Source: Frontier Economics
Note: Where data is available, we consider prevalence based on diagnosed disease (rather than estimates including both diagnosed and undiagnosed cases). This approach is conservative, as undiagnosed individuals are likely to incur lesser costs to the NHS
Healthcare costs due to mental health conditions
Obesity is associated with higher prevalence of mental health conditions, including depression, anxiety and eating disorders. We find that the empirical evidence points to stronger causal links between obesity and depression/anxiety - which are highly correlated - while for eating disorders there are complex bidirectional effects (eating disorders can lead to obesity, just as obesity can lead to eating disorders).
Due to the challenge of unpacking the causal relationship of obesity in driving eating disorders, and due to the strong correlation between obesity and anxiety (which could lead to double counting of costs) we have focused our analysis of mental health costs on depression.
We have previously relied on healthcare costs estimated of depression from Public Health England data. Upon further review we find this is still likely the best available estimate of the incremental costs associated with treating depression patients. Indeed, most of the alternative and more recent evidence we have seen focuses on mental health more broadly.
To estimate the impact of obesity on depression prevalence, we continue to rely on evidence from Luppino et al (2010). They conduct a meta-analysis of the longitudinal relationship between depression and obesity. Their analysis includes 15 papers with over 58,000 collective observations and controls for various moderators such as sex, age and depression severity. They find that the odds ratio of living with obesity at baseline and depression at follow-up was 1.55 relative to individuals who were healthy-weight at baseline. The findings are broadly consistent with those in alternative research. Another advantage of Luppino et al (2010) is that it uses a definition of depression which includes a clinical assessment, as opposed to relying on self-reported depressive symptoms of mental health issues.
Finally, we proxy baseline depression rates in the UK by combining evidence on the proportion of adults that report moderate to severe depression symptoms, with the proportion of individuals with common mental health conditions accessing treatment (37%). The proportion of adults reporting moderate to severe depression symptoms ranges from 16% in England, 19% in Northern Ireland and 13% in Scotland. For Wales, we have used the proportion in Great Britain, which is 16%. The resulting prevalence of diagnosed depressed cases (i.e. those cases directly leading to healthcare costs) is estimated to be around 6% for England and Scotland, 4.8% for Scotland and 7.1% for Northern Ireland.
We focused on the costs of formal social care funded by local authorities. The cost of privately-funded social care is not included in our analysis. However, the 'opportunity cost' of providing informal social care, for example by family members of people with obesity, is considered below.
Two components were estimated:
- Care hours per person: we drew upon academic literature to estimate the average additional local authority funded formal social care needs due to obesity for individuals aged 65 and over. Care needs were estimated based on self-reported needs of individuals with BMI levels between 30 and 40 , and are measured in terms of hours of care per year. These estimates take into account the fact that not all individuals with obesity aged 65 and over require social care services, which drives down the average. As the underlying literature for these estimates is based upon self-reported social care needs, we have applied a downwards adjustment (of around 60%) to account for the fact that not everyone who requests formal social care support actually receives it.
- Cost of care per hour: we used well established sector estimates of the cost of delivering an hour of social care in England, adjusted to 2025 prices.
The product of the two components above gives our monetary estimate of annual social care costs funded by the local authority, per person with obesity aged 65 and over due to obesity.
We also consider the costs associated with social care services for adults below 65. For this, we rely on Greater Manchester healthcare data to compare the relative usage of social care packages between adults with obesity below 65 to usage of those above 65. We apply this proportion to social care costs of elder individuals to estimate costs of those below 65, recognizing that there is more uncertainty around social care costs due to obesity for individuals below 65 than for those above 65. When employing this approach, we are effectively assuming that the ratio of social care patterns amongst individuals below and above 65 in Greater Manchester is the same as across the UK.
The inputs and assumptions for our estimates are based on the data sources listed below.
Alongside – or as a substitute for – formal social care, many individuals rely upon informal care provided by family or friends. These are non-financial, 'opportunity costs', borne by these carers, based upon the time spent providing informal care which could have instead been spent in another way (e.g. additional work, or additional leisure). We estimated these costs in monetary terms by combining the following components:
- Informal care burden per individual: we drew upon published literature which estimates the number of hours of informal care required by individuals with obesity, compared with individuals not living with obesity.
- Average cost per case: these are non-financial costs borne by individuals. We convert these costs into monetary terms by valuing each hour of informal care provided at the DfT value of time (£7.48).
The average cost per individual with obesity is the product of these two components.
Table 26 Costs of formal social care – inputs and assumptions
| Inputs and assumptions |
Estimate |
Source |
| Hourly cost of a social care worker (2025 prices) |
£28 |
Community based social care unit costs (2022): (available here), page 80 |
| Proportion of those requiring social care that receive social care |
39% |
The King's Fund (available here) |
| Additional social care hours per individual with Class I/II obesity per year (relative to healthy weight), aged 65+ |
4.3 |
Copley et al. (2017). Estimating the variation in need for community-based social care by body mass index in England and associated cost: population-based cross-sectional study. BMC Public Health. Table 4, values from Model 3 (available here) |
| Additional social care hours per individual with Class III obesity per year (relative to healthy weight), aged 65+ |
7.6 |
Copley et al. (2017). Estimating the variation in need for community-based social care by body mass index in England and associated cost: population-based cross-sectional study. BMC Public Health. Table 4, values from Model 3 (available here) |
| Additional social care hours per individual with Overweight per year (relative to healthy weight), aged 65+ |
0.6 |
Copley et al. (2017). Estimating the variation in need for community-based social care by body mass index in England and associated cost: population-based cross-sectional study. BMC Public Health. Table 4, values from Model 3 (available here) |
| Proportion of care needed for adults below 65 |
24% |
Frontier Economics |
Source: Frontier economics
Table 27 Costs of informal social care – inputs and assumptions
| Inputs and assumptions |
Estimate |
Source |
| Opportunity cost of time spent on informal care (2025 prices) |
£7.48 |
DfT A1.3.2 Non-working, other. 2025 prices. |
| Additional informal care hours per individual with Class I/II obesity per year (relative to healthy weight), aged 65+ |
147.6 |
Copley et al. (2017). Estimating the variation in need for community-based social care by body mass index in England and associated cost: population-based cross-sectional study. BMC Public Health. Table 4, values from Model 3 (available here) |
| Additional informal care hours per individual with Class III obesity per year (relative to healthy weight), aged 65+ |
258.8 |
Copley et al. (2017). Estimating the variation in need for community-based social care by body mass index in England and associated cost: population-based cross-sectional study. BMC Public Health. Table 4, values from Model 3 (available here) |
| Additional informal care hours per individual with Overweight per year (relative to healthy weight), aged 65+ |
19.6 |
Copley et al. (2017). Estimating the variation in need for community-based social care by body mass index in England and associated cost: population-based cross-sectional study. BMC Public Health. Table 4, values from Model 3 (available here) |
| Proportion of care needed for adults below 65 |
24% |
Frontier Economics |
Source: Frontier economics
Individuals living with obesity experience poorer health-related quality of life (HRQoL) outcomes. These are non-financial costs, but can be valued in monetary terms. We estimated these costs by combining the following components:
- Quality of life loss per individual: we drew upon published literature which has considered the quality of life of individuals living with obesity, compared with individuals without obesity. This evidence explores how HRQoL compares for individuals with overweight, Class I/II and Class III obesity. HRQoL losses are reported as a reduction in Quality Adjusted Life Years (QALYs).
- Average cost per case: these are non-financial costs borne by individuals. We follow UK Government best-practice in valuing these QALY reductions. We value each QALY lost using the Green Book value of £70,000 per QALY, and update these to January 2025 prices (£84,928).
The overall costs to individuals are the product of these two components.
Table 28 Data sources – QALY losses
| Inputs and assumptions |
Estimate |
Source |
| QALYs lost due to Class I/II Obesity |
0.031-0.032 (depending on age) |
Managing Overweight and Obesity among Adults, page 30-31. Available here |
| QALYs lost due to Class III Obesity |
0.107 |
See above |
| QALYs lost due to overweight |
0.005 |
See above |
Source: Frontier economics
Methodological differences
While we have closely followed the approach in our previous work for Lily and Health Innovation Manchester (Cost of obesity in Greater Manchester, June 2024) to estimate costs associated with healthcare, formal and informal social care costs, as well as costs to individuals associated with reduction in Health-related quality of life, we have made a few changes. These include:
- Using UK data: updating the estimates based on data on disease prevalence and average earnings in the UK.
- Accounting for inflation: updating costs to January 2025 prices.
- QALY's valuation: valuing each QALY's using Green Book's value of £70,000 (£84,928 in 2025 prices) per QALY as opposed to NICE's value. While NICE typically uses a lower threshold for NHS decision-making, the Green Book figure is more appropriate for public health and cross-government analysis. Both are credible; the choice depends on the policy context.
- Opportunity cost of time: valuing the opportunity cost of the time spent on informal care at the DfT value of leisure time (£7.48).
A.10 Comparison with previous estimates
Previous studies which have considered the costs of obesity and overweight, including contributions from Frontier Economics, have provided varying estimates of these costs. Different studies have included different categories of costs, used slightly different methodologies or assumptions, and relied on different data sources, including newer data as it has become available. The table below compares the estimates in this report with estimates from Frontier Economics' work for the Tony Blair Institute in 2023 and provides more details for certain cost areas. Across all cost areas, there are a number of key differences in this report compared with TBI (2023). This report:
- uses updated 2025 estimates of obesity/overweight prevalence. The number of individuals with obesity in the TBI analysis was 14.1 million, whereas our analysis estimates 18.1 million due to both natural increases in prevalence and the adjustments we have accounted for as described previously (e.g. NICE recommendations to use lower BMI thresholds of obesity for certain ethnicities).
- updated NICE definition of obesity and overweight using lower BMI thresholds for people from Black, Asian, and other minoritised ethnic groups;
- undertakes separate calculations for Class I/II obesity and Class III obesity; and
- updates all values to 2025 prices.
Table 29 Comparison of cost estimates with TBI (2023)
| Cost area |
This report |
TBI (2023) |
Key differences in this report |
| Inactivity |
£12.1 bn |
£8.8 bn |
This report is based on an alternative paper (Campbell et al 2021). Our approach is more conservative as we model the impact of obesity on employment via exit of the labour market via sickness / disability. Our review of the empirical evidence in this field leads us to the conclusion that this channel is the most robust and credible causal mechanism. For overweight, the approach follows the TBI analysis. |
| Absenteeism |
£8.3 bn |
£6.3 bn |
This report uses the TBI approach for overweight. TBI (2023) draws upon a model from Harvey et al (2010), which estimates the prospective association between BMI and sickness absence. For obesity, this report also relies upon Harvey et al (2010), but has been more conservative, drawing directly from the Odds Ratios from this paper. |
| Presenteeism |
£9.7 bn |
- |
Not considered in TBI (2023) |
| Mortality |
£0.7 bn |
- |
|
| NHS costs |
£12.6 bn |
£19.2 bn |
More conservative estimate focused on diagnosed, rather than estimated, prevalence of related illnesses. Improved estimates of overweight costs informed by real-world differences in health expenditure by weight status. |
| Social care |
£1.2 bn |
£0.5 bn |
TBI (2023) only estimated for individuals over 65. We consider it reasonable that individuals below 65 require social care, but only at a fraction of the rate of those over 65. |
| QALY losses |
£71.5 bn |
£56.6 bn |
The approach of our paper is the same as TBI (2023). Differences are driven by changes in prevalence and prices. |
| Informal care |
£10.0 bn |
£6.5 bn |
TBI (2023) only estimated for individuals over 65. We consider it reasonable that individuals below 65 require informal care, but only at a fraction of the rate of those over 65. Further, we assume the opportunity cost is the value of time provided by DfT, rather than the median hourly wage. |
| Total cost |
£126 bn |
£97.9 bn |
|
Source: Frontier Economics
A.11 Additional tables of results
Table 30 Avoided productivity costs under different scenarios of reduction in the prevalence of obesity
|
1% |
2% |
5% |
10% |
15% |
20% |
25% |
40% |
50% |
| Obesity prevalence reduction |
(0.1%) |
(0.2%) |
(0.5%) |
(1%) |
(1.5%) |
(2%) |
(2.5%) |
(4%) |
(5%) |
| (Overweight) |
|
|
|
|
|
|
|
|
|
| Presenteeism |
£97 m |
£195 m |
£487 m |
£974 m |
£1.5 bn |
£1.9 bn |
£2.4 bn |
£3.9 bn |
£4.9 bn |
| Inactivity |
£89 m |
£177 m |
£444 m |
£887 m |
£1.3 bn |
£1.8 bn |
£2.2 bn |
£3.5 bn |
£4.4 bn |
| Absenteeism |
£52 m |
£105 m |
£262 m |
£524 m |
£0.8 bn |
£1.0 bn |
£1.3 bn |
£2.1 bn |
£2.6 bn |
| Mortality |
£7 m |
£14 m |
£34 m |
£68 m |
£0.1 bn |
£0.1 bn |
£0.2 bn |
£0.3 bn |
£0.3 bn |
| Productivity |
£0.2 bn |
£0.5 bn |
£1.2 bn |
£2.5 bn |
£3.7 bn |
£4.9 bn |
£6.1 bn |
£9.8 bn |
£12.3 bn |
| NHS costs |
£97 m |
£193 m |
£484 m |
£967 m |
£1.5 bn |
£1.9 bn |
£2.4 bn |
£3.9 bn |
£4.8 bn |
| Social care |
£10 m |
£21 m |
£51 m |
£103 m |
£0.2 bn |
£0.2 bn |
£0.3 bn |
£0.4 bn |
£0.5 bn |
| QALY losses |
£641 m |
£1,281 m |
£3,203 m |
£6,405 m |
£9.6 bn |
£12.8 bn |
£16.0 bn |
£25.6 bn |
£32.0 bn |
| Informal care |
£94 m |
£188 m |
£469 m |
£939 m |
£1.4 bn |
£1.9 bn |
£2.3 bn |
£3.8 bn |
£4.7 bn |
| Wider costs |
£0.8 bn |
£1.7 bn |
£4.2 bn |
£8.4 bn |
£12.6 bn |
£16.8 bn |
£21.0 bn |
£33.7 bn |
£42.1 bn |
| Total |
£1.1 bn |
£2.2 bn |
£5.4 bn |
£11 bn |
£16 bn |
£22 bn |
£27 bn |
£43 bn |
£54 bn |
Source: Frontier Economics
Table 31 Forecasted productivity costs by year
| Year |
2025 |
2026 |
2027 |
2028 |
2029 |
2030 |
2031 |
2032 |
2033 |
2034 |
2035 |
| Prevalence, overweight |
34.8% |
34.7% |
34.6% |
34.5% |
34.5% |
34.4% |
34.3% |
34.3% |
34.2% |
34.2% |
34.1% |
| Prevalence, Class I/II |
28.4% |
28.8% |
29.0% |
29.2% |
29.4% |
29.7% |
29.9% |
30.1% |
30.3% |
30.4% |
30.6% |
| Prevalence, Class III |
4.2% |
4.3% |
4.5% |
4.5% |
4.7% |
4.8% |
5.0% |
5.1% |
5.2% |
5.4% |
5.5% |
| Presenteeism |
£9.7 bn |
£10.0 bn |
£10.3 bn |
£10.5 bn |
£10.7 bn |
£10.9 bn |
£11.2 bn |
£11.4 bn |
£11.6 bn |
£11.8 bn |
£12.0 bn |
| Inactivity |
£12.1 bn |
£12.3 bn |
£12.6 bn |
£12.7 bn |
£13.0 bn |
£13.2 bn |
£13.4 bn |
£13.6 bn |
£13.8 bn |
£14.0 bn |
£14.2 bn |
| Absenteeism |
£8.3 bn |
£8.4 bn |
£8.5 bn |
£8.6 bn |
£8.7 bn |
£8.8 bn |
£8.9 bn |
£9.0 bn |
£9.1 bn |
£9.2 bn |
£9.3 bn |
| Mortality |
£0.7 bn |
£0.7 bn |
£0.7 bn |
£0.7 bn |
£0.7 bn |
£0.7 bn |
£0.8 bn |
£0.8 bn |
£0.8 bn |
£0.8 bn |
£0.8 bn |
| Productivity costs |
£30.8 bn |
£31.3 bn |
£32.0 bn |
£32.5 bn |
£33.2 bn |
£33.7 bn |
£34.3 bn |
£34.8 bn |
£35.2 bn |
£35.8 bn |
£36.3 bn |
| NHS costs |
£12.6 bn |
£12.8 bn |
£13.0 bn |
£13.2 bn |
£13.4 bn |
£13.6 bn |
£13.8 bn |
£14.0 bn |
£14.1 bn |
£14.3 bn |
£14.5 bn |
| Social care |
£1.2 bn |
£1.2 bn |
£1.2 bn |
£1.2 bn |
£1.2 bn |
£1.3 bn |
£1.3 bn |
£1.3 bn |
£1.3 bn |
£1.3 bn |
£1.3 bn |
| QALY losses |
£71.4 bn |
£72.9 bn |
£74.7 bn |
£75.8 bn |
£77.5 bn |
£78.8 bn |
£80.3 bn |
£81.5 bn |
£82.7 bn |
£84.2 bn |
£85.3 bn |
| Informal care |
£10.5 bn |
£10.7 bn |
£10.9 bn |
£11.1 bn |
£11.3 bn |
£11.4 bn |
£11.6 bn |
£11.7 bn |
£11.9 bn |
£12.0 bn |
£12.2 bn |
| Wider costs |
£95.7 bn |
£97.6 bn |
£99.8 bn |
£101 bn |
£103 bn |
£105 bn |
£107 bn |
£108 bn |
£110 bn |
£112 bn |
£113 bn |
| Total cost |
£126 bn |
£129 bn |
£132 bn |
£134 bn |
£137 bn |
£139 bn |
£141 bn |
£143 bn |
£145 bn |
£148 bn |
£150 bn |
Source: Frontier Economics
10 Bibliography
Aghion, P. and Howitt, P.W., 2008. The economics of growth. MIT press.
Bajorek, Z. and Bevan, S., 2020. Obesity stigma at work: Improving inclusion and productivity. Brighton Institute for Employment Studies.
Barbieri, P.N., 2018. BMI and employment: Is there an overweight premium?. Italian Economic Journal, 4(3), pp.523-548.
Borrell, L.N. and Samuel, L., 2014. Body mass index categories and mortality risk in US adults: the effect of overweight and obesity on advancing death. American journal of public health, 104(3), pp.512-519.
Bloom, D.E., Sachs, J.D., Collier, P. and Udry, C., 1998. Geography, demography, and economic growth in Africa. Brookings papers on economic activity, 1998(2), pp.207-295.
Camacho-Barcia, L., Giel, K.E., Jiménez-Murcia, S., Pitti, J.Á., Micali, N., Lucas, I., Miranda-Olivos, R., Munguia, L., Tena-Sempere, M., Zipfel, S. and Fernández-Aranda, F., 2024. Eating disorders and obesity: bridging clinical, neurobiological, and therapeutic perspectives. Trends in Molecular Medicine, 30(4), pp.361-379.
Campbell, D.D., Green, M., Davies, N., Demou, E., Ward, J., Howe, L.D., Harrison, S., Johnston, K.J., Strawbridge, R.J., Popham, F. and Smith, D.J., 2021. Effects of increased body mass index on employment status: a Mendelian randomisation study. International Journal of Obesity, 45(8), pp.1790-1801.
Chen, W., Feng, J., Jiang, S., Guo, J., Zhang, X., Zhang, X., Wang, C., Ma, Y. and Dong, Z., 2023. Mendelian randomization analyses identify bidirectional causal relationships of obesity with psychiatric disorders. Journal of Affective Disorders, 339, pp.807-814.
Copley, V.R., Cavill, N., Wolstenholme, J., Fordham, R. and Rutter, H., 2017. Estimating the variation in need for community-based social care by body mass index in England and associated cost: population-based cross-sectional study. BMC Public Health, 17, pp.1-11.
Dall, T.M., Sapra, T., Natale, Z., Livingston, T. and Chen, F., 2024. Assessing the economic impact of obesity and overweight on employers: identifying opportunities to improve work force health and well-being. Nutrition & Diabetes, 14(1), pp.1-8.
De Heredia, F.P., Gómez-Martínez, S. and Marcos, A., 2012. Obesity, inflammation and the immune system. Proceedings of the Nutrition Society, 71(2), pp.332-338.
Faeh, D., Braun, J., Tarnutzer, S. and Bopp, M., 2011. Obesity but not overweight is associated with increased mortality risk. European journal of epidemiology, 26, pp.647-655.
Faith, M.S., Butryn, M., Wadden, T.A., Fabricatore, A., Nguyen, A.M. and Heymsfield, S.B., 2011. Evidence for prospective associations among depression and obesity in population-based studies. Obesity Reviews, 12(5), pp.e438-e453.
Finkelstein, E.A., daCosta DiBonaventura, M., Burgess, S.M. and Hale, B.C., 2010. The costs of obesity in the workplace. Journal of Occupational and Environmental Medicine, 52(10), pp.971-976.
Flegal, K.M., Kit, B.K., Orpana, H. and Graubard, B.I., 2013. Association of all-cause mortality with overweight and obesity using standard body mass index categories: a systematic review and meta-analysis. Jama, 309(1), pp.71-82.
Fruh, S.M., 2017. Obesity: Risk factors, complications, and strategies for sustainable long-term weight management. Journal of the American association of nurse practitioners, 29(S1), pp.S3-S14.
Fulton, S., Décarie-Spain, L., Fioramonti, X., Guiard, B. and Nakajima, S., 2022. The menace of obesity to depression and anxiety prevalence. Trends in Endocrinology & Metabolism, 33(1), pp.18-35.
Gates, D.M., Succop, P., Brehm, B.J., Gillespie, G.L. and Sommers, B.D., 2008. Obesity and presenteeism: the impact of body mass index on workplace productivity. Journal of occupational and environmental medicine, 50(1), pp.39-45.
Goettler, A., Grosse, A. and Sonntag, D., 2017. Productivity loss due to overweight and obesity: a systematic review of indirect costs. BMJ open, 7(10), p.e014632.
Goetzel, R.Z., Gibson, T.B., Short, M.E., Chu, B.C., Waddell, J., Bowen, J., Lemon, S.C., Fernandez, I.D., Ozminkowski, R.J., Wilson, M.G. and DeJoy, D.M., 2010. A multi-worksite analysis of the relationships among body mass index, medical utilization, and worker productivity. Journal of occupational and environmental medicine, 52(1S), pp.S52-S58.
Gómez-Martínez, S., Marcos, A. and de Heredia, F.P., 2012. Obesity, inflammation and the immune system. Proc Nutr Soc, 71(2), pp.332-8.
Harrison, S., Dixon, P., Jones, H.E., Davies, A.R., Howe, L.D. and Davies, N.M., 2021. Long-term cost-effectiveness of interventions for obesity: A mendelian randomisation study. PLoS medicine, 18(8), p.e1003725.
Harvey, S.B., Glozier, N., Carlton, O., Mykletun, A., Henderson, M., Hotopf, M. and Holland-Elliott, K., 2010. Obesity and sickness absence: results from the CHAP study. Occupational medicine, 60(5), pp.362-368.
Herrera, B.M. and Lindgren, C.M., 2010. The genetics of obesity. Current diabetes reports, 10, pp.498-505.
Keramat, S.A., Alam, K., Gow, J. and Biddle, S.J., 2021. Impact of disadvantaged neighborhoods and lifestyle factors on adult obesity: evidence from a 5-year cohort study in Australia. American Journal of Health Promotion, 35(1), pp.28-37.
Kesaite, V. and Greve, J., 2024. The impact of excess body weight on employment outcomes: A systematic review of the evidence. Economics & Human Biology, p.101398.
Kim, T.J. and von dem Knesebeck, O., 2018. Income and obesity: what is the direction of the relationship? A systematic review and meta-analysis. BMJ open, 8(1), p.e019862.
Kraft, B., Bø, R., Jonassen, R., Heeren, A., Ulset, V.S., Stiles, T.C. and Landrø, N.I., 2023. The association between depression symptoms and reduced executive functioning is primarily linked by fatigue. Psychiatry Research Communications, 3(2), p.100120.
Krueger, A.B. and Lindahl, M., 2001. Education for growth: Why and for whom?. Journal of economic literature, 39(4), pp.1101-1136.
Le Strat, Y., Melchior, M., Gorwood, P., Tebeka, S. and Dubertret, C., 2020. The role of comorbidity in the association of obesity with unemployment and disability. Annals of Epidemiology, 45, pp.61-68.
Luppino, F.S., de Wit, L.M., Bouvy, P.F., Stijnen, T., Cuijpers, P., Penninx, B.W. and Zitman, F.G., 2010. Overweight, obesity, and depression: a systematic review and meta-analysis of longitudinal studies. Archives of general psychiatry, 67(3), pp.220-229.
Milaneschi, Y., Simmons, W.K., van Rossum, E.F. and Penninx, B.W., 2019. Depression and obesity: evidence of shared biological mechanisms. Molecular psychiatry, 24(1), pp.18-33.
Morris, S., 2007. The impact of obesity on employment. Labour Economics, 14(3), pp.413-433.
Nelson, R.R. and Phelps, E.S., 1966. Investment in humans, technological diffusion, and economic growth. The American economic review, 56(1/2), pp.69-75.
Ricci, J.A. and Chee, E., 2005. Lost productive time associated with excess weight in the US workforce. Journal of occupational and environmental medicine, 47(12), pp.1227-1234.
Robroek, S.J., Reeuwijk, K.G., Hillier, F.C., Bambra, C.L., van Rijn, R.M. and Burdorf, A., 2013. The contribution of overweight, obesity, and lack of physical activity to exit from paid employment: a meta-analysis. Scandinavian journal of work, environment & health, pp.233-240.
Romer, P.M., 1990. Endogenous technological change. Journal of political Economy, 98(5, Part 2), pp.S71-S102.
Stabouli, S., Erdine, S., Suurorg, L., Jankauskienė, A. and Lurbe, E., 2021. Obesity and eating disorders in children and adolescents: The bidirectional link. Nutrients, 13 (12), 4321
Topakas, A., Admasachew, L. and Dawson, J.F., 2010. J-Employee health and well-being in the NHS: A trust level analysis.
Tunceli, K., Li, K. and Williams, L.K., 2006. Long-term effects of obesity on employment and work limitations among US adults, 1986 to 1999. Obesity, 14(9), pp. 1637-1646.
Vuong, K., Kabir, A., Conway, D.P., Williamson, M., Harris, M.F. and Barr, M.L., 2024. Identifying risk factors for developing obesity: a record linkage longitudinal study in metropolitan Sydney using the 45 and Up Study. Family Practice, 41(5), pp.680-692.
Wee, C.C., Phillips, R.S., Legedza, A.T., Davis, R.B., Soukup, J.R., Colditz, G.A. and Hamel, M.B., 2005. Health care expenditures associated with overweight and obesity among US adults: importance of age and race. American Journal of Public Health, 95(1), pp.159-165.
Frontier Economics Ltd is a member of the Frontier Economics network, which consists of two separate companies based in Europe (Frontier Economics Ltd) and Australia (Frontier Economics Pty Ltd). Both companies are independently owned, and legal commitments entered into by one company do not impose any obligations on the other company in the network. All views expressed in this document are the views of Frontier Economics Ltd.
WWW.FRONTIER-ECONOMICS.COM