


Around two-thirds of adults in the UK are living with excess weight or obesity. Nesta’s Blueprint for halving obesity shows that only a small number of policies are likely to deliver large reductions in obesity. Taxes that target less healthy food are one such option.
At the moment, little is known about how a tax based on a food’s overall healthiness (such as the UK’s nutrient profiling model), rather than individual nutrients, might work or the impact it might have when applied to specific categories of unhealthy foods. Our work fills this gap.
We modelled the potential health and economic impact of this NPM-based tax on categories of unhealthy foods purchased to eat at home. Our analysis suggests an NPM-based tax could meaningfully improve people’s diets and reduce obesity, with modest increases in spend on food eaten at home.
However, choosing whether and how to introduce a food tax is ultimately a policy and political judgement, balancing health benefits, consumer costs, and feasibility for industry.
What's in the report
- We reviewed examples of food taxes and other taxes on goods like alcohol and tobacco from the UK and around the world. In our review, we identified a gap in the evidence around how a tax based on a food’s overall healthiness (measured by the UK NPM score) could work in the UK.
- The World Health Organisation recommends NPM as a strong measure to base a food tax on. The NPM is already established in existing UK legislation, and might give businesses greater flexibility in how they make foods healthier than a tax based on individual nutrients.
- We applied an NPM-based tax to target the 12 categories of foods (e.g. breakfast cereals, ice creams, and morning goods) that contribute most to our ill-health, as defined in existing UK restrictions on promotions, placement, and advertising on unhealthy foods. This exempts healthier foods from paying a tax. We assume the tax is applied to manufacturers of such unhealthy foods.
- We commissioned Oxford Economics to model the impact of an NPM-tax on calories and salt consumed, the price of food, and tax revenue. To reflect uncertainty in our assumptions, Oxford Economics modelled a range of scenarios varying in how consumers or producers might respond when faced with such a tax.
- Our findings suggest that an NPM-based tax could deliver meaningful improvements in people’s diets and health, and could reduce the prevalence of adult obesity by 16-19% (with and without compensation).
- Our modelling also shows that an NPM-based tax would likely increase the average price of a typical food basket for consumers by around 1%. While groceries that are classed as ‘healthy’ shouldn’t increase in cost, some of the most unhealthy products would see higher price rises.
Findings/recommendations
An NPM-based tax could deliver health benefits in a similar range to other high-impact obesity policies (such as the proposed National Food Strategy salt and sugar levy or the recently announced healthy food standard). While there is no silver bullet to tackle obesity, and food taxes represent a powerful potential route to reducing obesity levels, the introduction of any new tax comes with trade-offs for the government.
At present, there is a high-impact obesity reduction policy already on the table: the healthy food standard, based on Nesta’s proposal on health targets for large food retailers. We believe this policy has the greatest potential to impact obesity levels in the near future, while being low-cost to the government and consumers. Nesta's priority remains the timely and effective implementation of this policy.
- Executive summary
- The case for action on obesity and where the right policy solutions lie
- What we already know about food taxes, and where our work fits in
- How a tax on unhealthy foods could reduce the prevalence of obesity
- International evidence on unhealthy food taxes, and where the gaps lie
- What to tax: How we defined which products and nutrients to target
- How to tax: The different components to consider while designing a food tax
- The NPM-based tax design we chose to model, and why
- 1. Where in the supply chain is the tax applied?
- 2. How is the tax rate calculated?
- 3. What is the tax rate?
- 4. Do all products pay the same rate, or do rates vary?
- 5. Is there a threshold, or minimum/maximum point at which no tax is paid?
- Figure 6: Visualisation of a £0.06 per kilo tax on unhealthy foods
- How we modelled the impact of an NPM-based tax
- Results: The potential health and economic impacts of an NPM-based tax
- Potential impact on food prices and consumer spend
- Figure 8: A higher tax rate could lead to greater health impact, but would come with higher price rises for foods bought to consume at home
- Potential social benefits generated by an NPM-based tax
- Figure 9: An NPM-based tax could lead to large social, economic, and health benefits
- Figure 10: Comparing the impact of an NPM tax to other high-impact obesity policies
- Considerations while assessing the impact of an NPM-based tax
- Conclusion
- Technical appendix
- Background
- 1: Preparing the dataset for analysis
- 1A: Determining products that would fall under a category-specific NPM-based tax
- 1B: Preparing sub-market data for the impact model
- Figure 11: Description of the sub-markets and in-scope 'super' categories used as inputs for the impact modelling
- Table 1: Mapping of in-scope 'super' categories to legislative categories from regulations restricting promotion, placement, and advertising of HFSS foods
- Table 2: In-scope sub-markets as a share of all food consumed by adults at home
- 2: Defining the tax structure of an NPM-based tax
- 3: Running the impact model to generate nutrient reductions, impact on prices, and tax revenue raised
- 3A: How the impact model is set up
- Figure 12: A food tax works in two complementary ways: producers reformulate unhealthy food, and/or consumers buy less unhealthy food in response to price changes
- 3B: Input scenarios for producer reformulation response
- Model output: Share of in-scope products reformulating
- Model output: Changes in prices
- 3C: Price elasticities to determine the consumer response
- 3D: Subsequent reductions in calories and salt consumption
- 4: Modelling reductions in prevalence of obesity and the associated social benefits
- Endnotes
Executive summary
- Around two-thirds of adults in the UK are living with obesity and excess weight, with growing costs for individuals, the NHS, and the wider economy. Nesta's Blueprint for halving obesity shows that only a few policies have the potential to deliver large reductions in the prevalence of obesity. Taxes that target less healthy food are one such option.
- The UK Soft Drinks Industry Levy (SDIL) demonstrates how well-designed taxes can drive reformulation and improve diets. There is no equivalent tax on unhealthy foods in the UK, although a major proposal was set out in the National Food Strategy 2021 in the form of a tax on sugar and salt, with the potential to reduce obesity by over 10%.
- In this report, we add to the evidence base by exploring the potential impact of an alternative approach: a tax based on the Nutrient Profiling Model (NPM), a holistic measure of the healthiness of foods. We assume unhealthy foods (those that score over NPM 4) are taxed based on their NPM score, at a rate of £0.06 per kilo for every 1 point increase in NPM. For example, an unhealthy pizza scoring NPM 4 would pay £0.06 per kilo in tax, while an unhealthy chocolate scoring NPM 20 would pay £1.02 per kilo in tax, assuming no reformulation. A healthy product, like baked crisps scoring NPM 2, would pay zero tax.
- We apply an NPM-based tax on specific categories of less healthy, non-staple 'discretionary' foods, as covered in existing legislation restricting placement and promotion and advertising of unhealthy food. This helps target the foods that are worst for our health, while protecting staple foods (eg, fresh fruit and vegetables, meat, bread, or some cooking sauces) and healthier foods from potential price increases.
- A tax based on the NPM score incentivises improvements across a wide range of products. It gives food producers flexibility in how they improve the healthiness of products, for example, through small changes in nutrients like saturated fats, sugar, salt, and fibre. The NPM is a robust measure used in existing UK legislation, and the World Health Organization suggests that the NPM is a strong base for designing effective food taxes. The NPM is also the basis of Nesta's proposal for health targets for large food retailers, which forms a core part of the UK government's healthy food standard announced in 2025.
- We modelled the impact of an NPM-based tax targeting specific categories of foods purchased to consume at home, in line with existing restrictions on the placement or advertising of less healthy foods. We commissioned Oxford Economics, an economic consultancy, to model the impact of this NPM tax on nutrient intake, food prices, and tax revenue, testing a range of scenarios to reflect uncertainty in how businesses and consumers might respond.
- Our modelling suggests that an NPM-based tax could deliver large health benefits. In our central scenario, we estimated that adult obesity prevalence in the UK could fall by 16-19% over five years. Across lower, more conservative and higher, more ambitious reformulation scenarios, the reductions in adult obesity range from 13% to 32%. An NPM tax could raise up to £1.6 billion annually in tax revenues in the central scenario, while resulting in modest average price increases of around 1% for the full food basket consumed at home.
- These findings suggest that an NPM-based tax could deliver health benefits comparable to other high-impact obesity policies, while giving producers flexibility in how they respond. However, choosing whether and how to design and implement such a tax is ultimately a policy and political judgement, balancing health benefits, consumer prices, and feasibility for industry.
The case for action on obesity and where the right policy solutions lie
Around two-thirds of people in the UK live with excess weight and obesity. Obesity and excess weight cost UK society an estimated £126 billion a year, including around £12 billion in NHS spending and £30 billion in wider productivity costs.
But obesity is preventable. Evidence shows that improving diets and reducing excess calorie intake can put us on track to halve obesity by 2030.
Nesta's Blueprint for halving obesity robustly evaluates the cost and health impacts of over 30 policies to reduce obesity. The three interventions modelled within the Blueprint with the largest potential impact on obesity rates are: health targets for large food retailers, rolling out weight loss drugs (GLP1s) to the ~13 million adults in the UK living with obesity, and a salt and sugar tax as developed within the 2021 National Food Strategy (Figure 1).
Each Blueprint policy works through different mechanisms and has very different considerations for industry, government, and consumers. Therefore, their political, economic, and practical feasibility vary widely. For example, a large-scale roll-out of GLP1s theoretically has the highest estimated impact on obesity, but at £42 billion over 5 years, would have an unfeasibly high cost to the government.

Figure 1: The three most impactful policies to reduce the prevalence of obesity as identified in Nesta's Blueprint toolkit
Policy - Introduce healthiness targets for large retailers * Cost to government £0.2 million * Relative reduction in obesity prevalence: 20% * A policy developed by Nesta that forms a key component of the government's healthy food standard (HFS) announced as part of the 10 Year Health Plan* for England. The proposal mandates a minimum target for the average healthiness of food sales for the largest food retailers.
Policy - Large scale roll-out of pharmacological interventions * Cost to government: £42 billion * Relative reduction in obesity prevalence: 40% * Large scale roll-out of pharmacological interventions to an additional 13 million people, or 3 million annually, equal to almost all people living with obesity.
Policy - Tax sugar and salt sold in processed foods * Cost to government: £28 million * Relative reduction in obesity prevalence: 10% * Tax sugar and salt sold wholesale for use in processed foods, as recommended in the 2021 National Food Strategy.
- Blueprint estimate over a 5-year period
- HFS also includes data reporting, which we estimate would have a £1 million cost to government over 5 years
What we already know about food taxes, and where our work fits in
Taxes on harmful products, like tobacco and alcohol, are well-established as effective tools for changing consumer behaviour and improving public health. Similarly, the UK Soft Drinks Industry Levy (SDIL) and several international examples of unhealthy food taxes show that taxes can be an effective tool to shift consumer behaviour and encourage industry to make products healthier. Building on the success of the SDIL, a number of organisations have called for the introduction of food taxes in the UK to improve public health.
For example, Recipe for Change, a coalition of various UK organisations, has proposed two options for food taxes that could be introduced: (1) a broad tax on ingredients such as added sugar and salt, as recommended in the 2021 National Food Strategy; (2) or a more targeted tax on less healthy food categories (an example of which we model in this report). The coalition also suggests that tax revenues should be reinvested in critical public health programmes, as was originally intended under the SDIL.
The National Food Strategy salt and sugar levy has provided the strongest evidence to date on how a food tax could work in the UK and the health and economic benefits it could drive, helping shape thinking on food tax design. Alongside this, three National Institute for Health and Care Research (NIHR) funded research projects are currently exploring food taxes in the UK, including: how food taxes could reduce social inequalities, repurposing value-added tax to support healthier eating, and the interlink between food taxes, health, and sustainable food systems.

Against this backdrop, we set out to design and test a novel food tax that balances health impact with affordability for consumers and feasibility for industry.
In this report, we assess the health and economic impact of a tax on specific categories of unhealthy foods consumed at home, strengthening the evidence base on different options to design food taxes and how they might reduce obesity specifically. We base the tax on the UK 2004-05 Nutrient Profiling Model (NPM), a holistic measure of food healthiness that the World Health Organization recommends as a strong base for designing effective food taxes.
To our knowledge, this is the first publication to evaluate the impact of such a tax in the UK. While this report does not consider detailed implementation or political feasibility, it recognises that food taxes can be a powerful and impactful option available to governments that are serious about tackling the growing cost of obesity.
We commissioned the economic consultancy, Oxford Economics (OE), to model the impacts of an NPM tax, including changes to adult calorie and salt intake, food prices, and tax revenues. We modelled a range of reformulation scenarios to reflect different ways producers might respond to an NPM tax. In our central reformulation scenario, we estimate that an NPM tax could reduce adult obesity rates by 16–19% over five years and raise up to £1.6 billion in annual tax revenue.[^2]
Given Nesta's health mission goal is to halve obesity prevalence by 2030, obesity was the primary health outcome of interest in this analysis. We also modelled changes in salt intake, which is likely to deliver additional health benefits - particularly for cardiovascular health - beyond those captured in our obesity-focused modelling.
How a tax on unhealthy foods could reduce the prevalence of obesity
We started by building our understanding of the mechanisms through which a food tax might work. A tax on unhealthy foods could have a positive health impact through two complementary routes (Figure 2):
1 By encouraging producers to change the composition or range of unhealthy foods
In order to pay less (or no) tax, food producers could employ a variety of tactics. Producers might reformulate their products to make them healthier. Depending on the tax design, this could mean reducing 'unhealthy' nutrients like salt and sugar, or increasing 'healthy' nutrients like fibre and protein. Producers may also reduce the portion sizes of unhealthy foods. Consumers who buy reformulated or resized foods would therefore eat fewer unhealthy nutrients.
The SDIL, a tax that was designed to improve health by reducing the sugar content in drinks, has led to a 47% average reduction in sugar in in-scope soft drinks and a nearly 1% fall in daily calories per person.[^3] Reformulation to reduce sugar accounted for over 80% of this fall in calorie intake. Given its success, the government is now expanding the scope of the SDIL and lowering the tax thresholds to encourage further reformulation.
In our modelling, we focused on reformulation as the main mechanism of producer-led change, reflecting how producers responded to the SDIL. In practice, businesses may take a wider range of actions in response to a food tax. For example, they could also divert their promotions or marketing spend towards healthier products, encouraging consumers to choose these options.
2 By encouraging consumers to reduce their purchases of unhealthy foods
Tax costs may be passed on from producers to consumers through higher prices on taxed foods. Consumers may respond by buying fewer unhealthy foods or switching to cheaper or healthier alternatives.
Because foods are generally harder to reformulate than drinks (food recipes are more varied and complex, with greater taste or texture constraints), price changes may play a larger role in driving the impact of a food tax than they did under the SDIL.
Any food tax must balance the positive health impacts from reformulation with price-driven consumer switching, but the exact balance between the two is difficult to predict.
Figure 2: We modelled the impact of the food tax in two ways: producers could reformulate unhealthy food, and/or consumers could buy less unhealthy food in response to price changes
Tax on unhealthy foods" overlaid
This tax can lead to two main responses.
Response 1: * Consumer response to post-tax price changes * This branches into: * Consumers buy less unhealthy, taxed food * Consumers swap unhealthy foods for healthier ones
Response 2:
- Producer response to tax
- This branches into:
- Producers reformulate products to pay less (or no) tax
- This branches into:
Both consumer and producer responses ultimately lead to:
Improvement in consumer diets by consuming less 'unhealthy' nutrients like salt or calories
International evidence on unhealthy food taxes, and where the gaps lie
Real-world examples provide insight into how food taxes work in practice, illuminating both the mechanisms of behavioural change and the potential impacts on health and consumer behaviour. While the UK currently taxes sugary drinks through the SDIL, it does not have a broader tax on unhealthy foods. However, many countries have implemented food taxes, with mixed evidence on their impact on health and consumer behaviour (Figure 3).
Our review of international evidence highlighted a clear gap: little is known about how a tax based on a holistic measure of food healthiness (such as the UK NPM) or applied to specific categories of foods might work, or what impact it could have in the UK. The next section explains in more detail why we chose the NPM.
Figure 3: A selection of existing global food taxes
The below info summarises several countries that have implemented food taxes, along with details of each tax:
-
Mexico
- 8% tax on price of nonessential energy-dense foods
- Year introduced: 2018.
- Current status: active.
- Evidence of impact: 5% decrease in quantity of taxed foods after one year.
-
Finland
- Excise tax on confectionery and ice cream at ≈£0.7/kilo.
- Year introduced: 2011.
- Current status: repealed in 2017.
- Evidence of impact: no change in quantity sold.
-
Colombia
- 20% tax (uprated from 10%) on ultra-processed foods high in salt or saturated fats.
- Year introduced: 2023.
- Current status: active.
- Evidence of impact: 5% decrease in volume sold of taxed foods in 2023; 14% increase in spend on unhealthy food.
-
Denmark
- Excise tax (tax on production or import) on saturated fat heavy products at ≈£1.9/kilo.
- Year introduced: 2011.
- Current status: repealed in 2012.
- Evidence of impact: 4% decline in consumption of saturated fats; 13-16% increase in prices.
-
Hungary
- Product-specific excise tax on processed foods, using an NPM score based on salt, sugar, and other nutrients.
- Year introduced: 2011.
- Current status: active.
- Evidence of impact: small but not significant change in volume sold of sugary foods; 6.5% increase in spend on taxed foods.
What to tax: How we defined which products and nutrients to target
Defining the healthiness of products using the NPM score
For this analysis, we designed and evaluated the impact of a novel food tax based on the 2004-05 UK NPM. The NPM scores food products based on their nutritional composition and is the basis of much of the UK's existing food legislation. Scores range from -15 (most healthy) to +40 (least healthy).[^4]
What is the Nutrient Profiling Model?
The nutrient profiling model (NPM) score is a holistic measure of the health of food that assigns an integer score to food products based on their nutritional content (energy, sugar, saturated fat, sodium (salt), protein, fruit, vegetables and nuts, and fibre). Scores range from -15 (most healthy) to +40 (least healthy). The NPM was originally developed to determine the suitability of products for advertising to children. The government has proposed updates to the 2004-05 NPM, planned to be consulted on later this year.
In line with the 2004-05 UK NPM, we have defined food products as 'less healthy' if they have an NPM score of 4 or more. Read more about Nesta's approach to metrics here.
At Nesta, we are particularly interested in policies which use the continuous NPM scale because this incentivises improvements across a company's wider product range, rather than concentrating reformulation around binary cut-offs of 'healthy' and 'not healthy'. By contrast, taxes based on a binary healthiness definition, such as high in fat, salt and sugar (HFSS), or tiered taxes like the SDIL, are more likely to encourage reformulation only to the point of crossing the boundary. Policies using the NPM as a continuous scale could instead encourage smaller, more feasible improvements across a broader range of products.
Using the NPM also gives companies greater flexibility over which nutrients (such as salt, sugar, and calories) they target and to what extent, for example, by making many small changes across multiple nutrients or one larger change to a single nutrient. By contrast, single-nutrient taxes such as on salt or sugar may be easier to administer or more effective at targeting specific health outcomes (for example, reducing cardiovascular disease through lower salt consumption).
Defining products in-scope of the tax
The NPM is evidence-based, widely used in legislation, understood by industry, and upheld in law, helping reduce the complexity of implementation and data collection. International organisations like the World Health Organization recommend NPM as a strong measure to base food taxes on. The NPM is also the basis of Nesta's proposal for health targets for large food retailers, which forms a core part of the UK government's healthy food standard announced as part of the 10 Year Health Plan for England in 2025.
To reduce the impact of any food tax on staple or core foods, we assumed an NPM-based tax would apply only to specific categories of unhealthy, pre-packaged, non-staple food bought to be consumed at home. This is different from a more broad-based approach like that of the National Food Strategy salt and sugar levy, which taxes all processed foods bought for consumption both in and out of home that use salt or sugar.
Targeting discretionary, unhealthy foods can deliver substantial health gains while limiting impacts on core spending, but requires clear decisions about what is in and out of scope. A broader tax applied across a larger share of the food basket could reduce the risk of consumers switching to other unhealthy products, as fewer options would fall outside the tax. However, this approach is likely to lead to higher costs for consumers overall, as a wider range of foods, including healthier or staple products, would still be subject to the tax.
For the NPM tax we modelled, we classified in-scope foods as the 12 categories of HFSS food products that contribute the most to children's ill-health, as defined under existing regulations on restricting the placement and promotion and restricting advertising of unhealthy foods (Figure 5). We excluded soft drinks and juice drinks with added sugar (the 13th HFSS category) as soft drinks are currently taxed under SDIL.

Figure 4: Product categories affected by NPM-based tax
The figure shows a central text box and 12 surrounding circular icons, each representing a product category.
The central text box states: "We included 12 categories of unhealthy, discretionary foods in the scope of an NPM-based tax, excluding the 13th HFSS category of drinks with added sugar."
The 12 categories illustrated by icons are: * Crisps and savoury snacks * Breakfast cereals * Confectionery * Ice cream * Cakes * Sweet biscuits * Morning goods * Dairy desserts and puddings * Yoghurts * Pizza * Chips and potato products * Ready meals
Taxing such discretionary, unhealthy food categories like confectionery, morning goods such as pastries, and sugary cereals can deliver outsized health gains by targeting excess calorie intake. Using the above definition of the 12 in-scope categories, an NPM-based tax would apply to roughly 25% of the volume but ~40% of total calories of foods purchased for consumption at home in Great Britain (GB), reflecting the high calorie density of these products.[^5] This means the tax is highly targeted, affecting a relatively small share of foods purchased while capturing a disproportionately large share of excess calories.
Like any other legislation on unhealthy foods, a tax on specific categories requires us to make judgement calls on what is in or out of scope. We chose to align with existing legislation, which applies only to pre-packaged food and drink within the 13 HFSS categories. However, the government's current definition of HFSS categories risks missing a significant proportion of less healthy products. Indeed, anomalies such as chocolate spread and toffee-covered nuts fall outside of existing legislation despite being high in sugar and calories.
Expanding the products in the scope of a food tax beyond the categories used in this analysis could capture additional unhealthy foods that fall outside current regulations, potentially delivering greater impacts from an NPM tax than currently estimated. Indeed, we have estimated that around 30% of total calories bought in supermarkets to consume at home are unhealthy (scoring over NPM 4) but not captured by the current legislative definition of HFSS.[^6]
Similarly, the impact of an NPM-based tax could be even higher if the tax applied to both in-home and out-of-home (OOH) food. Currently, limited data availability of the nutrient composition and portion sizes of foods consumed out-of-home means we cannot robustly model this potential impact. Later in this report, we set out considerations for policymakers if an NPM-based tax were implemented in the OOH sector.

How to tax: The different components to consider while designing a food tax
After defining what food products could be in-scope of an NPM-based tax, we then worked through the key components of a tax design that could balance health impact and feasibility (Figure 5). For example, we decided what an appropriate tax rate could be and who should be responsible for paying the tax.
Figure 5: Components to consider when designing an effective food tax
1 Where in the supply chain is the tax applied? * Value-added or sales tax: charged at point of sale * Import duty: charged on imported goods
2 How is the tax rate calculated? * Ad valorem: as a percentage of product price * Ad quantum: as a fixed amount per weight, volume, or nutrient density/score per product
3 What is the tax rate? * Set per unit (eg, per kilo or per pack size) * Or set specifically per product
4 Do all products pay the same rate, or do rates vary? * Single or uniform: single rate across in-scope products * Tiers: different tax rates (or exemptions) apply based on product characteristics or categories
5 Is there a threshold, or minimum/maximum point at which no tax is paid? * Minimum qualifying threshold: below which products are not taxed * Ceiling or maximum threshold: beyond which tax rate does not increase, or products are exempt
The NPM-based tax design we chose to model, and why
Designing a food tax involves a series of policy choices, each with implications for impact, feasibility, and consumer spending. Where possible, we aligned with existing regulatory approaches for simplicity, ease of implementation, and policy coherence. In practice, policymakers may prioritise different aspects of policy design from those we modelled.
1. Where in the supply chain is the tax applied?
We modelled the NPM tax as an excise tax on producers and importers of unhealthy foods for in-home consumption, rather than on retailers or wholesalers. The modelled tax applies to all food producers, not just large businesses.
We chose an excise tax because it can be simpler to administer than, for example, a sales tax, and because it is a more direct route to incentivising reformulation as it targets the producers of unhealthy foods directly. Applying the tax at this point in the supply chain also means it would cover products sold through all retail channels, including convenience stores, complementing existing and upcoming policies that have mainly focused on large supermarket retailers.
2. How is the tax rate calculated?
We modelled an ad quantum tax, where producers pay a tax per kilo of unhealthy product, based on the product's NPM score. An ad quantum tax charges a fixed amount of tax per weight, nutrient, or product. Existing taxes aimed at improving health, such as those on alcohol or tobacco, are generally ad quantum.
Under an NPM tax, unhealthy foods would be taxed by product weight (£ per kilo) as well as NPM score to encourage reformulation. Linking the tax paid directly to the nutrient content or healthiness of a food (which we define by the NPM score) could help encourage greater reformulation, as seen with the SDIL, compared to a tax based on the product's price.
3. What is the tax rate?
We modelled a single tax rate of £0.06 per kilo on in-scope unhealthy foods scoring NPM 4 or above, increasing by the same amount for every one-point increase in NPM score. The more unhealthy a product is, the higher the tax rate it would face.
We carried out illustrative analysis using different tax rates on unhealthy products to estimate the resulting price increases. Any tax (and subsequent price rises) must be high enough to change consumer purchasing behaviour without leading to excessive price rises. However, evidence on the size of price rises needed to change consumer behaviour is limited and often specific to individual products or categories. Some studies suggest that a 10-15% price increase on unhealthy products is sufficient to encourage consumers to switch to healthier options.
In the absence of clear evidence, we took a pragmatic approach, making informed judgements about what level of price increase might be acceptable in practice. To test how sensitive our results were to these assumptions, we also modelled the impact of a higher tax rate of £0.12 per kilo of product.
We also assumed that tax costs are fully passed on by producers to consumers, in line with (limited) evidence and the approach taken to model the impact of the National Food Strategy salt and sugar levy. In reality, producers might choose to absorb some of the tax costs, resulting in lower price increases for consumers.
4. Do all products pay the same rate, or do rates vary?
We modelled a single rate of £0.06 per kilo on all in-scope foods scoring NPM 4 or above, increasing by the same amount for every one-point increase in NPM score. This would incentivise producers to reformulate the least healthy products to avoid paying the highest rates of the tax.
Tiered taxes may encourage larger improvements in the healthiness of products around the threshold points, but their effectiveness depends on where those thresholds are set. Tiers were an effective tax design under the SDIL because sugar content in soft drinks was clustered around clear cut-offs. Linking the tax rate to the underlying distribution of sugar content gave companies a clear and feasible incentive to reduce the sugar content in their products to avoid paying the tax.
While a tiered tax could also be applied to food, our analysis showed food NPM scores are much more evenly spread across the whole NPM distribution, making it difficult to set any specific tier cut-offs for producers to aim for. A linearly increasing tax rate could also incentivise reformulation of the unhealthiest products, such as some chocolates, which might otherwise sit too far away from a tier cut-off. Finally, we think that incentivising small shifts across the full product portfolio could be more effective to achieve the scale of impact needed to address obesity at population level.
5. Is there a threshold, or minimum/maximum point at which no tax is paid?
In our model, foods scoring less than NPM 4 (in line with the government's definition of HFSS foods) or not within the 12 in-scope HFSS categories would pay zero tax. We did not apply a tax ceiling or maximum NPM score beyond which the tax rate would stop increasing. This means that even the least healthy products would continue to face an incentive to reformulate, rather than sitting too far from a cut-off to feasibly reformulate to a lower tax bracket.
Introducing a tax-rate ceiling could be a deliberate design choice to limit very large, tax-driven price increases on the unhealthiest products. However, because less than 1% of the volume of in-home food and drink scores above NPM 25, such a ceiling would apply to very few products and is unlikely to make a meaningful difference to overall food basket prices.[^7]
Figure 6: Visualisation of a £0.06 per kilo tax on unhealthy foods
Healthy foods scoring less than NPM 4 pay zero tax
The line graph illustrates the relationship between the NPM score and the tax rate per kilo of food.
The x-axis represents the NPM score, ranging from -4 to 40. The y-axis represents the tax rate per kilo of food, ranging from £0 to £2.22.
A horizontal line indicates that "Healthy foods face no tax (NPM score less than 4)" at £0.00. The line starts at NPM score 4 with a tax rate of £0.06. It increases linearly: * NPM 8: £0.30 * NPM 12: £0.54 * NPM 16: £0.78 * NPM 20: £1.02 * NPM 24: £1.26 * NPM 28: £1.50 * NPM 32: £1.74 * NPM 36: £1.98 * NPM 40: £2.22
An annotation states: "Manufacturers have incentive to reformulate unhealthier foods to a lower tax rate."
| NPM score | Primary tax rate (£ per kilo of product) |
|---|---|
| NPM <4 | Exempt |
| NPM 4 | £0.06 |
| NPM 5 | £0.12 |
| NPM score X... | (£0.06) * (NPM score X - 3) |
How we modelled the impact of an NPM-based tax
After we designed the NPM tax, we commissioned Oxford Economics to model its impact on UK food prices, adult calorie and salt intake, and tax revenue. This impact model has two components:
- producer response, which estimates the scale and distribution of product reformulation among foods in the scope of the tax; and
- consumer response, which applies price elasticities to estimate how purchasing behaviour changes in response to price changes.[^8]
We provided OE with data on food and drink purchases taken into the home for a sample of over 30,000 GB households in 2024 created using data from Worldpanel by Numerator's Take Home panel. This included our derived analysis on the average calories per kilo, average salt per kilo, volume, and price of all in-home food. For modelling purposes, we grouped food products in the 12 in-scope HFSS categories into three groups: sugar- and saturated fat-heavy products, salt- and carbohydrate-heavy products, and chocolates.
We developed a set of model assumptions, drawing on original data analysis, expert input, and a review of existing evidence. We then tested how sensitive the results were by varying (i) the scale of reformulation and (ii) the tax rate.
To reflect uncertainty and limited evidence on how far producers might reformulate across different food categories, we modelled low, central, and high reformulation scenarios representing a range of potential industry responses to the tax. Each reformulation scenario varies in three elements: the average improvement in product healthiness (measured by reductions in NPM score), the share of products that reformulate, and the extent to which reformulation is achieved by reducing either salt or calories.[^9]
Our input assumptions on reformulation are pragmatic, informed by a review of limited evidence on the topic as well as original analysis. We spoke with nutritionists to determine the likely level of reformulation possible in certain categories. We also studied the Public Health England voluntary reformulation programmes for sugar, salt, and calories to understand what an ambitious yet feasible level of reformulation by industry could be. For example, we assumed that it is hardest to change the composition of chocolates, as nutrients like saturated fat and sugar are structurally important to the food. Our full input assumptions can be found in the technical appendix.
We also modelled two tax rates: £0.06 per kilo per NPM point, and a higher tax rate of £0.12 per kilo per NPM point. Our central scenario assumes a medium level of reformulation and a low tax rate of £0.06 per kilo, balancing health impact with more moderate price increases and what we judged to be feasible reformulation expectations for industry.
Results: The potential health and economic impacts of an NPM-based tax
Changes in nutrient intake and reductions in obesity
In the central reformulation scenario with a £0.06 tax rate, we found an NPM tax could lead to reductions of 2.5-3% calories consumed (45–59 calories) and a 1% reduction in salt consumed per adult per day.[^10] This could lead to a 16–19% reduction in adult obesity rates in the UK over five years (ranging from 13-32% across the three reformulation scenarios). Our full methodology and results can be found in the technical appendix.
Figure 7: Impact on calories and subsequent reductions in obesity rates across the reformulation scenarios, assuming a £0.06 per kilo tax rate
| Reformulation scenario | Low reformulation | Central scenario | High reformulation |
|---|---|---|---|
| Average reduction in NPM score in products that reformulate* | 1 | 1 to 3 | 2 to 4 |
| Total share of in-scope products that reformulate+ | 3% | 11% | 25% |
| Reduction in calories consumed at home per adult per day‡ | 37 to 49 kcal | 45 to 59 kcal | 75 to 97 kcal |
| Relative reduction in prevalence of adult obesity over 5 years‡ | 13 - 17% | 16 - 19% | 24 - 32% |
Source: Oxford Economics modelling results *Input assumption for model, varies by category of food products. See technical appendix for more details. +Output from OE model. Expressed as a share of volume of in-scope products with an NPM score both below and above 4. ‡Lower bounds assume reduced calorie intake from taxed foods is compensated by a 23% increase in consumption of calories from other sources
The lower bounds of the ranges above (for reductions in calories and subsequent obesity reductions) assume that reduced calorie intake from taxed foods is compensated by a 23% increase in consumption of calories from other sources. This is in line with existing evidence on compensation and our Blueprint policy impact modelling methodology.[^11]
Potential impact on food prices and consumer spend
As we have assumed 100% of the cost of the tax is passed through from producers to consumers, our results suggest that an NPM-based tax would lead to some price increases for unhealthy products. Overall, OE modelling estimated that the average food basket bought for consumption at home would become around 1% more expensive. This would be driven by price rises for taxed, unhealthy foods, while exempt foods (eg, below NPM 4 or not within the 12 HFSS categories) or unhealthy foods that reformulate to avoid the tax entirely would see no change.
Price increases were larger in categories with a high share of unhealthy products. For example, chocolates and other sugary foods saw average price increases of around 10%. This is lower than recent inflation-driven increases, such as the over 18% rise in chocolate prices in 2025. Some of the unhealthiest products might see higher-than-average price rises, up to 25 to 30% for some chocolates and other sugary foods.[^12] In practice, prices could rise by less if producers absorbed some of the tax, rather than passing on 100% of the costs to consumers.
Our modelling estimated that higher prices would lead to a modest 1% fall in the volume of food (measured in kilos) bought for consumption at home. Because this reduction is slightly smaller than the estimated price increases, estimated overall consumer spending on food eaten at home only actually rose by around 0.2%. The model also shows a small shift in demand towards OOH food and drink in response to higher prices for foods consumed at home.

We also tested a twice-as-high £0.12 per kilo tax rate to assess how sensitive consumer demand might be to price changes (Figure 8). Our findings suggest that higher tax rates would lead to larger reductions in obesity and raise more tax revenue, but also result in higher price rises of 1.6-1.8% on the full food basket bought to consume at home. Foods like chocolates or confectionery might see average price increases of over 20%.
Figure 8: A higher tax rate could lead to greater health impact, but would come with higher price rises for foods bought to consume at home
Dashed lines indicate impact after applying 23% compensation
The line graph shows the reduction in calories consumed daily per adult across different levels of manufacturer reformulation (Low, Central, High) for two tax rates: £0.06 and £0.12 per kilo per 1-point NPM score.
The x-axis represents the "Level of manufacturer reformulation" (Low, Central, High). The y-axis represents "Reduction in calories consumed daily per adult", ranging from 0 to 129.
Two lines are plotted: * £0.06 tax rate (solid blue line): * Low reformulation: 37 calories (after 23% compensation) / 49 calories (before compensation) * Central reformulation: 45 calories (after 23% compensation) / 60 calories (before compensation) * High reformulation: 75 calories (after 23% compensation) / 97 calories (before compensation)
- £0.12 tax rate (solid red line):
- Low reformulation: 68 calories (after 23% compensation) / 89 calories (before compensation)
- Central reformulation: 74 calories (after 23% compensation) / 96 calories (before compensation)
- High reformulation: 97 calories (after 23% compensation) / 129 calories (before compensation)
The dashed lines indicate the impact after applying 23% compensation.
Source: Modelling results from Oxford Economics Dashed lines assume reduced calorie intake from taxed foods is compensated by a 23% increase in consumption of calories from other sources, in line with existing evidence
Potential social benefits generated by an NPM-based tax
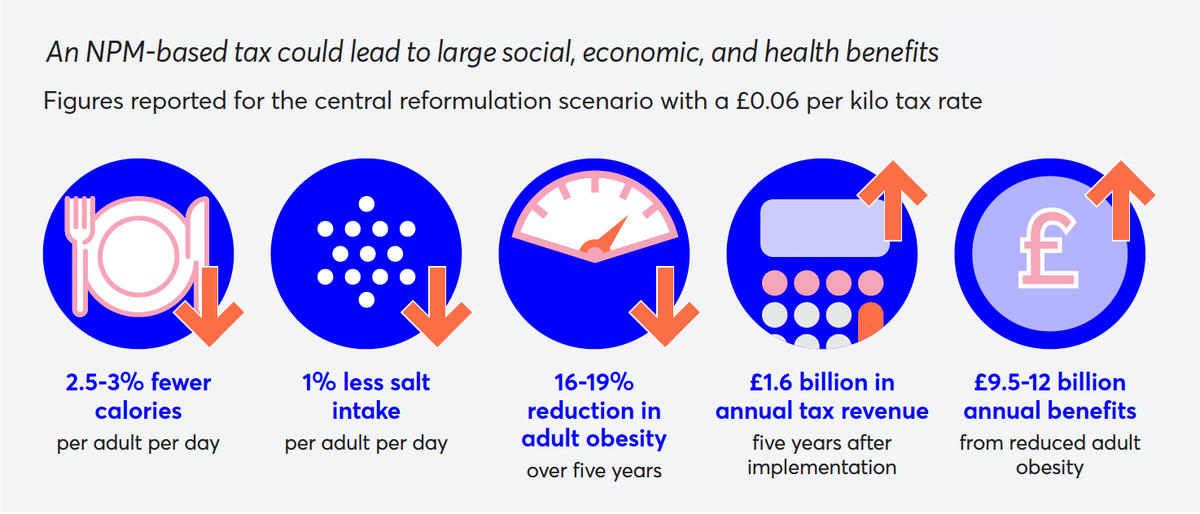
In our central scenario, reductions in obesity could yield societal benefits of £9.5–12 billion annually, including improvements in productivity and reduced costs to the NHS.[^13] £6-8 billion of this is estimated to come from reductions in disease incidence and therefore an increase in Quality-Adjusted Life Years (roughly 88–112,000 QALYs) across the population.[^14] The UK government could also raise up to £1.6 billion annually in direct tax revenue.[^15] Tax revenue raised could be used to directly fund public health programmes, as was initially intended via the SDIL.
Figure 9: An NPM-based tax could lead to large social, economic, and health benefits
Figures reported for the central reformulation scenario with a £0.06 per kilo tax rate
The figure displays five icons, each representing a key benefit of an NPM-based tax:
- 2.5-3% fewer calories
- Description: per adult per day
- 1% less salt intake
- Description: per adult per day
- 16-19% reduction in adult obesity
- Description: over five years
- £1.6 billion in annual tax revenue
- Description: five years after implementation
- £9.5-12 billion annual benefits
- Description: from reduced adult obesity
These results suggest that an NPM-based tax could be a high-impact policy option to reduce the prevalence of adult obesity (Figure 10). As we do not account for societal benefits from reduced salt intake or other non-modelled nutrient changes (eg, lower sugar or saturated fats intake), the full health benefits of an NPM-based tax could be higher than our estimates.
Figure 10: Comparing the impact of an NPM tax to other high-impact obesity policies
| Policy | Impact on adult obesity | Cost to government over 5 years | Benefit to government per year | Annual tax revenue raised | Increase in food prices for consumption at home |
|---|---|---|---|---|---|
| NPM-based tax central reformulation scenario | ~16% | Not modelled, likely similar to NFS | £9.5-12 billion | £1.6 billion | +1% |
| National Food Strategy salt and sugar levy | ~10% | £28 million | £7 billion | £3.2 billion | +4-5%* |
| Healthiness targets for retailers | ~20% | £0.2 million (plus £1 mn for data reporting) | £16 billion | None | Likely none |
| Expand access to novel pharmacological interventions like GLP-1s | ~40% | £42 billion | £26 billion | None | None |
Source: Nesta's Blueprint for Halving Obesity, National Food Strategy salt and sugar levy For the comparison policies, impact on obesity, cost to government, benefits to government are from Nesta's Blueprint for Halving Obesity. Estimates for adult obesity reductions for NPM- and NFS taxes include a 23% calorie compensation. *As reported by NFS. This does not include the impact of reformulation. Any price rises are therefore likely to be lower.
Considerations while assessing the impact of an NPM-based tax
The NPM tax we modelled applies only to unhealthy products not essential to a balanced diet, limiting the impact on core food spending or on a healthy food basket. In-scope, taxed products with an NPM score greater than 4 account for less than 15% of the volume of all food consumed at home in GB.[^16] An NPM tax could theoretically be extended to more unhealthy foods not covered by existing HFSS legislation, as we discussed earlier.
Our impact estimates conservatively assume full cost pass-through to consumers, that is, producers pass the full tax on to consumers. This is in line with existing (but limited) evidence on how producers react to food taxes, and reflects the competitiveness of the UK food market. In reality, producers might absorb some of the costs of the tax, which might lead to lower price increases for consumers (and potentially slightly lower health impacts).
A limitation of the model is that it also does not vary the pass-through rate by product type. Existing research suggests that pass-through can vary depending on products. For example, in the SDIL, some drinks were overshifted (saw price increases greater than the tax rate) while others were undershifted (saw price increases less than the tax rate). On balance, we judged that this was unlikely to make a significant impact on final results.
We were aware that the UK government had plans to update how the NPM is calculated, as announced in the 2025 10 Year Health Plan for England. Our work (based on the 2004-05 UK NPM) was completed before the proposed NPM update was published in January 2026. Consultation on how to implement the new NPM in existing regulations is expected later this year.
Any update to the NPM model is unlikely to change the mechanism of impact of an NPM-based tax. Because the tax is based on the continuous NPM score, rather than a single nutrient, updates to the model may change how producers reformulate, but not whether they do so.
For example, the proposed NPM update (published in January 2026) places greater emphasis on free sugars and fibre, which could shift reformulation towards reducing free sugars or increasing fibre while preserving the overall incentive to improve product healthiness.[^17] At the same time, the proposed NPM update would classify more products as 'less healthy' or scoring NPM 4 and above. This may increase the potential impact of an NPM-based tax, as fewer products would be exempt from paying the tax.
Our model did not account for additional health benefits of lower portion sizes. In categories that are harder to reformulate, such as chocolate and confectionery, producers might choose to reduce portion size instead of changing product composition. This would lower the total amount of tax they would pay, which is linked to product weight. Research suggests that smaller portion sizes can have a prolonged effect on what people eat, leading them to consume fewer calories overall. Our model did not capture this downstream impact on calories, and therefore might underestimate the health benefits from an NPM-based tax.
An NPM-based tax could also be extended to the out-of-home (OOH) sector to drive further impact on health once better data is available. At present, the broader availability of data on the nutritional quality and portion sizes of these foods makes it difficult to model the potential impact of such a tax. However, this is a temporary challenge, and one that mandatory healthy food sales reporting for all large food companies – set out in the 10 Year Health Plan – would go a long way towards addressing.
Given differences in the preparation of OOH products, any attempt to include OOH in a single tax policy will likely require expanding the scope to include non-prepackaged but unhealthy foods. Policymakers would also need to decide whether the tax should apply only to large OOH businesses (for example, those with over 250 employees, which make up ~35% of total consumer spend and 18% of calorie intake within the OOH sector), or to all businesses regardless of size.
With these caveats, we did a rough benchmarking to indicatively understand the potential impact of extending an NPM-based tax to include OOH. We estimated that extending an NPM-based tax to include both in-home and out-of-home food could reduce adult obesity prevalence by 16-22% in our central scenario.[^18] Most of this impact continues to be driven by changes in consumption of food at home, which accounts for the vast majority of people's overall food intake. These estimates are likely conservative, as we assume the share of calories from in-scope HFSS foods in the OOH sector is the same as in the in-home sector; in reality, this share is likely to be higher.
Conclusion
This analysis fills an important evidence gap, offering new insight into how an NPM-based tax on unhealthy food could be designed and its potential to shape diets and health outcomes in the UK. Any future government considering such a tax would need to weigh the costs and benefits of different design choices, such as the impact on consumer prices, practical considerations of how industry could respond to a tax, and the costs of administering the tax.
An NPM-based tax could give producers greater flexibility than an ingredient-specific tax while delivering public health benefits comparable to other high-impact obesity policies. While the three NIHR-funded research studies are currently developing and evaluating the impact of potential food taxes, none of these options is anchored in the continuous NPM score. While there is no silver bullet to tackle obesity, and food taxes represent a powerful potential route to reducing obesity levels, the introduction of any new tax comes with trade-offs for government.
At present, there is a high-impact obesity reduction policy already on the table: the healthy food standard, as announced in the government's 10 Year Health Plan last year. We believe this policy has the greatest potential impact on obesity levels, while being low-cost to government and consumers. Nesta's priority remains the timely and effective implementation of this policy.
Technical appendix
Background
This technical appendix accompanies our report on modelling the impact of a tax on unhealthy foods. In this project, we assessed how a novel category-specific tax, based on the 2004-5 UK Nutrient Profiling Model (NPM), could lower the prevalence of obesity in the UK.
As part of this work, we commissioned Oxford Economics (OE), an economic consultancy, to model the health and economic impacts of the tax. Here, we focus on the analytical approach to the impact model, assumptions, and data used to estimate changes in the food market, diets, and health outcomes that could be driven by this tax.
1: Preparing the dataset for analysis
This work uses product-level, unweighted data acquired for our analytical requirements from Worldpanel by Numerator, an international market research company. The primary dataset comprises GB food and drink purchases taken into the home (Take Home) from 1st January to 31st December 2024 for a sample of over 30,000 British households, and includes demographic, nutrition, price and volume data. We also calculated a summary figure using Worldpanel by Numerator's GB Out of Home data, for the period 1st April to 31st December 2021.
All analysis and interpretation were undertaken independently of Worldpanel by Numerator. All conclusions are exclusively those of Nesta and should not be attributed to, or interpreted as representing the views of Worldpanel by Numerator.
Nesta links product-level nutrition information with purchasing data to create a population- representative dataset. This enables Nesta to calculate sales-weighted NPM metrics, following the government's 2004-05 NPM methodology.
Nesta's data preparation steps include:
- We impute ~12% of product volume data that is typically not reported in the food & drink market, using a hierarchical process. We first extract additional volume information from text fields within the dataset where available. We manually specify the weight values of eggs using standardised nutritional references. The remaining <5% of non-reported values are imputed from category medians.
- We normalise all volume information to kilograms using the specific gravity mapping published in Table 4 of the Government's 2018 NPM review (a routine step for non-solid products where volumes are provided in litres).
- We create a single point of reference nutrient profile for each product across the analysis period by taking the intra-product weighted median of nutrient information available in the Worldpanel data. This approach is specific to our analytical requirements.
As part of our preparation of the product level dataset for analysis, we remove products with implausible nutrition values based on calorie density (kcal/100g > 900) and nutrient density (> 100g/100g for each nutrient) for all nutrients that are in included in our NPM score calculations.
To ensure our analysis is representative of the GB population, we applied Worldpanel's gross-up weights to the final purchase-level data. These weights account for household, response and purchase representativeness in the survey and thus ensure accurate population-level estimates of purchase characteristics and quantities. Finally, we scale these weighted values using the composition of households provided in the demographic data to be representative of the adult population only.
1A: Determining products that would fall under a category-specific NPM-based tax
We made three decisions to determine what products in this prepared dataset would be in scope of the modelled NPM tax, based on the 2004-05 UK NPM model.
- Products already covered under existing legislation on unhealthy foods would be in-scope of an NPM tax: We designed a category-specific food tax, aiming to target foods that contribute the most to unhealthy diets. We used a definition consistent with existing UK food legislation: foods in scope of the regulations restricting the placement and promotion and restricting advertising of high fat, sugar, and salt (HFSS) foods would be in scope of an NPM tax. Specifically, these are pre-packaged, non-staple foods purchased for consumption at home.[^19] Foods that score NPM 4 or above (classified as 'less healthy' in the NPM model) pay a tax; foods that score less than NPM 4 are exempt from paying the tax.
- An NPM-based tax would apply to food only, and not drink: We excluded all drinks from in-scope products. One example is sugary drinks, which are already taxed under the SDIL. We therefore excluded soft drinks to not doubly penalise them.[^20] We also excluded alcohol, as it does not fall under HFSS regulation.
- We only modelled the impact of an NPM tax on food for consumption at home, not out-of-home consumption: In general, the current quality and availability of data for the out-of-home food sector is limited, particularly nutritional information. This limits the feasibility of modelling the impact of a tax based on nutrient composition in the out-of-home sector. Therefore, we only modelled the NPM tax on foods purchased for consumption at home.
We used this definition to also calculate the share of HFSS food and drink (products scoring NPM 4 or above) that fall outside the legislative categories.
1B: Preparing sub-market data for the impact model
Following the preparation described above, we prepared aggregated data for food and drink sub-markets to input into the OE impact model (Figure 1). Sub-markets were selected to be consistent with price elasticities of demand estimates used in the impact model by OE (more details in section 3C). We prepared this aggregated data using data from Worldpanel by Numerator's GB Take Home panel, for the period 1st January to 31st December 2024.
We produced tables for each 'super' category summarising the 2024 population-level quantity, spend, volume (in kilos), and average salt and calories per kilo of products at each observed NPM score, as well as overall, for the in-home sector. We also calculated and provided the overall spend in 2024 on out-of-home food and drink by applying a 10% growth rate to the 2021 spend.[^21] OE produced equivalent figures for quantity, volume (in kilos), and average salt and calories per kilo of products for the out-of-home sector.
Figure 11: Description of the sub-markets and in-scope 'super' categories used as inputs for the impact modelling
The figure illustrates the categorization of food and drink purchases for impact modelling.
All food and drink purchases (by adults, GB population) are divided into: * Out of home * Out-of-home food and drink * Food purchased to consume at home * All drinks (Including those in scope of HFSS legislation) * Out-of-scope food * In-scope food (12 food categories under HFSS legislation, excludes products scoring NPM less than 4)
The "In-scope food" then breaks down into "In-scope 'super' categories": * Chocolates (Including those in scope of HFSS legislation) * Sugar- and saturated fat-heavy foods * Salt- and carbohydrate-heavy foods
Within each 'super' category, products are further classified: * Foods scoring NPM less than 4 are labeled as Untaxed foods * Foods scoring NPM greater than or equal to 4 are labeled as Taxed foods
To the right, an "Impact model analyses changes in product prices, spend, and volume for each of these sub-categories" box indicates the output of the model.
In-scope legislative food:
To identify product categories in the Worldpanel data that fall under the UK government's definition of HFSS legislative categories, we used a dataset from the Office for Health Improvement and Disparities that maps Worldpanel product categories to those in-scope of HFSS legislation.[^22] We performed extensive manual reconciliation to resolve discrepancies between the two datasets' category lists to ensure the mapping followed official legislative guidance to the closest possible degree.
In-scope legislative 'super' categories:
In order to align with OE's derived price elasticities, we then grouped in-scope legislative foods into 3 'super' categories: chocolates, sugar- and saturated fat-heavy foods, salt- and carbohydrate-heavy foods. This mapping is shown in Table 1.
Table 1: Mapping of in-scope 'super' categories to legislative categories from regulations restricting promotion, placement, and advertising of HFSS foods
| 'Super' category | Legislative categories (as described in HFSS regulations) |
|---|---|
| Chocolates | Category 4: Chocolate and Sweets Confectionery* |
| Sugar- and saturated fat-heavy foods | Category 4: Chocolate and Sweets Confectionery** Category 5: Ice Cream, Ice Lollies, Frozen Yoghurt, Water Ices and Similar Frozen Products Category 6: Cakes and Cupcakes Category 7: Sweet Biscuits and Bars Based on Nuts, Seeds or Cereal Category 9: Desserts and Puddings Category 10: Sweetened (Whether with Sugar or Otherwise) Yoghurt and Fromage Frais |
| Salt- and carbohydrate-heavy foods | Category 2: Crisps and Savoury Snacks Category 3: Breakfast Cereals Category 8: Morning Goods Category 11: Pizza Category 12: Chips and Potato Products Category 13: Ready Meals, Meal Centres, and Breaded / Battered Products |
*We include Worldpanel by Numerator's 'Chocolate Confectionery' rst_4_market under the chocolates 'super' category, and other confectionery under the sugar- and saturated fat-heavy foods 'super' category.
Table 2 summarises the respective food market segments in-scope of the tax as per the definitions and scope outlined previously.
Table 2: In-scope sub-markets as a share of all food consumed by adults at home
| Metric | All in-scope (legislative) % | Chocolate % | Sugar- and saturated fat-heavy % | Salt- and carbohydrate-heavy % |
|---|---|---|---|---|
| Energy (kcal) | 37.1 | 4.3 | 14.3 | 18.4 |
| Spend (£) | 34.4 | 4.6 | 11.8 | 18.0 |
| Volume (kilos) | 24.4 | 1.7 | 9.0 | 13.7 |
| Quantity sold (units) | 32.6 | 4.2 | 13.5 | 14.9 |
All expressed percentages are as a share of total food purchased for consumption at home by adults in Great Britain (GB). Includes products that score both above and below an NPM score of 4.
2: Defining the tax structure of an NPM-based tax
After identifying the products in scope of an NPM-based tax, we developed the overall tax structure. Our approach was informed by conversations with tax policy experts, original in-house analysis, and a review of international and UK food and drink taxes (both implemented and proposed). We focused on one tax design for the purposes of impact modelling, but ultimately any tax design is a policy judgement that involves trade-offs between health impact, consumer costs, and practical feasibility.
1. We modelled an NPM tax with a single tax rate rather than tiered tax structure.
Tiers were shown to be an effective tax design under the SDIL because sugar content in soft drinks was clustered around clear cut-offs. Linking the tax rate to the underlying distribution of sugar content gave companies a clear and feasible incentive to reduce the sugar content in their products to avoid paying the tax.
While a tiered tax could also be applied to food, our analysis showed food NPM scores are much more evenly spread across the whole NPM distribution, making it difficult to set any specific tier cut-offs for producers to aim for. A linearly increasing tax rate could also incentivise reformulation of the unhealthiest products, such as some chocolates, which might otherwise sit too far away from a tier cut-off. Finally, we think that incentivising small shifts across the full product portfolio could be more effective to achieve the scale of impact needed to address obesity at population level.
2. We modelled an ad-quantum tax per kilo of product.
An ad-quantum tax links the tax directly to the healthiness of the product per kilo, measured by its NPM score. Healthy products that score less than 4 NPM points are not taxed.
3. We modelled a tax rate of £0.06 per kilo of product per 1-point increase in NPM score.
We carried out illustrative analysis using different tax rates on unhealthy products to estimate the resulting price increases. Evidence on the size of price rises needed to change consumer behaviour is limited and often specific to individual products or categories. Some studies suggest that a 10-15% price increase on unhealthy products is sufficient to incentivise customer switching.
In the absence of clear evidence, we took a pragmatic approach, making informed judgements about what level of price increase might be acceptable in practice. To test how sensitive our results were to these assumptions, we also modelled the impact of a higher tax rate of £0.12 per kilo of product.
| NPM score | Primary tax rate (£ per kilo of product) |
|---|---|
| NPM <4 | Exempt |
| NPM 4 | £0.06 |
| NPM 5 | £0.12 |
| NPM score X... | (£0.06) * (NPM score X - 3) |
4. We assumed a 100% pass-through rate, that is, producers pass the full tax on to consumers.
This is in line with existing (but limited) evidence. This reflects the competitiveness of the food market and existing evidence on how producers react to food taxes. In reality, producers might absorb some of the costs of the tax, which might lead to lower price increases for consumers.
One limitation of the model is that it does not vary the pass-through rate by product type. Existing research suggests that pass-through can vary depending on products. For example, in the SDIL, some drinks were overshifted (saw price increases greater than the tax rate) while others were undershifted (saw price increases less than the tax rate).
3: Running the impact model to generate nutrient reductions, impact on prices, and tax revenue raised
3A: How the impact model is set up
The OE impact model is split into two components: a consumer response and a producer response (Figure 2). Nesta provided input assumptions for each component, detailed below.
Figure 12: A food tax works in two complementary ways: producers reformulate unhealthy food, and/or consumers buy less unhealthy food in response to price changes
The causal pathways through which a food tax can lead to improved consumer diets, mirroring Figure 2.
Tax on unhealthy foods
This tax can lead to two main responses: * Consumer response to post-tax price changes
*   This branches into:
    *   **Consumers buy less unhealthy, taxed food**
     *   **Consumers swap unhealthy foods for healthier ones**
-
Producer response to tax
- This branches into:
- Producers reformulate products to pay less (or no) tax Both consumer and producer responses ultimately lead to:
- This branches into:
Improvement in consumer diets by consuming less 'unhealthy' nutrients like salt or calories
3B: Input scenarios for producer reformulation response
The model assumes some producers react to the tax by reformulating products to a lower NPM score, in turn reducing the tax burden. The extent of producer reformulation determines the rate of tax that is applied to different bundles of unhealthy, in-scope foods.[^23] Higher reformulation reduces the rate of tax and improves the nutritional content of unhealthy, in-scope food.
Our input assumptions on reformulation are pragmatic, informed by a review of limited evidence on the topic, and original analysis. We spoke with nutritionists to determine the likely level of reformulation possible in certain categories. We also studied the Public Health England voluntary reformulation programs for sugar, salt, and calories to understand what an ambitious yet feasible level of reformulation by industry could be.
To reflect uncertainty in how far producers may be able to, or choose to, reformulate, we modelled 3 scenarios: a central scenario, a high reformulation scenario, and a low reformulation scenario. For each of these scenarios, we made three assumptions on how producers might reformulate: the proportion of products that reformulate, the average level of reformulation achieved, and the extent to which calorie or salt reductions might drive the observed reformulation shifts.
Assumption 1: Proportion of products that reformulate
We estimated the share of unique, unhealthy products likely to reformulate under each scenario. To estimate this, we spoke with experts, did some analysis computing the share of products that currently do not reach the most applicable PHE voluntary reformulation targets, and balanced these inputs with practical considerations. We assumed that it is hardest to change the composition of chocolates, as nutrients like saturated fat and sugar are structurally important to the food.
Table 4: Input assumption on the proportion of products that reformulate for each 'super' category
| Low reformulation | Central scenario | High reformulation | |
|---|---|---|---|
| Salt- and carbohydrate-heavy products | 10% | 30% | 65% |
| Sugar- and saturated fat-heavy products | 5% | 20% | 50% |
| Chocolates | 2.5% | 10% | 15% |
Expressed as a share of total volume of in-scope products with an NPM score greater than or including 4.
Assumption 2: Reduction in NPM score for products that reformulate
We estimated the average reduction in NPM score for in-scope products that were reformulated. In addition to speaking with experts, we did two types of illustrative analysis to understand the scale of shifts possible.
One, we estimated the NPM score reduction achievable if products met PHE voluntary reformulation targets on salt, sugar, and/or calories. Two, we compared the range of NPM scores within similar product categories, to assess whether more unhealthy products had a close-enough product with a healthier nutrient profile.
Within the impact model, a product can reduce its NPM score by 1 point by either: reducing salt content by 0.225g per 100g, or reducing the number of calories by 80 calories per 100g. This is linearly scaled depending on the level of reformulation assumed, and is based on the way the NPM score is computed.[^24]
Table 5: Input assumption on the reduction in NPM score of products that reformulate for each 'super' category
| Low reformulation | Central scenario | High reformulation | |
|---|---|---|---|
| Salt- and carbohydrate-heavy products | 1 | 3 | 4 |
| Sugar- and saturated fat-heavy products | 1 | 2 | 3 |
| Chocolates | 1 | 1 | 2 |
Assumption 3: Share of reduction in NPM score from salt and calories
We also estimated how much calories and salt contribute to any reduction in NPM score. For an NPM reduction of 3 points, for example, we assessed what share is driven by changes in calories, salt, or other non-modelled nutrients such as saturated fat or sugar.
To inform this, we analysed the nutrient density of products to understand whether products have a high proportion of poorly scoring nutrients. We also looked at the strength of correlation between individual nutrients and the NPM score of products to gauge their relative contribution to a product's NPM score.
Most foods in scope of the tax had a strong positive correlation between calories and NPM score. This suggests if a product reduces its NPM score, it would likely be at least in part via relatively high reductions in calories. However, we have assumed a more conservative contribution of calories to NPM score reduction than our analysis would suggest, given uncertainty in how producers might reformulate their products in practice.
Given that salt has a weaker correlation with NPM score than calories, we have generally assumed that a lower proportion of NPM score reductions come from salt. Chocolates have a very low (to zero) concentration of salt and therefore we have assumed zero impact from salt for chocolates.
Table 6: Input assumption on the reduction in NPM score of products that reformulate for each 'super' category
| Low reformulation | Central scenario | High reformulation | |
|---|---|---|---|
| Salt- and carbohydrate-heavy products x% from calories | 20% | 30% | 40% |
| Salt- and carbohydrate-heavy products y% from salt | 10% | 20% | 30% |
| Sugar- and saturated fat-heavy products x% from calories | 20% | 30% | 40% |
| Sugar- and saturated fat-heavy products y% from salt | 5% | 10% | 20% |
| Chocolates x% from calories | 10% | 20% | 30% |
| Chocolates y% from salt | 0% | 0% | 0% |
Model output: Share of in-scope products reformulating
Putting the above reformulation assumptions together, OE computed the share of in-scope food products that might reformulate for the relevant sub-markets.
Table 7: Model output displaying volume share of in-scope foods that reformulate
| Low reformulation | Central scenario | High reformulation | |
|---|---|---|---|
| Full in-scope legislative foods | 3.1% | 10.7% | 24.6% |
| Salt- and carbohydrate-heavy products | 1.5% | 4.5% | 9.8% |
| Sugar- and saturated fat-heavy products | 1.4% | 5.5% | 13.8% |
| Chocolates | 0.2% | 0.7% | 1.0% |
Expressed as a share of volume of in-scope products that score both above and below an NPM score of 4.
Model output: Changes in prices
Price changes were then computed post-reformulation and after applying the tax on a new distribution of products in- or out- of scope of the tax. The changes in price for different sub-markets are reported below.
Table 8: Model output on percentage change in price for relevant sub-market
| Tax rate: £0.06 per kilo, per 1-point increase in NPM score for products scoring NPM greater than 4 | |
|---|---|
| Low reformulation | |
| All in-home and out-of-home food and drink | 0.56% |
| All in-home food | 1.07% |
| Full in-scope legislative foods | 4.4% |
| Salt- and carbohydrate-heavy products | 1.9% |
| Sugar- and saturated fat-heavy products | 6.8% |
| Chocolates | 10.1% |
Expressed as a share of volume of in-scope products that score both above and below an NPM score of 4.
3C: Price elasticities to determine the consumer response
The tax-driven price changes were then input into Oxford Economics' consumer demand model to reflect how changes in prices of in-scope products impact consumption of in-scope and out-of-scope products. To test the sensitivity of the consumer response model to price changes, we modelled two tax rates: a primary, lower rate of £0.06 per kilo and a higher rate of £0.12 per kilo. The reformulation assumptions across both tax rates were exactly the same.
OE's consumer demand model uses market elasticities that describe how consumer demand responds to a change in the price of each product type. These price elasticities were calculated by OE using data on consumer purchasing habits in the UK. The sub-markets broadly align with the sub-markets described in 1B. The model is based on an instrumental variable regression model and four Almost Ideal Demand Systems (AIDS) models. A Proportionality Calibrated AIDS model is used to determine cross-price elasticities due to data constraints.
3D: Subsequent reductions in calories and salt consumption
The final modelling step carried out by OE was to compute volume changes in food purchased and subsequent percentage reductions in per adult per day calories and salt consumption. The fall in calories and salt consumption is driven by changes in the calorie/salt composition of in-scope unhealthy products and falls in consumption of taxed unhealthy foods due to the increase in price. The new volume and nutritional composition (post-tax) is used to estimate the per adult per day percentage change in calories/salt that results from the policy. Changes in adult nutrient consumption are assumed to be the same for both males and females.
Table 9: Model output of percentage change in volume of purchases in relevant sub-market
| Low reformulation | Central scenario | High reformulation | |
|---|---|---|---|
| All in-home and out-of-home food and drink | -0.4% | -0.4% | -0.4% |
| All in-home food | -0.9% | -0.9% | -0.8% |
| Full in-scope legislative foods | -4.0% | -3.8% | -3.4% |
| Salt- and carbohydrate-heavy products | -1.2% | -1.1% | -0.8% |
| Sugar- and saturated fat-heavy products | -7.8% | -7.6% | -7.0% |
| Chocolates | -5.7% | -5.7% | -5.7% |
Table 10: Model output of percentage change in calories consumed per adult per day
| Low reformulation | Central scenario | High reformulation | |
|---|---|---|---|
| All in-home and out-of-home food and drink | -1.9% | -2.3% | -3.8% |
| All in-home food | -2.53% | -3.06% | -5.07% |
| Full in-scope legislative foods | -7.0% | -8.4% | -13.8% |
| Salt- and carbohydrate-heavy products | -2.2% | -3.9% | -9.2% |
| Sugar- and saturated fat-heavy products | -13.5% | -15.0% | -21.9% |
| Chocolates | -5.7% | -6.0% | -7.0% |
Table 11: Model output of percentage change in salt consumed per adult per day
| Low reformulation | Central scenario | High reformulation | |
|---|---|---|---|
| All in-home and out-of-home food and drink | -0.7% | -0.9% | -1.8% |
| All in-home food | -0.89% | -1.14% | -2.30% |
| Full in-scope legislative foods | -4.6% | -5.8% | -11.2% |
| Salt- and carbohydrate-heavy products | -2.2% | -3.4% | -7.6% |
| Sugar- and saturated fat-heavy products | -12.3% | -13.7% | -24.0% |
| Chocolates | -5.7% | -5.7% | -5.7% |
4: Modelling reductions in prevalence of obesity and the associated social benefits
Finally, we calculated the health and social benefits associated with the reductions in calories consumed due to an NPM tax using the same methodology we used in Nesta's Blueprint for halving obesity.
We assumed a baseline calorie consumption of 1922 per adult per day for foods consumed at-home, computed using the 2024 Worldpanel in-home data. Following the approach used in Nesta's Blueprint, we applied a compensation effect of 23% (Robinson et al., 2019) to account for any compensatory behaviour that individuals may show as a result of a decreased intake. We report the range of obesity impact with and without compensation, as we are applying evidence of compensation from typically individual-level studies to an intervention expected to impact the broader food environment.
We used a modelling technique developed by Hall et al. (2011) to estimate the impact of reductions in calorie intake on per-person weight change. This model is considered the gold standard methodology and was the basis of the Department of Health and Social Care's calorie model.
This body weight change was applied to body weight data reported in the Health Survey for England (HSE, 2019) to generate a population BMI distribution if the policy were implemented. This suggests reductions of 45-59 calories per adult per day could lead to a reduction in the prevalence of obesity of 16–19%. The full methodology can be found in our Blueprint for halving obesity under the 'Modelling the impact' section on pages 7-14.
Finally, we estimated there would be £9.5–12 billion in average annual benefits to society over five years compared to our baseline year. Of this, about £6–8 billion in savings are from increased Quality-Adjusted Life Years, translating to roughly 88-112,000 QALYs. We estimated this based on analysis conducted by Frontier Economics for the Tony Blair Institute (2023), assuming that the cost of obesity is directly proportional to its prevalence, in line with our Blueprint methodology.
The full results across all three reformulation scenarios and two tax rates (£0.06 per kilo and £0.12 per kilo) are reported in Table 12. The reformulation input assumptions are exactly the same for each tax rate within each reformulation scenario. Annual tax revenue raised was modelled by OE.
Table 12: Change in calories per adult per day for all in-home food, subsequent reduction in obesity rates and associated social value
| Tax rate modelled | Metric | Low reformulation | Central scenario | High reformulation |
|---|---|---|---|---|
| % reduction in calories | -2.53% | -3.06% | -5.07% | |
| Reduction in kcal per adult per day | -49 | -59 | -97 | |
| Tax rate: £0.06 per kilo, per 1-point increase in NPM score for products scoring NPM greater than 4 | Reduction in kcal per adult per day after 23% compensation | -37 | -45 | -75 |
| Relative reduction in obesity rates* | -13% | -16% | -24% | |
| Associated total social value (£ billion)* | 7.9 | 9.5 | 15.0 | |
| Social value from QALYs (£ billion)* | 5.1 | 6.2 | 9.7 | |
| Total QALYs saved*[^25] | 73,221 | 88,103 | 138,577 | |
| Annual tax revenue raised after 5 years of implementation (£ billion)[^26] | 1.61 | 1.56 | 1.43 | |
| % reduction in calories | -4.6% | -5.0% | -6.7% | |
| Reduction in kcal per adult per day | -88 | -96 | -129 | |
| Tax rate: £0.12 per kilo, per 1-point increase in NPM score for products scoring NPM greater than 4 | Reduction in kcal per adult per day after 23% compensation | -68 | -74 | -99 |
| Relative reduction in obesity rates* | -22% | -24% | -32% | |
| Associated social value (£ billion)* | 13.9 | 14.8 | 20.0 | |
| Social value from QALYs (£ billion)* | 9.0 | 9.6 | 12.9 | |
| Total QALYs saved* | 128,307 | 137,268 | 184,949 | |
| Annual tax revenue raised after 5 years of implementation (£ billion)[^27] | 2.85 | 2.76 | 2.55 |
*Modelled using estimated reduction in calories after applying 23% compensation
Endnotes
- Recipe for Change is a coalition of 47 health organisations, Royal Medical Colleges and food campaigners led by Sustain, Obesity Health Alliance, The Food Foundation and Action on Salt and Sugar, with support from British Heart Foundation, and Impact on Urban Health.
- The lower bound of 45 calories assumes reduced calorie intake from taxed foods is compensated by a 23% increase in consumption of calories from other sources, in line with existing evidence and our Blueprint policy impact modelling methodology. See footnote 11 for more details.
- Daily reductions in calories were estimated as 6,500 annual calories divided by 365 days from Dickson et. al, 2021. Baseline at-home calorie consumption from food and drinks is estimated to be 2,183 calories per adult per day, using data from Worldpanel by Numerator's Take Home panel over the period 1st January to 31st December 2024
- At Nesta, we sometimes use a more intuitive converted score using a formula developed by the University of Oxford that ranges from 0 (least healthy) to 100 (most healthy).
- Expressed as a share of total adult food purchased for consumption at home based on Nesta analysis of data from Worldpanel by Numerator's GB Take Home panel 1st January to 31st December 2024. Includes products that score both above and below an NPM score of 4. See table 2 in the technical appendix for more details.
- Nesta analysis of data from Worldpanel by Numerator's GB Take Home panel 1st January to 31st December 2024. Includes both food and drink.
- The sales-weighted share of product volume sold (as a proportion of all food and drink volume sold for consumption at home) scoring above NPM 25 is from Nesta analysis of data from Worldpanel by Numerator's GB Take Home panel 1st January to 31st December 2024.
- Price elasticity measures how responsive consumers are to changes in price. Specifically, price elasticity of demand describes the percentage change in the quantity of a product purchased in response to a one per cent change in its price.
- We also modelled a zero reformulation scenario with a higher tax rate. Results were very similar to the low reformulation scenario and therefore are not reported separately.
- We assume a baseline of 1922 calories consumed per adult per day from food purchased for consumption at-home, based on Nesta's analysis of data from Worldpanel by Numerator's GB Take Home panel, 1st January to 31st December 2024.
- While the modelling by Oxford Economics already includes some compensation effects, we have incorporated a more conservative 23% compensation effect in line with existing evidence and with our Blueprint for halving obesity methodology.
- Based on Nesta analysis, where we applied a £0.06 tax rate per kilo to the unhealthiest foods. Does not account for reformulation or potential pass-through from producers to consumers.
- We estimated this based on analysis conducted by Frontier Economics for the Tony Blair Institute (2023), assuming that the cost of obesity is directly proportional to its prevalence, in line with our Blueprint for halving obesity methodology. Estimates based on 2023 figures on the cost of obesity.
- A QALY is a standard measure in healthcare that combines the quantity (length) and quality (health status) of life into a single value, helping to assess effectiveness and cost-benefit of interventions.
- Estimated by Oxford Economics as annual tax revenue raised 5 years after implementation of an NPM tax, in 2024 prices.
- Nesta analysis of data from Worldpanel by Numerator's GB Take Home panel 1st January to 31st December 2024.
- The government published a slightly different NPM model in January 2026 from the original 2018 NPM model update. Neither is active in policy at time of publication.
- We assume that calories from out-of-home contribute 14% to an adult's overall calorie consumption using estimates from the National Diet and Nutrition Survey. We applied a 10% growth in total calories from OOH food and drink from 2021 to 2024, based on an estimated 8-12% growth in total calories from OOH food and drink from 2021 to 2024 from our analysis of data from Worldpanel by Numerator's Out of Home panel, from 1st April 2021 to 31st December 2021 as well as publicly cited data. The lower bound assumes the tax applies only to large OOH businesses and includes a 23% compensation, in line with our earlier methodology, while the upper bound assumes the tax applies across the entire OOH sector and includes no compensation.
- As defined under Schedule 1 of The Food (Promotion and Placement) (England) Regulations 2021
- Soft drinks and juice drinks (with added sugar) fall in scope of existing restrictions on placement and promotions of unhealthy foods.
- Nesta assumed an 8-12% growth in total calories from out-of-home food and drink from 2021 to 2024 from our analysis of data from Worldpanel by Numerator's Out of Home panel, from 1st April 2021 to 31st December 2021, also cited by the government. We picked a middle of the range 10% growth to apply on spend, with estimated out-of-home food and drink spend growing from £43.8 billion in 2021 to £48.2 billion in 2024.
- Sourced from Annex_table 2 in Data tables: Changes in food and drink purchasing behaviour and the impact on diet and nutrition: 2021 to 2023. Nesta compared this list to data from Worldpanel by Numerator's GB Take Home panel, 1st January to 31st December 2024.
- Where unhealthy is defined as products in-scope scoring NPM 4 or above.
- We assume that producers do not reformulate below an NPM score of 3 (the no-tax level) in certain scenarios. For example, a salt/ carb heavy product scoring NPM 5 in the central scenario would reformulate to NPM 3—a reduction of 2 points—rather than reformulating down to NPM 2. This is because producers face no price incentive in reformulating more than just below the tax threshold.
- The current monetary value for a QALY is £70,000 in 20/21 prices following guidance in The Green Book.
- Modelled by Oxford Economics. Direct revenue raised by the tax in 2028 based on 2024 prices and inflation.
- See footnote 26.


