Acknowledgements
We would like to thank everyone who contributed to the project, through providing ideas or advice to the project team, or reviewing the final report, including: Camille Stengel, Federico Andreis, Daniel Lewis, Izzy Woolgar, Andy Hackett, Madeleine Gabriel, and Katy King.
About Nesta
Nesta is the UK's innovation agency for social good. We design, test and scale solutions to society's biggest problems. Our three missions are to give every child a fair start, help people live healthy lives and create a sustainable future where the economy works for both people and the planet.
For over 20 years, we have worked to support, encourage and inspire innovation. We work in three roles: as an innovation partner working with frontline organisations to design and test new solutions, as a venture builder supporting new and early-stage businesses and as a system shaper creating the conditions for innovation. Harnessing the rigour of science and the creativity of design, we work relentlessly to change millions of lives for the better.
Find out more at nesta.org.uk
If you'd like this publication in an alternative format such as Braille or large print, please contact us at: [email protected]
About Centre for Net Zero
Centre for Net Zero (CNZ) is a not-for-profit, impact-driven energy research institute, founded by the Octopus Energy Group. Operating autonomously, our goal is to accelerate the journey to a fully sustainable, global energy system.
While technology is transforming the energy sector, both modelling and policymaking are typically based on data from the past. By contrast, CNZ can access unprecedented insight into future human behaviours by leveraging Octopus Energy's global customer base. We design and run research and field trials around the world to generate and democratise data about the future energy system.
Our team comprises data scientists, economists, strategists and policy experts – collectively advancing tech-driven energy systems that benefit humanity.
Find out more at centrefornetzero.org
Executive summary
Our field trial shows that remotely controlling smart thermostats can meaningfully manage heat pump electricity consumption.
The Government's Net Zero Strategy assumes that up to 11 million homes in the UK will use heat pumps by 2035. Heating people's homes in this way will increase demand for electricity, which means that electricity capacity, transmission and distribution will need upgrading. But if heat pump users could consume less electricity during periods of peak demand, there could be less need for expensive upgrades to the grid. Reducing peak demand could also decrease the grid's use of fossil fuels, cutting carbon emissions.
One method of reducing the consumption of heat pumps during periods of peak demand is through the use of automation. Automation enables demand reduction to be achieved without any ongoing action from household occupants, reducing the cognitive burden on them. Controlling smart thermostats remotely is a way to do this. We sought to address a need for evidence of how automating heat pumps could be used to reduce demand by conducting a research project, called HeatFlex.
We found that the automated operation of heat pumps can result in meaningful reductions in electricity consumption during times of peak demand.
We conducted a field randomised controlled trial from February to April 2024, involving 30 'HeatFlex events'. During these events we remotely controlled participants' heat pumps for four hours. In our trial, half our 43 participants took part in HeatFlex events (the Treatment group), and the other half did not (the Control group).
Our main findings are:
- A reduction in household electricity consumption of 0.123 kWh per half-hour (p = .003) during the flexibility window (when we directed the heat pumps to produce less heat). This is a 32% reduction of typical consumption (specifically, the average household electricity consumption of our Control group at the same time).
- A reduction in heat pump electricity consumption of 0.382 kWh per half-hour (p < .001) during the flexibility window. This is a 74% reduction of typical consumption. We believe the above whole-household consumption reduction is smaller in magnitude than this heat-pump-specific consumption reduction partly because many of our participants have solar photovoltaics and batteries. These reduce whole-household consumption during the periods of day when we typically hold HeatFlex events for both the Treatment and Control group, reducing the effect of our intervention.
- Broad acceptance of automation from participants. Participants were happy to take part in events and for their heating to be automated. Participation in events was high: in only 9% of instances (n = 36) did participants opt out of events before they started, which was typically because they were not going to be at home.
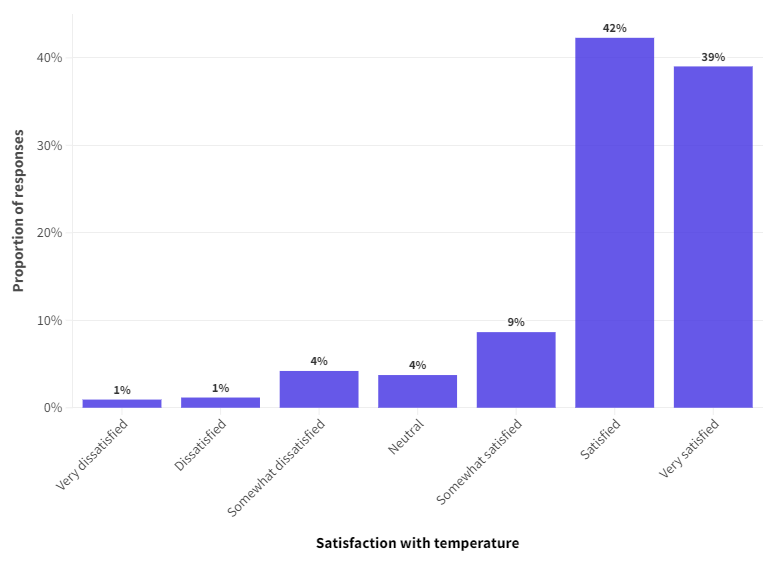
- Participants were comfortable with the internal temperature of their homes. We found that, on average, the internal temperature in the homes of those who took part in HeatFlex events increased by 0.85°C during the two hours when we preheated homes before turning down the heat pumps for two hours. The internal temperature was still on average 0.16°C higher at the end of that second two-hour period, compared to the start of the preheating period. The majority of participants were happy with the internal temperature of their home: in 81% (n = 348) of the 428 responses in our post-event surveys (across all 30 events), participants said that they were either "Satisfied” or “Very satisfied” with the temperature in their home.
While our sample was small (43 participants) and is unlikely to be representative of the current population of heat pump owners, our findings show that it is possible to reduce demand by operating heat pumps remotely, without compromising thermal comfort.

Our findings have three implications for the future of automated heat pump flexibility.
- Automated heat pump flexibility can provide consistent, large and meaningful demand shifting.
Our trial shows how this impact could scale through automation an intervention as simple, non-intrusive and passive as changing thermostat setpoints more than halves consumption from heat pumps during peak times. Separate work by Centre for Net Zero shows large impacts from heat pump owners adopting a heat pump-specific time-of-use tariff already in the market.
- Interoperability is crucial to unlocking the potential of heat flexibility.
Enabling automated heat pump flexibility requires a method of remote operation. In our trial, we found that there is no current single solution to reliably and consistently connect every heat pump to a device that enables the remote control of heating setpoints. This might change as heat pump adoption in the UK grows. Requiring an additional device to enable remote operation may not be a necessary, or even desirable, long-term solution, but the extent to which interoperability can be achieved will determine the reach of automated flexibility.
- The potential level of demand reduction from the automated control of heat pumps will depend on the prevalence of low-carbon technologies in the home, such as batteries.
If many homes have low-carbon technologies, such as batteries, the level of direct demand reduction from heat pumps may be lower due to homes already flexing their consumption in other ways. Conversely, there is potentially more opportunity for automated heat flexibility where homes are not already reducing their consumption during peak demand. However, we note that more granular price signals and dynamic automation might lead to greater opportunities for flexibility, particularly beyond peak demand shifting.
1. HeatFlex: our intervention and main findings
Context
Decarbonising domestic heating is critical if the UK is to reach net zero by 2050. The Government's pathway to decarbonising heat is based on installing 600,000 heat pumps per year by 2028, rising to as many as 1.9 million per year from 2035.
Replacing gas boilers with heat pumps powered by electricity will require a greater supply of electricity. Electricity demand is expected to more than double by 2050, and this rise will increasingly be met by variable renewable generation. The grid infrastructure will also need to be reinforced to deliver this electricity to heat homes. The cost of such upgrades is large: the Electricity System Operator (ESO) has recently proposed a £58 billion investment in the electricity grid for it to meet the demand for electricity in Great Britain by 2035.
One way to avoid expensive grid upgrades is to lower the demand for electricity at peak times. Reducing peak demand could also lower carbon emissions: fossil fuel generation is often currently used alongside renewable generation to meet the peak demand requirement. Reducing peak demand could mean either reducing consumption or 'shifting' it to other times of the day – known as 'demand flexibility'. Ofgem, the GB energy regulator, defines flexibility as "modifying generation and/or consumption patterns in reaction to an external signal (such as a change in price) to provide a service within the energy system". Flexibility is already being taken into account when thinking about pathways to net zero.
The potential benefits of demand flexibility to the system and consumers are significant. The latest National Infrastructure Assessment suggests that a highly flexible system can save £12 billion each year by 2050. Centre for Net Zero modelling estimates £5 billion in annual savings by 2035 from flexible domestic heat and transport demand alone, including reducing distribution capacity needs by 25%. Some households are already seeing direct benefit through their bills today, with a time-of-use tariff for heat pumps saving customers £318, or 18% of annual energy bills.
However, there is currently limited understanding of how heat pumps can be used flexibly in practice. As we have seen in smart electric vehicle (EV) charging, automation could potentially shift heat demand with limited consumer effort. Building the evidence base on how successful heat pump flexibility works in a real-world setting could help provide better estimates for policymakers seeking to understand – and realise – intelligent and flexible future energy systems.
HeatFlex: our research into heat pump flexibility
In 2022, Nesta and Centre for Net Zero started collaborating to contribute to the evidence base on heat pump flexibility. Our project aimed to complement other research into heat pump flexibility by exploring what widespread flexibility could look like. We developed an event-based intervention, during which we remotely controlled participants' heat pumps for four hours during ‘HeatFlex events'. Our intervention had two novel features: (i) the demand shifting was fully automated, so occupants did not have to take any action; and (ii) it sought to keep household temperatures at an acceptable level by preheating homes.
We hypothesised that the two features – automation and preheating – could result in high levels of participation, resulting in a more consistent, widespread amount of demand shifted. This, in turn, could result in a large aggregated reduction in peak electricity demand due to the high number of households that would be willing to provide flexibility.
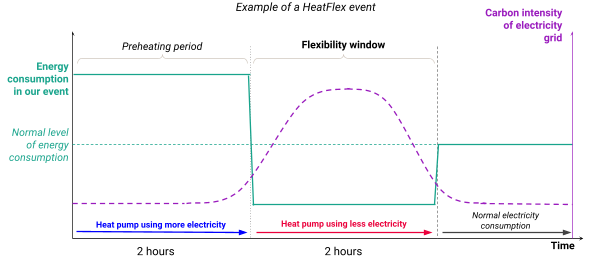
The diagram below illustrates how our intervention worked during a typical evening when there is a period of peak demand between 16:00 and 18:00. We remotely controlled heat pumps to turn on before peak times to preheat homes. During peak times, we directed the heat pumps to produce less heat, reducing the energy consumption of the heat pumps. We called this the 'flexibility window'. We used a smart thermostat to do this, so we could remotely control setpoint temperatures for each participant.
We asked household occupants to provide a maximum and minimum temperature range, in which they felt comfortable, to inform the setpoints used in the preheating period and flexibility window. The ranges provided by participants can be found in the Technical appendix.
Figure 1. Illustration of a HeatFlex event
Our findings in a nutshell
Our findings show that heat pump flexibility was effective when we controlled the heat pumps via a smart thermostat (semi-direct load control). Most participants were happy with this method of control, and we also found that most participants were comfortable with the temperature of their homes during events.
Our research addresses some key questions about heat pump flexibility. Specifically, we show that flexibility does not need to come at the cost of thermal comfort: through preheating, household temperatures during the events generally remained within the temperature ranges in which participants were comfortable. We also did not find evidence that consumption increased after our events. This may be because internal temperatures did not decrease materially below customers' typical setpoints, partly due to the effectiveness of preheating.
More broadly, our research indicates that heat pump flexibility is a potential tool to reduce the demand on the electricity grid at peak times. Our estimate of the potential reduction in household consumption (measured with smart meters) – 32% – is material and could result in a large decrease in absolute terms across many households. It is also noteworthy that our intervention went almost unnoticed by household occupants in many cases. For these reasons we believe that it could be scaled across a wide number and range of households.
Our analysis of the heat pump consumption data – measured with heat pump monitors – suggests that greater reductions could be achieved. We found an average reduction of 74% in terms of heat pump consumption. For homes without a battery or solar photovoltaics (PV), we might expect potential whole-household demand reductions to be closer to this 74% figure (depending on the proportion of total household consumption the heat pump comprises).
With that said, for households that are already 'flexing' their consumption by reducing consumption during peak times through the use of batteries and/or solar PV, or by using tariffs designed, through price signals, to avoid consumption at peak times, the potential reductions will likely be less than the overall reduction found in the context of HeatFlex. For these homes, we found that household consumption during events could be close to zero in some cases. Consequently, reducing heat pump consumption may result in very small decreases in household consumption (or none at all if there is no electricity from the grid being used) – even if there were material decreases in heat pump consumption.
The future of automated heat pump flexibility
Our research supports the notion that heat pumps can be used flexibly, and could be one of a suite of tools used to reduce peak demand, particularly during cold spells when heat demand needs shifting the most. Our intervention may not result in the most demand reduction possible from a home, but we think that it provides an estimate for a broadly acceptable, widespread form of heat flexibility. In our view, there are two key policy implications if this form of automated, event-based heat flexibility were to be used effectively at a larger scale.
Interoperability is needed as automated flexibility scales up.
We used a smart thermostat to control the heat pumps remotely, which enabled us to control their setpoints. However, we faced interoperability issues when installing the smart thermostat, which ultimately limited our sample size.
Interoperability will need to improve to enable widespread adoption of smart thermostats for heat pump flexibility through setpoint modulation. For the heat pumps that have been installed to date, new solutions must be provided: there are new smart thermostats that can enable remote control of heat pumps, but so far, the range of heat pumps they are compatible with is limited.
While we expect common standards to evolve over time as the heat pump market grows, we also need policy intervention to ensure that future standards allow for smart functionality of new technologies that can integrate with a net zero energy system. Our trial underpins the importance of the Government's Smart Secure Electricity Systems Programme to design the technical and regulatory frameworks for energy smart appliances, including minimum appliance-level requirements that ensure heating systems are interoperable as well as business model agnostic.
Our trial showed the potential for heat flexibility in homes with heat pumps with the automated control of temperature setpoints. There are other options to achieve household flexibility, such as using a battery or a vehicle-to-grid technology.
The benefit of our intervention is that it requires much less capital expenditure to access than batteries or vehicle-to-grid solutions for EVs. A customer's outlay for a smart thermostat may be as little as £100. This lower cost means that HeatFlex-style flexibility could be used across a broad population. Most homes with heat pumps could most likely benefit from this kind of intervention, which is not the case for vehicle-to-grid solutions for EVs, where some homes do not have access to off-street parking.
In scenarios where the majority of homes have batteries, the form of flexibility tested in this trial may be much less valuable. But in a scenario where fewer homes have batteries, changing the heat pump's consumption in a style similar to our intervention could be an important, effective tool to reduce the demand on the grid, complementing other forms of flexibility provided by batteries and/or EVs.
2. Research aims and methodology
HeatFlex aimed to address gaps in current understanding of the use of heat pumps as flexibility assets – specifically, the extent to which automated flexibility could reduce electricity demand at a given point in a day, without reducing the thermal comfort of home occupants. We intended to contribute to the following research areas.
- Demand reduction achieved during events. Our primary area of focus was to estimate demand reduction caused by our remote control of customers' smart thermostats. We measured electricity demand at a household level with smart meters, and at the heat pump level with heat pump monitors. Our hypothesis was that our automation would increase electricity consumption during the preheating period and reduce it during the flexibility window.
- Acceptability of automation and preheating. We also explored the extent to which our intervention was acceptable to participants, in particular the automation of their home heating and their experience of events. To do this, we interviewed participants throughout our trial. Our hypothesis was that acceptability of the intervention would vary by household and member of household, but that it would typically be acceptable.
- Thermal comfort of participants. We also tested whether we were able to successfully maintain thermal comfort during events. We did this using internal temperature data from smart thermostats, interviews and surveys sent after each event. Our hypothesis was that comfort would also vary by household and occupant, but that participants would typically be comfortable.
Research design
We used a mixed methods approach to address our research questions.
We collected a variety of data to help us generate evidence for our research areas.
- We collected household and heat pump consumption data via smart thermostats and heat pump monitors (discussed further below).
- We conducted qualitative semi-structured interviews with a subset of participants who took part in events during the second half of the trial, with some following the end of the trial. These included a floor plan exercise, whereby participants discussed their experience of events, referencing a floor plan of their home (see Technical appendix for further information).
- We asked participants to complete online surveys after each event they took part in, which were administered by email. We also asked participants to complete a survey when they joined the trial, which captured characteristics about them, their homes and other occupants they lived with.
- We collected internal temperature data via the smart thermostats that were necessary to take part in events.
We combined this data to create an in-depth understanding of the impact of our intervention on participants, and it enabled us to corroborate findings across multiple data sources.
We recruited 43 Octopus Energy customers with heat pumps to take part in our field trial.
We contacted Octopus Energy customers in three geographical areas in which Octopus Energy Services could install the necessary equipment to participate in our trial. We offered a £100 gift card as an incentive to participate, alongside a free smart thermostat and a heat pump monitor to any households that needed them. Our final sample comprised 43 participants.
There were 10 instances where we could not install a heat pump monitor in participants' homes due to the absence of a convenient plug socket or insufficient wi-fi connection. As a result, 33 of the participants had a heat pump monitor successfully installed along with the smart thermostat, while 10 had the smart thermostat only.
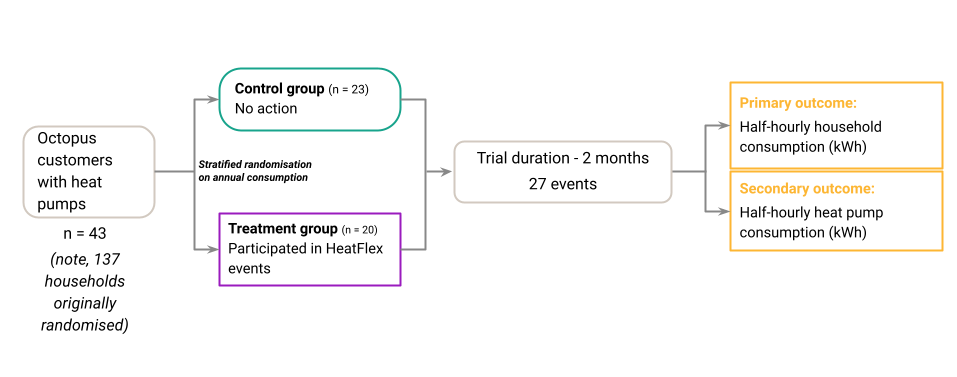
We conducted a randomised controlled trial to estimate the impact of our intervention on overall household consumption, and on consumption from the heat pump itself.
We used a two-armed randomised controlled trial to estimate the impact of our intervention on household consumption. We used stratified randomisation (stratifying on estimated annual consumption quintiles) to allocate customers to Treatment or Control groups. The Treatment group took part in the HeatFlex events, with their heat pumps remotely controlled; the Control group only had their household and heat pump consumption measured without taking part in events.
We conducted the randomisation process before installing our monitoring devices and smart thermostats on a group of 137 willing households. However, issues with installations resulted in 43 of these households taking part in the trial, with the remaining 94 households not taking part in the trial (see Technical appendix for more information). The result was 20 households in the Treatment group and 23 households in the Control group.
For our main analysis, we use an Intention-To-Treat (ITT) design, whereby we did not exclude participants who opted out of events when estimating our average Treatment effect. This approach eliminates the potential for bias that would arise if only participants who opted into events were included (see the Directed Acyclic Graph in the Technical appendix). It also produces an estimate that is potentially more realistic, in that it accounts for the eventuality that not every household would consistently participate in events in a real-world scenario. However, note that we included in our sample only the 43 households who received installations (we did not include the other households who were randomised).
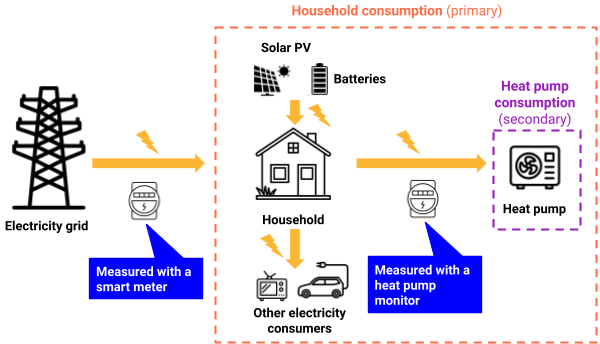
We measured electricity consumption during HeatFlex events in two different ways.
- Household consumption (measured half-hourly via smart meters; our primary outcome measure): household consumption is the amount of electricity each household draws from the electricity grid. This comprises demand from heat pumps and any other electrical appliances. It is also affected by technology such as solar PV panels and in-home batteries, both of which provide alternatives to importing electricity from the grid at the time of use. Consumption of electricity from solar PV and batteries would not be captured by the smart meter, at least not in the half-hour that it was actually consumed by the household.
- Heat pump consumption (measured half-hourly via heat pump monitors; our secondary outcome measure): we installed heat pump monitors so that we could understand the direct impact of our intervention on heat pumps. It also enabled us to draw comparisons between household and heat pump consumption on a household-by-household basis.
We also captured information about internal temperature from the smart thermostat. This data was routinely collected by the smart thermostats, and enabled us to detect any changes in internal temperatures. Finally, we surveyed participants after each event, capturing feedback on thermal comfort, instances of opting out and other information. Further details on our research design can be found in the Technical appendix.
Implementing HeatFlex events
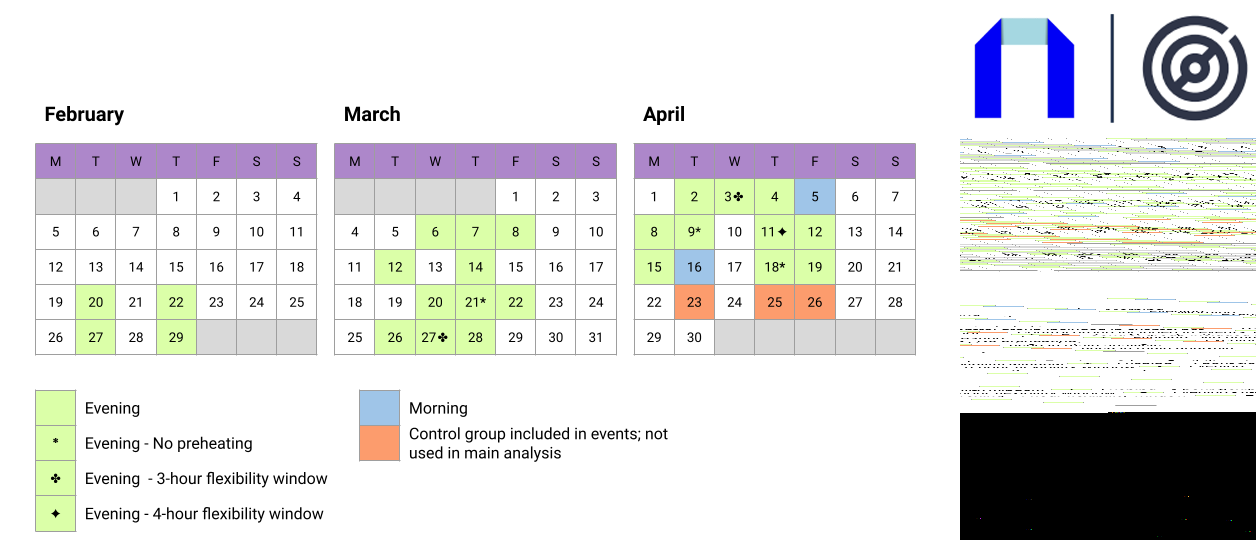
We ran 30 events from February 2024 to April 2024, typically comprising a two-hour preheating period and a two-hour flexibility window.
We conducted our first event on 20 February 2024, and our final event on 26 April 2024. HeatFlex events typically occurred between 16:00 and 20:00 on weekday evenings; we used the first two hours for preheating, and the second two hours for the flexibility window. Participants were notified by email 24 hours before an event took place, and were able to opt out of an event if they were not going to be at home, or for any other reason (see Technical appendix for more information).
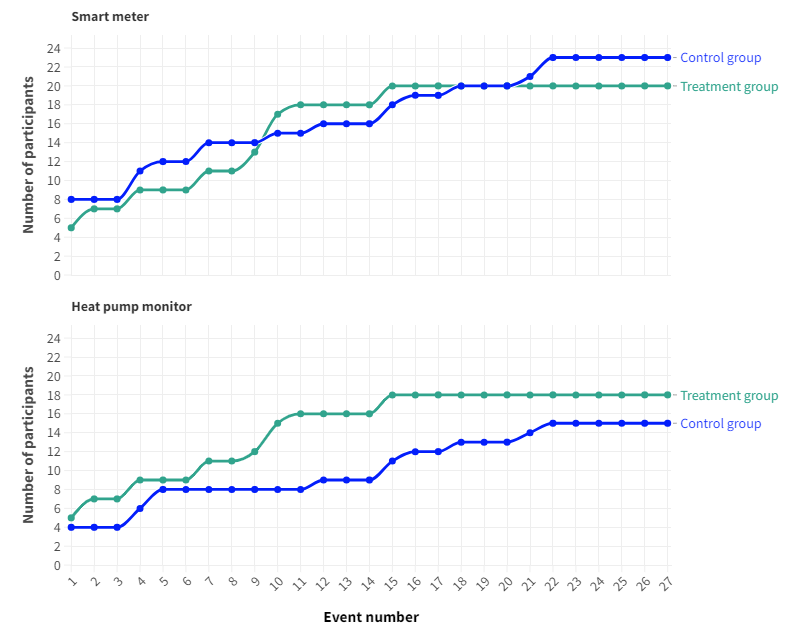
Participants joined our trial throughout the period in which we were running events due to the need to install the smart thermostat and the heat pump monitor before taking part in events (as shown in the chart below). As a result, we had a total of 861 household events for the household consumption analysis, and 645 household events for the heat pump consumption analysis.
3. Findings from the HeatFlex trial
In this section, we report in further detail the core findings from our trial, grouped into the three main research areas set out in the introduction: (i) demand reduction achieved during events; (ii) acceptability of automation and preheating; and (iii) thermal comfort of participants. First, we discuss the participants involved in our trial and some broader limitations.
About our participants
All of the participants in our trial were:
- Octopus Energy customers
- owners of air source heat pumps
- not using smart tariffs specifically designed for heat pumps or batteries
- had actively expressed interest in participating.
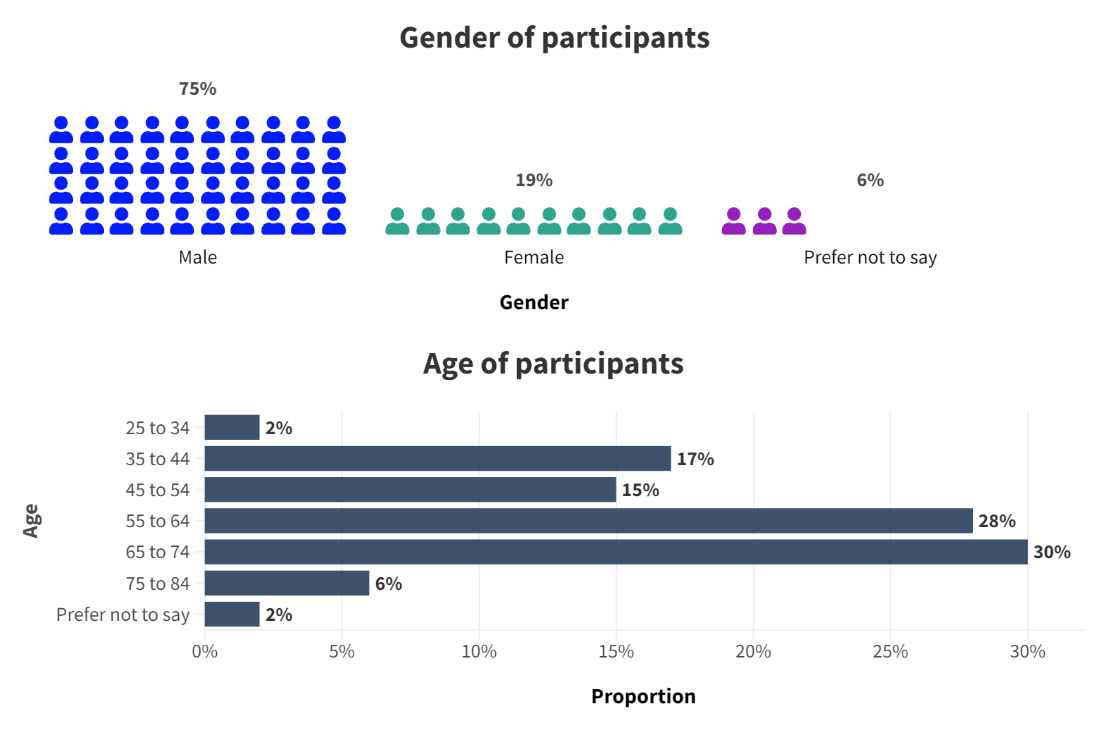
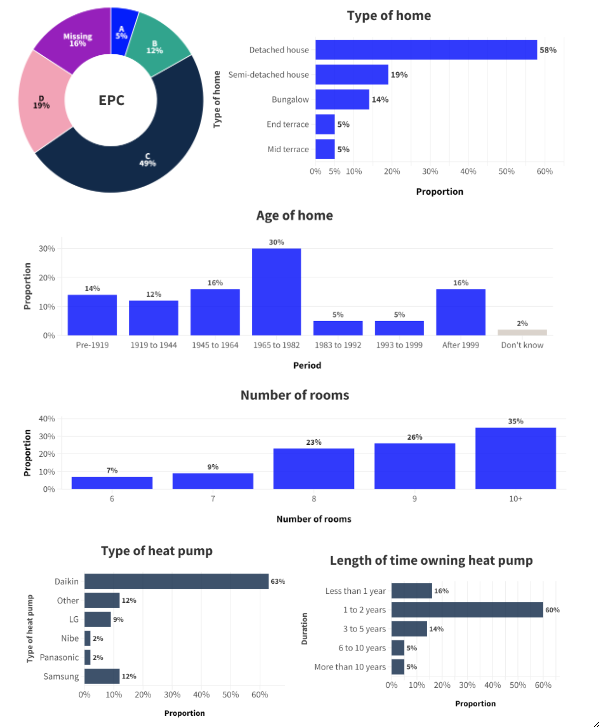
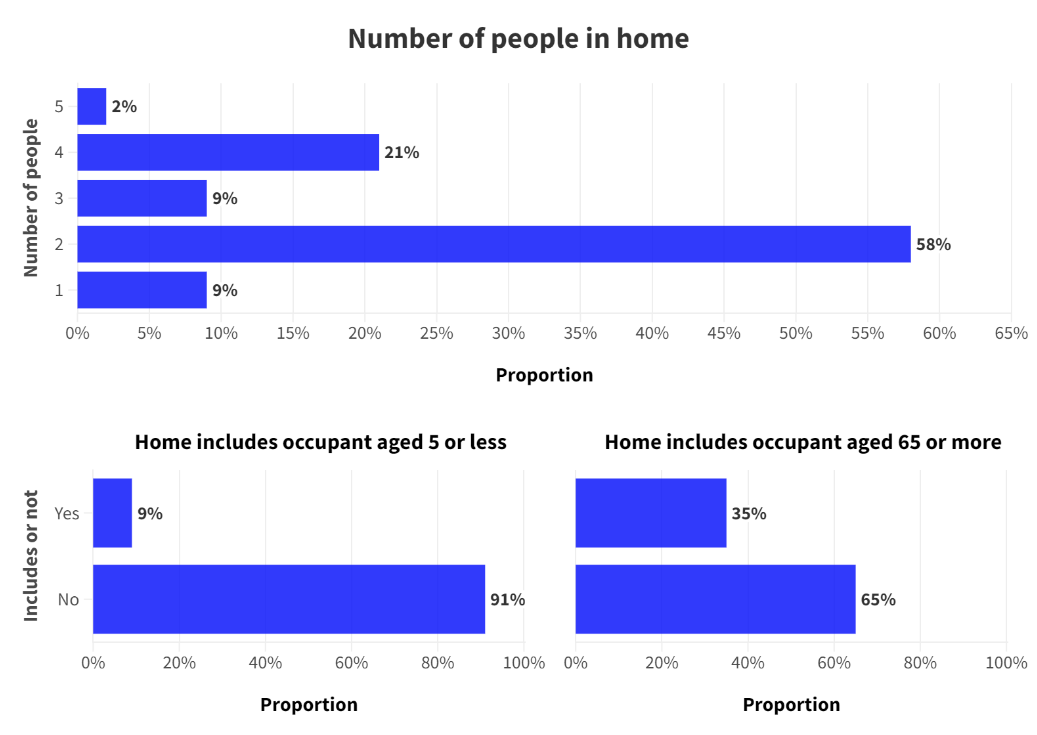
When thinking about our results, it is important to keep in mind that the findings are unlikely to fully generalise to the wider population of heat pump owners in the UK. Our sample is small – 43 households – and the behaviour of the occupants, their heating systems and other aspects of their home may differ from the broader population.
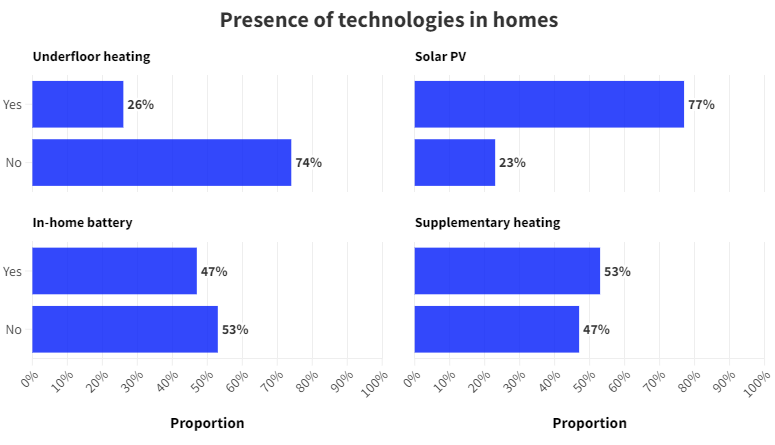
Another aspect to highlight is the prevalence of other LCTs in the households of our participants. 47% (n = 20) of our participants reported that they had in-home batteries in the survey they completed when they joined the trial. 77% (n = 33) said they had solar PV, and 79% (n = 34) said they had an electric vehicle. In Nesta's survey of heat pump owners in 2022, we found that around 14% of the 2,500 respondents used an in-house battery, and around 45% had solar PV – a lower proportion than the sample in this trial. It may be that future heat pump owners are more or less likely to have other LCTs, versus current early adopters, as the respective technologies become more commonplace. Households can use LCTs to reduce the reliance on electricity supplied by the grid, such as storing electricity in batteries or generating their own electricity using solar PV, thereby reducing the need to use electricity from the grid, or reducing consumption during times when the cost of electricity is high.
Research area 1: demand reduction achieved during events
Heat pump electricity consumption
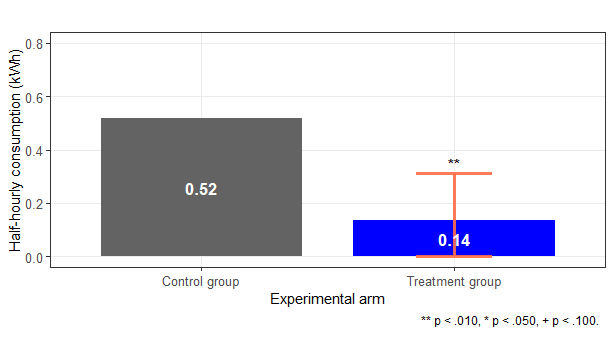
We found a statistically significant 74% reduction (0.382 kWh) in heat pump energy consumption during the flexibility window (p < .001).
We conducted multivariate regression analysis to determine whether the difference in heat pump consumption was statistically significant, comparing consumption in our Treatment and Control groups while adjusting for key characteristics about these participants (more information can be found in the Technical appendix). We estimated that our intervention resulted in a 0.382 kWh reduction in half-hourly heat pump consumption for the Treatment group, compared to the Control group (p < .001, 95% Confidence Intervals: -0.559; -0.206) – a 74% reduction of typical consumption during that time (specifically, the Control group mean). This result indicates that our intervention caused a large decrease in heat pump consumption during the flexibility window.
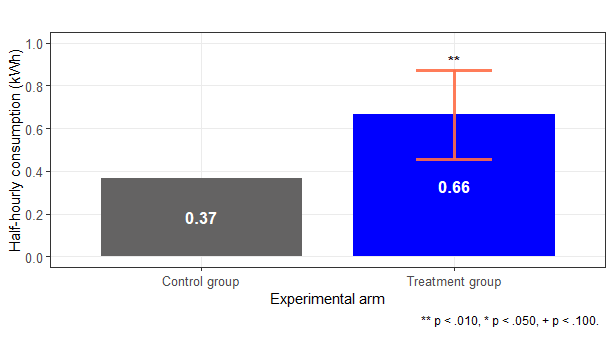
We also found a statistically significant 78% increase (0.296 kWh) in heat pump energy consumption during the preheating period (p = .005).
We conducted a similar regression analysis using half-hours from the preheating period to determine whether our intervention also caused an increase in consumption. We estimated that our intervention resulted in a 0.296 kWh increase in the Treatment group compared to the Control group (p = .005, 95% Confidence Intervals: 0.087; 0.505) – a 78% increase (of the Control group mean).
Household electricity consumption
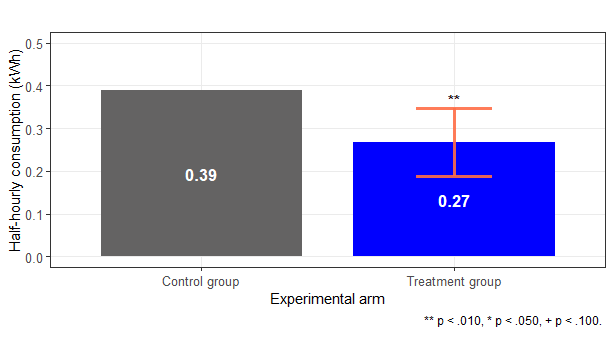
We found a statistically significant 32% reduction (0.123 kWh) in household energy consumption during the flexibility window (p = .003).
We estimated that our intervention resulted in a 0.123 kWh lower half-hourly household consumption for the Treatment group, compared to the Control group (p = .003, 95% Confidence Intervals: -0.202; -0.043) – a 32% reduction (of the Control group mean). This finding indicates that our intervention resulted in a meaningful decrease in household consumption.
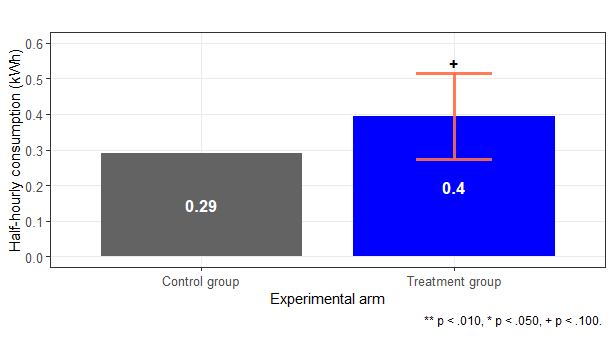
We did not find a significant difference between household consumption for the Treatment and Control group during the preheating period (p = .090).
Unlike the analysis for the heat pump consumption data, we did not find a significant difference in household consumption between the Treatment and Control group for the preheating period (p = .090, 95% Confidence Intervals: -0.016; 0.226). We note that the direction of the Treatment effect was as we would have expected (an increase).
The prevalence of batteries and solar PV within our sample may have resulted in a smaller effect size for whole-household consumption compared to heat pump-specific consumption.
We found a greater reduction in heat pump-specific consumption than whole-household consumption – both in terms of absolute kWh and in terms of a percentage of the Control group mean (0.382 kWh / 74% reduction versus 0.123 kWh / 32% reduction, respectively). Part of this may be due to the different samples used for the analysis – only 33 of the 43 participants in our full sample had heat pump monitors. The presence of other devices that consume electricity would also affect the percentage change (although the absolute change, in kWh, would be similar).
We believe that a key reason may be the presence of solar PV and batteries in some participants' homes. This resulted in lower average half-hourly whole-household consumption (consumption as measured by the smarter meter) than half-hourly heat pump-specific consumption (as measured by the heat pump monitor) (see the Technical appendix for more information). We found that, in some instances, household consumption was close to zero, which could occur if the electricity supplied by a battery and solar PV is sufficient, such that no electricity is needed from the electricity grid. For these households, reducing heat pump consumption may result in very small decreases in household consumption, or no decrease at all even if there were substantial decreases in heat pump consumption.
Further analysis
Our robustness checks broadly corroborated our main findings.
We conducted robustness checks using randomisation inference and Bayesian inference (details on the approach can be found in the Technical appendix). We found that:
- for the analysis on heat pump consumption data, our robustness checks supported our primary analysis showing reduction in the flexibility window, but were equivocal regarding any difference in the preheating period
- for the analysis using household consumption data, our robustness checks broadly supported the main analysis (evidence of a reduction in the flexibility window, and no evidence of a difference in the preheating period).
We did not find evidence of a 'kickback' in heat pump or household consumption in the two hours after events.
'Kickbacks' are a phenomenon that has been discussed in other demand response studies, whereby heat pump consumption is higher than typical after a period of reduced heating. For both the household and heat pump consumption, we did not find evidence of an increase in either heat pump or household consumption in the Treatment group compared to the Control group in the two hours after events (95% Confidence Intervals, respectively: [-0.201; 0.051] and [-0.118; 0.034]). As we explore in the next section, our expectation is that preheating may help remedy the overall cooling of homes, reducing the requirement for the heat pump to kickback after HeatFlex events.
Participation in events was high: around 85% across all events.
Participants could opt out of events if they were not going to be home, or for any other reason. We wanted to avoid inadvertently heating properties when participants were not home, but also to focus on the experience of household occupants. We found that, for the 407 times a participant in the Treatment group could take part in an event, participants opted out of 36 (9%) before the event started.
There were also instances where participants did not take part in events for other reasons. This was primarily where participants told us they were going to be on holiday or away for an extended period of time – in which case, they were excluded from events during this period. Across the trial duration, there were 29 instances (7%) of this happening.
Overall, our participation rate was 84%. Note that our analysis includes all participants – even if they opted out or were not at home – as part of our Intention-To-Treat design.
Research area 2: acceptability of automation and preheating
This section details our qualitative research investigating to what extent participants found our intervention acceptable. We conducted semi-structured interviews with 15 out of the 20 participants from the Treatment group in April and May 2024 (starting during the trial and completing after the final event). We asked participants about their installation journey, their thermal comfort outside of events, their heating regimes, utility bills and whether they were happy with their heat pump. Our interviews also included a visual floor plan exercise of participants' homes (more information on our qualitative research methodology can be found in the Technical appendix).
Participants were happy with their heat pump prior to joining the HeatFlex trial.
Participants were overall satisfied with the installation, running costs and heat provided by their heat pumps before joining the trial. For example, one participant said they were “very satisfied really” with their heat pump experience, expanding that “I've had no problems with it. So, yeah, I have nothing to complain about so far.” Similar sentiments were echoed by most participants we spoke to.
Some participants had their heat pump installed during the global energy crisis of 2022-2023. As a result, they had found it difficult to compare their utility bills to their previous heating system. One participant explained: “Before, we had gas. So the cost is difficult to calculate because obviously prices are going up.” However, they did not “think [that] the first year we were unsatisfied. Although we were quite tight with its use.” For participants like this person, they didn't remember being unhappy with the overall running costs when they first installed their heat pump.
Of those interviewed, only two participants mentioned issues when using their heat pump before the trial. One participant explained how their first heat pump was too small to adequately heat their home, and they resorted to increasing the size of their heat pump. The other participant reported consistently low heat pump efficiency and low levels of satisfaction with internal temperatures that had only partially been rectified by numerous visits from engineers. This suggests that, overall, participants we spoke to were content with their heat pump before being involved in the HeatFlex trial.
Participants were comfortable with remote automation of their heat pump during the trial.
Of the 15 interviewees, 14 reported being very comfortable with the remote automation of their heat pump. One remaining participant described some initial hesitancy at handing over control to automation, explaining, “So I guess I like control. Especially over anything IT or technological on my property. So there's a little bit of a sense of giving up a bit of control there.” However, they still decided to participate, and were comfortable after experiencing the intervention.
Participants described a range of factors that influenced their attitude towards the remote control aspect of the trial. Some participants felt comfortable with the automation due to feeling they understood the purpose of the trial. Some people specifically mentioned the clear communications provided at the beginning of the trial and for each event, while others felt that “I can see what you're [HeatFlex project team] doing, and I'm quite happy with that. It doesn't have any real impacts on me at all. So, yeah. No problem at all.”
One participant felt at ease with the remote automation aspect of the trial due to the ability to opt out, explaining “[The intervention] is not a worry. It doesn't seem to affect us very much. I mean, obviously if you were turning it off and sitting [in the] cold, I would override it and turn it on again. It is easy enough”. Participants also described finding the automation acceptable due to being comfortable with internal temperatures during events. When asked about their experience of automation, one participant told us “For a lot of temperatures, it's [the intervention] not noticeable... You hadn't told me you were doing it, I would never have known.” This is a promising finding that suggests the intervention did not negatively impact participants' experience of thermal comfort, and in some cases the automation was imperceptible.
Finally, a further common motivation for accepting our remote automation was a desire to help the research and believing in its importance. We heard “We felt very comfortable with you controlling our heating. I am familiar with Nesta [..] I am also comfortable with Octopus.” While this is a positive finding, it also suggests that we should be cautious about over-interpreting customers' acceptance of our intervention as an indication that they would proactively engage with a similar service in a business-as-usual situation.
Other household members tended to have similar experiences to the lead participant, or were not aware of events taking place.
We asked our participants how their experience of the events compared with others in the household. We conducted three interviews where two adult members of the household were present, while the remaining 12 interviews only included one adult. We found that for most people, the wider household was initially aware of the interventions taking place, but there were no strong objections to the heating events. A number of participants remarked that other members of their household had stopped noticing events taking place after a short period of time. One participant explained how, “If I didn't tell my other half that there was a HeatFlex event, she wouldn't notice, and she said that as well. And I've not told her on some days to see whether she would notice or not – and she didn't notice.”
Some lead participants told us that other members of the household had initially been sceptical about joining the trial, but their concerns had been alleviated as time went on. One participant explained how their partner “was a little bit concerned at first, but, you know, I asked her after each one, 'did you notice?' And she's not [noticed].” These examples suggest that the heating events largely went unnoticed by other members of the household, which is a promising finding.
Across our interviews, there were two cases where participants reported their other household members being slightly more cautious of participating in the trial. One participant mentioned that their spouse liked the consistent temperature of an air source heat pump, and stated that the trial was “kind of almost going against that by changing the temperatures.” Another participant mentioned how their partner probably wasn't “100% convinced that we need all this remote control access”. Notably, neither of these concerns were directly related to any feeling of discomfort during the events themselves.
None of the participants we interviewed reported that they opted out of events due to automation of their heating.
A key aspect of our research was ensuring that participants did not feel obliged to participate in events. Indeed, we encouraged them to opt out if they felt uncomfortable during events, or to opt out before an event started if they were not going to be at home. The 15 interviews revealed that participants opted out before events solely because they were away from home during the event period.
We asked participants if there was anything that might have led them to opt out during events. Two reasons were provided. Participants recognised that extremely cold periods may have changed their willingness to participate in events. We heard statements from a number of participants such as “If it had been really cold. We might well have done [opted out]”. It is worth noting that the coldest external temperature during a flexibility window was 3.5°C, so household experiences may have changed in colder conditions.
The other reason provided for a potential opt out was if our events had clashed with the Octopus Energy Saving Sessions. One person told us that “the only reason I might consider [opting out] is if one one of them conflicted [with other events]. So there's a couple of things I take part in with Octopus. One is the Saving Session”. As part of our intervention plan we intentionally avoided holding events on the same days as Saving Sessions in order to avoid situations like the one this person described.
Event variations did not have a big effect on participants' experience.
Across the trial we implemented three different variations to our heating events. Not every household was exposed to all our variations due to being away or onboarding to the trial at later dates. However, among participants who did experience these variations, very few even remembered any changes to events, despite being notified in advance of their occurrence.
The first variation was a morning event between 07:00 and 10:00, with one hour of preheating and two hours of flexibility. We had originally hypothesised that morning events could be contentious due to the potential to interrupt sleeping patterns. However, participants reported feeling comfortable with these events, with one person saying, “I think nobody noticed very much”. During this first variation many participants had already preheated their homes overnight due to cheaper tariff rates.
The second variation was an evening event with no preheating phase, just a flexibility period between 18:00 and 20:00. Similar to the first heating event, participants reported not remembering or noticing the lack of preheating. None of the participants expressed any dissatisfaction from taking part in these events. One person told us how they were “very impressed at the temperature. I did actually think to myself, I might notice the difference. I might notice it getting noticeably colder, but it actually didn't. It fell to just about 20 degrees and it stayed at that level. And that's perfectly comfortable.” This sentiment was echoed by other participants, suggesting that their homes had a slow rate of heat loss and were broadly unaffected by the heating event.
Our third variation was also an evening event, consisting of two hours of preheating and three hours of flexibility between 16:00 and 21:00. Many of the participants did not notice a difference between standard events and these longer events, and no one reported strong objections. Two different participants mentioned that they found the end of the longer events to be a bit cold, responding by putting on jumpers or using blankets. One person said that during the last hour of the event they could “put a warm blanket on instead of turning on the heating” noting that this was “a normal pattern for us anyway” and so they were unperturbed by the heating event.
Overall, our findings from the interviews suggested that the participants were broadly happy with the intervention, or did not notice a change in their home environment during the heat events. We note that we did not interview everyone who took part in the trial, so it may be that these participants held different views about the automation of their home heating. It is also important to be clear that each of the quotes reflect the views of a single participant, and the views of other participants may differ.
Research area 3: thermal comfort of our participants
Our third and final research aim relates to the thermal comfort of participants. This section aims to explore whether we were able to maintain the thermal comfort of participants, as our use of setpoints was intended to do. We used a variety of data sources to understand how the internal temperature of homes changed, and the impact this had on participants, including surveys, interviews and temperature data collected by the smart thermostat.
Internal temperature data from the smart thermostats indicated that our intervention worked as expected.
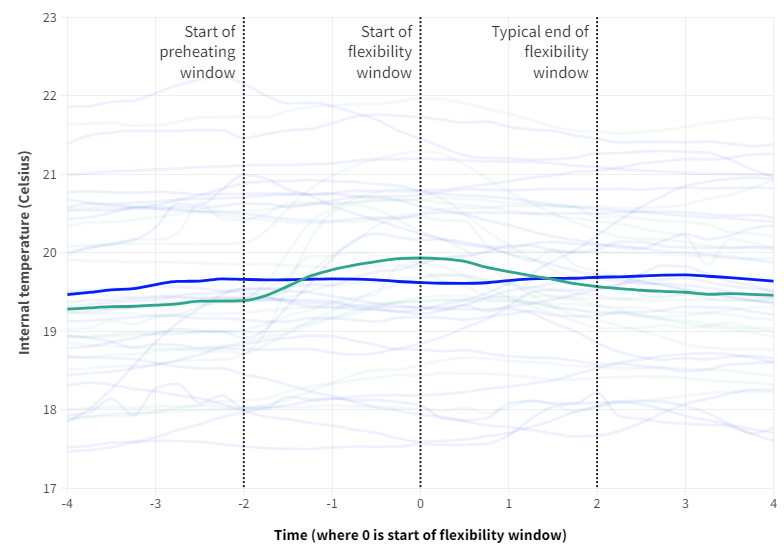
The smart thermostat used to remotely control the heat pumps also collected internal temperature data. This allowed us to check whether internal temperatures changed as expected (increasing during the preheating period and decreasing during the flexibility window).
The chart below shows that internal temperatures typically remained between around 17.5°C and 22°C. We found that the average temperature in the Treatment group at the end of the flexibility window was 0.16°C greater than the temperature at the start of the preheating period, indicating that temperatures rose higher in the preheating period than they fell in the flexibility window.
We found that internal temperatures in the Treatment group increased by, on average, 0.85°C during the preheating period. We note that the average temperature difference varied between participants in the Treatment group. Some increases were less than this, whereas others were much greater (nearly an average 2°C increase for one participant). Different factors can affect the extent to which the temperature increased during the preheating period, such as size of heat emitters, size of the heat pump, or the level of insulation.
Most participants said they were comfortable during the preheating period and flexibility window.
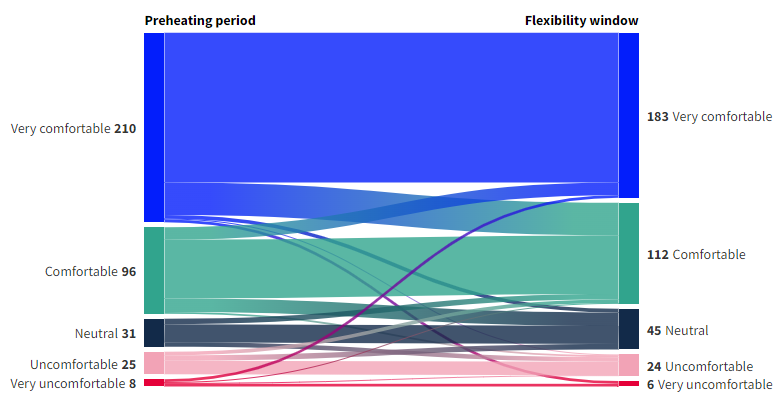
In our survey, we asked participants to rate their thermal comfort in the preheating period and the flexibility window from “Very comfortable” to “Very uncomfortable”.
The chart below shows the range of responses to these questions. 73% (n = 306) of respondents rated themselves as “Very comfortable” or “Comfortable” in the preheating period. Similarly, 80% (n = 295) rated themselves as “Very comfortable” or “Comfortable” in the flexibility window. We also found that most responses had the same rating for both periods – 73% (n = 269). This data suggests that participants generally were comfortable in both the flexibility window and the preheating period.
We collected responses from multiple occupants, where possible: in eight households in our Treatment group, at least two occupants responded to our survey. However, given the very low number of responses, we are not able to make meaningful comments about differences between the experiences of participants in the same household.
Most participants said they were satisfied with the temperature during events.
Most participants who were at home during events reported that they were either “Satisfied” or "Very Satisfied” with the temperature during events (81% [n = 348]). We note that a participant could be satisfied with the temperature even if they were uncomfortable – for example, if they thought the cool temperature was worthwhile as they were reducing their electricity consumption. Therefore, satisfaction is a less precise measure of thermal comfort, but it overall suggests that participants were happy with the temperature in their home.
There were only eight instances where survey respondents opted out during events.
Of the 501 responses to our post-event survey, there were only eight times where respondents reported they opted out after an event had started. Of these eight times, half of them were when respondents were too warm (in the preheating period). The other four were due to participants missing the opt-out email, or erroneously adjusting the thermostat during events.
We had expected opting out during events to be relatively rare, as it would suggest that the temperature had become unacceptably hot or cold, rather than just being uncomfortable. The very low occurrence rate – 2% of the time – reinforces the finding that we were able to maintain the thermal comfort of participants during events.
We heard in interviews that participants were generally comfortable with internal temperatures, although some found initial events to be too warm.
We asked interviewees about their overall experience of events, as well as specifically if they had noticed any changes in comfort during the preheat or flexibility window. In our 15 interviews, nine participants reported that they had stopped noticing events or did not find them uncomfortable. A number of people mentioned finding the preheating phase to be "a little warm" during their first events. One person told us “I think that we've not really noticed much difference to be honest. I think the very first one that that happened, we noticed that it was a little bit warmer than we'd normally have a house."
In some instances, we believe that the maximum temperature used as the temperature setpoint for the preheating period may have initially been too high. We established this based on free text responses in the post-event survey, and one participant opting out during the preheating period. As a result of this, we provided participants with the option to change their maximum and minimum temperatures after experiencing some of the events. We recorded two participants requesting to lower their maximum temperature.
There were two cases where participants reported feeling cold during the events. One person mentioned “the main thing is the change in temperature makes it seem colder than it really is" during the flexibility window. This is due to the difference in temperature compared to the preheating window, despite their home being at a temperature they would normally find comfortable. They explained how people in their household “know it's not cold because it's the same temperature. And yet we're thinking it was a bit chilly”. They suggested that "it's just what we get used to and then it starts cooling down [in the flexibility phase].” A different participant mentioned feeling cold “early on, maybe two or three times” and putting on more layers in response, but that these incidents were “nothing compared to what we did the previous year when we weren't using any gas [due to the energy crisis]”. This comment suggests that, while they felt the cold during parts of the trial, it was manageable overall and easy to adjust their comfort level through an extra jumper or blanket.
Interview participants felt that they had not made any changes to routines, although some reported changing clothing to adapt to events.
Using the floor plan exercise (see the Technical appendix for details), we asked participants to recall whether they had adapted or changed any of their behaviour or routines due to the heat events. A number of people mentioned that they normally change clothing throughout the day, with some people specifically saying that they had been adding or removing clothing in response to the heating events. One participant explained how they “take a layer off and you can put up with it [preheat phase]. It usually comes back on during the evening.” However, this person was not sure if this related to the heat event, stating “but I don't really notice just what time the jumper comes back on", suggesting this behaviour did not overly impact their experience of the event.
We also asked some participants about the frequency of events and whether they have any preferences for how often the events took place. The participants asked this question stated that they would be happy with an increased frequency, potentially even doing them every day of the week. These responses were driven by the participants typically not noticing the events, and hence being happy with an increased frequency. One person mentioned that they would prefer to have events every day, saying “if you know it's going to be every day you could plan for that rather than discovering the day before that there's one tomorrow.” However, this sentiment was not reflected by all participants, and other participants mentioned that spacing out the heating events would be more conducive to their schedules. One person suggested that the events “should probably be separated by a week or so. And the only issue that's not normally a problem is because we tend to be away at weekends because we have some childcare responsibilities during the week.” These quotes suggest that it is tricky to find a heating events schedule that will work for everyone, and that flexibility of the event itself could be a key aspect to increasing participation without people having to modify their behaviour.
As mentioned previously, none of the people we interviewed opted out of any events. However, one person mentioned that they did change their normal car charging routine on the day of an event. They explained that:
“There was one day where I knew it was going to be particularly cold. And I knew that the batteries would be close to running out. I plugged the car into charge and I just said to Octopus that we need a certain percentage in the car by this time."
While this cautious approach is understandable, this person reflected that this adaptation may not have been necessary as “looking at the end of it, I think we probably would have had an extra 20% [of charge], we probably would have been okay by the end of the day without it.” This example suggests that, while this particular participant's behaviour was modified due to a heating event, this change was ultimately not needed. Given that most participants felt they made no changes to their behaviour during the events, this suggests that, on the whole, the events did not disrupt people’s routines.
Limitations to our findings
Although our results appear to be promising about heat pump flexibility, there are some important limitations to our results.
- Our sample size was small and is unlikely to be representative of the broader population of heat pump owners. As discussed at the start of this section, our sample for our analysis on household consumption was small, at 43 participants. Our sample for the heat pump analysis was smaller, at 33 participants. Notably, only the final events had full participation due to the accumulation of our sample across the trial period. This impacts the generalisability of our results as our sample is unlikely to be representative of the wider heat pump population. The other limitation to small samples is that randomisation is less likely to result in experimental arms being similar in terms of observable and unobservable characteristics. For example, a higher proportion of the Treatment group (five households, 25%) was in the top quintile (80% to 100%) of estimated annual consumption than the Control group (one household, 4%). This means that differences between the groups may not solely be the result of our intervention.
- Due to the slow accumulation of participants throughout the trial, we were not able to identify trends over time. One of the aims of running multiple events was to explore whether participants changed their behaviour in the longer term, or if there were other learning effects. From our interviews, we did not find any evidence of these kinds of effects, but we were not able to verify this with our quantitative data as each event typically had a different group of participants.
- Our post-event survey had a completion rate of 78%, meaning that not all our participants are represented. Of the 407 times a participant in the Treatment group could have taken part in a HeatFlex event, 78% (n = 318) of the time, they also completed the post-event survey. While this completion rate is very high compared to typical survey response rates, there is still meaningful non-response, in that we failed to capture the experiences, thermal comfort and other feedback from 22% of participants on average. This means that there could be bias in our analysis if those who did not respond to the survey would have responded differently to those who did.
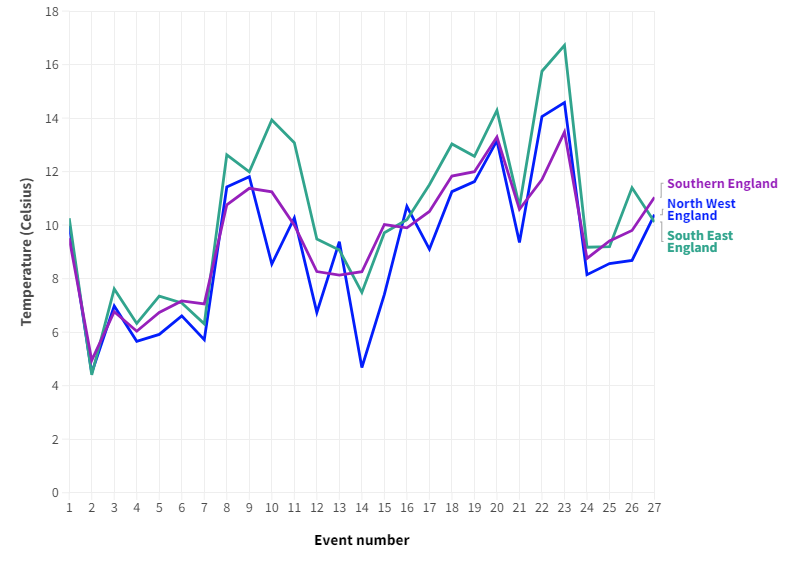
- Our trial did not capture the coldest of months. We ran events from February to April in 2024. As shown in the graph below, our initial events had external temperatures between 4°C and 10°C, but we did not have any events with temperatures below this. As discussed previously, our view is that colder temperatures could change the extent to which demand can be reduced because of greater heat loss from homes.
4. Conclusion
Our research adds real-world evidence to the notion that domestic heat flexibility could play a role in the management of future energy systems. As heat is electrified, a relatively simple intervention to automate heat pump demand (preheating with smart thermostats) can scale to shift heat demand away from peaks, including during cold spells, when the grid needs it most. Our research suggests this intervention is feasible while maintaining comfort, with broad acceptance of the automation from participants.
Our research has cast a light on the importance of considering the experiences, behaviours and motivations of the people living in households with LCTs. We found that our participants were both interested and motivated to provide flexibility through the use of batteries or preheating their homes overnight. However, it is not a given that every heat pump owner in the UK will be as motivated or as aware of the potential benefits of providing flexibility as those who took part in our trial.
To unlock the potential of heat flexibility, automation can make it easier for consumers to take part while maintaining comfort; interoperability of devices is an important enabler for this as heat pumps become more widespread. But households also need to be aware of and incentivised about flexibility through consumer advice and a market framework which exposes them to price signals. This will be critical if widespread engagement with flexibility is to be harnessed in the future.
5. Technical appendix
Implementing HeatFlex events: how we remotely operated heat pumps
Our intervention revolved around making adjustments to internal temperature setpoints remotely.
The basic premise of our intervention was that the operation of the heat pump could be controlled by setting internal temperatures at levels to either increase consumption or decrease consumption. The smart thermostat we used controlled heat pumps in an "on/off” manner, rather than adjusting the internal flow temperatures or another form of load management. To this end, our intervention relied on setting temperatures above the internal temperature of the home to preheat the home, or below the internal temperature to reduce heat pump consumption during the flexibility window.
We recognise that this approach is not the optimal way of controlling a heat pump. However, we found this method to be easy to implement while maintaining a degree of automation by virtue of the API remote controls. One benefit of this approach was that it simplified the process of controlling the heat pumps of different households: all we needed was the target temperatures for the preheating period and the flexibility window to implement our intervention.
We used an API system developed by Centre for Net Zero, which enabled us to change the internal temperature setpoints of each household. This required the authentication key of each smart thermostat, which was gathered by Octopus Energy's R&D app.
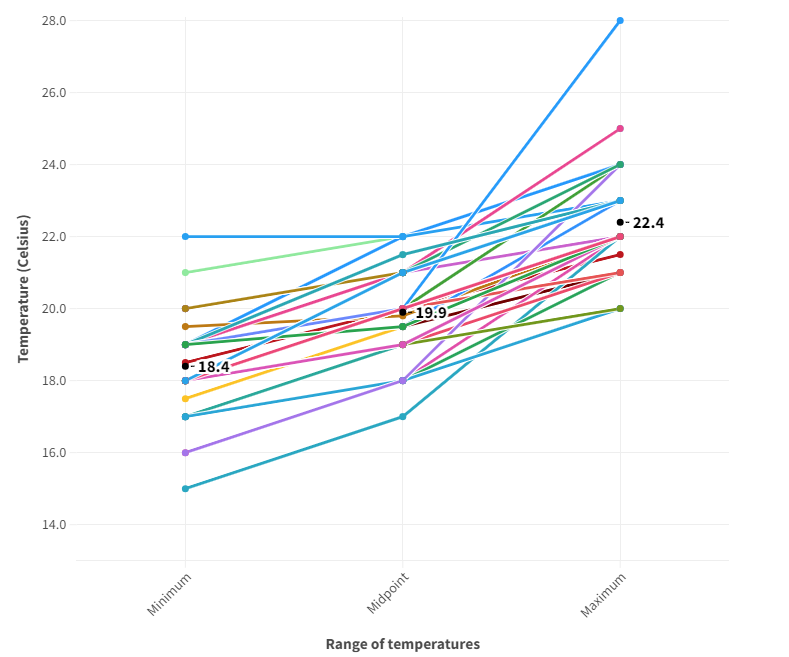
During a survey completed at the start of the trial, we asked participants to provide minimum and maximum temperatures ranges in which they would feel comfortable. We used this information to inform the setpoints for the preheating period and the flexibility window. Note, we did not make this explicitly clear to participants as we were concerned that this may elicit other responses, such as participants trying to maximise their demand reduction, compromising their thermal comfort. We also asked other occupants from households about their temperature preferences. In cases of different temperature ranges from different occupants, we took the highest minimum and the lowest maximum. Ideally, this approach would mean that internal temperature ranges would remain within the range provided by participants, helping to ensure thermal comfort.
Participants could change their temperature settings after they had participated in some events. A small number reduced their maximum temperature at this point but no one requested to increase their minimum temperature setpoints. The chart below displays the temperature ranges we used for events for each participant.
Participant communications around events.
We sent emails to participants at three points around events.
- Email 24 hours in advance: the email notified participants of the date and time of the event, and gave the option to opt out.
- Reminder email one hour before: the email was sent to the participants who had not yet opted out.
- Post event email: this email contained a link to a post-event survey.
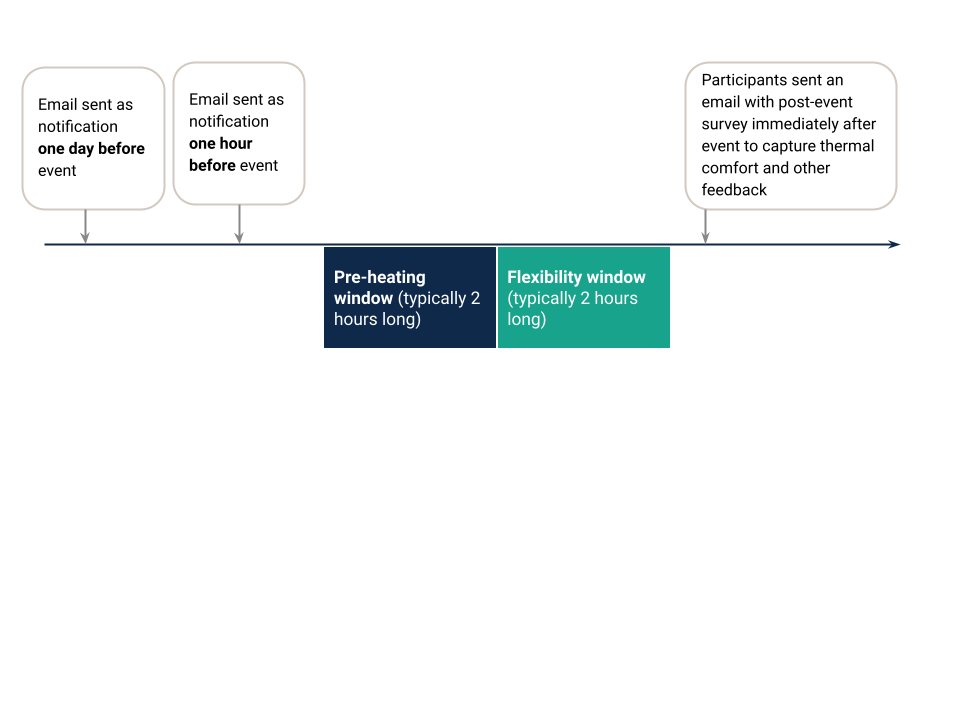
Participants were able to opt out before and during events.
We made it clear that there was no requirement to take part in events if participants did not wish to. They were able to opt out at two points.
- Before the event started. Participants were sent notifications (emails) the day before events. Participants were asked if they want to opt-out of events in the email. We encouraged participants to opt out if they were not going to be at home, so that we did not preheat their home without them being present (which would potentially increase their total energy consumption, and therefore costs). Similarly, we asked participants to notify us if they were going to be away (such as on holiday) so that we could exclude them from events.
- During events. Participants were instructed that changing the temperature setting of their smart thermostat would opt them out of that specific window (either the preheating period or the flexibility window). So, participants who changed the settings on their smart thermostat during the preheating period still took part in the flexibility window, unless they also changed the settings on their smart thermostat during the flexibility window.
The ability to opt out was important from a research ethics perspective, but was also a behavioural outcome that was of interest to us. We hypothesised that participants may opt out of events before they occurred if they were not happy about participating, potentially hinting at a lack of acceptance of our intervention.
We specifically told participants that if they were too hot or too cold during events they should opt out. We made this suggestion to avoid situations where participants were uncomfortable with the temperature, but refrained from opting out, perhaps due to a Hawthorne effect. We also communicated this so that we could use opt outs as a behavioural measure of thermal comfort (we asked participants to say why they opted out in a survey after each event).
As part of the onboarding process for our trial, we installed smart thermostats and heat pump monitors to any households that did not have them.
To unlock the potential of heat flexibility at a system level, large numbers of heat pumps will ideally be able to respond to signals from system operators. As well as the core research questions, we were interested in gaining insights into the sorts of technical solutions that might be needed to implement a HeatFlex-style service or product at scale in the medium- to long-term.
The market for flexibility products and services in the UK is in relative infancy. The intervention we tested within HeatFlex was a bespoke technical implementation designed for the trial. It was not based on an existing service offered by Octopus Energy. It involved using existing software (the Octopus R&D app) and hardware devices (the smart thermostat) for purposes they were not specifically designed for.
We aimed to recruit customers with heat pumps from a range of different manufacturers to help with the generalisability of our results. This involved allowing expressions of interest from a wide range of Octopus customers, then filtering them to a smaller group based on advertised compatibility between the smart thermostat and their specific heat pump.
We found some attrition at the point of installation. Issues included device compatibility, and considerations of where hardware could physically be positioned in a home (such as access to the heat pump or internal connection). Some customers with more complex multiple-zoned systems also opted out when they became aware that participating in the trial would require their system to temporarily run as a single zone (unless they decided to purchase additional smart thermostats at their own expense).
Qualitative research methodology
We conducted qualitative semi-structured interviews with participants.
Interviewing participants who took part in the events provided rich insight into how household behaviours could increase or minimise the potential flexibility from our intervention. The interviews also provided an opportunity to gather contextual information that was not collected through our surveys. Moreover, through the interviews we aimed to explore the lived experiences of participants, including how they felt and behaved within their homes, and overall obtaining a more nuanced understanding than we could achieve using purely quantitative data.
We conducted 15 interviews, representing 75% of the participants in our Treatment group. Primary participants were invited to interview via email with a £20 incentive, and the invitation was extended to other household members as well. No interviews were conducted with participants from our Control group. Interviews took place over a period of about four weeks and only after a participant had taken part in at least four events. The interviews were divided into two sections; semi-structured questions and a floor plan exercise (see below). The semi-structured interview focused on the following topics.
Context:
- satisfaction with heat pump prior to HeatFlex
- changes to heat pump made post installation
- operation of heat pump.
Experience of events:
- experience of participation in events
- comfort and preferences with remote automation
- opt outs from events and rationale
- wider experiences of other household members.
We conducted the interviews via Zoom then transcribed the recordings and uploaded them to Nvivo. We did a thematic analysis to identify important themes, understand how they related to each other, and generate insights into participants' interaction with the intervention.
We incorporated a visual floor plan exercise into part of the interviews to help us understand participants' experiences in greater depth.
The second half of the interviews consisted of a guided floor plan exercise. We asked participants to send a floor plan of their accommodation (see example below). These typically came from the purchase of the property, the EPC certification or a drawing by hand if they did not have access to any documentation. We recreated the floor plans in a digital format that could be shared on an interactive whiteboard as a prompt for discussion during the interview. During the interview we asked participants to label the following key features on their floor plan:
- the location of the hot water cylinder
- the location of the heat pump outdoor unit
- the location of any smart thermostatic radiator valves
- the primary location of the thermostat
- any areas of the property that were hot or cold during the flexibility events
- whether doors were predominantly open or closed
- the location and type of heat emitters.
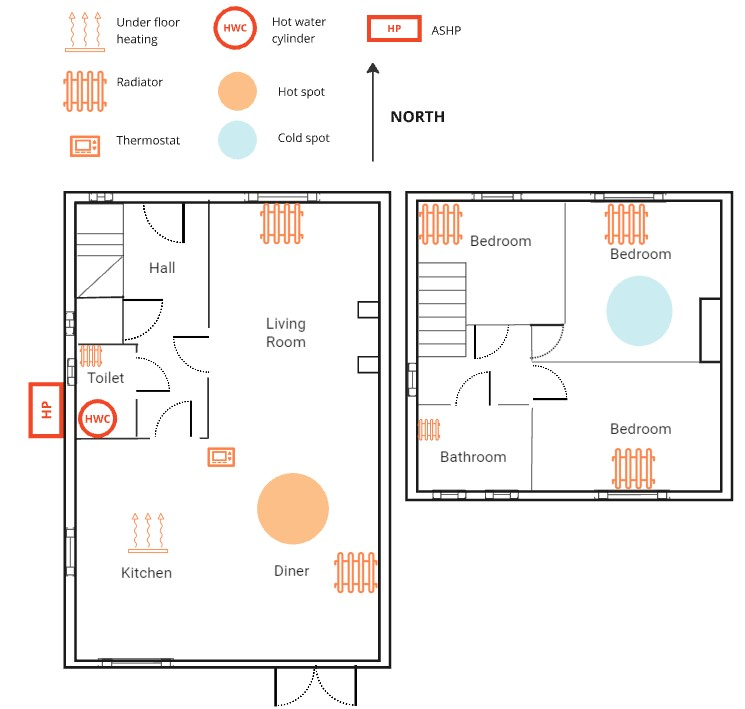
We used the labelled floor plans to ask participants about their behaviours and activities during events. We added notes, under the participant's direction, enabling us to build a picture of the routines and habits of participants, while exploring whether any of their behaviours had changed in response to our events. We also used the floor plan exercise to gather deeper feedback around variations we introduced to our events and any wider reflections about participants' experiences in the intervention.
Analytical strategy
Randomisation approach
Our trial used a 'waitlisted' Control group: participating households in the Control group were told they would participate in HeatFlex events at a later date (randomly determined). At the end of the trial in April, we conducted three additional events so that participants in the Control group could take part in three events. We did not include consumption data from these events in our analysis, but we did include the follow-up survey responses.
We used stratified randomisation to allocate households to one of the two experimental arms. We stratified on estimated annual electricity consumption in kWh (0-20th percentile, 20-40th percentile, 40-60th percentile, 60-80th percentile, 80-100th percentile, or missing).
Causal model representation via Directed Acyclic Graph (DAG)
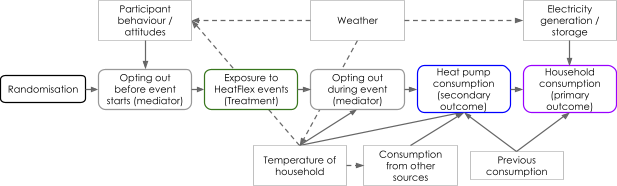
We constructed a Directed Acyclic Graph for our intervention to display our key assumptions about the causal relationships between variables. Below, we display a simplified version of our Directed Acyclic Graph (there is a more detailed version on Miro).
Analysis relating to half-hourly household electricity consumption during the flexibility window
For our primary regression, we used linear regression to estimate the Intention-To-Treat (ITT) effect of our interventions on the primary outcome (half-hourly electricity consumption during events). Standard errors were clustered on each household.
For the primary analysis, we conducted the analysis using consumption data from only the flexibility window.
The model was specified as follows:
Y_eht = α + β_T Treat_h + β_E Event_dummy_e + β_B Baseline_eh + X^T_eht β + ε_eht
Where:
- Y_eht is the half-hourly electricity consumption of household h during event e for half hour t
- Treat_h is a categorical variable (with two levels) denoting household h is in either the Treatment group or the Control group
- Event_dummy_e is a dummy variable for each event e
- Baseline_eh is the previous average half-hourly household electricity across the time period of the data of analysis (for example, flexibility window) on weekdays in November, December and January for household h for event e
- X^T_eht is a vector of covariates, as follows:
- (i) Region for household h (categorical);
- (ii) Heating Degree Days for household h for event e, defined as the average of (maximum of ( 0 |15.5 - half-hourly regional temperature)) in the relevant hours during event e;
- (iii) Estimated annual consumption for household h (six categories: 0-20th percentile, 20-40th percentile, 40-60th percentile, 60-80th percentile, 80-100th percentile, and missing).
Analysis relating to heat pump electricity consumption during the flexibility window
For our secondary regression, we used the same model specification as for our primary analysis, except that we used heat pump consumption data instead of household consumption data.
Note, due to a lack of historical data availability for heat pump consumption, we used household consumption for the baseline and annual consumption (as per the primary regression).
Bayesian statistical model specification
For the primary analysis (household consumption), we used the following regression specification, with the following variables:
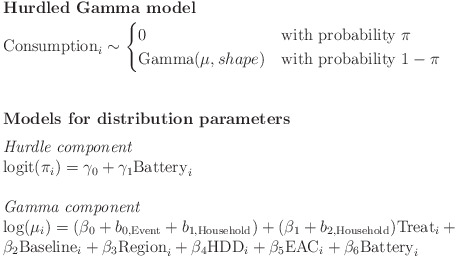
Consumption ~ 1 + Treatment + Baseline + Region + HDD + Annual consumption + Battery + (1 + Treatment | Household) + (1 | Event)
- Consumption is the half-hourly electricity consumption during events.
- Treatment is a categorical variable (with two levels) denoting either the Treatment group or the Control group.
- Baseline is the previous average half-hourly household electricity across the time period of the data of analysis (for example, flexibility window) on weekdays in November, December and January.
- We also used the following covariates:
- (i) Region (categorical)
- (ii) Heating Degree Days for each event, defined as the average of (maximum of ( 0 |15.5 - half-hourly hourly regional temperature)) in the relevant hours
- (iii) Estimated annual consumption (five categories: 0-20th percentile, 20-40th
(iv) Whether a household owns a battery (binary variable).
For the secondary analysis (heat pump consumption), we used the same variables as for our primary analysis, except that we used heat pump consumption data instead of household consumption data, and did not include battery as a covariate.
Rationale for regression specification
To account for the hierarchical structure of our data, we included random intercepts for each event, and random intercepts for each household. We also included random slopes for the Treatment effect to vary by household. Importantly, the rationale for including random slopes was that we expected the treatment effect to vary between households, with some households achieving a greater change in consumption than others (in line with recent literature).
Likelihood function
We assumed that consumption follows a Hurdled Gamma Distribution, whereby the likelihood function for consumption is given by an exponential distribution with parameters rate (λ). The hurdle reflects the presence of values of 0 in the data, which arise primarily because consumption is reduced to zero when forms of generation are used (batteries), although there may be other reasons why zeros are present. We elected to use a Gamma Distribution because it was a reasonable approximation of the distribution of our outcome (positive-valued, strong positive skew).
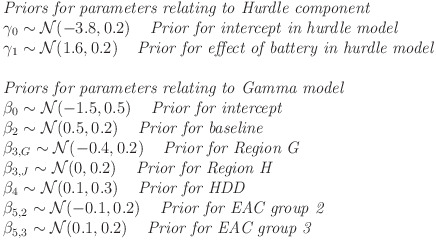
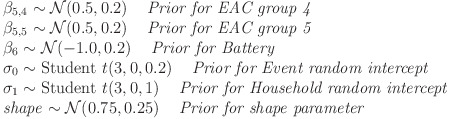
Figure 22. Functional form and priors for Bayesian inference
Random intercept for Events
b₀,Event ~ N(0, σ₀)
Random intercepts and slopes for Households
(
b₁ ,Household
b₂ ,Household
)
~ MVN
[
(
0
0
)
,
(
σ²₁   ρ₁,₂σ₁σ₂
ρ₁,₂σ₁σ₂  σ²₂
)
]
Priors
Priors for parameters relating to Treatment effect
σ₂ ~ Student t(3,0,0.5) Prior for within-household variation
ρ ~ LKJ(1) Prior for between-household variability
Priors for parameters relating to Hurdle component
γ₀ ~ N(-3.8, 0.2) Prior for intercept in hurdle model
γ₁ ~ N(1.6, 0.2) Prior for effect of battery in hurdle model
Priors for parameters relating to Gamma model
We used the following priors for our Treatment effects.
Table 1. Priors for Treatment effect for different types of heat pump consumption and for different periods of time
| Type of consumption |
Time period |
Prior |
| Household consumption |
Preheating period |
N(-0.1, 0.5) |
|
Flexibility window |
N(0, 0.5) |
|
Two hours after event |
N(0, 0.5) |
| Heat pump consumption |
Preheating period |
N(0, 0.5) |
|
Flexibility window |
N(-0.2, 0.5) |
|
Two hours after event |
N(0, 0.5) |
Rationale for priors
For the priors relating to the Treatment effects, we have used similar values as used in the power calculations for our main analysis. We chose specific, weakly informative priors, so priors that suggest the direction of an effect with a broad standard deviation.
For other priors, we used pre-existing datasets to inform our choices. Specifically, we fitted multilevel models using our main regression specifications (excluding the treatment variable). We then used the regression coefficients to inform our priors. To account for our pre-existing data differing from data collected in our trial, we similarly used broad standard deviation (greater than predicted with the multilevel model).
We conducted prior predictive checks to establish whether the priors simulate data that resembles the historical data used to inform the priors.
Results
Descriptive statistics for covariates used in analysis
Below, we present descriptive statistics on the variables used as covariates in our regression models.
Table 2. Descriptive statistics for covariates used in household analysis (n = 43)
| Variable |
Control group |
Treatment group |
|
% (n) |
% (n) |
| Region |
|
|
| H & other |
61% (14) |
45% (9) |
| G |
9% (2) |
0% (0) |
| J |
30% (7) |
55% (11) |
| Estimated Annual consumption |
|
|
| 0% to 20% |
22% (5) |
15% (3) |
| 20% to 40% |
13% (3) |
5% (1) |
| 40% to 60% |
26% (6) |
35% (7) |
| 60% to 80% |
26% (6) |
20% (4) |
| 80% to 100% |
4% (1) |
25% (5) |
| Missing |
9% (2) |
0% (0) |
|
Mean (sd) |
Mean (sd) |
| Baseline consumption (kWh) |
0.738 (0.721) |
0.824 (0.892) |
| External temperature (°C) |
10.6 (2.74) |
10.4 (2.50) |
Table 3. Descriptive statistics for covariates used in heat pump analysis (n = 33)
| Variable |
Control group |
Treatment group |
|
% (n) |
% (n) |
| Region |
|
|
| H & other |
53% (8) |
44% (8) |
| G |
7% (1) |
0% (0) |
| J |
40% (6) |
56% (10) |
| Estimated Annual consumption |
|
|
| 0% to 20% |
20% (3) |
11% (2) |
| 20% to 40% |
7% (1) |
6% (1) |
| 40% to 60% |
33% (5) |
33% (6) |
| 60% to 80% |
27% (4) |
22% (4) |
| 80% to 100% |
7% (1) |
28% (5) |
| Missing |
7% (1) |
0% (0) |
|
Mean (sd) |
Mean (sd) |
| Baseline consumption (kWh) |
0.829 (0.751) |
0.845 (0.920) |
| External temperature (°C) |
10.6 (2.63) |
10.3 (2.52) |
Descriptive statistics for outcomes
Below, we present the descriptive statistics for the two outcomes used in our pre-specified analysis.
Table 4. Descriptive statistics for covariates used in heat pump analysis
| Variable |
Control group |
Treatment group |
|
Mean (sd) |
Mean (sd) |
| Half-hourly household consumption |
|
|
| (43 households) |
|
|
| Two hours before event |
0.221 (0.397) |
0.277 (0.711) |
| Preheating period |
0.290 (0.463) |
0.381 (0.556) |
| Flexibility window |
0.389 (0.529) |
0.287 (0.477) |
| Two hours after event |
0.400 (0.544) |
0.318 (0.594) |
| Half-hourly heat pump consumption |
|
|
| (33 households) |
|
|
| Two hours before event |
0.359 (0.740) |
0.272 (0.497) |
| Preheating period |
0.369 (0.816) |
0.709 (0.810) |
| Flexibility window |
0.519 (0.836) |
0.232 (0.445) |
| Two hours after event |
0.409 (0.719) |
0.350 (0.566) |
Below, we present these values graphically.
Figure 23. Distribution of half-hourly household consumption (kWh) by period and by Treatment allocation (43 households; n = 13,012). Box represents upper quartile, median, and lower quartile. Labelled line is the mean consumption. Note, y-axis is limited at 2.0 kWh; some values are not shown
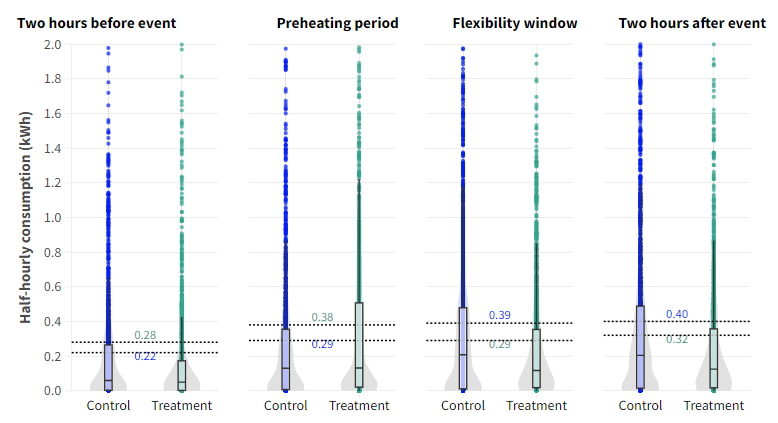
Figure 24. Distribution of half-hourly heat pump consumption (kWh) by period and by Treatment allocation (33 households; n = 9,752). Box represents upper quartile, median, and lower quartile. Labelled line is the mean consumption. Note, y-axis is limited at 2.0 kWh; some values are not shown
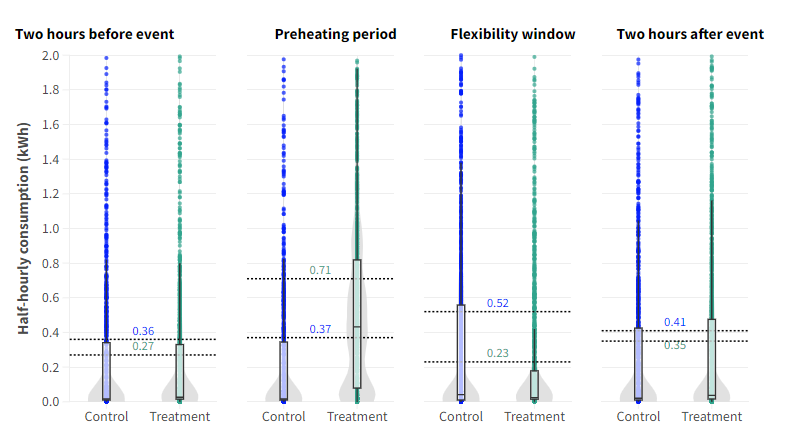
Descriptive statistics for participants in the Control group with solar PV, solar PV and batteries, or neither
The chart below, Figure 25, shows the distribution of heat pump and household consumption for participants in the Control group, grouped by whether they had solar PV, solar PV and batteries, or neither. Note that the number of households in each group is small, so differences between groups may be influenced by one or two households.
For the five participants in the Control group without solar PV or batteries, we find that the average half-hourly consumption is greater than the average half-hourly heat pump consumption. For the seven participants in the Control group with both solar PV and batteries, we find that household consumption is lower than heat pump consumption.
Figure 25. Half-hourly heat pump and household consumption for the Control group during the flexibility window (who have a heat pump monitor installed), by whether they own solar PV or a battery (n = 2,436; 15 households). Box represents upper quartile, median, and lower quartile. Labelled line is the mean consumption
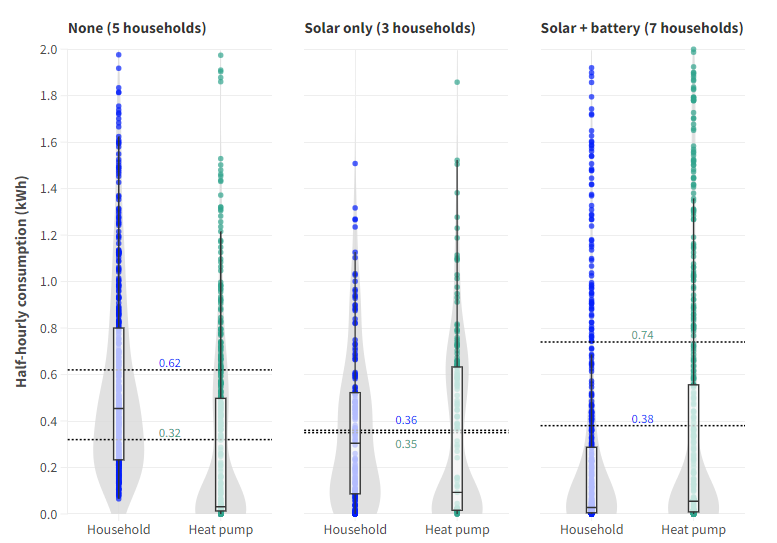
Statistical results
Primary analysis – household consumption in the flexibility window
Table 5. Results for primary analysis - flexibility window - outcome: half-hourly household consumption (kWh) (n = 3,754 observations, from 43 participants). Adjusted for covariates
| Linear regression |
Primary analysis b(se) |
p-value |
95% CIs Lower |
95% CIs Upper |
| Exp. arm (ref: Control group) |
|
|
|
|
| Treatment group |
-0.123 (0.041) |
.003 |
-0.202 |
-0.043 |
| Intercept |
-0.152 (0.135) |
- |
- |
- |
| Covariates |
YES |
|
|
|
| N |
3,754 |
|
|
|
| R² |
0.210 |
|
|
|
| Adjusted R² |
0.203 |
|
|
|
Clustered SEs used (households); number of clusters (households) = 43. Covariates include region, baseline consumption, Heating Degree Days, event number, and estimated annual consumption.
Secondary analysis – heat pump consumption in the flexibility window
Table 6. Results for secondary analysis - flexibility window - outcome: half-hourly heat pump consumption (kWh) (n = 2,814 observations, from 33 participants). Adjusted for covariates
| Linear regression |
Secondary analysis b(se) |
p-value |
95% CIs Lower |
95% CIs Upper |
| Exp. arm (ref: Control group) |
|
|
|
|
| Treatment group |
-0.382 (0.090) |
< .001 |
-0.559 |
-0.206 |
| Intercept |
0.321 (0.183) |
- |
- |
- |
| Covariates |
YES |
|
|
|
| N |
2,814 |
|
|
|
| R² |
0.185 |
|
|
|
| Adjusted R² |
0.174 |
|
|
|
Clustered SEs used (households); number of clusters (households) = 33. Covariates include region, baseline consumption, Heating Degree Days, event number, and estimated annual consumption.
Exploratory analysis – household consumption in the preheating period
Table 7. Results for exploratory analysis - preheating period - outcome: half-hourly household consumption (kWh) (n = 2,826 observations, from 43 participants). Adjusted for covariates
| Linear regression |
Exploratory analysis b(se) |
p-value |
95% CIs Lower |
95% CIs Upper |
| Exp. arm (ref: Control group) |
|
|
|
|
| Treatment group |
0.105 (0.062) |
.090 |
-0.016 |
0.226 |
| Intercept |
-0.141 (0.128) |
- |
- |
- |
| Covariates |
YES |
|
|
|
| N |
2,826 |
|
|
|
| R² |
0.232 |
|
|
|
| Adjusted R² |
0.223 |
|
|
|
Clustered SEs used (households); number of clusters (houeholds) = 43. Covariates include region, baseline consumption, Heating Degree Days, event number, and estimated annual consumption.
Exploratory analysis – heat pump consumption in the preheating period
Table 8. Results for exploratory analysis - preheating period - outcome: half-hourly heat pump consumption (kWh) (n = 2,118 observations, from 33 participants). Adjusted for covariates
| Linear regression |
Exploratory analysis b(se) |
p-value |
95% CIs Lower |
95% CIs Upper |
| Exp. arm (ref: Control group) |
|
|
|
|
| Treatment group |
0.296 (0.106) |
.005 |
0.087 |
0.505 |
| Intercept |
0.961 (0.436) |
- |
- |
- |
| Covariates |
YES |
|
|
|
| N |
2,118 |
|
|
|
| R² |
0.150 |
|
|
|
| Adjusted R² |
0.137 |
|
|
|
Clustered SEs used (households); number of clusters (households) = 33. Covariates include region, baseline consumption, Heating Degree Days, event number, and estimated annual consumption.
Exploratory analysis – household consumption in the two hours after events
Table 9. Results for exploratory analysis - two hours after events - outcome: half-hourly household consumption (kWh) (n = 3,444 observations, from 43 participants). Adjusted for covariates
| Linear regression |
Primary analysis b(se) |
p-value |
95% CIs Lower |
95% CIs Upper |
| Exp. arm (ref: Control group) |
|
|
|
|
| Treatment group |
-0.042 (0.039) |
.283 |
-0.118 |
0.034 |
| Intercept |
-0.141 (0.188) |
- |
- |
- |
| Covariates |
YES |
|
|
|
| N |
3,444 |
|
|
|
| R² |
0.281 |
|
|
|
| Adjusted R² |
0.273 |
|
|
|
Clustered SEs used (households); number of clusters (households) = 43. Covariates include region, baseline consumption, Heating Degree Days, event number, and estimated annual consumption.
Exploratory analysis – heat pump consumption in the two hours after events
Table 10. Results for exploratory analysis - two hours after events - outcome: half-hourly heat pump consumption (kWh) (n = 2,580 observations, from 33 participants). Adjusted for covariates
| Linear regression |
Exploratory analysis b(se) |
p-value |
95% CIs Lower |
95% CIs Upper |
| Exp. arm (ref: Control group) |
|
|
|
|
| Treatment group |
-0.075 (0.064) |
.245 |
-0.201 |
0.051 |
| Intercept |
0.236 (0.127) |
- |
- |
- |
| Covariates |
YES |
|
|
|
| N |
2,580 |
|
|
|
| R² |
0.175 |
|
|
|
| Adjusted R² |
0.163 |
|
|
|
Clustered SEs used (households); number of clusters (households) = 33. Covariates include region, baseline consumption, Heating Degree Days, event number, and estimated annual consumption.
Robustness checks
To understand whether there is a difference between Treatment group and Control group consumption, we use null hypothesis significance testing, which is a very common form of statistical inference. This involves calculating a p-value, which represents the probability of observing a result at least as extreme assuming that a null hypothesis of no effect is true.
We used two additional forms of statistical inference to check whether there is a meaningful difference between the Treatment and Control group.
- Randomisation inference. This technique involves calculating the differences for all potential permutations of Treatment and Control allocation, i.e. if we re-randomised all participants repeatedly. The p-value is then calculated by ranking the "real" difference against the differences from the re-randomised differences. This approach can be helpful in instances where sample sizes are low (under 30), where normal methods can result in false positives (detecting a significant difference when there is not one).
- Bayesian inference. This approach uses a different paradigm to assess differences between groups: it combines our understanding of an effect (our prior) with the data we collect in a trial, which then is used to create an updated understanding of an effect (a posterior probability). Importantly, we can then use the posterior to make statements about how likely an effect is, or a range of likely values for an effect (with probabilities). It is also useful where sample sizes are low.
Both of these approaches differ from our main analysis in terms of the precise estimates they produce. However, by combining different approaches, we can corroborate findings and develop a more rounded understanding of potential differences.
Heat pump consumption
- Flexibility window
- Randomisation inference: our estimate for the Treatment effect was a reduction of 0.367 kWh and was statistically significant (p < .001).
- Bayesian inference: we estimated that there is a 95% likelihood that the true effect estimate is between a 45% reduction and a 79% reduction (95% credible interval), with the most likely value being a reduction of 66%, given our observed data.
- Preheating period
- Randomisation inference: our estimate for the Treatment effect was 0.313 kWh, which is not statistically significant (p = .094).
- Bayesian inference: we estimated that there is a 95% likelihood that the true effect is between a 3% reduction and a 166% increase, with the most likely value being a 63% increase. This 95% credible interval includes 0 (no change). We note, however, that the most likely value (63% increase) is close to the main analysis (78% increase).
For the flexibility window, both of the robustness checks indicate that there is a reduction in heat pump consumption for the Treatment group compared to the Control group, supporting our main analysis.
However, both of the robustness checks for the preheating period did not find evidence of a difference between the Treatment and Control groups. This means that we are not confident that our intervention resulted in greater consumption in the Treatment group compared to the Control group during the preheating period.
Household consumption
- Flexibility window
- Randomisation inference: we estimated the Treatment effect was a reduction of 0.117 kWh and was statistically significant (p = .029).
- Bayesian inference: we estimate that there is a 95% likelihood that the true effect estimate is between a 56% reduction and a 12% increase (95% credible interval), with the most likely value being a reduction of 30%, given our observed data.
- Preheating period
- Randomisation inference: our estimate for the Treatment effect was an increase of 0.106 kWh that was not statistically significant (p = .184).
- Bayesian inference: we estimate that there is a 95% likelihood that the true effect is between a 31% reduction and a 95% increase, with the most likely value being a 16% increase.
For the flexibility window, the estimate of the randomisation inference supports the significant difference found in the main analysis. Although the 95% Credible Interval includes 0 for the Bayesian analysis, the most likely value (30%) is close to the estimate from the main analysis (32%). Overall, this indicates good evidence of a difference between the Treatment and Control group.
Both of the robustness checks for the preheating period are in alignment with the main analysis: we did not find evidence of a difference in consumption between the Treatment group and the Control group.
Bayesian analysis
Posterior predictive checks
We conducted posterior predictive checks to show that our model outputs resemble the underlying data. We present examples for household consumption and heat pump consumption during the flexibility window.
Figure 26. Posterior predictive check for Bayesian model fitted on household consumption data from the flexibility window
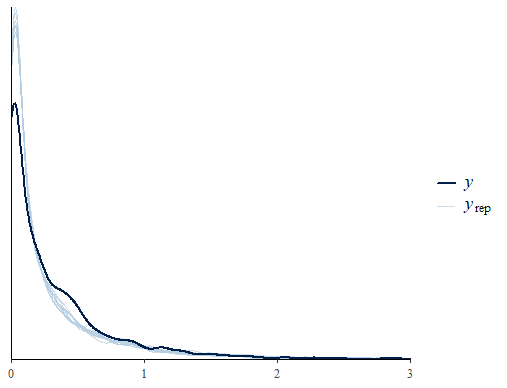
Figure 27. Posterior predictive check for Bayesian model fitted on heat pump consumption data from the flexibility window
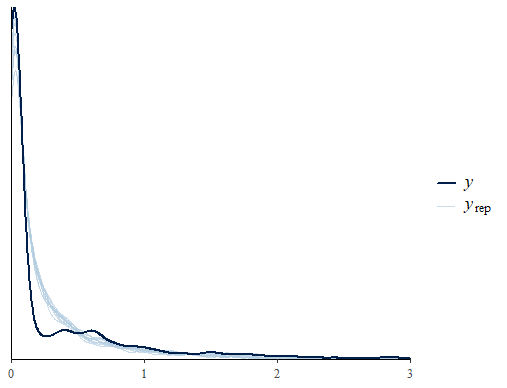
Results for household consumption
Table 11. Parameter coefficients for Bayesian model, fitted to household consumption data in flexibility window (3,754 observations, from 43 participants)
| Parameter |
Estimate |
Estimated error |
Lower 95% CI |
Upper 95% CI |
Rhat |
Bulk ESS |
Tail ESS |
| Multilevel hyperparameters and distributional parameters |
|
|
|
|
|
|
|
| Event intercept (standard deviation) |
0.43 |
0.07 |
0.32 |
0.59 |
1 |
3,467 |
6,130 |
| Household intercept (standard deviation) |
0.88 |
0.14 |
0.64 |
1.19 |
1 |
3,181 |
5,481 |
| Random slope (standard deviation) |
0.41 |
0.33 |
0.01 |
1.31 |
1.01 |
810 |
789 |
| Correlation for random slope |
-0.49 |
0.45 |
-0.98 |
0.75 |
1 |
2,724 |
3,798 |
| Shape |
0.72 |
0.01 |
0.69 |
0.75 |
1 |
20,874 |
8,897 |
| Regression coefficients |
|
|
|
|
|
|
|
| Intercept |
-1.88 |
0.27 |
-2.41 |
-1.36 |
1 |
3,798 |
6,116 |
| Intercept (hurdle) |
-4.09 |
0.12 |
-4.34 |
-3.85 |
1 |
12,516 |
8,903 |
| Treatment |
-0.36 |
0.23 |
-0.81 |
0.11 |
1 |
3,835 |
5,816 |
| Temperature |
0.09 |
0.02 |
0.04 |
0.13 |
1 |
5,491 |
7,719 |
| Region G |
-0.36 |
0.19 |
-0.74 |
0.03 |
1 |
14,211 |
9,558 |
| Region J |
-0.04 |
0.16 |
-0.35 |
0.27 |
1 |
7,530 |
7,748 |
| EAC group 20to40 |
0 |
0.18 |
-0.35 |
0.36 |
1 |
11,447 |
9,172 |
| EAC group 40to60 |
0.18 |
0.16 |
-0.13 |
0.51 |
1 |
7,894 |
8,161 |
| EAC group 60to80 |
0.45 |
0.17 |
0.12 |
0.78 |
1 |
8,667 |
8,382 |
| EAC group 80to100 |
0.39 |
0.18 |
0.05 |
0.74 |
1 |
12,394 |
8,733 |
| EAC group Missing |
0.04 |
0.19 |
-0.34 |
0.42 |
1 |
13,119 |
8,910 |
| Baseline |
0.7 |
0.11 |
0.49 |
0.91 |
1 |
15,026 |
9,019 |
| Battery (yes) |
-1.11 |
0.16 |
-1.42 |
-0.8 |
1 |
7,111 |
8,257 |
| Battery (yes) (hurdle) |
2.25 |
0.13 |
2 |
2.51 |
1 |
14,010 |
9,473 |
We fitted models to data from the preheating period and the two hours after events, as shown below.
Table 12. Parameter coefficients for Bayesian model, fitted to household consumption data across three time periods
| Period |
Observations |
Estimate |
Estimated error |
Lower 95% CI |
Upper 95% CI |
| Posterior distribution for Treatment effect |
|
|
|
|
|
| Preheating period |
2,826 |
0.15 |
0.27 |
-0.37 |
0.67 |
| Flexibility window |
3,754 |
-0.36 |
0.23 |
-0.81 |
0.11 |
| Two hours after event |
3,444 |
-0.18 |
0.21 |
-0.58 |
0.23 |
We conducted prior sensitivity analysis, where we increased and decreased the standard deviation of the Treatment prior (to 2 and 0.1 respectively). As a result of these checks, we are satisfied that our estimated Treatment effect is not exaggerated by our selection of the Treatment effect prior.
Table 13. Prior sensitivity analysis for Bayesian model fitted to household consumption data for the flexibility window (n = 3,754)
| Period |
Estimate |
Estimated error |
Lower 95% CI |
Upper 95% CI |
| Posterior distribution for Treatment effect |
|
|
|
|
| Normal prior N(-0.1, 0.5) |
-0.36 |
0.23 |
-0.81 |
0.11 |
| Less certainty N(-0.1, 2) |
-0.42 |
0.26 |
-0.91 |
0.10 |
| More certainty N(-0.1, 0.1) |
-0.14 |
0.09 |
-0.33 |
0.04 |
Results for heat pump consumption
Table 14. Parameter coefficients for Bayesian model, fitted to heat pump consumption data in flexibility window (2,814 observations, from 33 participants)
| Parameter |
Estimate |
Estimated error |
Lower 95% CI |
Upper 95% CI |
Rhat |
Bulk ESS |
Tail ESS |
| Multilevel hyperparameters and distributional parameters |
|
|
|
|
|
|
|
| Event intercept (standard deviation) |
0.45 |
0.09 |
0.3 |
0.65 |
1 |
3,077 |
5,374 |
| Household intercept (standard deviation) |
0.6 |
0.14 |
0.37 |
0.91 |
1 |
2,107 |
4,999 |
| Random slope (standard deviation) |
0.46 |
0.31 |
0.02 |
1.2 |
1.01 |
861 |
838 |
| Correlation for random slope |
0.18 |
0.51 |
-0.85 |
0.96 |
1 |
1,505 |
1,228 |
| Shape |
0.57 |
0.01 |
0.55 |
0.6 |
1 |
19,471 |
9,336 |
| Regression coefficients |
|
|
|
|
|
|
|
| Intercept |
-1.71 |
0.29 |
-2.28 |
-1.13 |
1 |
4,052 |
6,545 |
| Intercept (hurdle) |
-2.69 |
0.07 |
-2.83 |
-2.55 |
1 |
19,199 |
7,489 |
| Treatment |
-1.09 |
0.24 |
-1.54 |
-0.6 |
1 |
5,114 |
6,111 |
| Temperature |
0.07 |
0.03 |
0 |
0.14 |
1 |
3,567 |
5,601 |
| Region G |
-0.39 |
0.19 |
-0.76 |
0 |
1 |
16,516 |
9,220 |
| Region J |
-0.27 |
0.16 |
-0.59 |
0.05 |
1 |
7,775 |
8,076 |
| EAC group 20to40 |
0.02 |
0.19 |
-0.35 |
0.39 |
1 |
11,985 |
9,925 |
| EAC group 40to60 |
0.1 |
0.16 |
-0.22 |
0.42 |
1 |
7,903 |
9,149 |
| EAC group 60to80 |
0.4 |
0.17 |
0.07 |
0.73 |
1 |
8,675 |
8,747 |
| EAC group 80to100 |
0.47 |
0.18 |
0.12 |
0.81 |
1 |
11,337 |
9,269 |
| EAC group Missing |
-0.04 |
0.19 |
-0.42 |
0.34 |
1 |
15,127 |
8,490 |
| Baseline |
0.77 |
0.11 |
0.54 |
0.98 |
1 |
16,080 |
9,525 |
We fitted models to data from the preheating period and the two hours after events, as shown below.
Table 15. Parameter coefficients for Bayesian model, fitted to heat pump consumption data across three time periods
| Period |
Observations |
Estimate |
Estimated error |
Lower 95% CI |
Upper 95% CI |
| Posterior distribution for Treatment effect |
|
|
|
|
|
| Preheating period |
2,118 |
0.49 |
0.25 |
-0.03 |
0.98 |
| Flexibility window |
2,814 |
-1.09 |
0.24 |
-1.54 |
-0.60 |
| Two hours after event |
2,580 |
-0.51 |
0.26 |
-1.02 |
0.02 |
We also conducted prior sensitivity analysis for the heat pump consumption data. As a result of these checks, we are satisfied that our estimated Treatment effect is not exaggerated by our selection of the Treatment effect prior.
Table 16. Prior sensitivity analysis for Bayesian model fitted to heat pump consumption data for the flexibility window (n = 2,814)
| Period |
Estimate |
Estimated error |
Lower 95% CI |
Upper 95% CI |
| Posterior distribution for Treatment effect |
|
|
|
|
| Normal prior N(-0.1, 0.5) |
-1.09 |
0.24 |
-1.54 |
-0.60 |
| Less certainty N(-0.1, 2) |
-1.31 |
0.25 |
-1.83 |
-0.82 |
| More certainty N(-0.1, 0.1) |
-0.71 |
0.20 |
-1.09 |
-0.31 |
6. Endnotes
- This means our customers were primarily in North Western, Southern and Southern Eastern Grid Supply Point (GSP) distribution areas. We sent email invitations to all customers in these regions that had a heat pump who could take part in our trial, and were not on smart tariffs specifically designed for heat pumps or batteries. This was to avoid tariffs that might already be incentivising household flexibility, such as Octopus Cosy, Agile Octopus tariff or any import tariffs (such as Tesla, Flux or Powerloop).
- This reduction in sample size is a type of trial attrition, but we have no reason to believe that this attrition was imbalanced between our Treatment and Control groups, given that barriers to installation were unrelated to whether we planned to subject participants to HeatFlex events or withhold treatment from them, once installation was complete.
- In the future, we assume that flexibility events will occur directly in response to signals from the System Operator. In the winter of our trial, National Grid ESO's Demand Flexibility Service (DFS) was operational, and Octopus Energy promoted these events to at least some HeatFlex participants under their 'Saving Sessions' scheme. We were keen to separate the effect of our intervention (automation plus preheating) from any effect caused by DFS. We therefore aimed to avoid scheduling HeatFlex events on days with DFS events.
- We also ran a few variations of our core intervention, including events without preheating, events with flexibility windows that were longer than two hours, and morning events. Due to the low number of these events, we were not able to make meaningful comparisons to normal events to calculate the impact on electricity consumption. Instead, we sought to understand participants' experience of these events from interviews. In the final three events, participants in the Control group also took part in events – these are not included in our main analysis (see Technical appendix for further details on this waitlist-control design).
- We have used a significance threshold of 0.05 in this report to determine whether a finding is statistically significant or not.
- Heat pumps use proprietary controls in the vast majority of instances. The main reason for this is that heat pumps are even more susceptible to higher flow temperatures than boilers, hence the manufacturers tend to limit control of flow temperatures to third party controllers so as to limit the instances in which the heat pump internal components could be potentially damaged. In general, this translates to allowing only on/off controls via third party thermostats or their own controls, often with weather compensation, at the expense of limiting how customers can modify certain settings internally.
- Specifically, when they were “at home in the evening on a weekday and you are sitting down watching TV, reading a book, or listening to music."
Centre for Net Zero
5th Floor, UK House, 2 Great Titchfield Street
London W1D 1NN
[email protected]
@CentreNetZero
company/centre-for-net-zero
centrefornetzero.org
Nesta
58 Victoria Embankment
London EC4Y 0DS
+44 (0)20 7438 2500
[email protected]
@nesta_uk
nesta.uk
nesta.org.uk
ISBN: 978-1-916699-30-4
Nesta is a registered charity in England and Wales with company number 7706036 and charity number 1144091. Registered as a charity in Scotland number SCO42833. Registered office: 58 Victoria Embankment, London EC4Y 0DS.
Creative Commons Attribution-NonCommercial-ShareAlike (CC BY NC SA) license.