We are Nesta. The UK's innovation agency for social good.
We design, test and scale solutions to society's biggest problems. Our three missions are to give every child a fair start, help people live healthy lives and create a sustainable future where the economy works for both people and the planet.
For over 20 years, we have worked to support, encourage and inspire innovation.
We work in three roles: as an innovation partner working with frontline organisations to design and test new solutions, as a venture builder supporting new and early stage businesses and as a system shaper creating the conditions for innovation. Harnessing the rigour of science and the creativity of design, we work relentlessly to change millions of lives for the better.
Find out more at nesta.org.uk
If you'd like this publication in an alternative format such as Braille or large print please contact us at: [email protected]
Authors
Frances Bain, John Barber, David Dearlove and Kinza Mahmood
Click the Nesta logo on any page to return to the contents
Executive summary
In Scotland, we spend £5.3 billion each year on out-of-home (OOH) food and drinks. Out-of-home food is any food or drink bought and eaten away from home, including 'Food on the go' (products purchased for immediate consumption off-premises)and any takeaway or home-delivered food. Eating out is something we do to socialise or for convenience. However, there is evidence that food purchased from restaurants, fast-food outlets and takeaways is associated with higher calorie intakes and that frequently eating OOH is associated with obesity. This research aimed to fill a data gap around the nutritional content of a range of popular out-of-home foods sold by small and independent businesses (those with fewer than 250 employees) in Scotland. We collected and lab-tested the nutritional content of 158 samples across 14 popular food items from independent out-of-home outlets in Glasgow and Edinburgh.
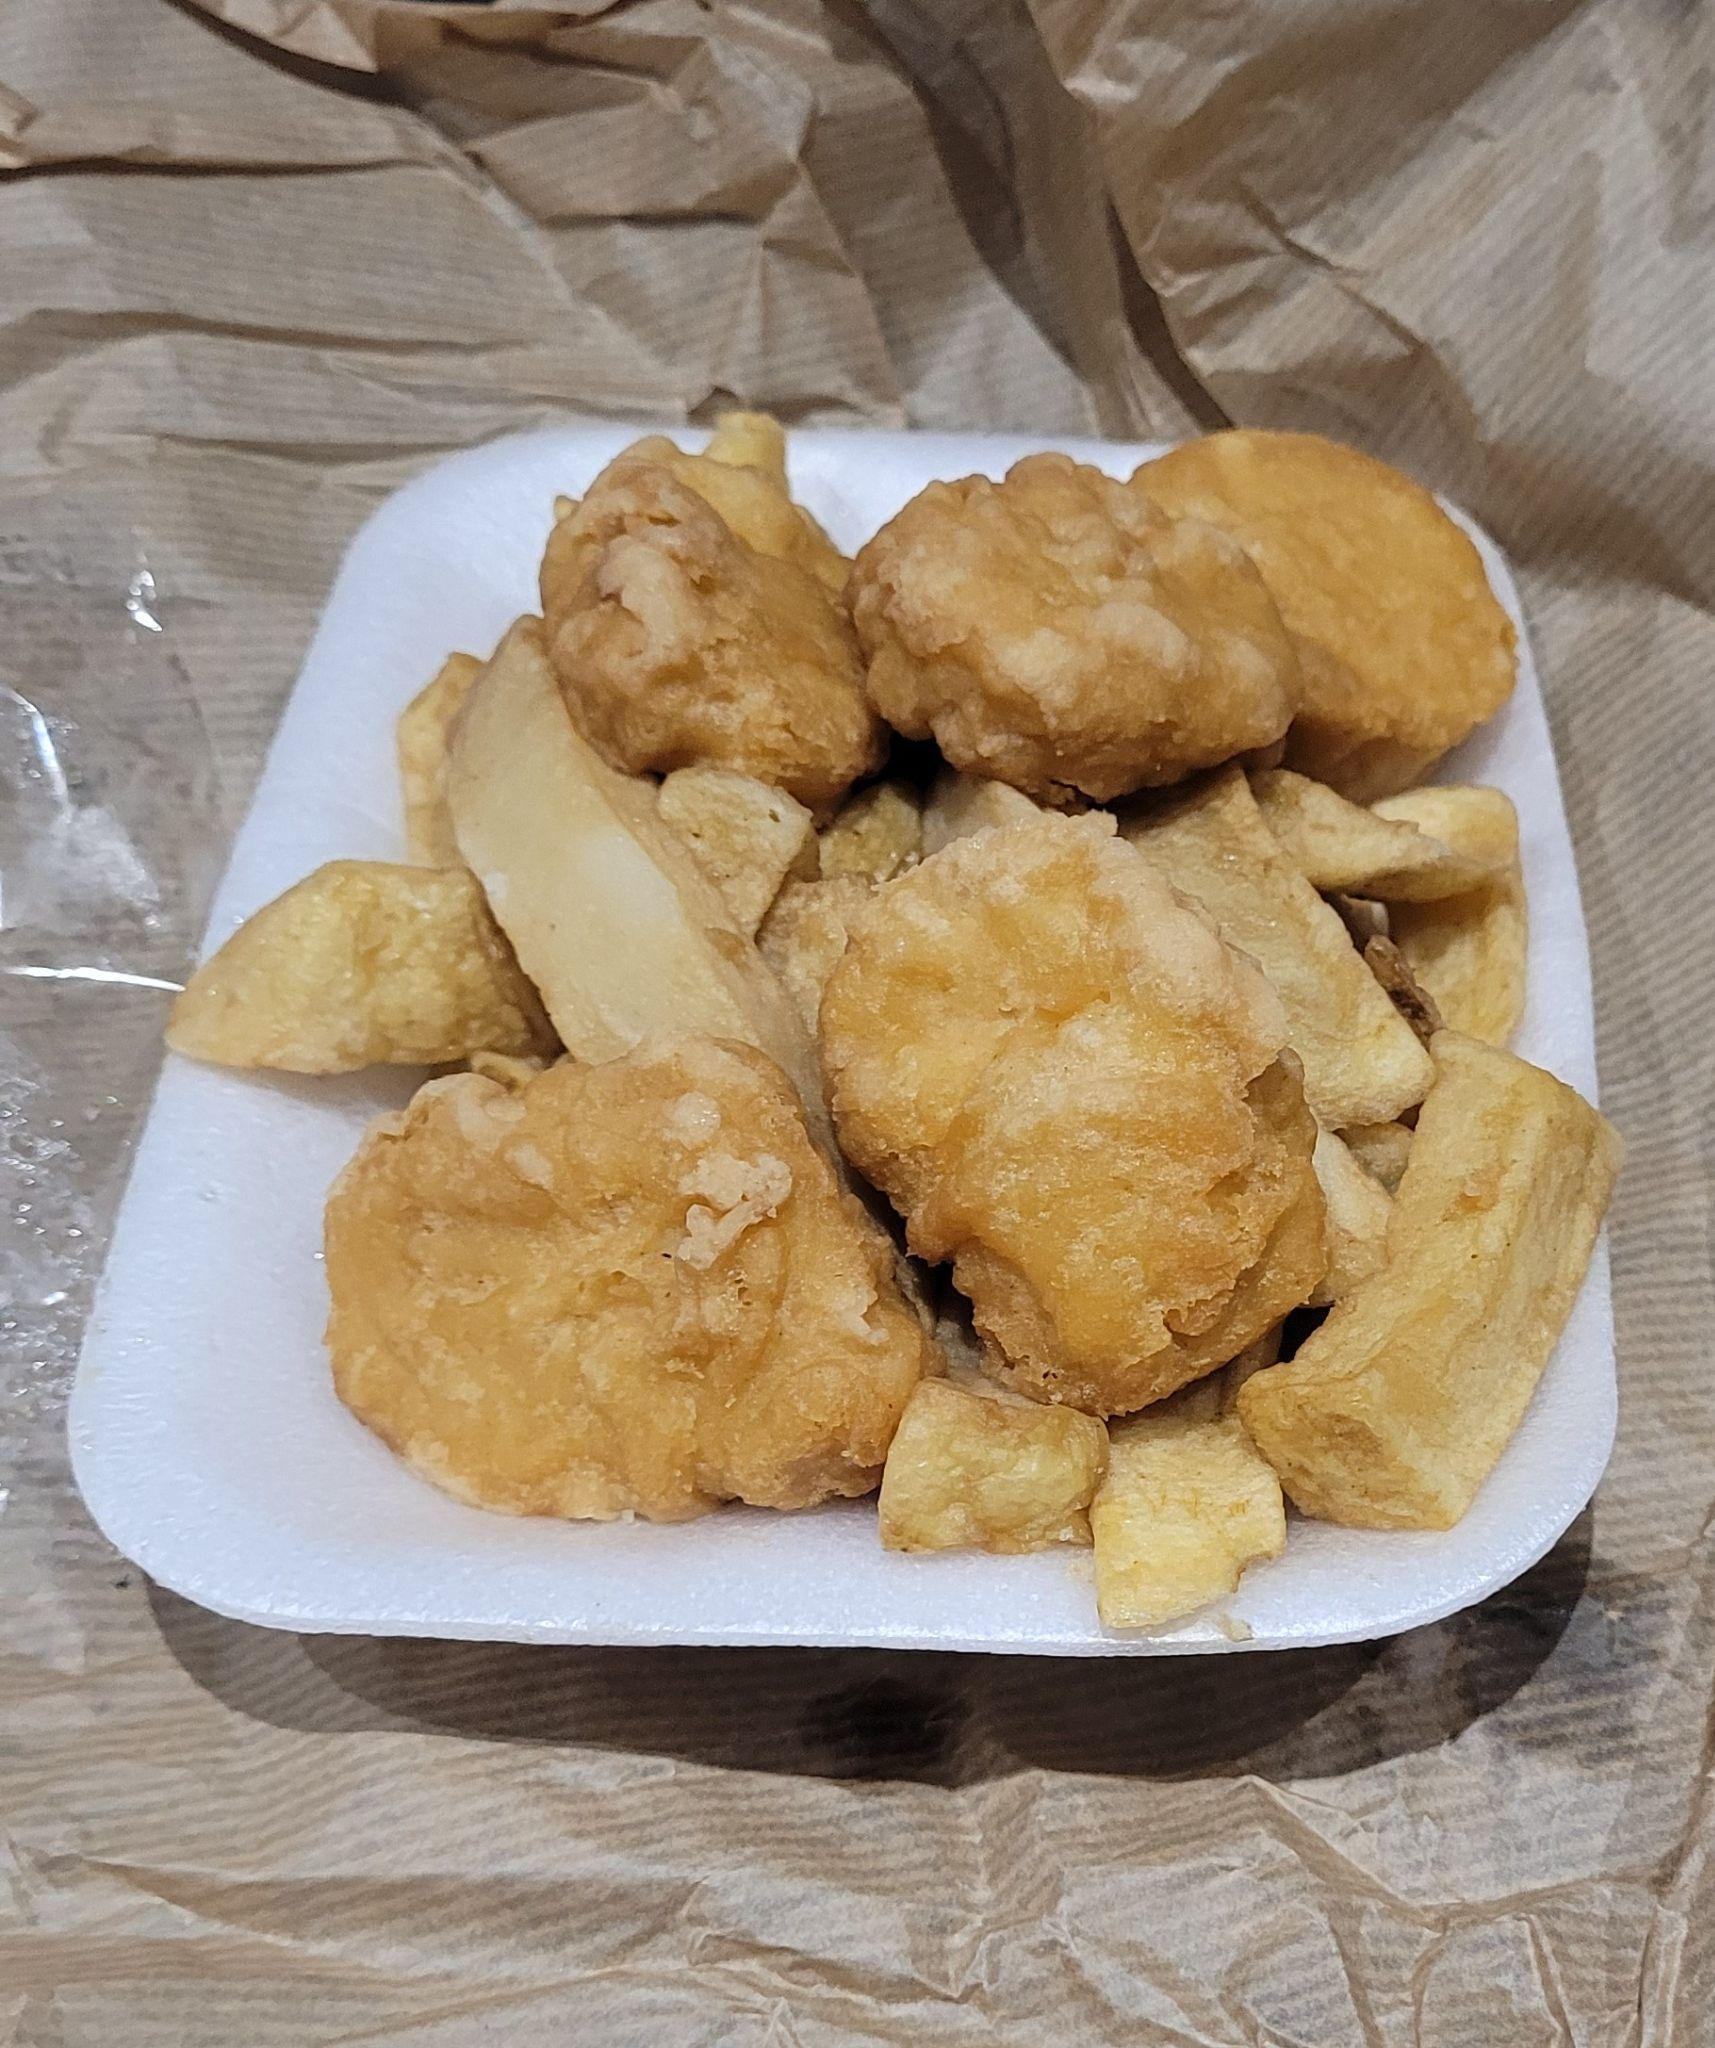
To provide information on the daily recommended intake of energy and nutrients depending on age and gender, the government has set average minimum and maximum (depending on the nutrient) values to adhere to per day. These are also depicted in the Scottish Dietary Goals. This research compared the values we found within the sampled food items with these daily dietary recommendations. We found high levels of calories, fat, saturated fat, total sugars, salt and low levels of fibre in many of the samples tested. Total calories, saturated fat levels and the nutritional content of children's meals were of particular concern. Some products tested contained over the daily dietary recommendation for either calories, salt, fat and saturated fat in just one portion. We also found that there are large variations in the portion size and nutritional content of different samples of the same meal or item sold in different businesses, indicating that it is feasible to produce and sell healthier versions of popular out-of-home foods.
Key results include:
- The battered pizza meals contained 1,327 calories, 66 percent of the maximum dietary recommendation of 2000 calories per day.
- Doner kebabs had the highest levels of salt with 7.7g per portion, which is 28 percent above the maximum dietary recommendation of 6g per day, also containing 86g of total fat, which is above the maximum recommended 78g per day.
- One macaroni cheese meal sampled contained 101g of saturated fat, which is 421 percent of the maximum dietary recommendation per day.
- Millionaire's shortbread had 34.1g of total sugar per portion, which is 37.8 percent of the maximum reference intake for total sugars (no dietary recommendation per day exists for total sugars) and, for comparison, is 26 percent over the maximum dietary recommendation per day for free sugars.
- Eighteen percent of samples had less than 2g of fibre per portion compared to the dietary recommendation of 30g per day and only 37 percent of samples contained over 10g per portion.
- The children's portions contained, in a single meal, between 64 and 98 percent of the dietary recommendation for saturated fat per day.
Background
The out-of-home (OOH) sector is a key component of our food environment and, on average, contributes around 340 calories per person per day to our diet. Nesta's recent research, How eating out contributes to our diets, shows that independent fast food outlets account for approximately 20 percent of total OOH calories purchased daily and independent bakeries and cafes account for a further 10-15 percent.
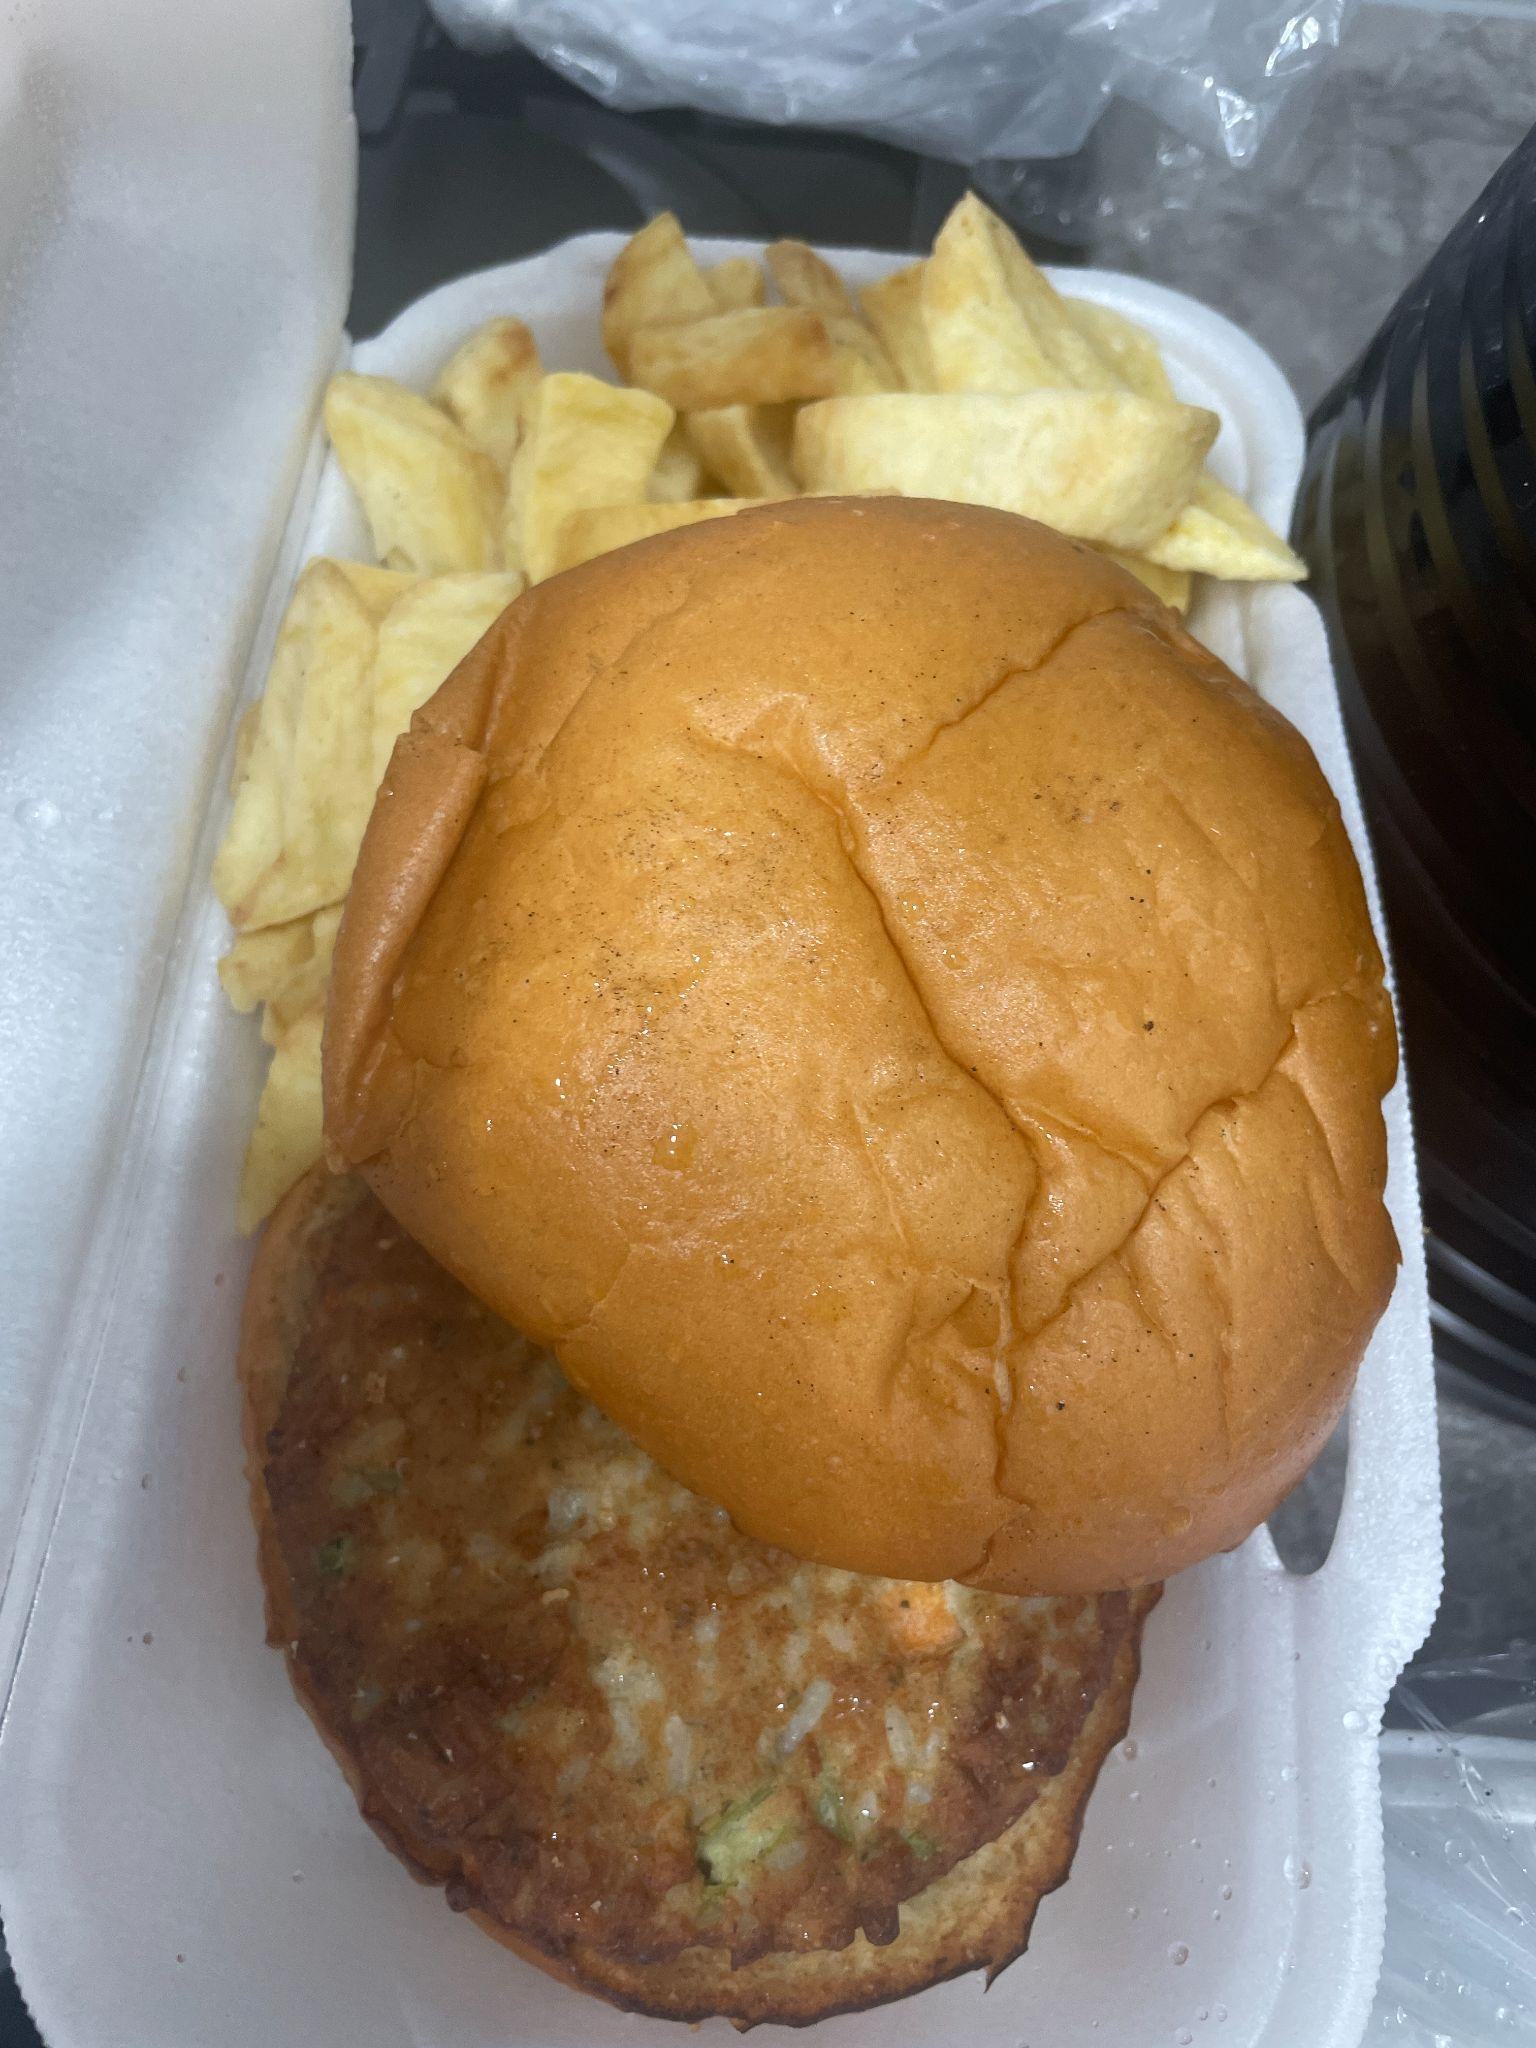
To provide information on the daily recommended intake of energy and nutrients depending on age and gender, the government has set average minimum and maximum (depending on the nutrient) values to adhere to per day. These are also depicted in the Scottish Dietary Goals. These recommendations were used to compare the results obtained through this research.
Due to the calorie labelling legislation introduced in England in 2022, we have publicly available data on the calorie content of meals and items sold by large out-of-home businesses (those with over 250 employees) who operate there. However, the calorie content of food sold by smaller independent food businesses across the UK is largely unknown. Furthermore, there is very little data on the other nutritional content of OOH foods beyond calories. Understanding this can help give an assessment of provision by this sector and identify opportunities for improving the nutritional content of provision across various segments of the OOH sector. This approach is particularly important given the 230 kcal per person per day reduction needed in Scotland for the two-thirds of people who are living with excess weight, to halve obesity levels, as well as improvements needed to diets in order to support the achievement of the Scottish Dietary Goals.
Many of us enjoy eating meals and treats when we are out and it is a rich part of our national food culture. This research sought to collect data to help us learn more about the food we're buying and enjoying. We were interested to learn what might be done to improve the nutritional content of that food while also ensuring that it remains enjoyable and affordable.
What we did
Following on from initial research where we lab tested 600 of the ten most popular meals from independent takeaways in Great Britain, we were commissioned by Food Standards Scotland to conduct an observational study to determine the nutritional content of a further 14 food items across independent out of home outlets (those with fewer than 250 employees) in Edinburgh and Glasgow. As our initial research had already collected data across Great Britain, including Scotland, on the nutritional content of pizzas, fish and chips, burgers, Chinese meals and curries, this research focused on additional food items that were popular in Scotland.

The foods shortlisted to be included within this sampling project were informed by existing insights into the out-of-home food environment in Scotland. This included identifying the most common menu items available from small and independent outlets (using research conducted in 2023, which explored the current landscape in these outlets) and the most frequently purchased or consumed foods out of home (using evidence sources such as Kantar data and the 2021 Scottish Health Survey).
Our sample comprised 158 items across four different food categories (Meals, Children's meals, Starters, Side Plates and Small Dishes (snacks) or Sweet Snacks and Desserts). This included 12 samples per item of a medium, standard or regular size (as stated by the outlet) and just two samples of chips and cheese due to a limit on the total number of samples that could be analysed.
Some out-of-home foods from McCance and Widdowson's Composition of Foods Integrated Dataset (CoFID) were also included. The Composition of Foods Integrated Dataset (CoFID) provides detailed nutritional information on a wide range of foods and beverages consumed in the UK, serving as the basis for nutrition research, national dietary surveys, dietary guidelines and policy development worldwide. This was to assess how the nutritional content of foods available out of home in 2024 compared with these existing values and also to allow a comparison of how the out-of-home sector is evolving over time to determine if calorie and nutrition values are changing.
There is currently a lack of data around the composition of children's menu items. Children's items were included within this research to provide further evidence on this, which is relevant for the Code of Practice for Children's menus, which is currently in development by Public Health Scotland and Food Standards Scotland.
The categories and food items selected for sampling were:
Meals
- Doner kebab with accompaniments (salad, sauce, pitta)
- Vegetarian burger (meat alternative) and chips
- Macaroni cheese
- Battered haggis supper (including chips)
- Battered sausage supper (including chips)
- Battered pizza
Starters, side plates and small dishes (savoury snacks)
- Portion of chips
- Vegetable pakora
- Chips and cheese (2 samples in total only)
Sweet snacks and desserts
- Sweet muffin
- Cheesecake
- Millionaires shortbread
Children's meals
- Children's portion of fried coated chicken strips and chips
- Children's portion of cheeseburger and chips
The samples were tested as described in the appendix and did not include any accompaniments such as vegetables or side dishes not specified and sold as part of the menu item.
As well as describing the nutritional content of popular food items from independent outlets, we wanted to understand if this was associated with an area's deprivation level, as has recently been reported. An area's deprivation level is commonly determined using the Scottish index of multiple deprivation (SIMD). In this study, for both cities, we proportionally sampled outlets from outward postcode areas (the first part of the postcode indicating the area and district) based SIMD quintiles, eg, if a city had proportionally more outward postcode areas in quintile 1 (most deprived), we ensured we sampled more items from outlets located in postcode areas in quintile 1.
Outlets were selected based on the following inclusion criteria:
- Located within the designated outward postcode area
- Independent outlets (micro, small or medium enterprises with fewer than 250 employees)
- Serving the selected food item as a main or standard menu item
If all items of each food were unavailable in an outward postcode area, we used backup postcodes or sampled from multiple postcodes within the same SIMD quintile in the same city.
At the point of sampling, we recorded detailed information about each food item, including location (confirmed through geo-tagging), date, purchase method (whether it was ordered and delivered via an app or bought in-store), whether there was a volume or price promotion offered on the purchase, and whether samplers were prompted to upgrade the item or buy additional products at checkout. We photographed the dishes (examples of the photos taken are contained within the report), menus (where possible) and purchase receipts.
Samples were frozen for at least 12 hours before collection by a courier service, which transported them in temperature-controlled containers to a UKAS-accredited nutritional testing facility. Detailed information on the testing protocol is outlined in the appendix.
For each sample, we recorded:
- SIMD for the outlet's outward postcode area
- Food item name and portion size name
- Sample weight (g)
- Outlet location
- Food type
- Default sides/condiments
- Food item price
- Promotions offered
- Nutritional composition: mono, poly, saturated and total fats, protein, salt (measured as sodium), total carbohydrate, total sugars, dietary fibre, Energy content (kcal and kj), both per sample and per 100g.
Analysis
Our analysis examined several key aspects of the OOH dishes, including calorie and nutrient content, and their relationships with various factors such as cost or outlet location. We processed the raw data to calculate portion cost per calorie, median weight per food item, median calorie content per food item, calorie and nutrient content per 100g, and median saturated/fat, salt, fibre, sugar and carbohydrate content per food item. Median values have been calculated and used throughout the report due to the large ranges that were found within the data.
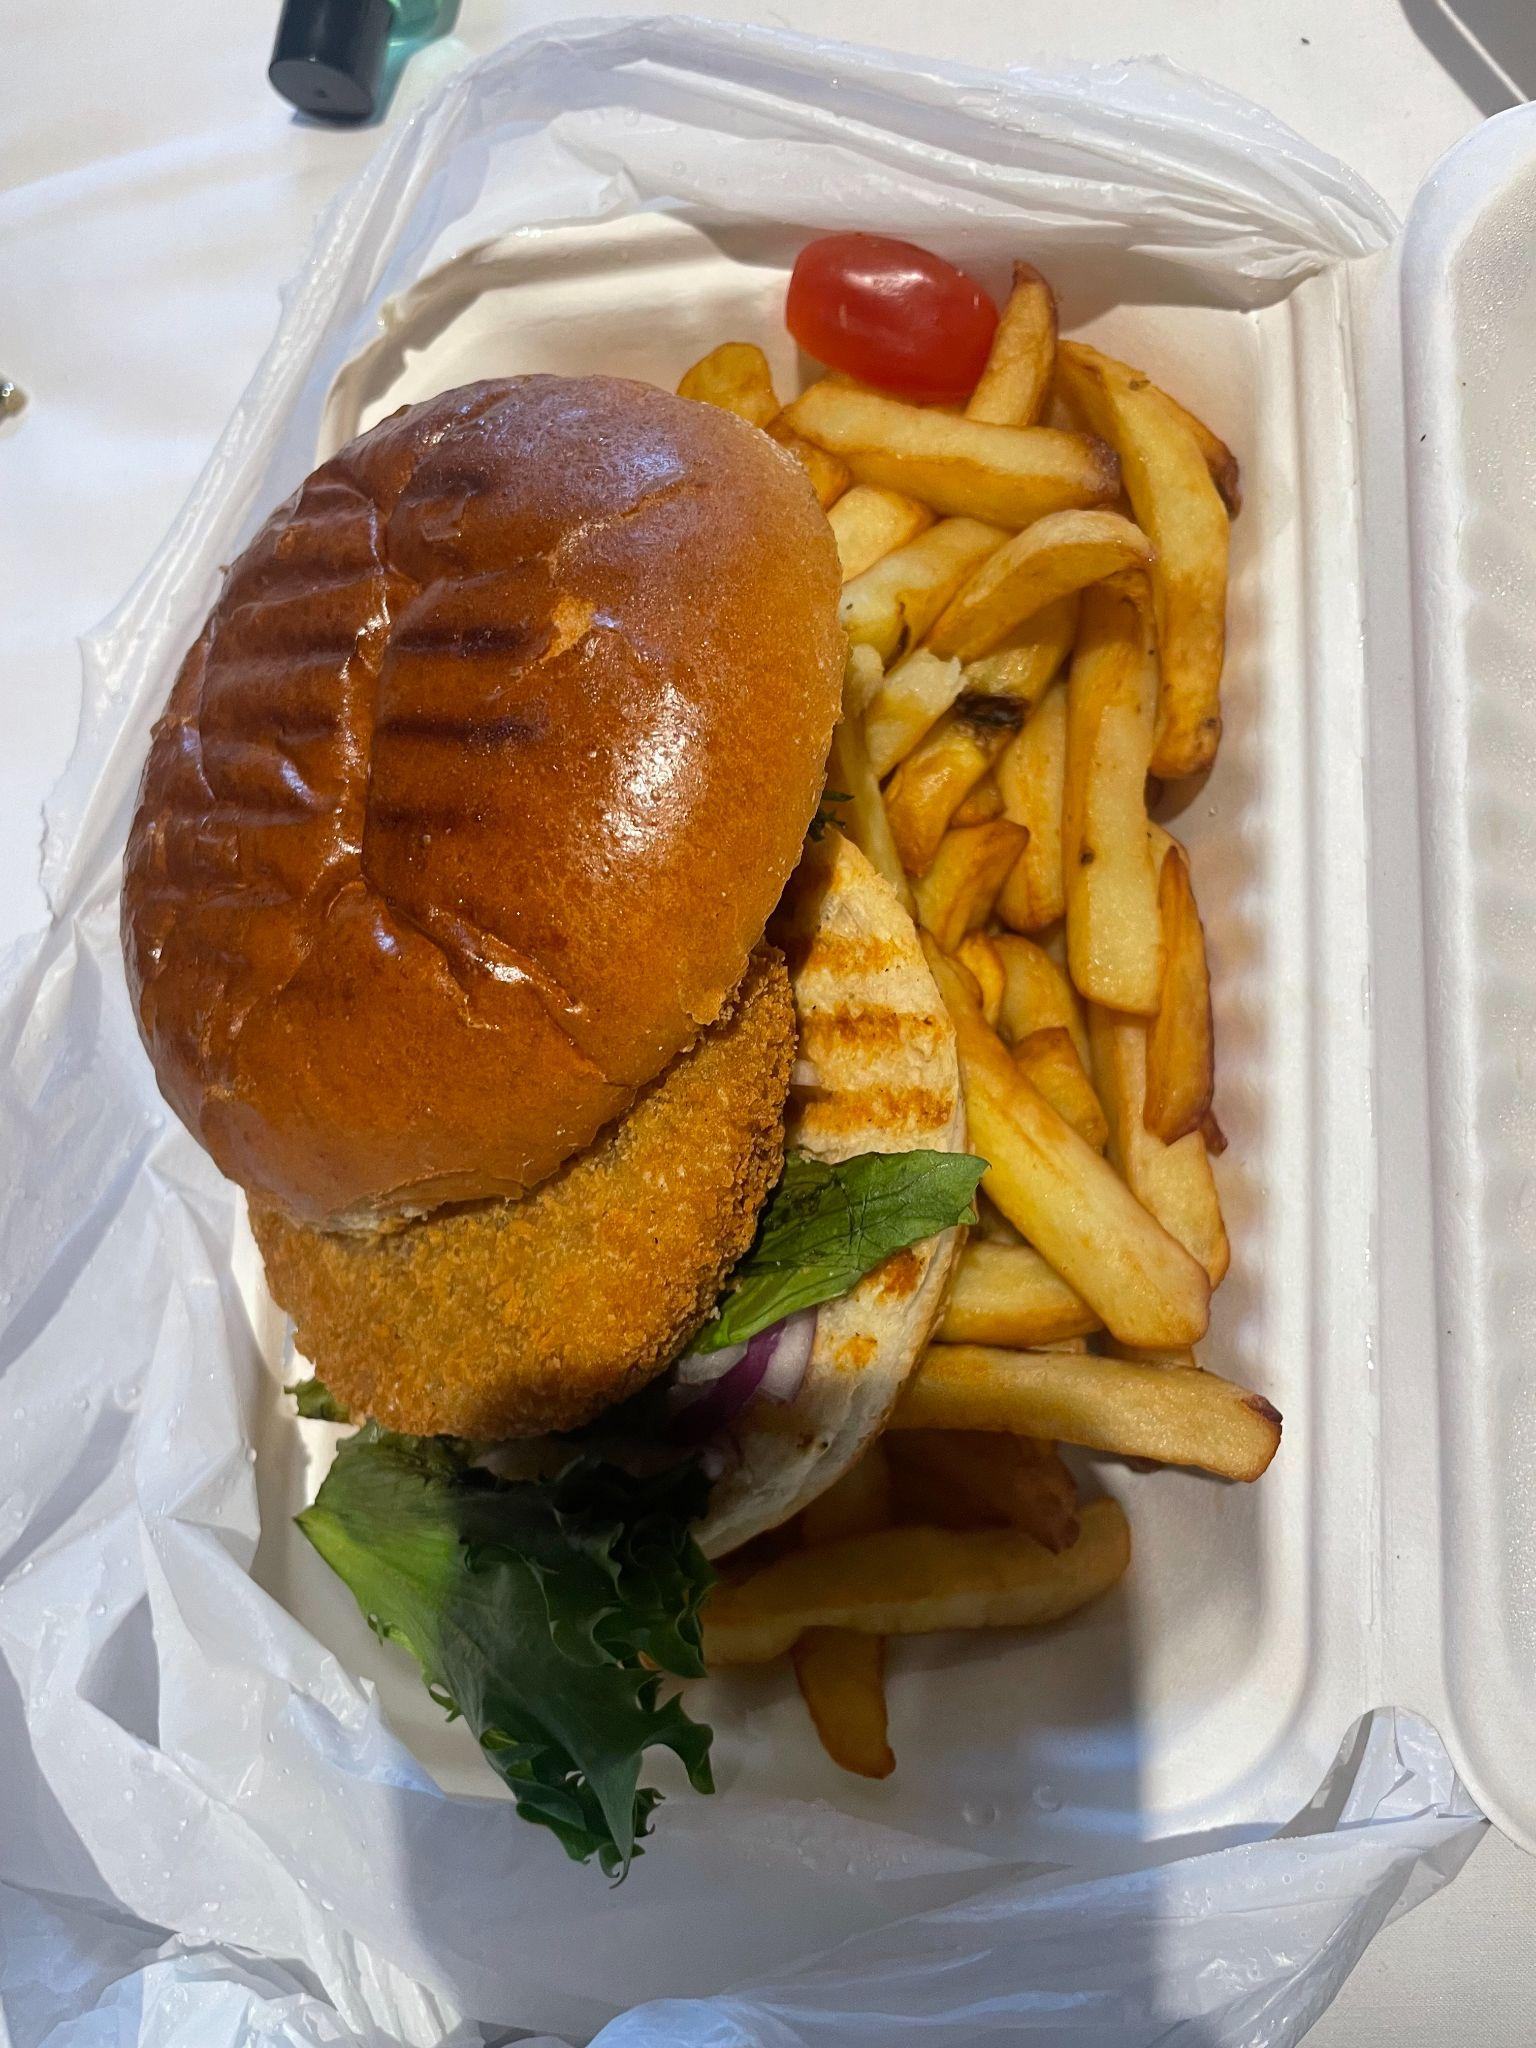
This observational study primarily sought to describe the nutritional content of popular OOH food items purchased from independent businesses. However, we also wanted to establish if there were any associations between deprivation and the nutritional content of OOH foods. To do this, we created a linear regression model where the calculated total calories per portion were predicted by restaurant outward postcode SIMD quintile.
Summary of results
The table below provides a summary of the research findings and provides a comparison with dietary recommendations per day relating to the nutrients tested, for both adults and children.
The dietary recommendation per day figures for adults (females aged 19-64) and Children (females aged 7-10) below are taken from the Government Dietary Recommendations publication.
An exception to this is sugar, which has been defined as a reference daily intake for adults using the amounts outlined in the Guide to creating a front of pack (FoP) nutrition label for pre-packed products. There is no equivalent reference daily intake amount for children for total sugar.
The reference daily intake has been used here instead of the government dietary recommendation, as the sugar values analysed and presented in this research relate to total sugar. Total sugar is the sum of all sugars in a food or drink, including those that occur naturally and those that are added. This differs from free sugar, which the government dietary recommendations relate to. The definition of free sugars includes: all added sugars in any form; all sugars naturally present in fruit and vegetable juices, purées and pastes and similar products in which the structure has been broken down; all sugars in drinks (except for dairy-based drinks); and lactose and galactose added as ingredients.
| Food item |
Weight (g/Range) |
Energy Density/100g |
Calories (kcal) |
Fat (g) |
Saturated fat (g) |
Salt (g) |
Total sugar (g) |
Fibre (g) |
| The government dietary recommendation per day for an adult (females aged 19-64) |
|
|
2000 |
78 |
24 |
6 |
90 |
30 |
| The government dietary recommendation per day for children (female age 7-10) |
|
|
1703 |
66 |
21 |
5 |
N/A |
20 |
| Doner kebab with accompaniments (salad, sauce, pitta) |
460.5 (311-607) |
266 |
1283 |
86.1 |
36.9 |
7.7 |
7.6 |
8.0 |
| Vegetarian burger (meat alternative) and chips |
445.8 (244-672) |
250 |
1124 |
50.3 |
10.6 |
2.9 |
13.7 |
12.1 |
| Macaroni cheese |
410.5 (169-758) |
173 |
681 |
33.2 |
18.0 |
2.7 |
7.5 |
4.4 |
| Battered haggis supper (including chips) |
552.2 (267-672) |
236 |
1311 |
58.5 |
26.9 |
4.7 |
3.2 |
16.2 |
| Battered sausage supper (including chips) |
484.6 (103-658) |
247 |
1278 |
67.2 |
27.2 |
3.7 |
3.3 |
12.2 |
| Battered pizza |
423.5 (135-604) |
305 |
1327 |
54.3 |
22.7 |
5.4 |
11.5 |
9.9 |
| Vegetable pakora |
322.5 (157-574) |
264 |
767 |
43.4 |
8.9 |
5.0 |
11.3 |
16.3 |
| Chips and cheese |
320.3 (249-392) |
228 |
731 |
37.3 |
22.2 |
1.7 |
1.3 |
8.1 |
| Portion of chips |
317.4 (145-456) |
220 |
682 |
28.4 |
11.7 |
0.4 |
0.9 |
9.1 |
| Sweet muffin |
114.7 (65-170) |
396 |
423 |
18.7 |
3.4 |
0.5 |
25.3 |
1.8 |
| Cheesecake |
122.1 (85-455) |
396 |
497 |
33.3 |
17.3 |
0.7 |
22.1 |
0.7 |
| Millionaires shortbread |
118.0 (67-198) |
496 |
590 |
32.7 |
20 |
0.4 |
34.1 |
1.1 |
| Children's portion of fried coated chicken strips and chips |
283.5 (251-410) |
236 |
682 |
30.6 |
13.5 |
1.2 |
1.2 |
6.5 |
| Children's portion of cheeseburger and chips |
378.7 (249-494) |
248 |
982 |
43.8 |
20.9 |
3.4 |
5.7 |
9.3 |
Calories
The results of the calorie analysis are displayed in Table 2. For reference, the maximum dietary recommendations for calories are 2000 Kcal per day for female adults and 1703 Kcal per day for 7-10 year old girls.
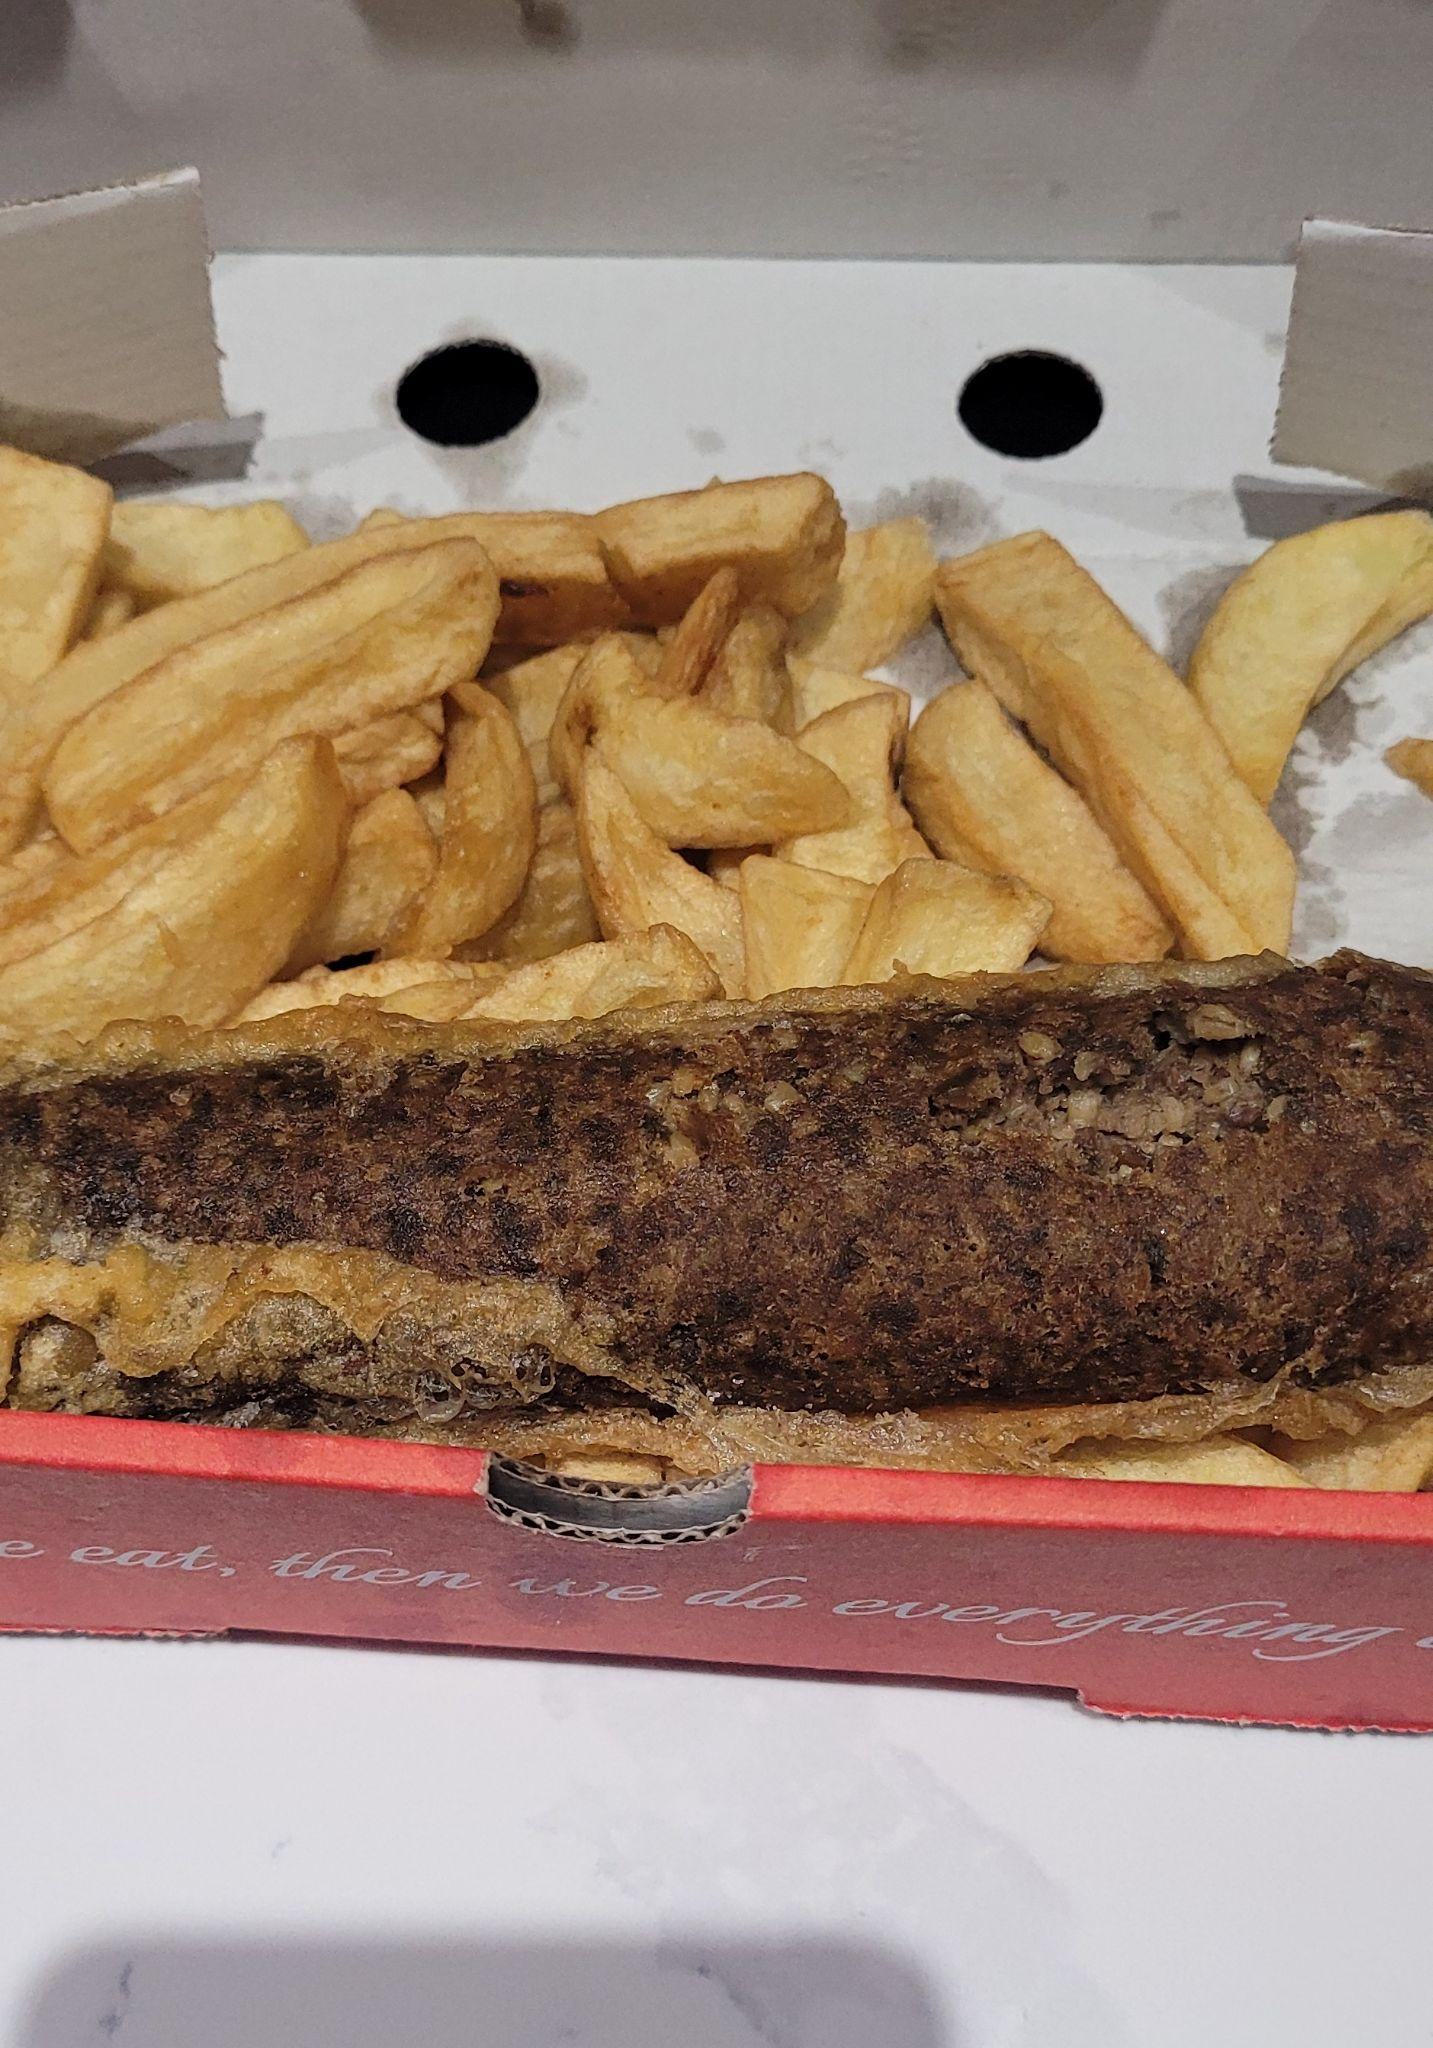
The meal with the highest calorie content was battered pizza with 1327 kcal per portion [range 480-2114 kcal], equating to 66 percent of the maximum dietary recommendation per day. The meal with the biggest range in calories across the samples was macaroni cheese, with a 1811 calorie difference between the most and least calorific samples. Five of the six meal types sampled contained over 50 percent of the maximum dietary recommendation for calories per day.
For samples in the sweet snacks and desserts category, the calories per portion ranged from 423 to 589 kcal, which is 21 to 30 percent of the maximum dietary recommendation per day for calories, respectively. Cheesecake had the largest range of calories, with samples containing between 339 and 2196 calories per portion.
Samples in the Starters, side plates and small dishes (savoury snacks) category had a range of between 682 and 767 calories per portion, which is 34 to 38 percent of the maximum dietary recommendation per day. They ranged from a sample of chips containing 360 calories per portion to 1532 calories per portion of vegetable pakora.
The children's meals sampled contained between 682 and 982 calories per portion, which is 40 percent and 58 percent of a child's maximum dietary recommendation per day. Thirty-eight percent of children's meals sampled contained more than 50 percent of the maximum dietary recommendation for daily calorie intake per day. The children's cheeseburger and chips had the highest calories of the children's meals samples, with one sample containing 1175 calories.
| Food item |
Median calories (kcal) (range) |
% of maximum daily dietary recommendations (2000 kcal adult female) |
| Doner kebab with accompaniments (salad, sauce, pitta) |
1283 (812-1542) |
64.2 |
| Vegetarian burger (meat alternative) and chips |
1124 (617-1378) |
56.2 |
| Macaroni cheese |
681 (296-2107) |
34.1 |
| Battered haggis supper (including chips) |
1311 (625-1681) |
65.5 |
| Battered sausage supper (including chips) |
1278 (254-1592) |
63.9 |
| Battered pizza |
1327 (480-2114) |
66.4 |
| Vegetable pakora |
767 (564-1532) |
38.3 |
| Chips and cheese |
731 (560-901) |
36.5 |
| Portion of chips |
682 (360-1095) |
34.1 |
| Sweet muffin |
423 (240-699) |
21.2 |
| Cheesecake |
497 (339-2196) |
24.8 |
| Millionaires shortbread |
590 (329-1035) |
29.5 |
| Children's portion of fried coated chicken strips and chips |
682 (569-930) |
40.1 |
| Children's portion of cheeseburger and chips |
982 (691-1175) |
57.8 |
Total fat
The results of the analysis of total fat contained in the samples are displayed in Table 3. For reference, the maximum dietary recommendations for total fat are 78g per day for female adults and 66g per day for 7-10 year old girls.
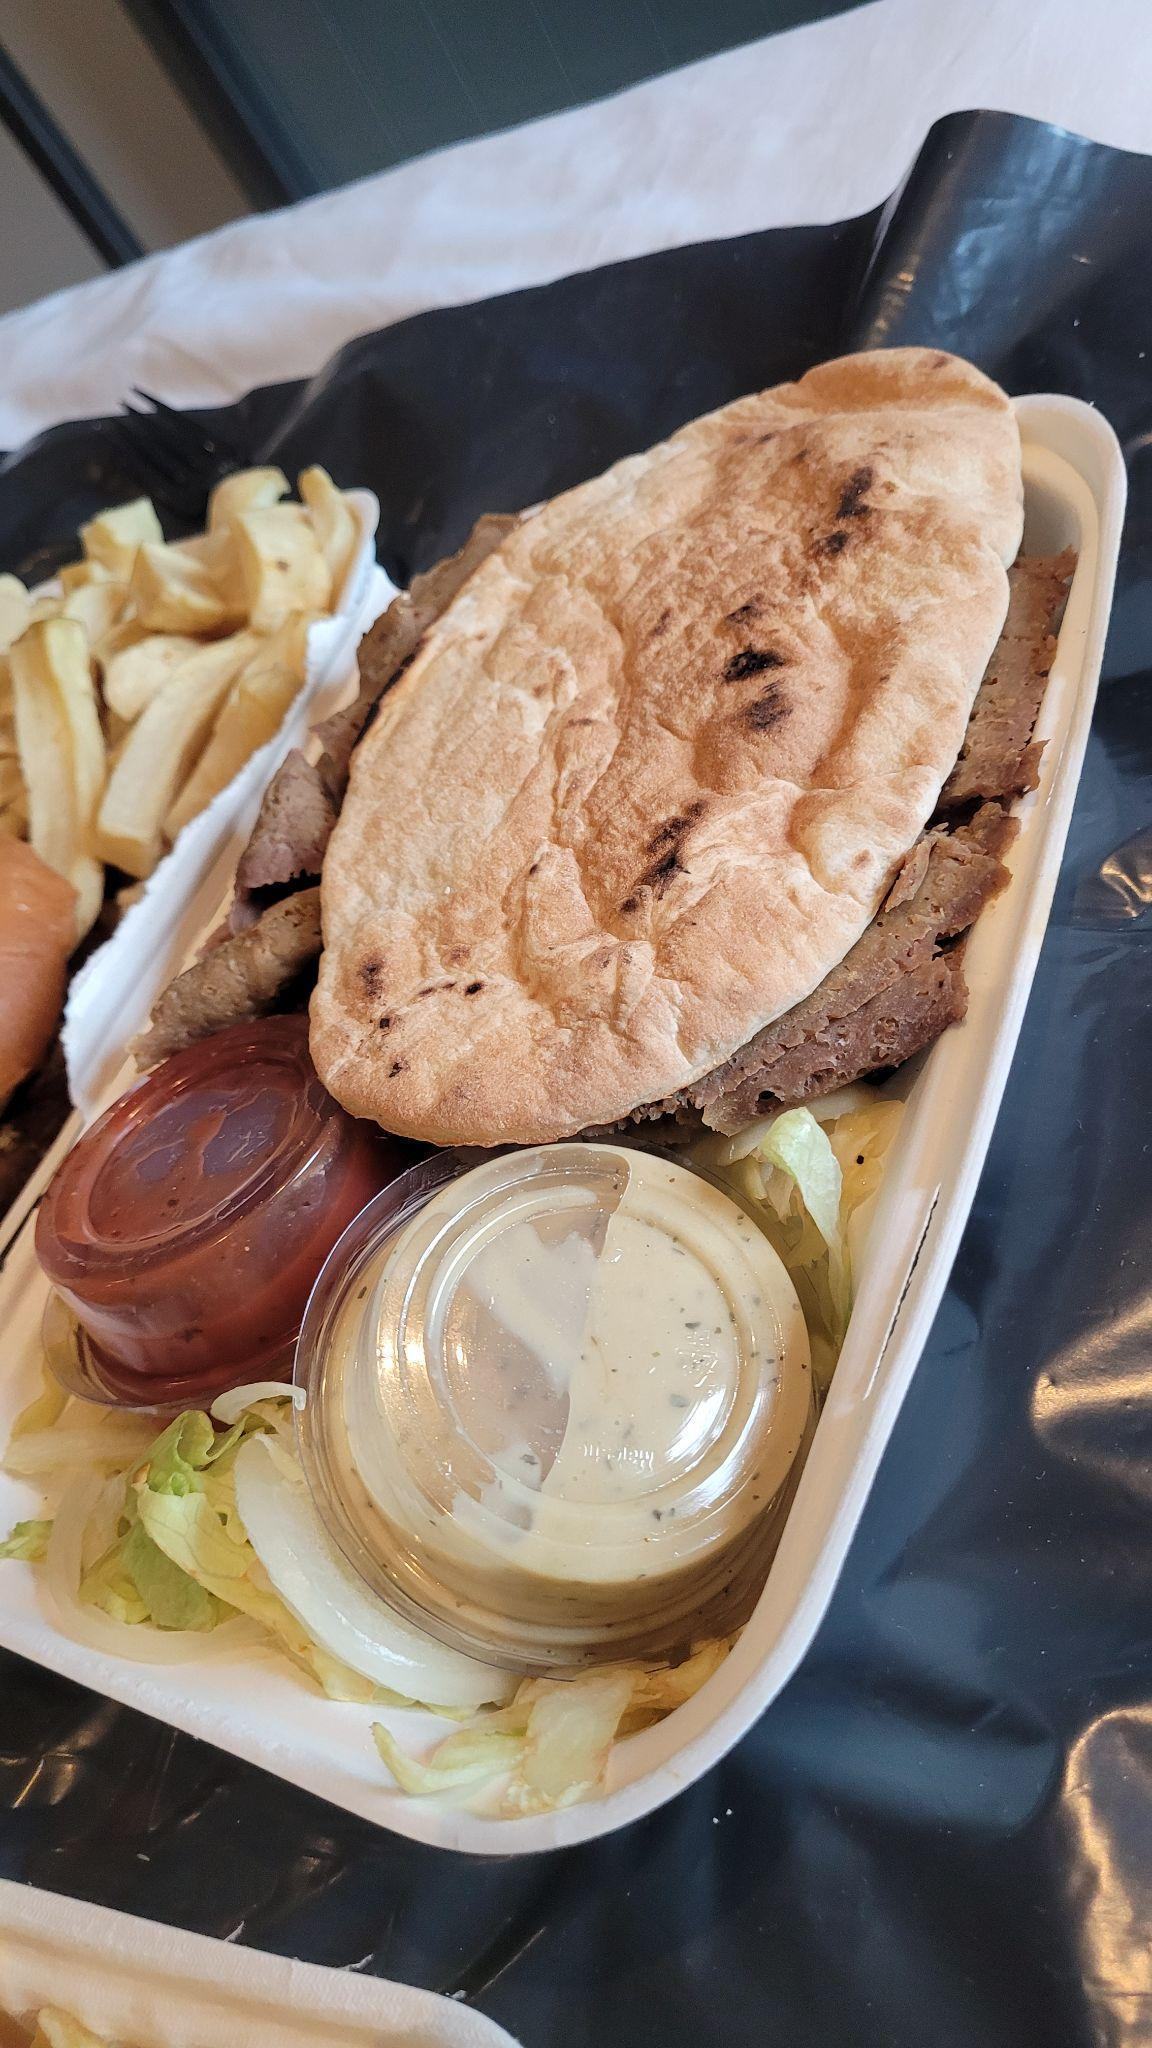
Doner kebabs had the highest level of total fat of the items sampled, with 86.1g per portion, which equates to 10 percent over the maximum dietary recommendation per day.
The children's portions sampled contained between 46 and 66 percent of the maximum dietary recommendation for total fat per day, with a children's portion of cheeseburger and chips containing 43.8g of total fat.
The highest amount of total fat recorded was 161g in a portion of macaroni cheese, which is over double the maximum dietary recommendation per day. Three of the top four samples for total fat content were macaroni cheese. However, the second lowest result for total fat content was also macaroni cheese with 9.6g, highlighting the large 151g variation in total fat recorded within this single food type.
| Food item |
Calories (kcal) (median) |
Total fat (g) (median/range) |
% of maximum daily dietary recommendations (max 78g adult females) |
| Doner kebab with accompaniments (salad, sauce, pitta) |
1283 |
86.1 (52.5-105.7) |
110.4 |
| Vegetarian burger (meat alternative) and chips |
1124 |
50.3 (21.8-62.9) |
64.6 |
| Macaroni cheese |
681 |
33.2 (9.6-160.7) |
42.6 |
| Battered haggis supper (including chips) |
1311 |
58.5 (31.8-83.0) |
75.0 |
| Battered sausage supper (including chips) |
1278 |
67.2 (13.3-80.4) |
86.2 |
| Battered pizza |
1327 |
54.3 (23.2-113.6) |
69.6 |
| Vegetable pakora |
767 |
43.4 (31.3-111.5) |
55.6 |
| Chips and cheese |
731 |
37.3 (26.7-47.9) |
47.8 |
| Portion of chips |
682 |
28.4 (18.3-39.1) |
36.4 |
| Sweet muffin |
423 |
18.7 (9.5-38.2) |
24 |
| Cheesecake |
497 |
33.3 (16.8-147.2) |
42.7 |
| Millionaires shortbread |
590 |
32.7 (17.2-71.6) |
41.9 |
| Children's portion of fried coated chicken strips and chips |
682 |
30.6 (24-47.9) |
46.4 |
| Children's portion of cheeseburger and chips |
982 |
43.8 (32.2-64.3) |
66.4 |
Saturated Fat
The results of the analysis of saturated fat in the samples collected are displayed in Table 4. For reference, the maximum dietary recommendations for saturated fat are 24g per day for female adults and 21g per day for 7-10 year old girls.
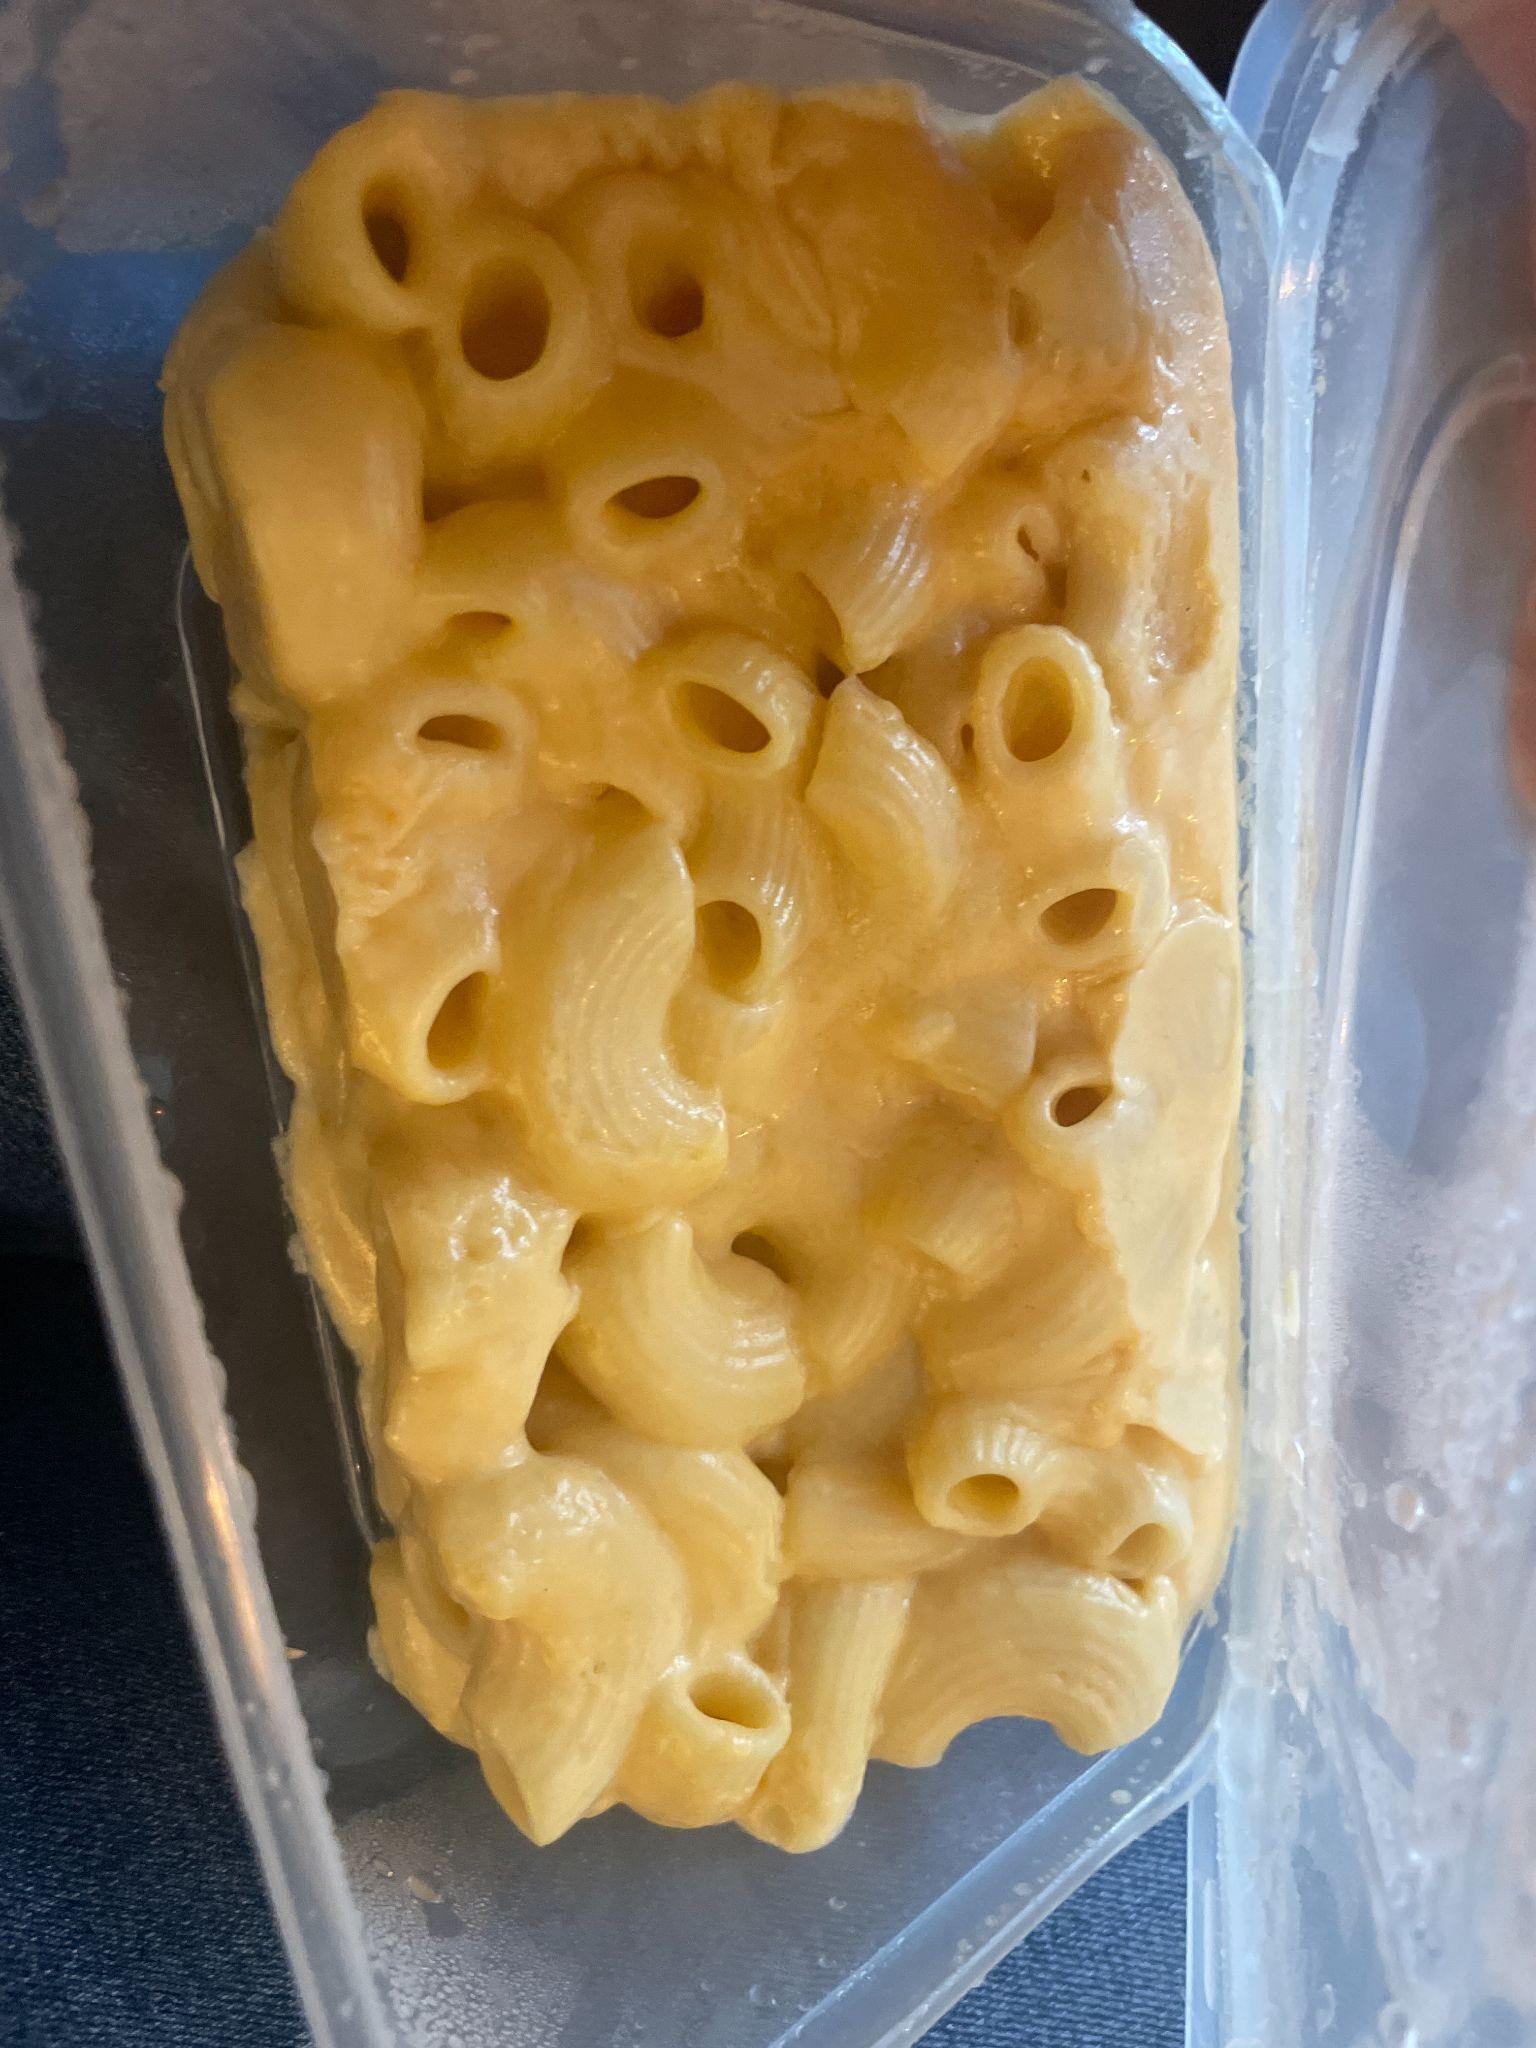
Doner kebab dishes had the highest levels of saturated fat, with 37g per portion, which is 54 percent over the maximum dietary recommendation per day for an adult. The sample with the highest saturated fat level was macaroni cheese, which contained 101g of saturated fat, 421 percent of the maximum dietary recommendation per day.
The children's portions contained, in a single meal, between 64 and 98 percent of the maximum dietary recommended per day of saturated fat.
Savoury meals were the category with the highest average amounts of saturated fat, with three of the six food items sampled containing an amount which was more than the maximum dietary recommendation per day.
For the food category Starters, side plates and small dishes (savoury snacks), chips and cheese had the highest levels of saturated fat with 22g per portion, 92 percent of the maximum dietary recommendation per day.
In the food category, Sweet snacks and desserts, millionaire's shortbread and cheesecake had the highest levels of saturated fat, with between 73 and 83 percent of the maximum dietary recommendation per day. One portion of cheesecake contained 78.7g of saturated fat, which is 328 percent of an adult's maximum dietary recommendation per day.
| Food item |
Calories (kcal) (median) |
Total saturated fat (g) (median/range) |
% of daily dietary recommendations (max 24g female adult) |
| Doner kebab with accompaniments (salad, sauce, pitta) |
1283 |
37 (21.0 - 46.8) |
154.2 |
| Vegetarian burger (meat alternative) and chips |
1124 |
10.5 (2.0 - 18.7) |
43.6 |
| Macaroni cheese |
681 |
18 (5.4 - 100.5) |
75 |
| Battered haggis supper (including chips) |
1311 |
26.5 (11.6 - 34.6) |
110.4 |
| Battered sausage supper (including chips) |
1278 |
27 (6.1 - 38.4) |
112.5 |
| Battered pizza |
1327 |
23 (4.7 - 61.1) |
95.8 |
| Vegetable pakora |
767 |
8.5 (3.3 - 45.4) |
35.4 |
| Chips and cheese |
731 |
22 (16.3 - 28.2) |
91.7 |
| Portion of chips |
682 |
11.5 (1.9 - 17.9) |
47.9 |
| Sweet muffin |
423 |
3.5 (1.1 - 6.2) |
14.6 |
| Cheesecake |
497 |
17.5 (9.6 - 78.7) |
72.9 |
| Millionaires shortbread |
590 |
20 (9.2 - 48.0) |
83.3 |
| Children's portion of fried coated chicken strips and chips |
682 |
13.5 (2.6 - 21.5) |
64.3 |
| Children's portion of cheeseburger and chips |
982 |
20.5 (6.8 - 29.3) |
97.6 |
Salt
The results of the analysis of salt contained in the samples are displayed in Table 5. For reference, the maximum dietary recommendations for salt are 6g per day for female adults and 5g for 7-10 year old girls.
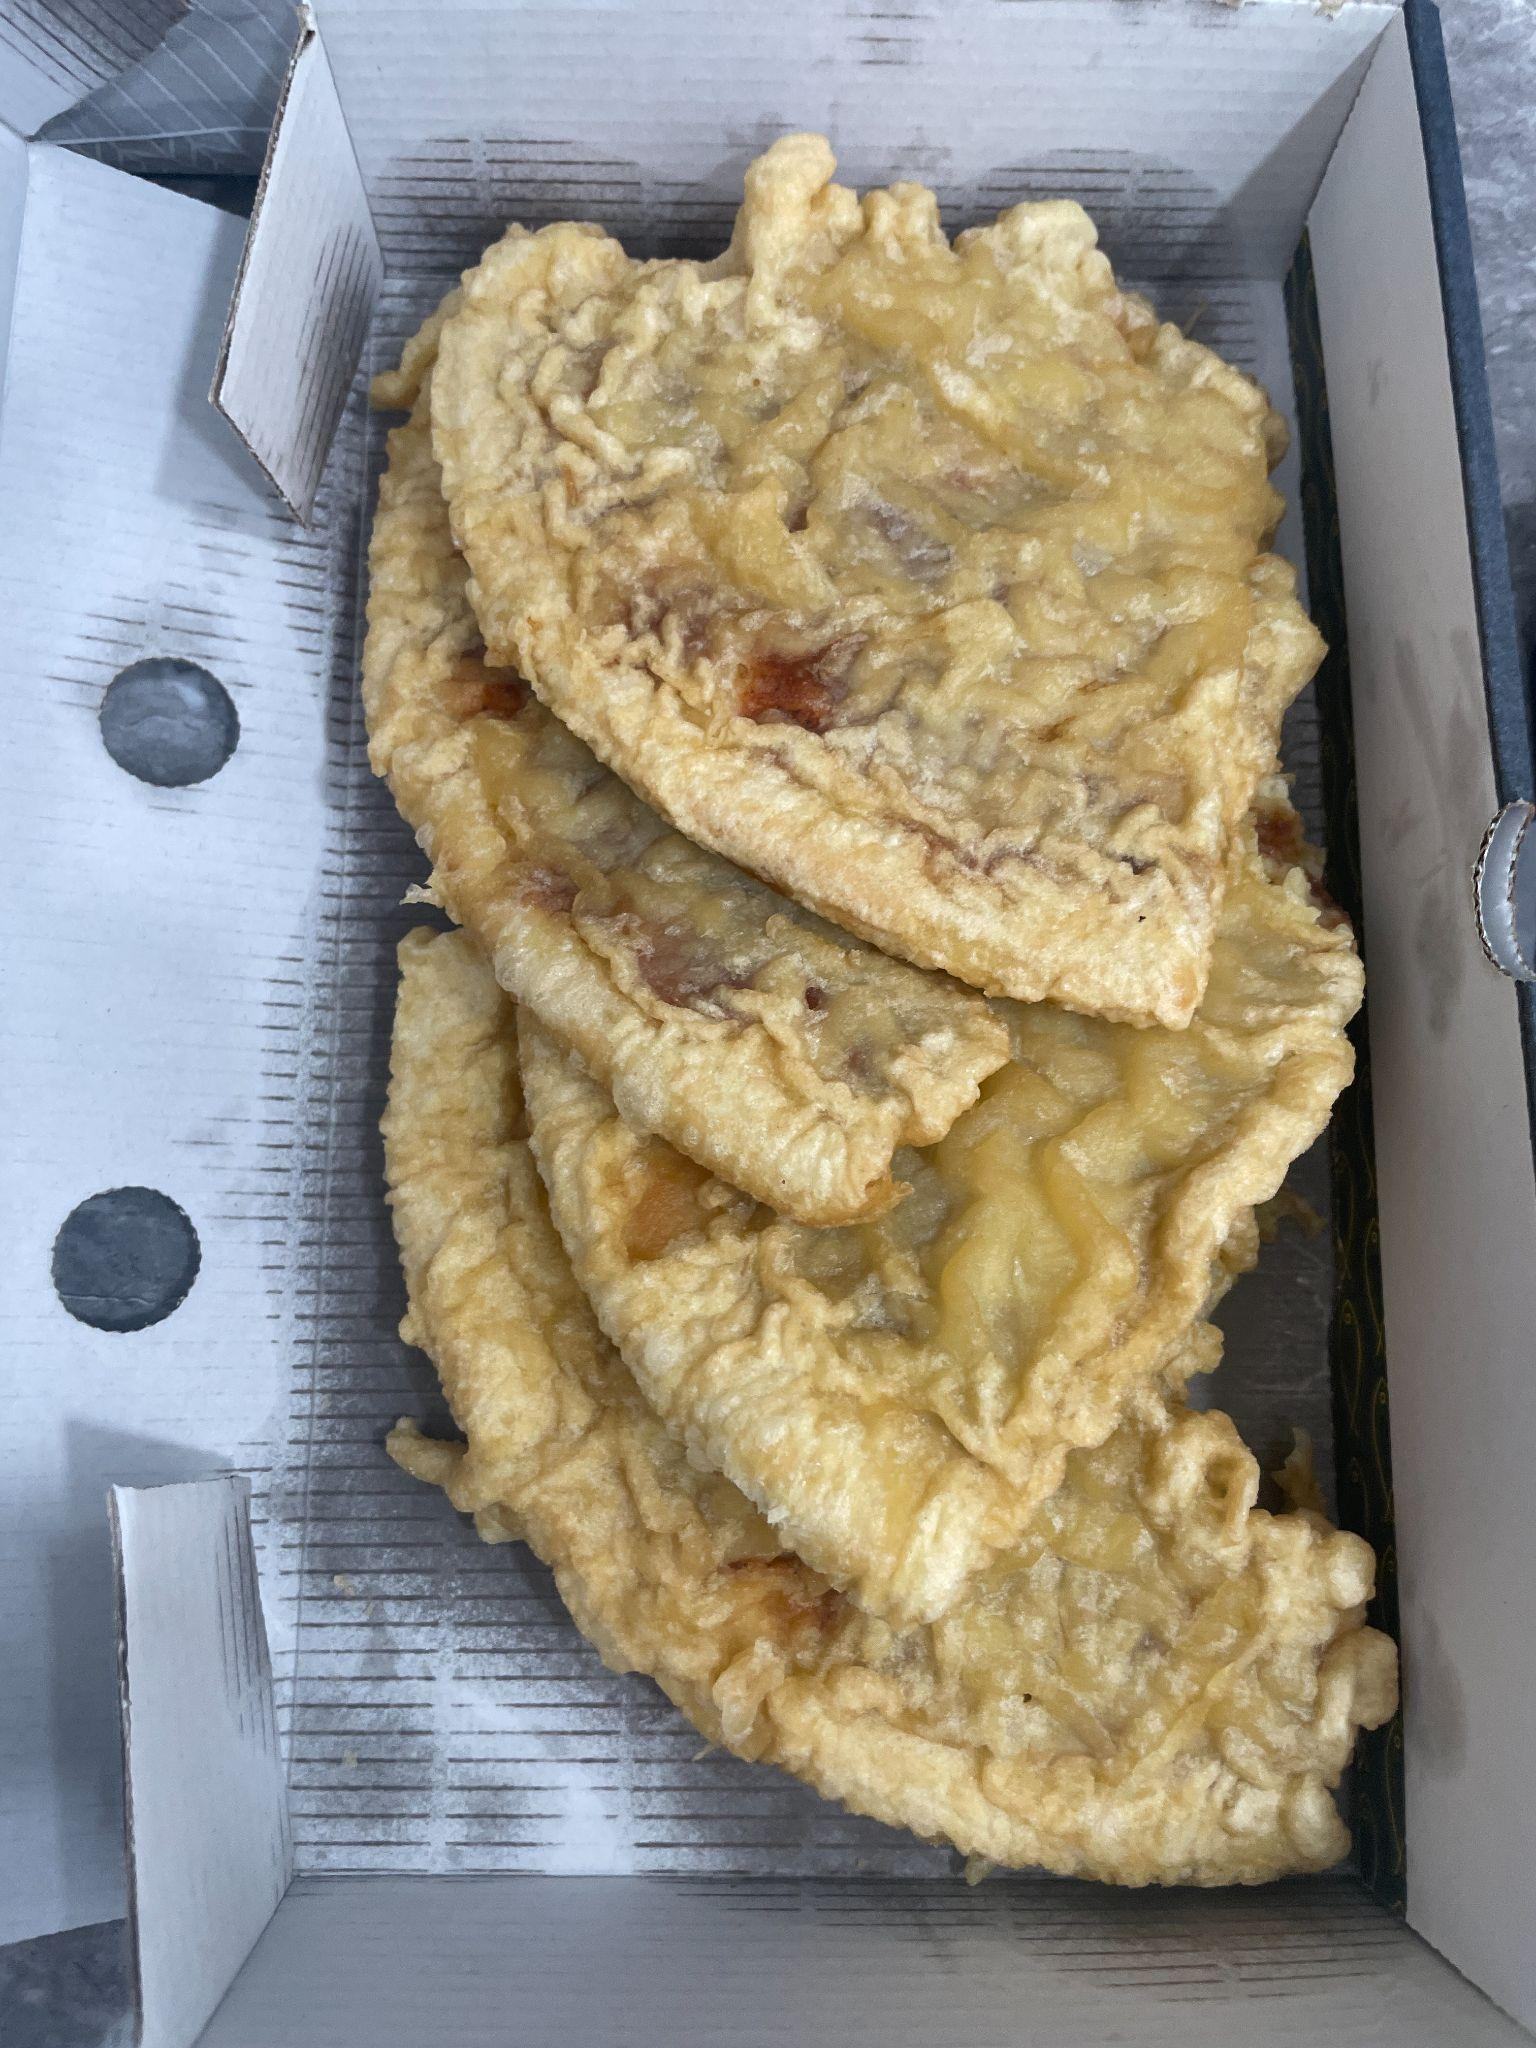
Doner kebab was the meal type with the highest levels of salt per portion, with 7.7g, which is 28 percent over the maximum dietary recommendation of 6g per day. Battered pizza had 5.4g of salt per portion, which is 90 percent of the maximum dietary recommendation per day, followed by vegetable pakora, which had 5g of salt per portion, which is 83 percent of the maximum dietary recommendation per day.
A battered pizza was the sample with the highest amount of salt recorded in a single sample, with one sample containing 14.9g, which is almost three times the maximum dietary recommendation per day. Fourteen percent of all food samples tested contained over the maximum dietary recommendation per day of salt.
Thirty-one percent of samples contained over 4g of salt, which is 66 percent of the maximum dietary recommendation per day, while 31 percent of samples contained less than 1g of salt, which is 17 percent of the maximum dietary recommendation per day. Savoury meals were the category with the highest amount of salt, containing 4.8g per meal.
Children's cheeseburger and chips meals contained 3.4g of salt, which is 68 percent of the maximum dietary recommendation per day. The salt in children's meals ranged from 0.4g to 4.7g per portion.
| Food item |
Calories (kcal) (median) |
Salt (g) (median/range) |
% of maximum daily dietary recommendations (max 6g female adults) |
| Doner kebab with accompaniments (salad, sauce, pitta) |
1283 |
7.7 (4.0 - 13.1) |
128.3 |
| Vegetarian burger (meat alternative) and chips |
1124 |
2.9 (1.6-4.1) |
48.3 |
| Macaroni cheese |
681 |
2.7 (1.8-5.3) |
45.0 |
| Battered haggis supper (including chips) |
1311 |
4.7 (2.5 - 8.4) |
78.3 |
| Battered sausage supper (including chips) |
1278 |
3.7 (1.2 - 6.0) |
61.7 |
| Battered pizza |
1327 |
5.4 (1.4 - 14.9) |
90.0 |
| Vegetable pakora |
767 |
5 (2.7 - 7.3) |
83.3 |
| Chips and cheese |
731 |
1.7 (0.9 - 2.5) |
28.3 |
| Portion of chips |
682 |
0.4 (0.0 - 2.0) |
6.7 |
| Sweet muffin |
423 |
0.5 (0.2 - 1.9) |
8.3 |
| Cheesecake |
497 |
0.7 (0.4 - 1.9) |
11.7 |
| Millionaires shortbread |
590 |
0.4 (0.1 - 0.7) |
6.7 |
| Children's portion of fried coated chicken strips and chips |
682 |
1.2 (0.4 - 3.0) |
24.0 |
| Children's portion of cheeseburger and chips |
982 |
3.4 (2.1 - 4.7) |
68.0 |
Sugar
As noted above, the maximum dietary recommendation figures per day for sugar relate to free sugar. The definition of free sugars includes: all added sugars in any form; all sugars naturally present in fruit and vegetable juices, purées and pastes and similar products in which the structure has been broken down; all sugars in drinks (except for dairy-based drinks); and lactose and galactose added as ingredients. The maximum dietary recommendations for free sugar are a maximum of 27g per day for adults and a maximum of 23g per day for children aged 7-10.
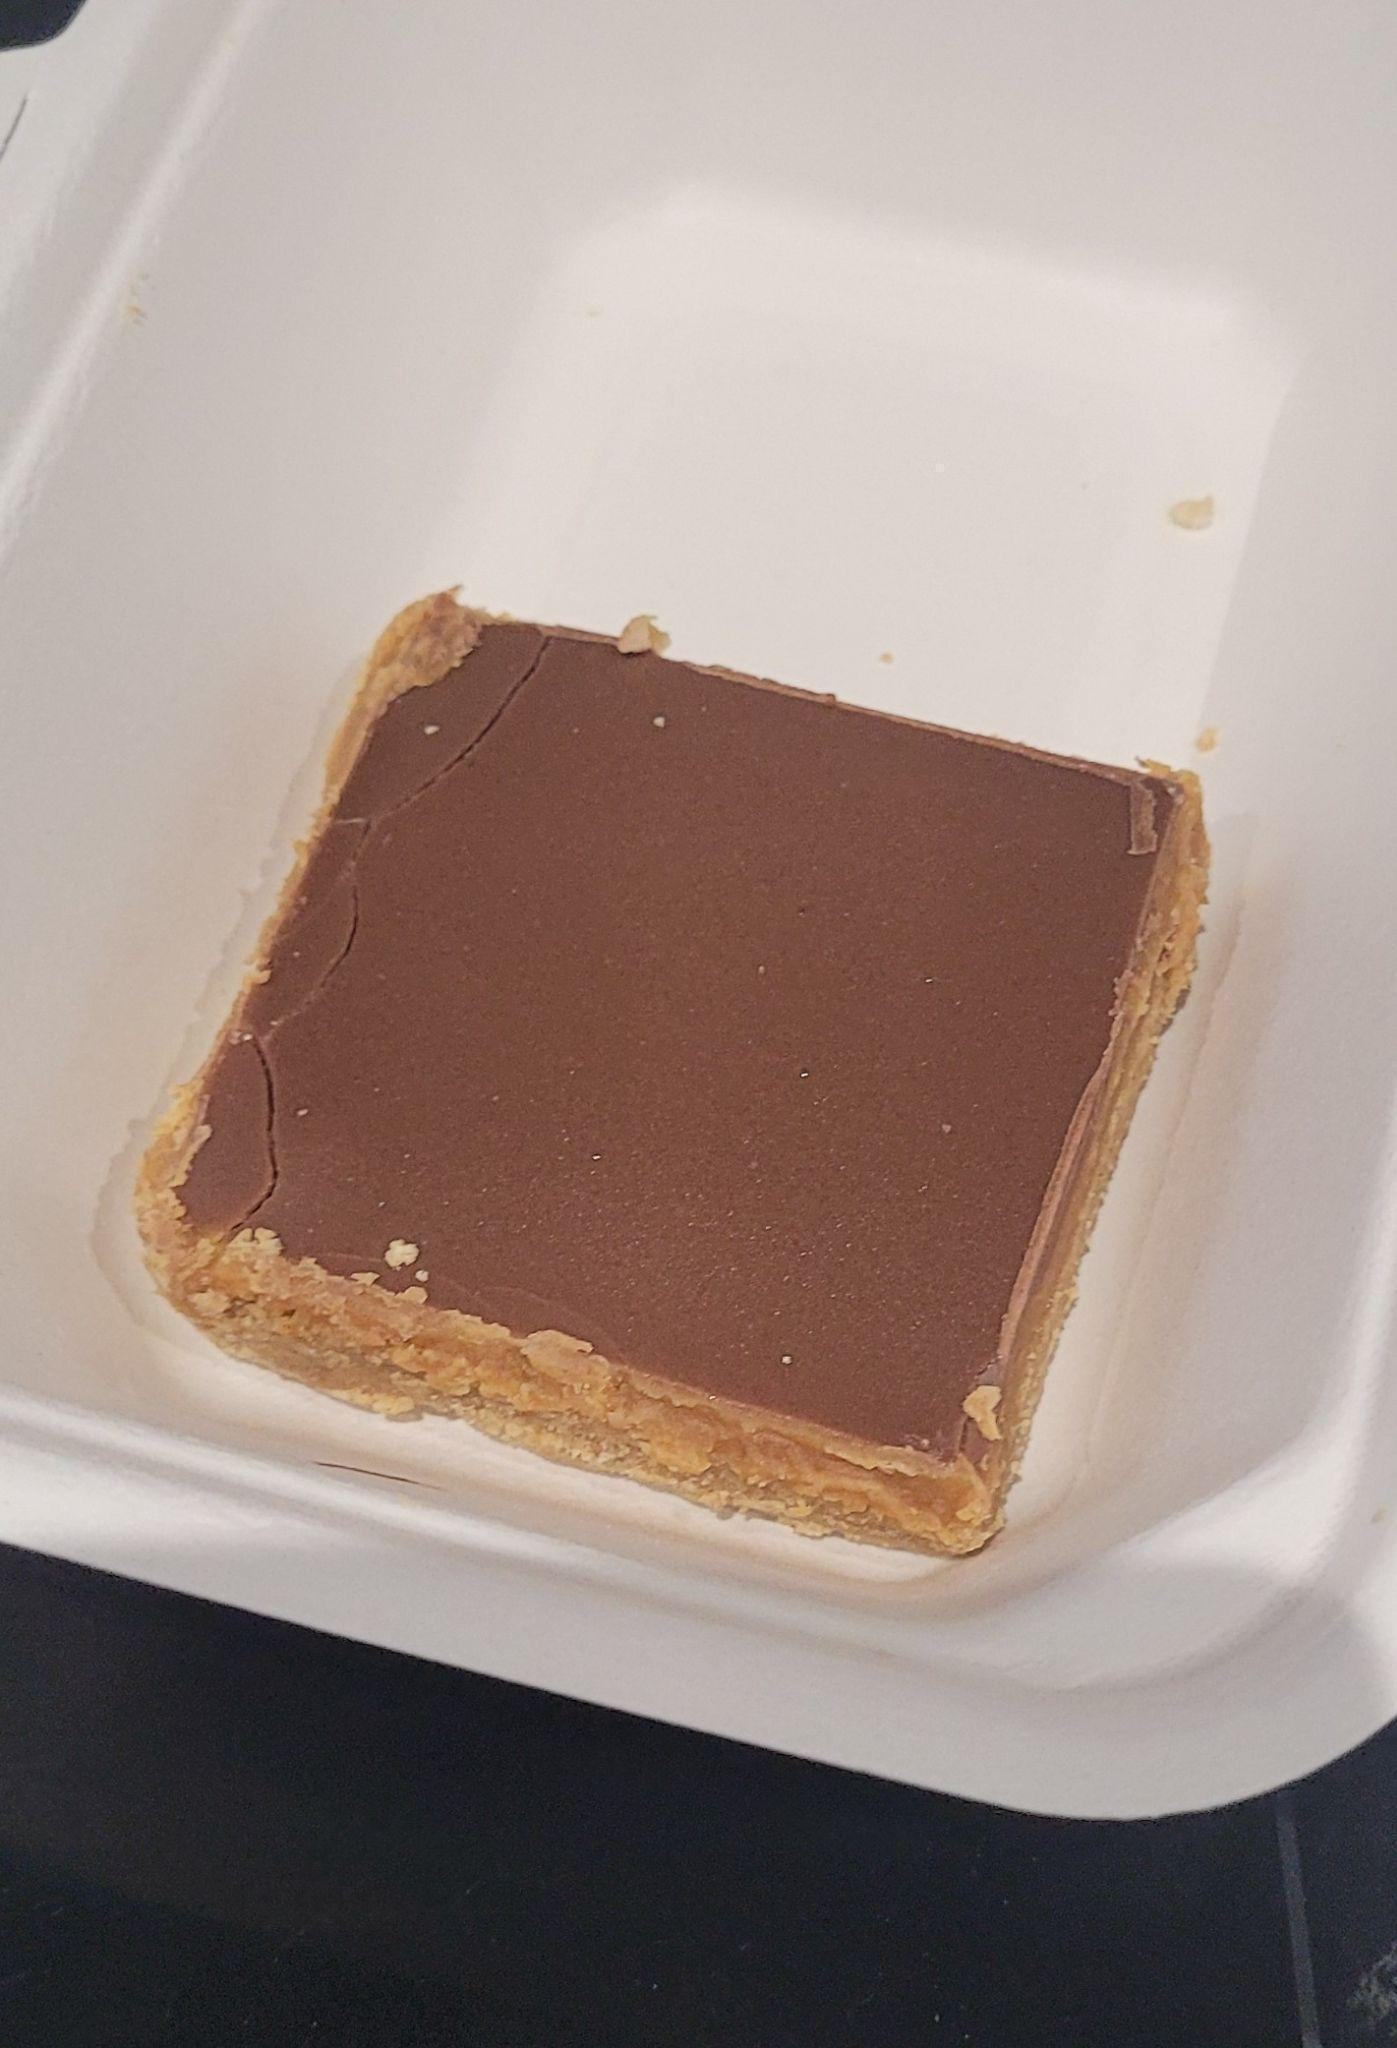
The values in this analysis relate to total sugar. This is because free sugar content cannot be determined by lab analysis. Total sugars are the sum of all sugars in a food or drink, including those that occur naturally and those that are added. A suggested reference intake for maximum amounts of total sugar used in this analysis is 90g per day for adults, based on the Front of Pack Labelling Guidance for pre-packed foods and is higher to reflect the inclusion of all sugars. There is no corresponding figure for children.
The results of the analysis of total sugar contained in the samples are displayed in Table 6.
Samples in the Sweet snacks and desserts category had the highest levels of total sugar, with the majority of this likely to be free sugar, as it is unlikely that they would contain significant sources of natural sugars. Overall, samples in the Sweet snacks and desserts category contained between 25 and 38 percent of the reference intake per day of total sugar per portion and between 82 and 126 percent of the maximum dietary recommendation per day for free sugars, which is 27g.
Millionaire's shortbread had 34.1g of total sugar per portion, which is 37.9 percent of the maximum reference intake per day for total sugars and 26 percent over the maximum dietary recommendation per day for free sugars. The highest levels of total sugar were found in a cheesecake sample, which contained 126.3g of total sugar, which is 40 percent over the maximum reference intake for total sugar per day.
Samples in the Savoury meals and starters, side plates and small dishes (savoury snacks) category were also relatively high in total sugar with vegetarian burgers, battered pizza and vegetable pakora containing between 11.3g and 13.7g of total sugar, which is between 12.6 and 15.2 percent of the reference intake per day of total sugar.
Children's meals sampled were low in total sugar, with 1.2g and 5.7g of total sugar per portion.
| Food item |
Calories (kcal) (median) |
Total sugar (g) (median/range) |
% of maximum daily reference intake (90g/adults) |
| Doner kebab with accompaniments (salad, sauce, pitta) |
1283 |
7.6 (3.8 - 24.3) |
8.4 |
| Vegetarian burger (meat alternative) and chips |
1124 |
13.7 (8.4 - 16.2) |
15.2 |
| Macaroni cheese |
681 |
7.5 (2.7 - 14.2) |
8.3 |
| Battered haggis supper (including chips) |
1311 |
3.2 (1.2-6.4) |
3.5 |
| Battered sausage supper (including chips) |
1278 |
3.3 (0.7 - 6.7) |
3.6 |
| Battered pizza |
1327 |
11.5 (3.8 - 18.0) |
12.8 |
| Vegetable pakora |
767 |
11.3 (3.0 - 19.2) |
12.6 |
| Chips and cheese |
731 |
1.3 (1.2 - 1.4) |
1.4 |
| Portion of chips |
682 |
0.9 (0.7 - 1.9) |
1.0 |
| Sweet muffin |
423 |
25.3 (15.8 - 45.7) |
28.1 |
| Cheesecake |
497 |
22.1 (11.1 - 126.3) |
24.6 |
| Millionaires shortbread |
590 |
34.1 (22.5 - 78.3) |
37.9 |
| Children's portion of fried coated chicken strips and chips |
682 |
1.2 (0.9 - 7.6) |
N/A |
| Children's portion of cheeseburger and chips |
982 |
5.7 (1.7 - 14.3) |
N/A |
Fibre
The results of the analysis of the fibre contained in the samples are displayed in Table 7. As a point of reference, the minimum dietary recommendation for fibre is 30g per day for a female adult and 20g per day for a 7-10 year old girl. Fibre, unlike the other nutrients discussed, is beneficial for health in higher quantities, so higher values for fibre in the analysis are viewed as positive.

Vegetable pakora is the dish with the highest amount of fibre, with 16.3g per portion, which is 54 percent of the minimum dietary recommendation per day. This is followed by a battered haggis supper with 16.2g of fibre.
Samples in the sweet snacks category were particularly low in fibre, with between 0.7g and 1.8g per portion.
Children's meals sampled provided between 33 and 46 percent of the minimum dietary recommendation per day of fibre, with 6.5 and 9.3g per portion.
Eighteen percent of samples had less than 2g of fibre per portion and 37 percent of samples contained over 10g per portion. Only one sample, a vegetarian burger and chips, contained over the minimum dietary recommendation per day of 30g with 32g per portion.
| Food item |
Calories (kcal) (median) |
Fibre (g) (median/range) |
% of minimum daily dietary recommendations (30g female adults) |
| Doner kebab with accompaniments (salad, sauce, pitta) |
1283 |
8 (2.3 - 10.9) |
26.6 |
| Vegetarian burger (meat alternative) and chips |
1124 |
12.1 (8.5 - 32.3) |
40.4 |
| Macaroni cheese |
681 |
4.4 (1.7 - 13.6) |
14.6 |
| Battered haggis supper (including chips) |
1311 |
16.2 (7.7 - 20.2) |
53.8 |
| Battered sausage supper (including chips) |
1278 |
12.2 (2.4 - 16.4) |
40.6 |
| Battered pizza |
1327 |
9.9 (3.6 - 15.1) |
33.1 |
| Vegetable pakora |
767 |
16.3 (5.1 - 29.8) |
54.4 |
| Chips and cheese |
731 |
8.1 (7.2 - 9.0) |
27.1 |
| Portion of chips |
682 |
9.1 (5.4 - 19.2) |
30.2 |
| Sweet muffin |
423 |
1.8 (0.6 - 8.2) |
5.8 |
| Cheesecake |
497 |
0.7 (0.0 - 10.9) |
2.5 |
| Millionaires shortbread |
590 |
1.1 (0.4 - 10.5) |
3.7 |
| Children's portion of fried coated chicken strips and chips |
682 |
6.5 (3.5-9.8) |
32.5 |
| Children's portion of cheeseburger and chips |
982 |
9.3 (3.7 - 11.7) |
46.4 |
SIMD Quintile Results
We examined the relationship between meal calories and neighbourhood deprivation level (measured by the outward postcode SIMD, where a higher SIMD indicates a more deprived area). The average meal calorie count is 782 kcal for the most deprived areas (SIMD1). Meals in less deprived areas (SIMD2, SIMD3, and SIMD4) have slightly higher total calories per meal (+83 kcal, +196 kcal, and +94 kcal, respectively), but these differences were not statistically significant (p>0.05).
Composition of Foods Integrated Dataset (CoFID)
As noted above, two of the food items sampled can also be compared to the equivalent items contained in the Composition of Foods Integrated Dataset (CoFID). This is an open-source dataset that contains nutrient data for around 3,200 foods and recipe dishes. The data underpins research that regularly informs dietary policy and research. Professionals working in nutrition rely on it for assessing and recommending patients' nutrient intakes. It is also commonly used by the food industry in developing or reformulating products, especially in response to regulatory changes or voluntary legislation designed to make foods healthier. To collect the CoFID data, a number of samples are purchased at different shops, supermarkets or other retail outlets, foodservice outlets or catering suppliers. A comparison is able to be made between data collected on some food items in this research and the associated data contained in the CoFID database, although there are some differences in sampling protocol as noted below. This will provide insight into possible variations in the data on nutrient composition of out-of-home foods that may exist. Comparison is only able to be carried out for two foods, as many of the foods we sampled are not included within CoFID. This is due to the fact that the database has not kept pace with evolving trends in foods consumed out of home.
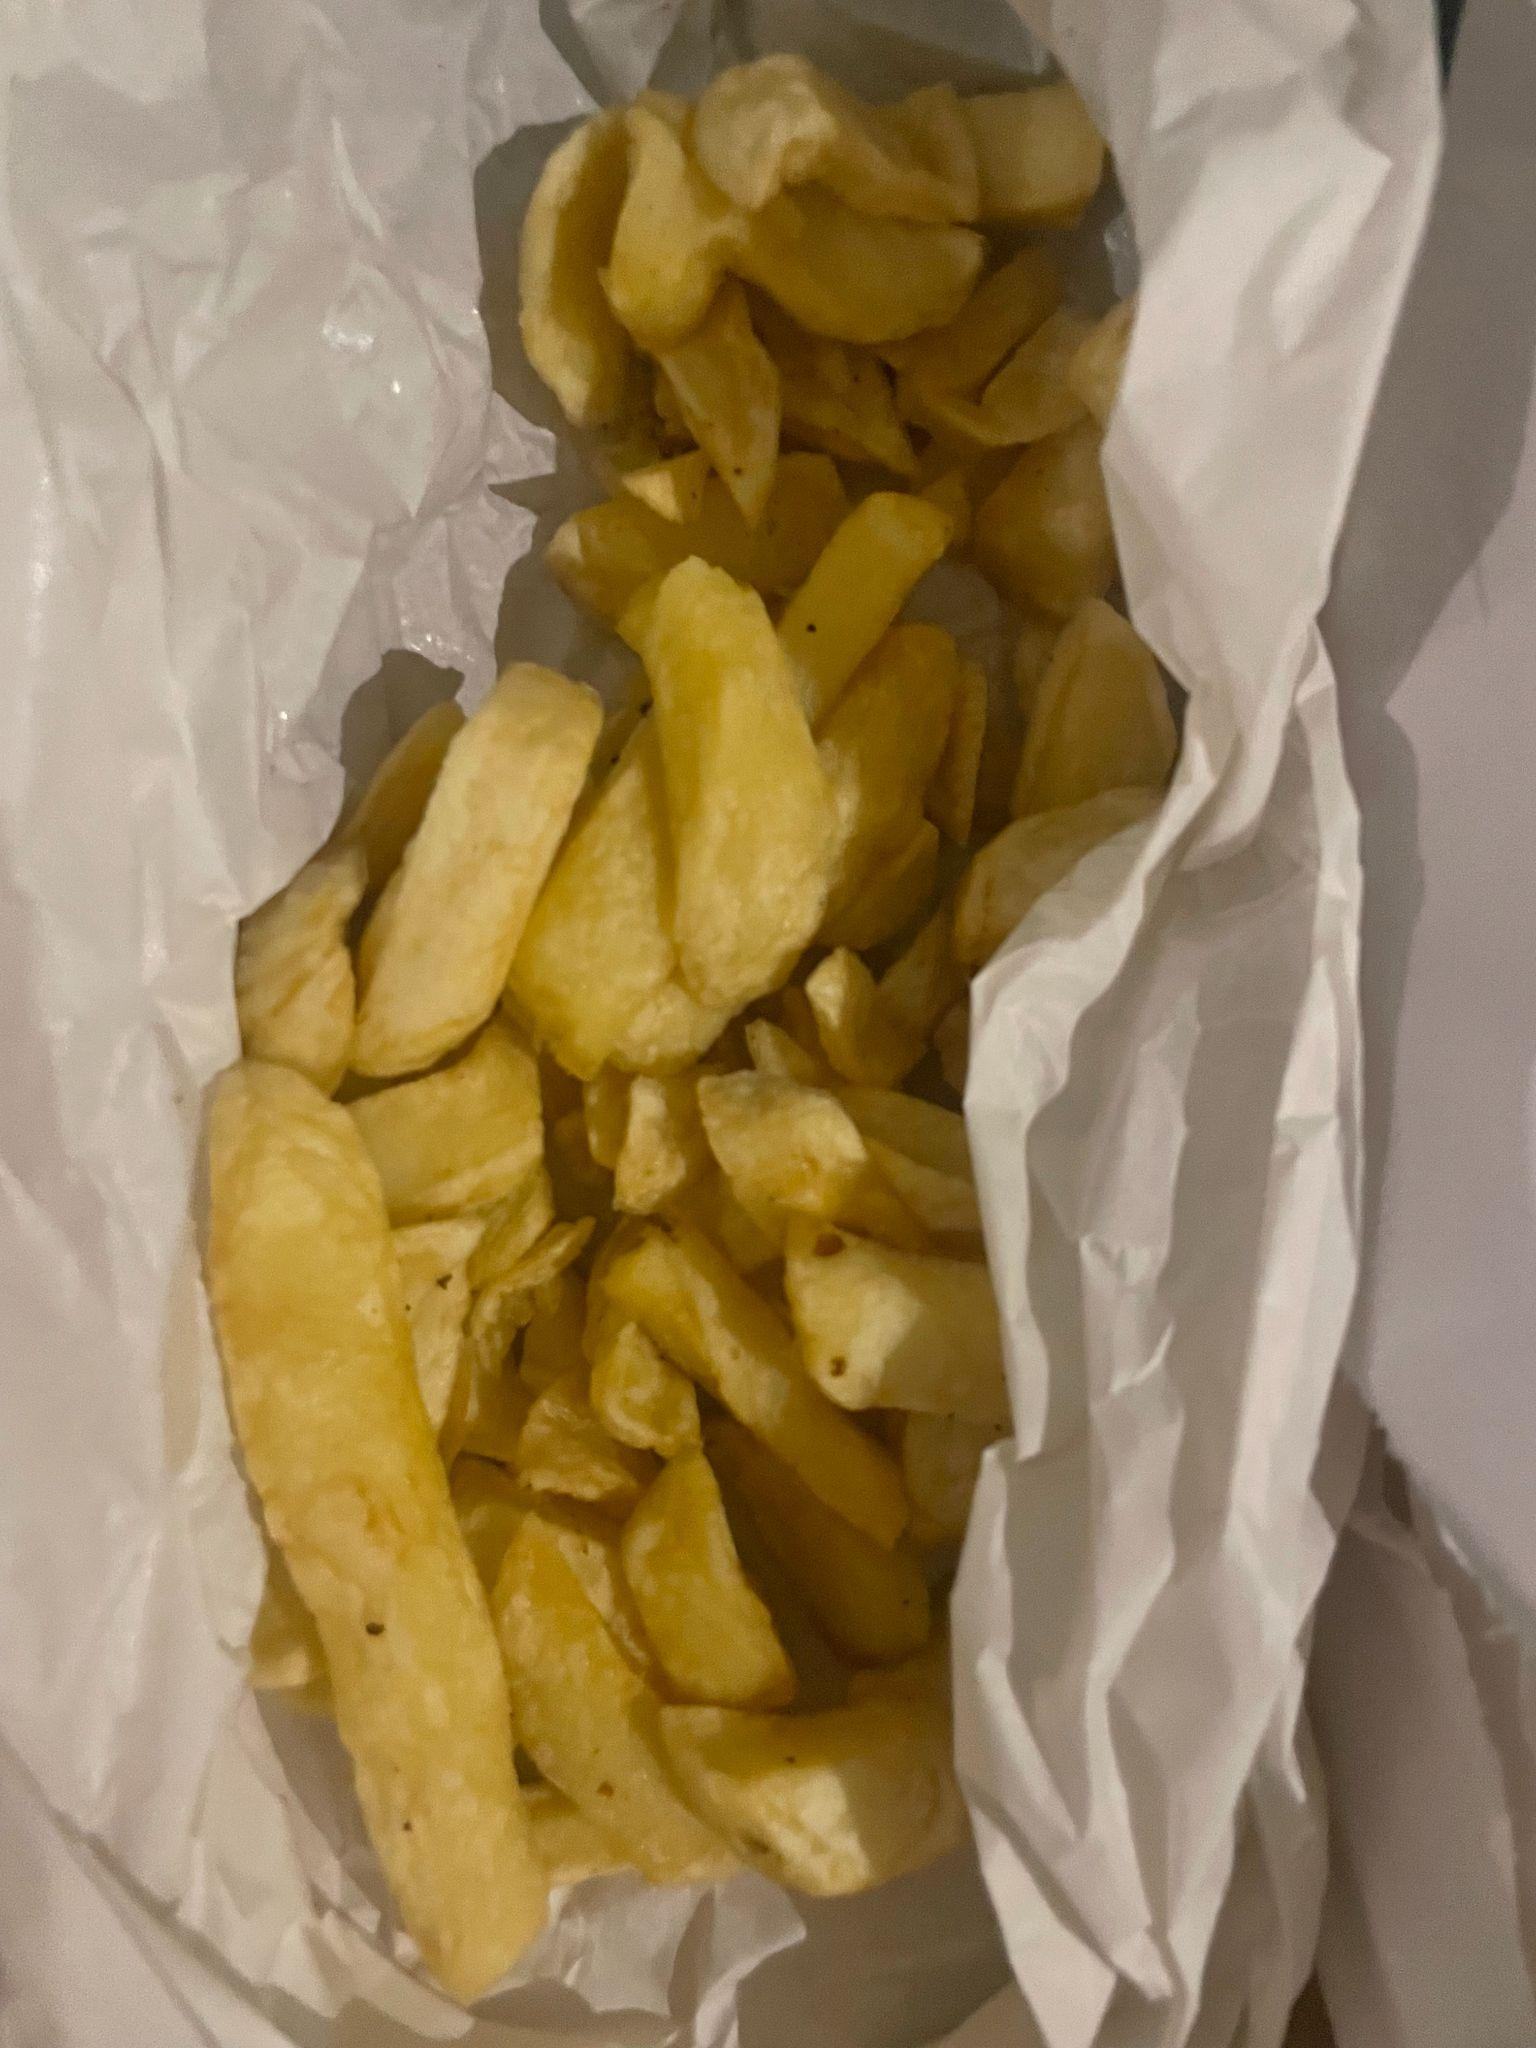
In the CoFID database, the samples analysed are composite samples, consisting of equal quantities of each sub-sample purchased. It should be noted that this differs from the sampling protocol used in this research, where the full sample purchased is analysed and the median amount of nutrients per 100g across each individual sample is identified.
A comparison of the data sets for the two food items is displayed in Table 9. It shows that for chips, the two data sets have similar values across calories, total fat/saturated fat, salt, sugar and fibre. There is more variation in the data for the vegetable pakora, with calories being similar but bigger variations in the figure for total fat, which is more than 33 percent higher in the CoFID sample, as well as saturated fat, which is 148 percent higher. Salt, however, was three times higher in the sample analysed in this research compared to the CoFID figure, with total sugar more than double, and fibre also over 1.5 times higher in the samples from this research.
| Food item |
Energy density (kcal/100g) |
Total fat (g/100g) |
Saturated fat (g/100g) |
Salt (g/100g) |
Total sugar (g/100g) |
Fibre (g/100g) |
| Vegetable pakora |
263.5 |
14.7 |
2.5 |
1.6 |
3.5 |
5.3 |
| CoFID vegetable pakora (takeaway and restaurant) |
293 |
22 |
3.7 |
0.5 |
1.5 |
3.3 |
| Portion of chips |
219.5 |
8.9 |
3.8 |
0.1 |
0.3 |
2.9 |
| CoFID potato chips, fried in commercial oil, from takeaway fish and chip shops |
214 |
8.4 |
4.29 |
0 |
0.6 |
3.2 |
Assumptions and limitations
An important assumption in our study is that the calorie and nutrient analysis is solely based on food items and does not include beverages, which can contribute significantly to the total calorie and nutrient intake; however were not within the scope of this research. We were also not looking at all the food consumed at any particular eating occasion.
The code was written to randomly generate postcodes that were then selected as sampling locations. This process didn't generate any postcodes from quintile five as the ratio of available postcodes in quintile five was significantly lower than the other quintiles. As the code generates postcodes based on proportions of each quintile in the sample, quintile five samples may be underrepresented in the data.
Data
The data is available open access via the Open Science Framework portal and can be accessed here. This work is made available subject to the Creative Commons Non-Commercial Licence.
Discussion
From the data, we can see that a large number of the food items we purchase from independent out-of-home outlets have levels of calories, total fat, saturated fat, total sugar and salt close to or exceeding the maximum dietary recommendations per day, and low levels of fibre. From a dietary health perspective, this raises concerns as the proportion of our diet which comes from products purchased out of home increases.
The findings of this study are increasingly cause for concern if these foods are consumed regularly. This is particularly the case given the likelihood of these foods being consumed in addition to other daily food intake and alongside other items such as drinks or desserts. From a public health risk perspective, the high levels of calories and saturated fat identified in the samples are of particular concern.
Similarly concerning is that these results show the high levels of calories, total fat, saturated fat, salt and total sugar, and low levels of fibre, in items that are classed as discretionary foods and are usually eaten out with a main meal. Food Standards Scotland research has consistently shown sweet discretionary products such as cakes, sweet pastries and biscuits to be among the top ten food categories purchased out of home in Scotland. As these foods are purchased so frequently, they have the potential to contribute significantly to an excess of total daily calories and other nutrients of concern.
It is also apparent that there is often a significant range within these nutrition values, with some samples of the same product having significantly lower or higher values. This provides evidence that it is possible to successfully produce and sell healthier versions of these popular food items. If adopted widely, this would benefit the health of consumers, but the main barrier is the fact that most small and independent out-of-home businesses do not have easy access to data on the nutritional content of the food they sell.
Despite sampling a 'regular', 'medium' or 'standard' sized portion, there were large variations recorded in the portion sizes for each food item across the samples collected. Again, this provides evidence that it is possible to sell smaller portions of these popular dishes that would have positive implications for health and also potentially business profit.
The nutritional content of the children's meals sampled is also concerning. These are meals specifically sold as being suitable for children that consistently contain high levels of calories, fat, saturated fat and salt in relation to the maximum dietary recommendation per day. These results demonstrate that the foods children are eating out-of-home could be having a potentially harmful impact on their health.
A compounding issue is the evidence that there is a relationship between the density of fast food outlets and the level of deprivation. This indicates increased exposure to less healthy food in more deprived areas and potentially increased health inequalities, particularly given the rising availability of out-of-home food via the growth in delivery apps.
These findings emphasise the importance of continued work to improve the nutritional content of food sold out of home, particularly taking into account the findings concerning discretionary food and children's meals and given the ineffectiveness of guidance and voluntary targets to date. The situation is exacerbated by the volume and variety of advertising, marketing and promotions by the out-of-home sector, whether through online, app, TV, outdoor or print media. This drives increased consumption and the potential negative impacts on dietary health.
Conclusion
These findings, along with previous research, demonstrate that it is possible to produce and sell healthier versions of popular out-of-home foods, which are better for us but still pleasurable and profitable. Whether through mandatory targets, reformulation or restricting advertising and promotions, creating healthier out-of-home food environments is essential if we are to tackle diet-related ill health in Scotland and support the achievement of the Scottish Dietary Goals. This should include tangible actions to improve provision, such as implementation of the Eating Out, Eating Well Framework and Code of Practice for Children's menus as outlined in the Scottish Government's out-of-home action plan.
Appendix
Laboratory methods
Below summarises the pre-analysis steps which all these calorie sampling project samples would have been subject to:
- Samples were collected and delivered by the customer or by our in-house couriers
- Weighed and blended in the UK on the day of receipt
- Transferred to Poland overnight in chilled vans by our in-house couriers
- Split into two aliquots on receipt in Poland, with one aliquot retained frozen (below - 15°C) for a month.
- Portions for testing were weighed from the other aliquot, with any excess subsequently retained in a refrigerator (2 – 8°C) for 7-10 days.
Transport
Vans are equipped with temperature loggers which read the temperature every 5 minutes. On return to the laboratory, these data are uploaded and stored electronically.
Freezers and refrigerators
These are checked, recorded daily and stored electronically. All out-of-spec values are immediately flagged and investigated.
Blending
All the samples from this project were of a size which could be blended in their entirety, ie, without needing to reduce the sample size or to separate any ingredients.
Weighing
The net weight, i.e without packaging, was recorded before blending the sample. Weights used in the individual tests are summarised below:
| Test |
Sample wt (g) |
Summary of procedure |
| N001 - ash @550°C |
3-4g |
Samples were ashed for 12 hours at 550°C in a furnace |
| N002 - moisture @102°C |
2-3g |
Samples were dried for 3 hours at 102°C in a drying oven |
| N003 - protein |
0.5-0.75g |
Samples were analysed using the Dumas method. |
| N004 - fat |
The sample portion was carried from the N002 test. |
Samples were analysed after oven drying by NMR. |
| N009 – Carbohydrate |
Calculation |
N/A |
| N009 – Energy (kj) |
Calculation |
N/A |
| N009 - Energy (kcal) |
Calculation |
N/A |
Calculations were performed as per the formulae below after all of the tests were conducted
Food samples were analysed using standardised laboratory procedures to determine their compositional characteristics:
Moisture and dry matter
Moisture content was assessed by oven-drying samples. The weight loss post-drying was used to calculate moisture content, from which dry matter was subsequently derived.
Fat content and type
Fat content was measured using Nuclear Magnetic Resonance (NMR) spectroscopy. Prior to analysis, moisture was removed from the samples to isolate fat molecules for accurate quantification. Fatty acids in a fat sample or a sample of fat extracted from a food are esterified to form fatty acid methyl esters (FAMES). The proportion of each FAME in the sample can be measured using GC-FID. FAMES or groups of FAMES may be reported as a proportion of the fat component, or may be calculated as a proportion of the whole sample by using triglyceride factors.
Fibre
To establish fibre content, the sample is defatted, starch is gelatinised with a-amylase, and then removed, along with the protein, by enzymatic digestion using protease and amyloglucosidase. The fibre is precipitated with IMS and filtered to produce a residue. Total dietary fibre is then determined gravimetrically with a correction for protein and ash.
Sodium content
Samples undergo microwave digestion in nitric acid, then the concentration of the analyte is determined by ICP-OES with calibration against matrix-matched standard solutions.
Carbohydrate and energy content
Carbohydrate and energy contents were calculated indirectly using standardised formulas based on the results obtained from ash, moisture, protein, and fat analyses. The formulas for each are below:
Total carbohydrate = 100 - ash, moisture, fat and protein
Energy kcal: fat * 9 + protein * 4 + carbohydrate * 4 + fibre * 2
Energy kj: fat * 37 + protein * 17 + carbohydrate * 17 + fibre * 8
Measurement uncertainty
Every laboratory test comes with a degree of uncertainty. This uncertainty can be attributed to numerous small variations during the sampling and analytical process. For example, how quickly the meal was frozen after purchase. Given this, we accept that there is a permissible range in which a result can fall (referred to as measurement uncertainty). For the energy test (ie, the amount of calories in a sample), the measurement uncertainty was 13 percent. This means there's a high probability (95 percent) that the true energy value for the food item analysed is in the range of 13 percent higher or 13 percent lower than reported. Notably, the effect of this measurement error is minimised when analysing many samples, as undertaken in this study. Measurement uncertainties for all tests used here can be provided on request.
Endnotes
58 Victoria Embankment
London EC4Y 0DS
+44 (0)20 7438 2500
[email protected]
X @nesta_uk
f nesta.uk
www.nesta.org.uk
Nesta is a registered charity in England and Wales with company number 7706036 and charity number 1144091. Registered as a charity in Scotland number SCO42833.
Registered office: 58 Victoria Embankment, London EC4Y 0DS.
CC BY NC SA