Introduction
Economic activity and the productivity that underlies it has a major impact on our ability to provide things that people value - from homes to hospitals to holidays. If we are to achieve continued improvement in the standard of living for UK citizens by 2040, growth will be key.
Where is the UK economy now, and where is it heading? There is no shortage of commentary, data and debate. These fundamental facts aim to distil the wealth of information into the core, foundational evidence and trends that policymakers should have front of mind as they consider the options, providing clear signals amongst the noise. Unsurprisingly, they illustrate that the UK economy is having significant difficulties at the moment with GDP per capita, real wages and productivity performing poorly both absolutely and comparatively. There is also some indication of the proximate causes of this: regional imbalances and low investment both now and historically appear as prime culprits. Whilst employment looks healthier there are warning signs there too, from growing long-term sickness to the impact of demographic changes by 2040.
Of course in considering these foundational facts it is worth bearing in mind that economic outcomes are just one way of measuring social progress. Whilst overall GDP growth, rising productivity and real wages tend to be associated with higher living standards, economic measures don't give us the whole picture. Not least, aggregate economic growth can mask inequality in varying forms. Across the UK 2040 Options project, we will be considering a wide set of outcomes from health to education and wealth inequality.
Dynamic versions of the charts shown throughout this document can also be seen here.
The UK's economic growth has slowed to almost zero
Having been ahead before the global financial crisis, economic growth in the UK was slower than in comparative countries in the decade before Covid-19
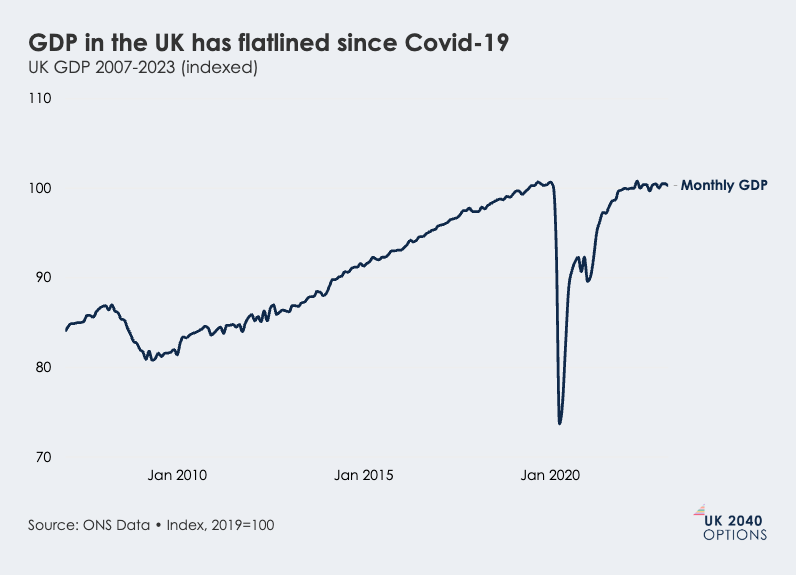
UK gross domestic product (GDP) growth has been fairly slow since the global financial crisis (GFC). GDP - the most commonly used indicator for the value of an economy - took a hit in most countries during Covid-19, and the UK was no exception, seeing a sharp fall. In the UK recovery has then been comparatively sluggish - we have still not fully recovered and GDP in March 2023 was the same as in July 2019. As of April 2023, the UK was the only G7 country that had not regained its pre-pandemic GDP levels.
GDP in the UK has flatlined since Covid-19
UK GDP 2007-2023 (indexed)
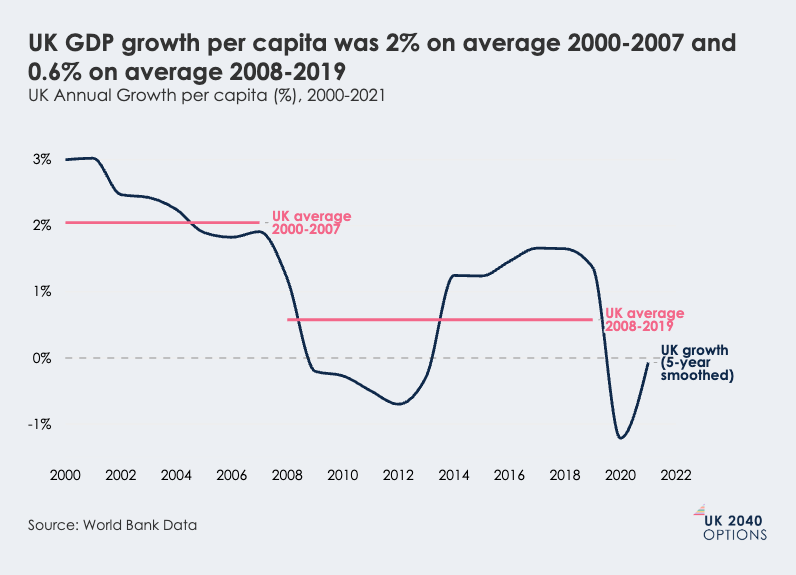
After taking population into account, GDP is often taken as indicator of how wealthy a country is. There are debates and discussions about how useful GDP is but it remains the most common benchmark to judge different countries' economic performance by. Over a longer time period UK GDP growth per capita has been much slower since the global financial crisis than before. Between 2000 and 2007 the UK economy grew 2% on average each year, from 2008 to 2019 it grew an average of 0.6% per year.
UK GDP growth per capita was 2% on average 2000-2007 and 0.6% on average 2008-2019
UK Annual Growth per capita (%), 2000-2021
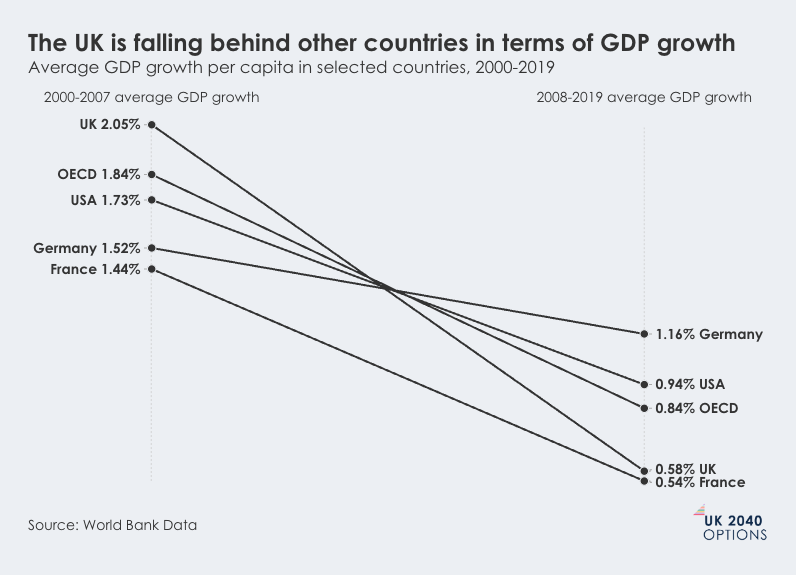
The UK fared well internationally prior to the financial crash: in the period 2000-2007 GDP growth per capita was 2% on average each year, higher than France (1.4%), Germany (1.5%), OECD member countries (1.8%) and the USA (1.7%). Post 2008, however, the picture has been very different: at 0.6% on average each year, it was lower than all of these countries except France (0.5%), Germany (1.2%), OECD members (0.8%) and USA (0.9%.)
The international figures illustrate a generalised slowdown in GDP per capita growth in developed economies. Slower growth is not solely a UK phenomenon, but the relative poor performance is notable.
The UK is falling behind other countries in terms of GDP growth
Average GDP growth per capita in selected countries, 2000-2019
It is worth keeping all of this in comparative perspective, the UK remains very wealthy compared with most of the world. According to the World Bank, in 2021 the UK's GDP per capita (in current US dollars, taking purchasing power into account) was just over $50,000 compared with a world average of $18,800.
GDP per capita in the UK is only marginally higher now than in 2007
Over the last 15 years, other advanced economies have overtaken us
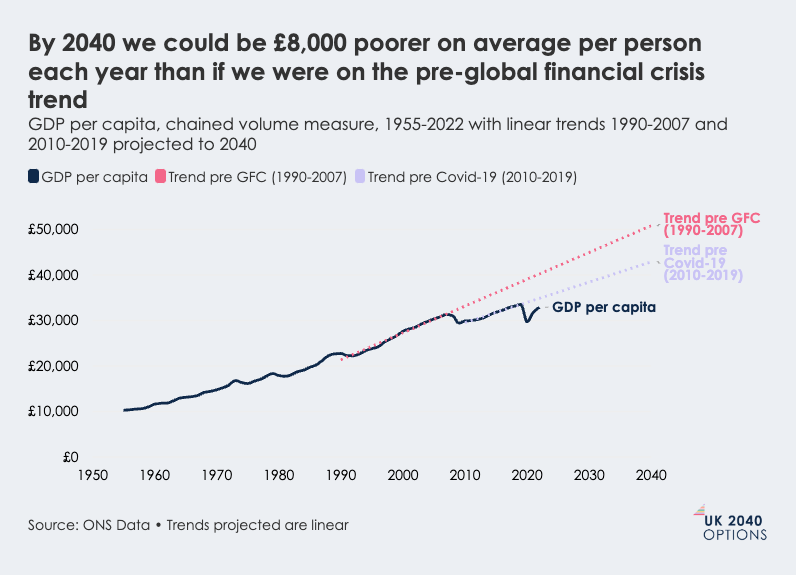
In the latest data from 2022, UK GDP per capita was £32,904, just 5% higher than in 2007. The growth trend in GDP per capita growth before the GFC has been significantly knocked off track since 2008. GDP per capita now is about £7,000 per person less than if the pre-GFC trend had continued.
By 2040 we could be £8,000 poorer on average per person each year than if we were on the pre-global financial crisis trend
GDP per capita, chained volume measure, 1955-2022 with linear trends 1990-2007 and 2010-2019 projected to 2040
Between 2000-2007, on average, the UK had GDP per capita almost exactly the same as Germany and 25% lower than the USA. In 2021 the UK's GDP per capita was 13% lower than Germany and 27% lower than the USA.
On average, people in the UK are now £5,800 worse off than in Germany each year, and £14,400 worse off each year than in the USA
GDP per capita, PPP, current US$ in UK, USA and Germany, 1990-2021
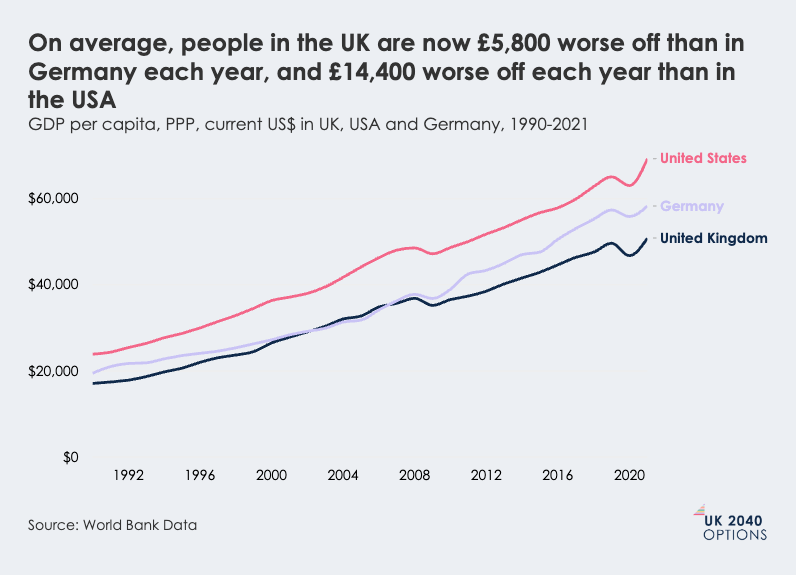
What this practically means is that taking into account purchasing power of income in each country - how much your money can buy in each country - on average, people in the UK are now £5,800 worse off than in Germany each year, and £14,400 on average worse off each year than in the USA.
Inflation is at its highest point in 35 years and public concern about the UK economy is at its highest point since 2012
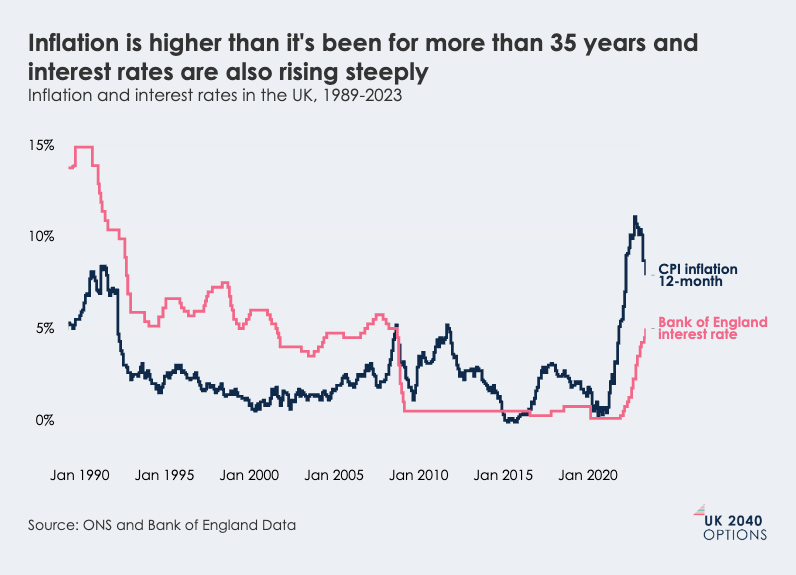
There is no shortage of discussion about inflation - over the last year or so inflation has increased significantly. It is now higher than it's been in more than 35 years in the UK, and interest rates set by the Bank of England are increasing significantly in an attempt to reduce it.
Inflation is higher than it's been for more than 35 years and interest rates are also rising steeply
Inflation and interest rates in the UK, 1989-2023
Monthly polling of the issues that people think are most important in the country' found that in the last six months of 2022 and the first three months of 2023, concerns about the economy and inflation were higher than they have been since 2012.
Concern about the UK economy is at its highest point since 2012
Average % of people identifying the economy or inflation as one of the most important issues
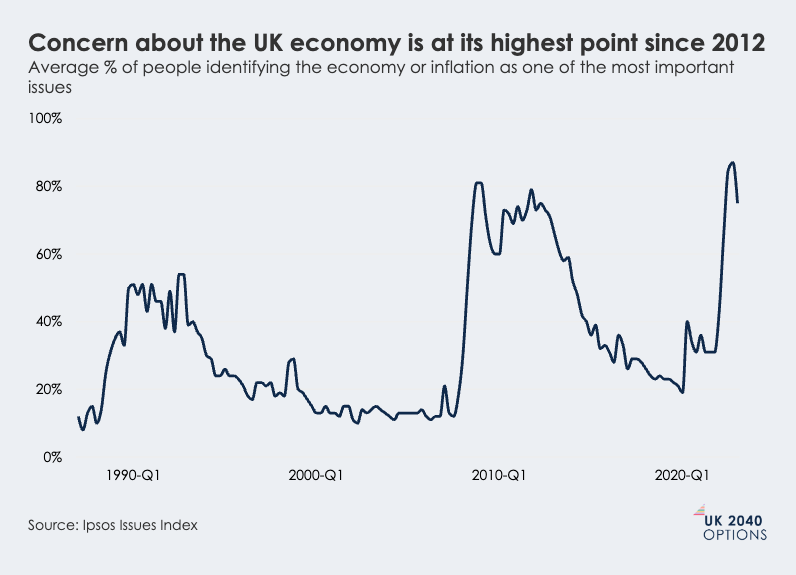
This concern is at levels comparable to during the global financial crisis. However, when we exclude concern about inflation, and look at economic performance alone, public concern about the economy is at about half the level it was during the global financial crisis. This shows that public concern about the economy at the moment is very much driven by the pressures households are feeling due to inflation.
Productivity growth has stalled since the global financial crisis
Productivity has grown 0.4% per year since the global financial crisis, compared with 1.9% per year before. Our productivity is still reasonable compared to other similar countries but falling far behind the most productive countries
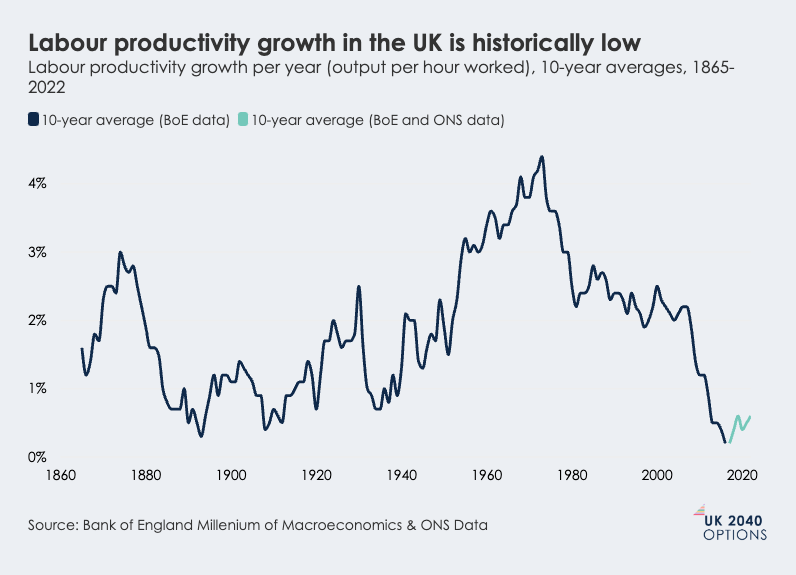
In the UK, our productivity - how efficient an economy, country or individual person or machine is at producing things of economic value - has dropped off significantly since 2009. In the period 1970-2007, the average rate of productivity growth was 1.9% per year, since 2009, the growth rate has been 0.4% per year.
Productivity growth in the last 15 years has been 0.4% per year on average, prior to this it was 2% per year on average
Labour productivity growth per year, measured in output per hour
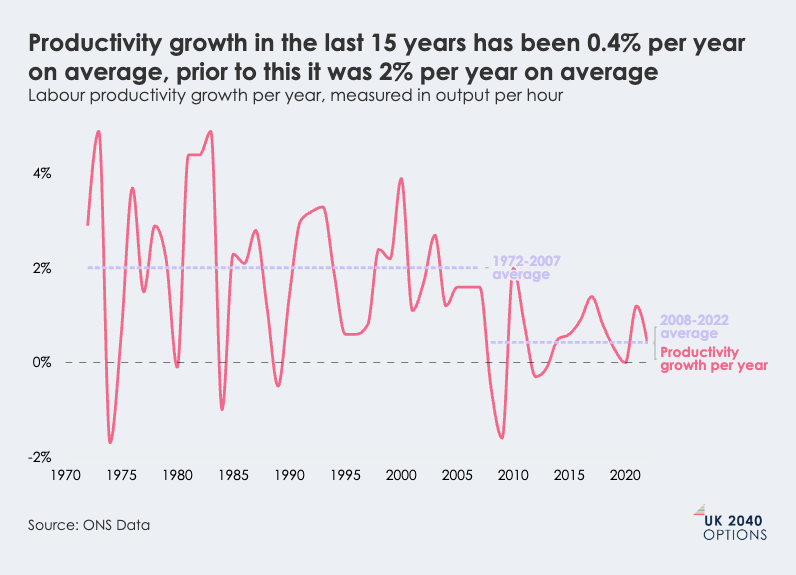
In recent years, productivity has almost flatlined. This is a significant deviation from the post-war trend. While this trend is especially stark in the UK, productivity growth has slowed in most advanced economies recently.
Labour productivity growth in the UK is historically low
Labour productivity growth per year (output per hour worked), 10-year averages, 1865-2022
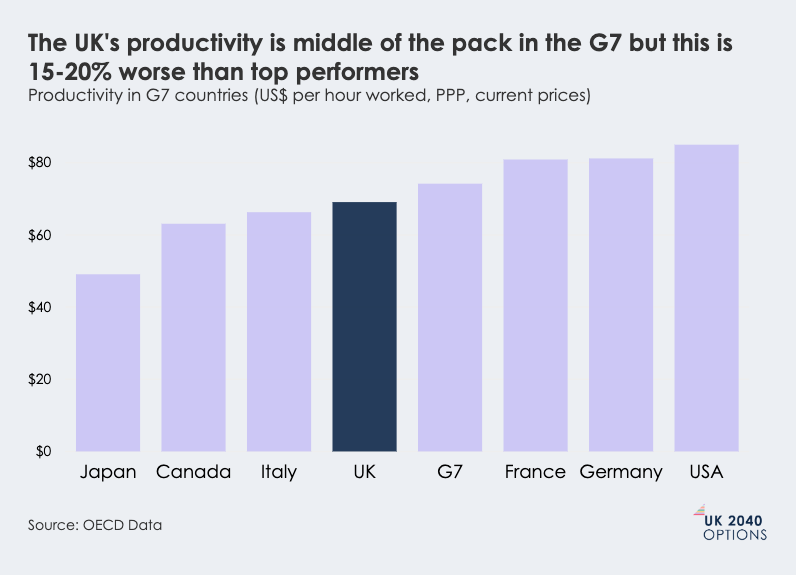
Compared to other G7 countries, our productivity is around the average. But it is around 15-20% lower than high performers like Germany and the USA.
The UK's productivity is middle of the pack in the G7 but this is 15-20% worse than top performers
Productivity in G7 countries (US$ per hour worked, PPP, current prices)
In terms of sectoral drivers of weaker productivity, work from The Productivity Institute (TPI) has pointed towards specific sectors such as transport equipment, pharmaceuticals, computer software and telecommunications. These are advanced, high value-added sectors, and according to the TPI authors: “It is striking that the productivity slowdown is greatest in some of the most technologically-advanced industries”. Part of the explanation, according to TPI, may be due to technical aspects of how deflators are constructed when there are large relative price shifts alongside rapid technological change in these goods in a modern economy.
Regional productivity across the UK is highly unequal
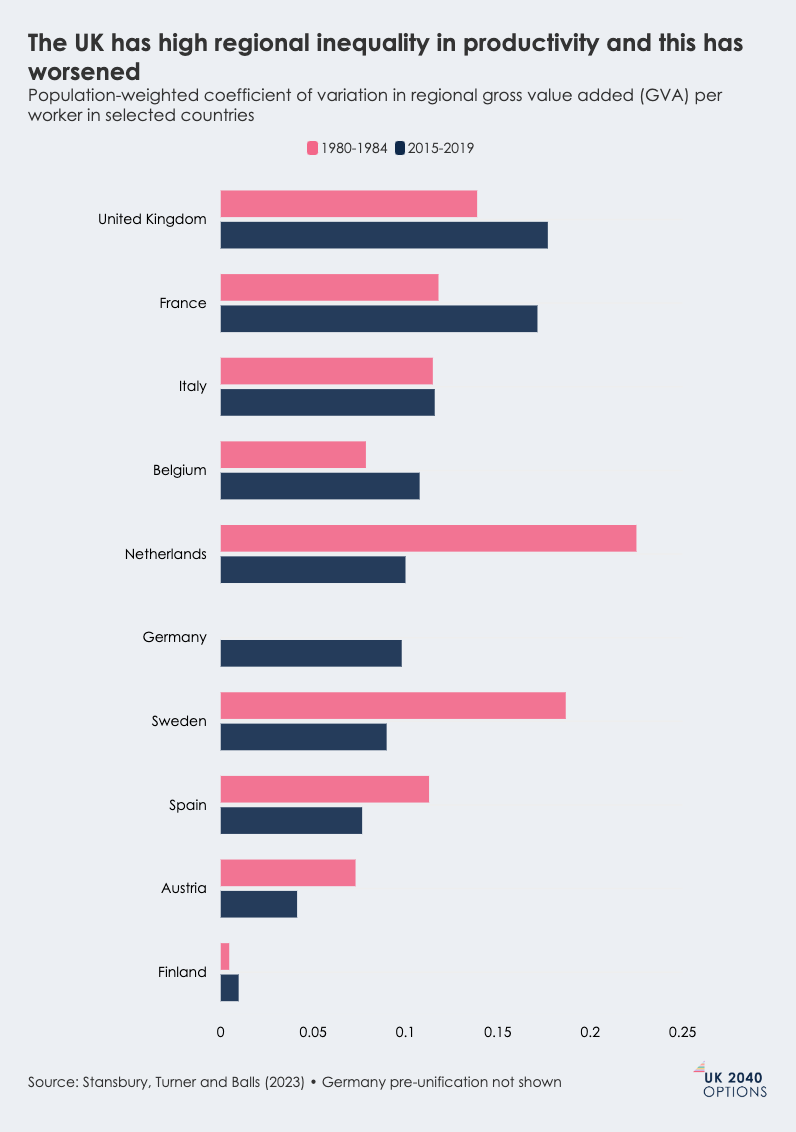
The UK has high levels of regional inequality when it comes to productivity and this has worsened over the last 45 years
When it comes to productivity, there is higher regional economic inequality in the UK than most comparable countries. This has worsened in the last 45 years both in terms of our ranking compared with other countries and overall regional inequality.
The UK has high regional inequality in productivity and this has worsened
Population-weighted coefficient of variation in regional gross value added (GVA) per worker in selected countries
It has been estimated that uplifting the lowest performing regions in terms of productivity (measured in gross value added (GVA) per hour worked) to the UK average (in 2019) could add £40-50 billion to GDP per year. This is approximately 2% of GDP or about two thirds of our annual education expenditure.
While we have high regional inequality in the UK, we are similar to France which has much higher productivity overall.
The UK's economy is largely a services economy
Services are dominant in our economy and our exports are highly reliant on services. This may be contributing towards productivity slowdown
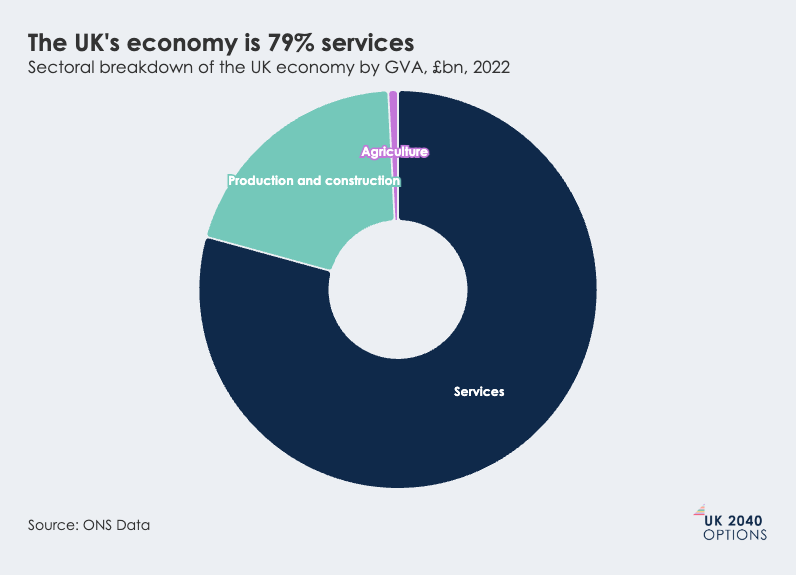
The UK's economy is largely a services economy. These services include retail, hospitality, professional services, business administration and finance. In 2022, services made up £1.9 trillion in GVA in the UK economy, that is 79% of total UK GVA.
The UK's economy is 79% services
Sectoral breakdown of the UK economy by GVA, £bn, 2022
Unsurprisingly, given this economic structure, the UK's exports are also dominated by services, which account for nearly half of UK exports. This is twice the OECD average.
UK exports are dominated by services, which account for nearly half of UK exports - this is twice the OECD average
Service exports as a % of GDP
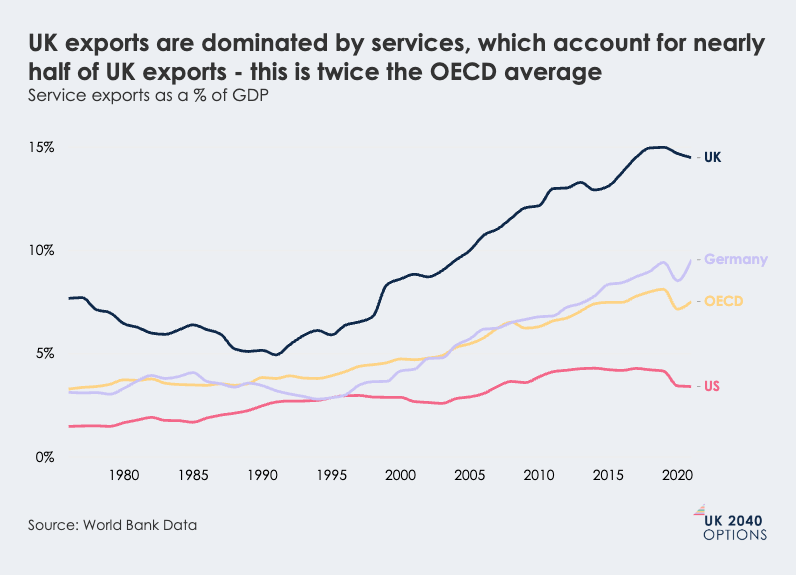
It's worth noting that the reliance of the UK on high-value services could be contributing to lacklustre productivity in the UK (and other developed countries). These kinds of services are heavily reliant on business-to-business (B2B) sales, where productivity is measured solely by price as there is no physical output. In a situation in which these high value services are growing less in price ie. that type of economic output is suffering worse in terms of trade - then productivity in that type of economy will mechanically grow more slowly.
The UK has historically high employment
Unemployment is very low in the UK but our labour force also has high levels of people out of work due to poor health
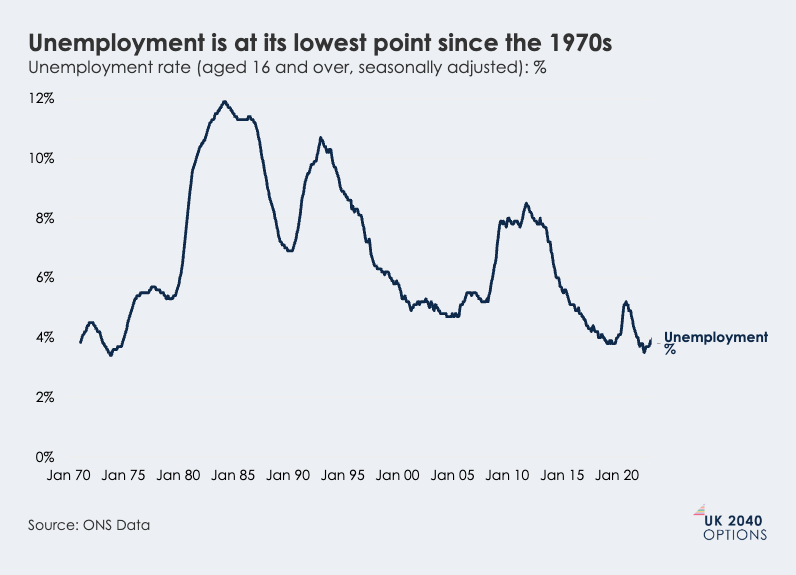
Employment in the UK is at historically high levels with 33 million people employed and just 3.9% unemployment. More people in work brings various economic and social benefits from higher income to better health.
As of May 2023, 33 million people are employed in the UK, this includes 75.9% of those aged 16-64. Unemployment sits at 3.9%, which is historically low.
Unemployment is at its lowest point since the 1970s
Unemployment rate (aged 16 and over, seasonally adjusted): %
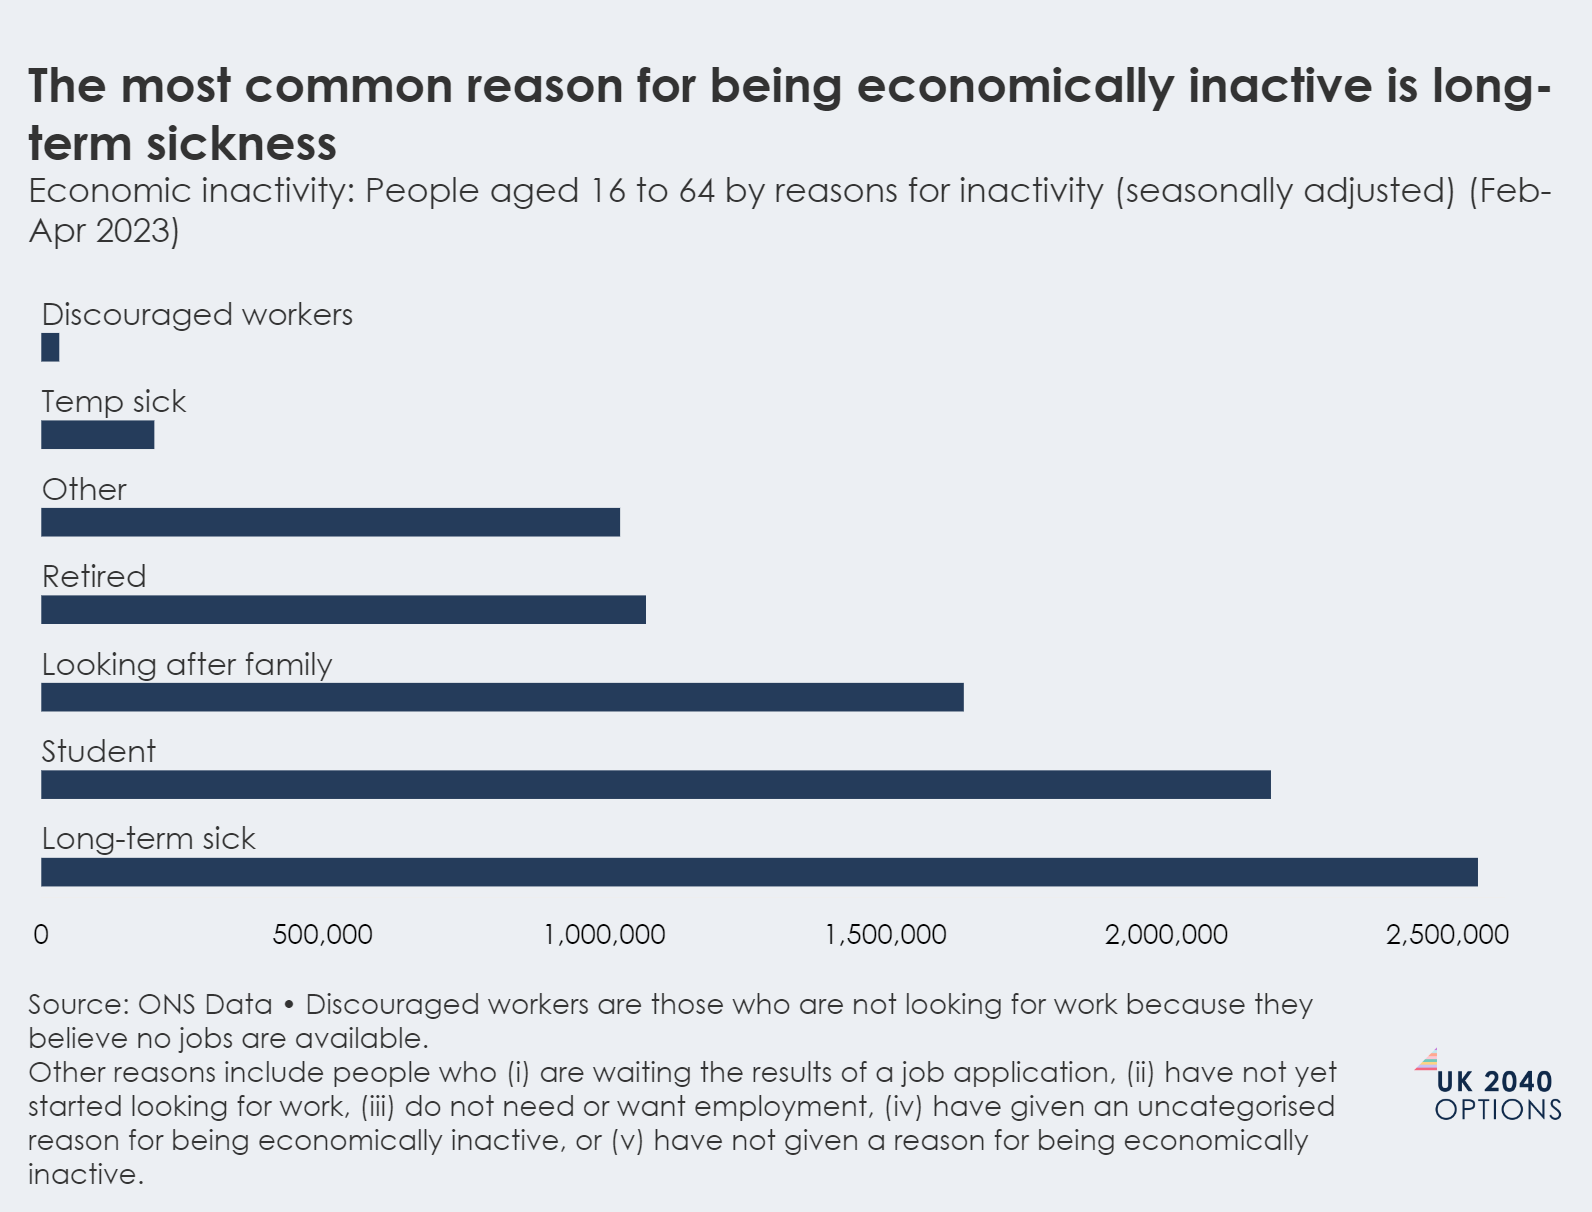
High employment, though, can mask a range of vulnerabilities, with economic inactivity on the rise for a variety of reasons including long-term sickness and with these people not generally counted as unemployed. Rates of economic inactivity (those neither employed nor unemployed ie. people not looking or able to take up a job like students or those who are long-term sick) have been growing since Covid-19. 8.7 million people of working age are economically inactive, which includes 21% of those aged 16-64. While this is lower than in periods before 2015, the number and proportion of people who are economically inactive has grown since Covid-19.
The most common reason for being economically inactive is long-term sickness
Economic inactivity: People aged 16 to 64 by reasons for inactivity (seasonally adjusted) (Feb-Apr 2023)
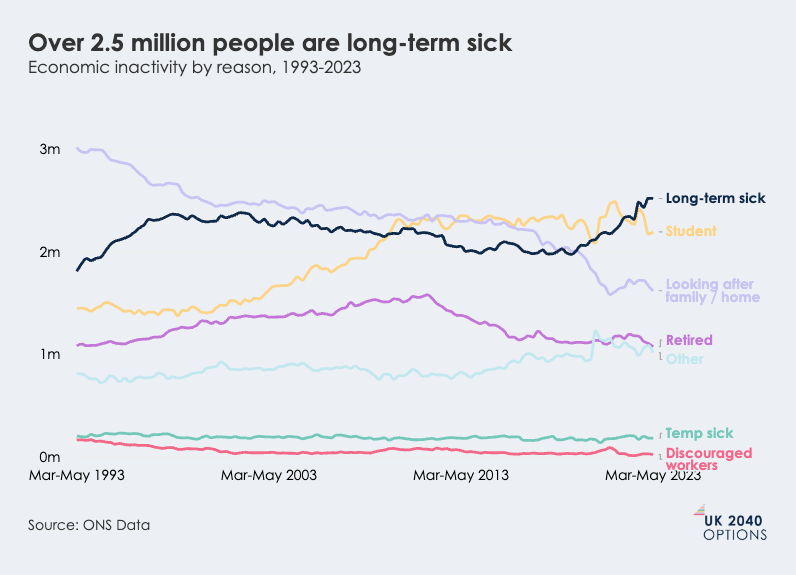
There has been a recent increase in the number of people who are long-term sick, a trend which started before Covid-19. Rising from just under 2 million people long-term sick in April 2019 to more than 2.5 million now - a jump of nearly 30% in just three years.
Over 2.5 million people are long-term sick
Economic inactivity by reason, 1993-2023
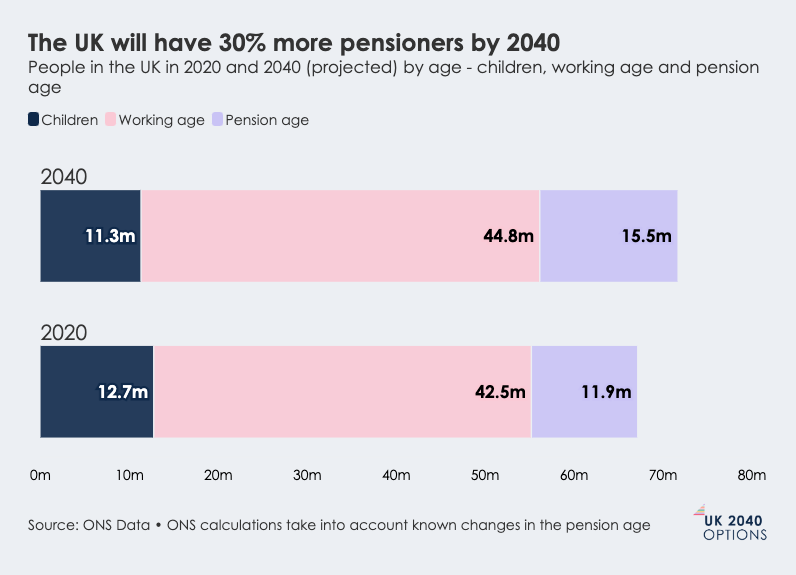
According to projections from the ONS, by 2040 the UK's labour force will be 5.6% larger than now, at around 44.8 million but the number of people of pension age will be 30% larger than now at around 15.5 million people. We will also have 11% fewer children.
The UK will have 30% more pensioners by 2040
People in the UK in 2020 and 2040 (projected) by age - children, working age and pension age
Real wages have stagnated
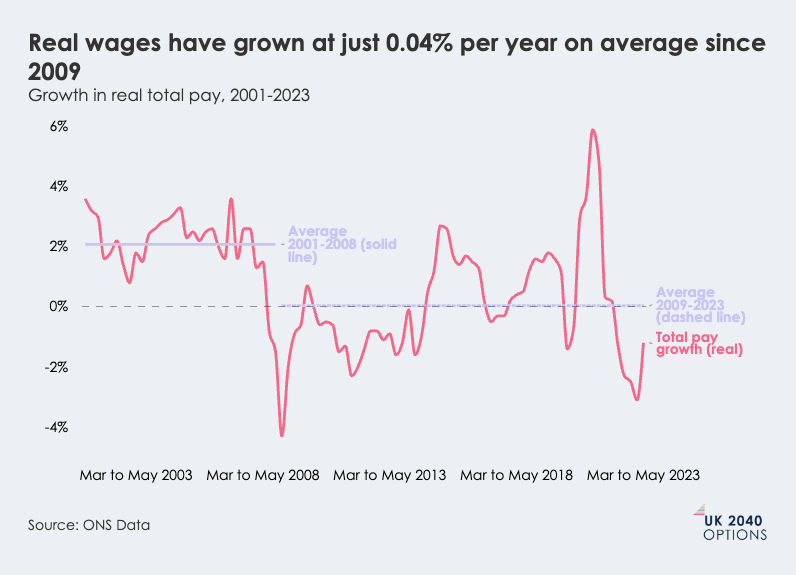
When taking inflation into account, wages have hardly grown since 2009
While unemployment is at a historic low, real wages (what people are paid when inflation is taken into account) has stagnated since 2009. Between 2001-2008 real wages grew an average of 2.17% per year meaning people were, on average, receiving 2.17% higher income taking rising costs into account. Between 2009-2023 they grew 0.04% per year on average, meaning that people's incomes, on average, when taking costs into account have hardly grown at all for the last 13 years.
Real wages have grown at just 0.04% per year on average since 2009
Growth in real total pay, 2001-2023
As highlighted by historian Adam Tooze: “Throughout the period between World War II and 2007, for all the back and forth about decline, real household disposable income in the UK grew relentlessly on a logarithmic curve. Since 2007 that is no longer the case."
Investment in the UK is a lot lower than other comparative countries
We invest about 4% less of our GDP than comparator countries
Investment - an increase in capital such as physical or human capital ie, in the form of machinery or skills - in the UK is low compared with comparative nations. There hasn't been a year since 1990 where UK investment as a percentage of GDP was above the average of the USA and Germany.
The UK has a £100+ billion investment gap compared to Germany and the USA
Investment (gross fixed capital formation) as a percentage of GDP, 1960-2019
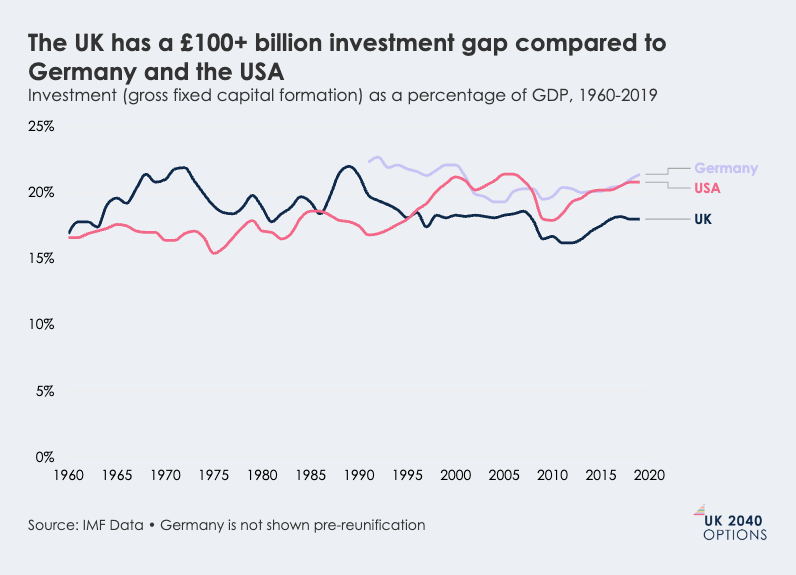
Now our gap is equivalent to £100 billion+ less investment per year in the UK than if our investment was the same percentage of GDP as either Germany or the USA - this is approximately what we spend on education and defence combined. Since 2008, this means an investment gap proportional to our GDP of £1 trillion or a total of nearly £16,000 per person in the UK.
Part of the problem may be in how UK pensions are invested - it's been estimated by the Tony Blair Institute that overseas pensions invest 16 times more in venture capital and private equity in the UK than domestic public and private pensions do.
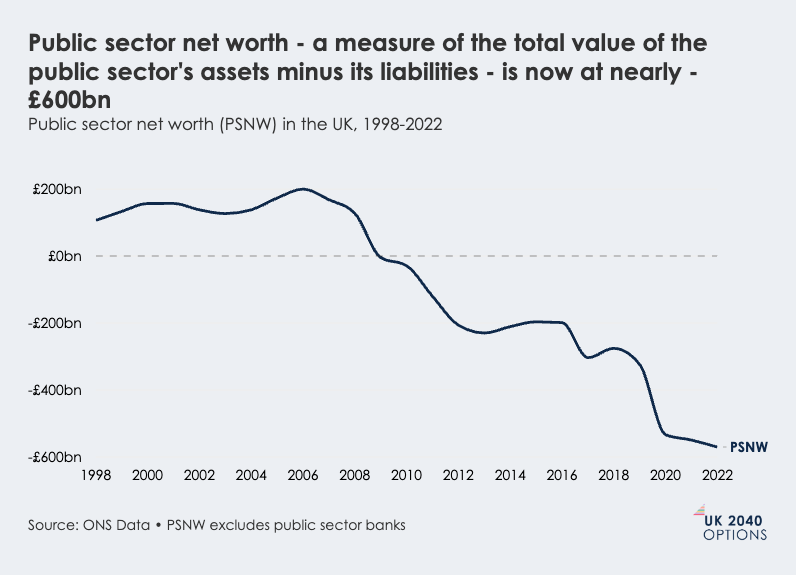
Investment from both the private sector and the public sector has been low. In the public sector this can be seen in the decline in public sector net worth (PSNW). Politicians often talk about net debt but PSNW measures both the government's assets (generally arising from investments) and its liabilities (usually from debt). This helps to give a more complete picture of the overall public finances - both the assets and the liabilities.
Public sector net worth - a measure of the total value of the public sector's assets minus its liabilities - is now at nearly -£600bn
Public sector net worth (PSNW) in the UK, 1998-2022
Housing availability in the UK is low and transport investment is skewed towards London
The UK has less housing per person than many other comparable European countries and transport investment is not widely spread across the UK.
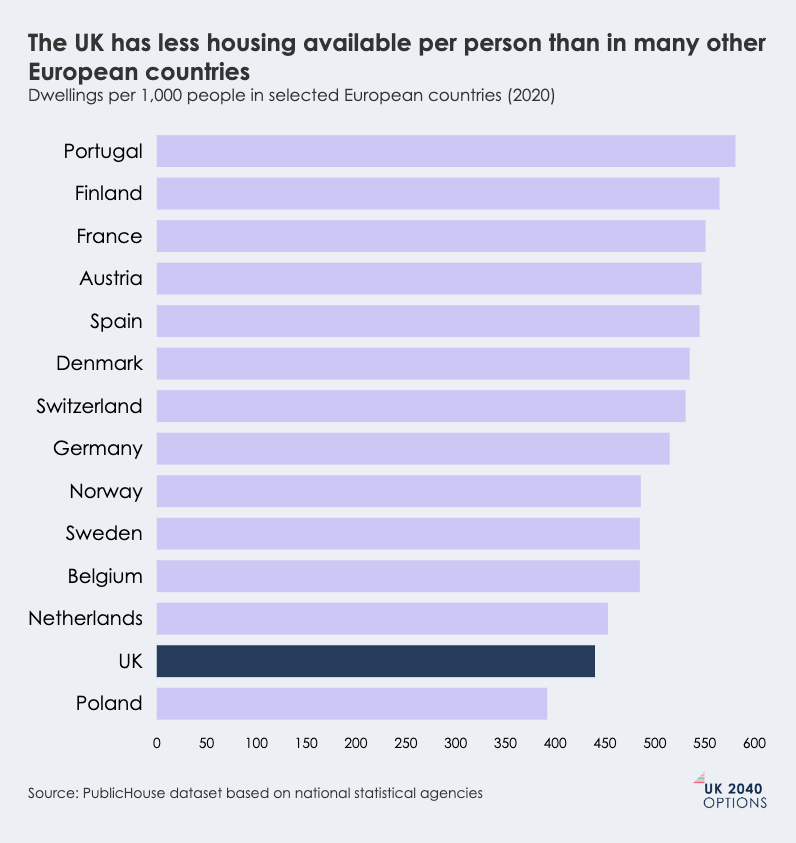
Availability of housing and transport is important for a productive economy and for people's wellbeing. The UK's housing problems are widely discussed. Using international comparative data we can see that the UK has less housing per person than many other European countries. There are 20% fewer dwellings per person than France and 14% fewer than in Germany. Among those European countries with data available, only Poland had fewer dwellings per person.
The UK has less housing available per person than in many other European countries
Dwellings per 1,000 people in selected European countries (2020)
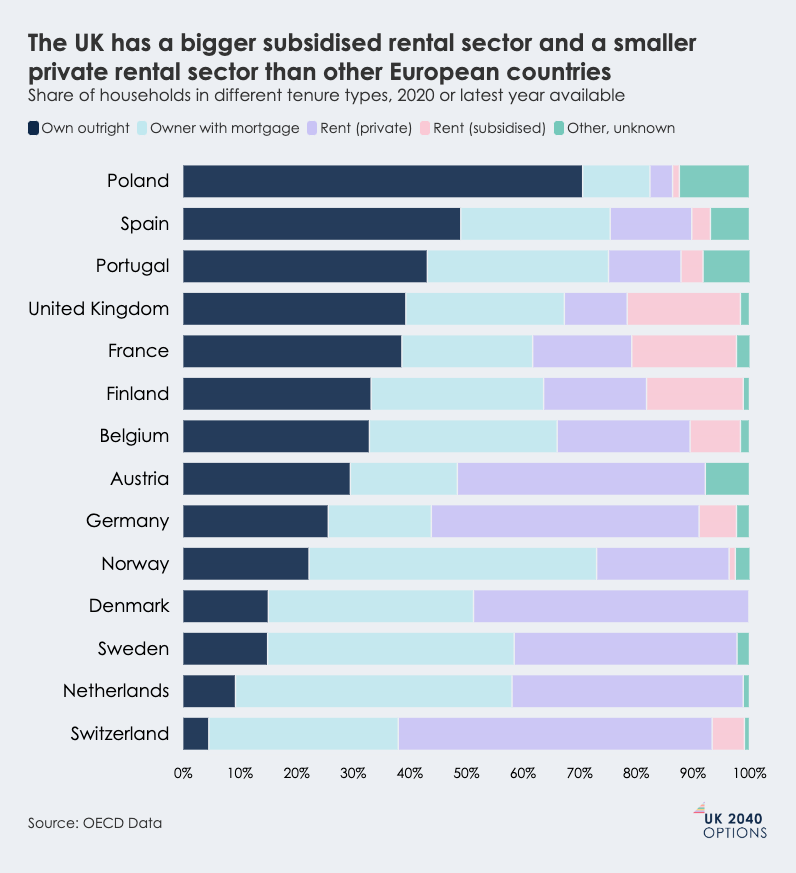
The structure of the UK housing market is also relatively unusual. The UK has a smaller private rented sector than many other comparable countries and a larger social rented sector. The private rented sector in the UK is around 11% of households compared to 18% in France and 47% in Germany. Though it's worth taking into account that there are differences in legislation in the private rented sector in different countries. It's also worth noting that the structure of the housing market can itself influence employment, particularly through influencing labour mobility. Research on this phenomenon suggests that home ownership can constrain employed individuals from regional mobility vs private renters, and also that social renting may create a constraint on unemployed individuals' regional mobility.
The UK has a bigger subsidised rental sector and a smaller private rental sector than other European countries
Share of households in different tenure types, 2020 or latest year available
In terms of transport, the UK's investment has been relatively low. Road investment has been among the lowest of industrialised economies over the last 30 years. Between 1995 and 2020, academics from Harvard estimate that the UK spent an average of 0.3% of GDP per year on road infrastructure investment compared to 0.4% in Italy, 0.5% in Germany and the USA, and 0.65% in France. By contrast, in recent years the UK has spent one of the highest shares of GDP on rail investment of industrialised economies.
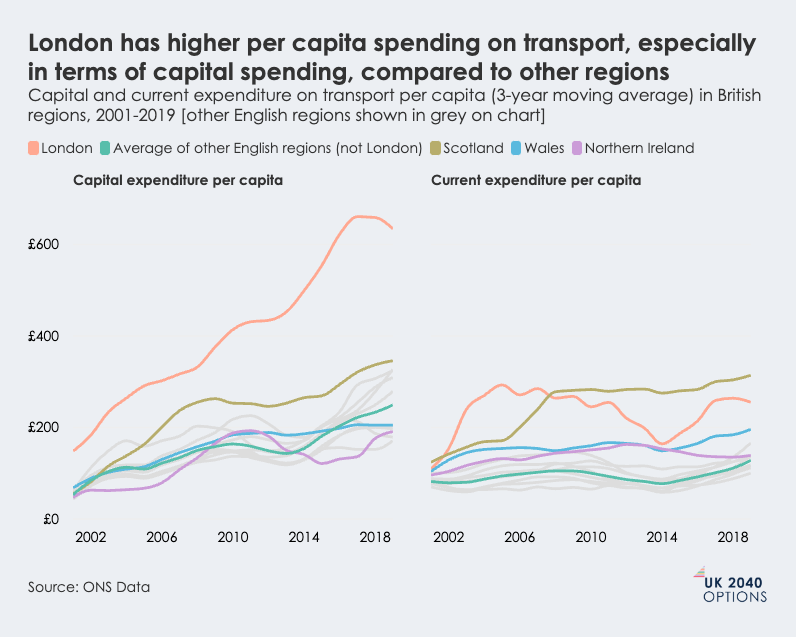
Within the UK, infrastructure spending is tilted towards London. Stansbury, Balls and Turner argue that transport infrastructure constraints within major non-London conurbations is a major contributor to regional economic inequalities in economic performance.
London has higher per capita spending on transport, especially in terms of capital spending, compared to other regions
Capital and current expenditure on transport per capita (3-year moving average) in British regions, 2001-2019 [other English regions shown in grey on chart]
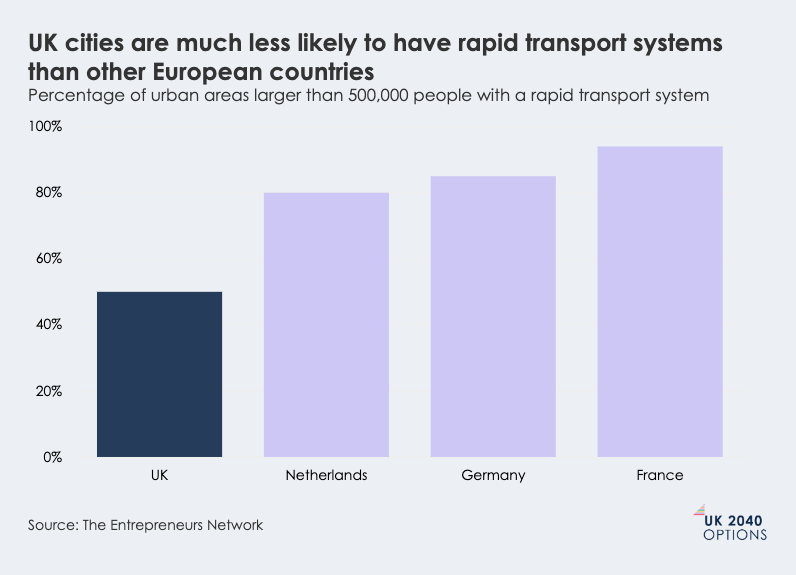
Indeed, analysis published by The Entrepreneurs Network shows that the UK has much lower provision of rapid transport in 2nd tier cities than the comparable countries in Europe.
UK cities are much less likely to have rapid transport systems than other European countries
Percentage of urban areas larger than 500,000 people with a rapid transport system
UK Options 2040 supports policymakers as they make choices about what to prioritise and how to deliver: setting out alternative policy options and pathways for the future, creating space for honest debate about the trade offs and testing and interrogating ideas that take us beyond immediate crises.
58 Victoria Embankment
London EC4Y ODS
+44 (0)20 7438 2500
[email protected]
@nesta_uk
www.nesta.org.uk
Nesta is a registered charity in England and Wales with company number 7706036 and charity number 1144091. Registered as a charity in Scotland number SCO42833. Registered office: 58 Victoria Embankment, London EC4Y ODS.


