About Nesta
We are Nesta, the UK's innovation agency for social good. We design, test and scale solutions to society's biggest problems. Our three missions are to give every child a fair start, help people live healthy lives and create a sustainable future where the economy works for both people and the planet.
For over 20 years, we have worked to support, encourage and inspire innovation. We work in three roles: as an innovation partner working with frontline organisations to design and test new solutions, as a venture builder supporting new and early stage businesses and as a system shaper creating the conditions for innovation. Harnessing the rigour of science and the creativity of design, we work relentlessly to change millions of lives for the better.
Find out more at nesta.org.uk
About Centre for Net Zero
Centre for Net Zero (CNZ) is an impact-driven research unit founded by the global tech disruptor, Octopus Energy. We deliver pioneering research to make the future energy system a reality.
Our access to tens of billions of customer data points gives us an unparalleled insight into the behaviours of people and businesses around the world. We combine analysis of this dataset with field trials and experimentation, to build models and centre intelligent demand into the design of the changing energy system.
We work directly with governments, policy-makers, grid operators and academics, translating our research and analysis into real-world action.
Find out more at centrefornetzero.org
Thanks and acknowledgements
The HeatFlex UK project team would like to thank all the pilot participants and members of their households who trusted us to take control of their heating systems, provided feedback throughout the trial and in many cases went above and beyond to provide detailed information and data on their home heating systems. We would also like to thank the people who tried to join the trial but were unable to. Despite the resulting disappointment, we still gained useful insights from trying to involve these households in the pilot.
We would also like to thank the Octopus Energy Services team for installing the smart thermostats in participants' homes. The R&D team at Octopus Energy for all the support with the app and help throughout the pilot. Dr Jenny Crawley, Dr Mike Fell and Prof David Shipworth from University College London (UCL), Tom Lowe from Thermal Storage UK and Jessica Colleen and Marcia Poletti from Octopus Energy for their contributions before, during and after the pilot.
Authors and project contributors
Nesta - Oli Berry, Davinia Kiley, Katy King, Andy Marsden, Andy Regan, Max Woollard
Centre for Net Zero - Maria Jacob, Ryan Jenkinson, Daniel Lopez Garcia, Lucy Yu, Andrew Schein
Octopus Energy - Phil Steele
If you'd like this publication in an alternative format such as Braille or large print please contact us at [email protected]
1. Introduction
As we move to a fully electrified energy system, it is well understood by policymakers, regulators and businesses across the energy sector that using energy more flexibly will be necessary to manage the grid.
Flexible energy use will enable faster penetration of renewable energy generation. In the long term, system operators will increasingly procure demand-side response as an alternative to increasing fossil fuel generation during peak times. Individual consumers will play a critical role by changing how and when they use electricity, resulting in 'intelligent demand'.
In the short to medium term, the two biggest sources of consumption from households are likely to be from electric vehicles and heat pumps. Improving our understanding of the potential to use these technologies flexibly is key to the design of the changing energy system.
Ofgem, the GB energy regulator, defines flexibility as "modifying generation and/or consumption patterns in reaction to an external signal (such as a change in price) to provide a service within the energy system".
Current understandings of what flexibility looks like in practice are limited. Many of the assumptions about heat pump flexibility are currently based on modelling, and on assumed consumer behaviour. There is a need for real-world trials to answer key questions about flexibility potential.
- How much demand can we reduce and shift?
- What control and third party automation strategies are more or less acceptable to consumers?
- How well can we understand consumers' underlying preferences and behaviours, so we can best tailor products and services to them?
There are two common assumptions in the energy industry.
First, that the optimal approach for most consumers will be third party automation, rather than manual turndown consumers won't need to turn down their heat pumps themselves, this will be done remotely for them.
Second, that pre-heating homes – heating them earlier in the day, so that they are warm for the evening – will be an important way to increase acceptability by keeping occupants comfortable during turndown windows (times when electricity demand from heat pumps is reduced at peak periods). Pre-heating in particular forms an important part of models for decarbonisation pathways from both the Climate Change Committee and the Department for Energy Security and Net Zero.
Centre for Net Zero and Nesta have partnered on HeatFlex UK, a project to pilot and then develop a trial to investigate heat pump flexibility, consumer preferences and how these are affected by third party automation and pre-heating.
This report summarises a small scale pilot we used to test and refine our HeatFlex intervention. We present findings and provisional conclusions from our pilot, but with the strong caveat that our sample size was too small to support generalisable conclusions. We intend to run a larger trial in winter 2023-2024 which should deliver more robust results.
HeatFlex UK uses a mixed methods approach, incorporating data science, behavioural science and design-led user engagement methods to understand what influences the flexibility potential of heat pumps in homes.
1.1 Executive summary
Overview
Our live pilot took place between February and April 2023. In this pilot, the heating of 12 Octopus Energy customers was remotely controlled during events (which they were notified of in advance). They were given a smart thermostat linked to the Octopus Energy R&D app, which allowed us to remotely control their temperature setpoints, often referred to as indirect load control.
The intervention
We asked participants to provide information about their thermal comfort zones (how hot or cold they were willing to have their thermostat set to at different times of the day) before we started the pilot. We used information they gave us on their preferences to personalise the intervention. A HeatFlex event was defined as a period where we automatically modified smart thermostat setpoints using the R&D app. The events consisted of two different windows, each lasting two hours.
- Pre-heating window: we changed the customer's smart thermostat setpoint to the maximum acceptable temperature.
- Flexibility window: we changed the customer's smart thermostat to the minimum acceptable temperature.
HeatFlex simulates what we informally call event-based flexibility – where system operators might provide a signal to households to reduce electricity consumption during a specific and discrete period of time (a flexibility event). In this vein, we notified participants 24 hours in advance of an event. During this time, they could opt out.
We encouraged participants to opt out if they knew no one would be at home during the event, as we did not want to unnecessarily pre-heat their properties.
During the two windows, participants could modify the setpoints if they felt uncomfortable. We sent surveys after each event to understand participants' experience throughout the pilot. We also conducted online interviews with participants to further understand their experience of the intervention.
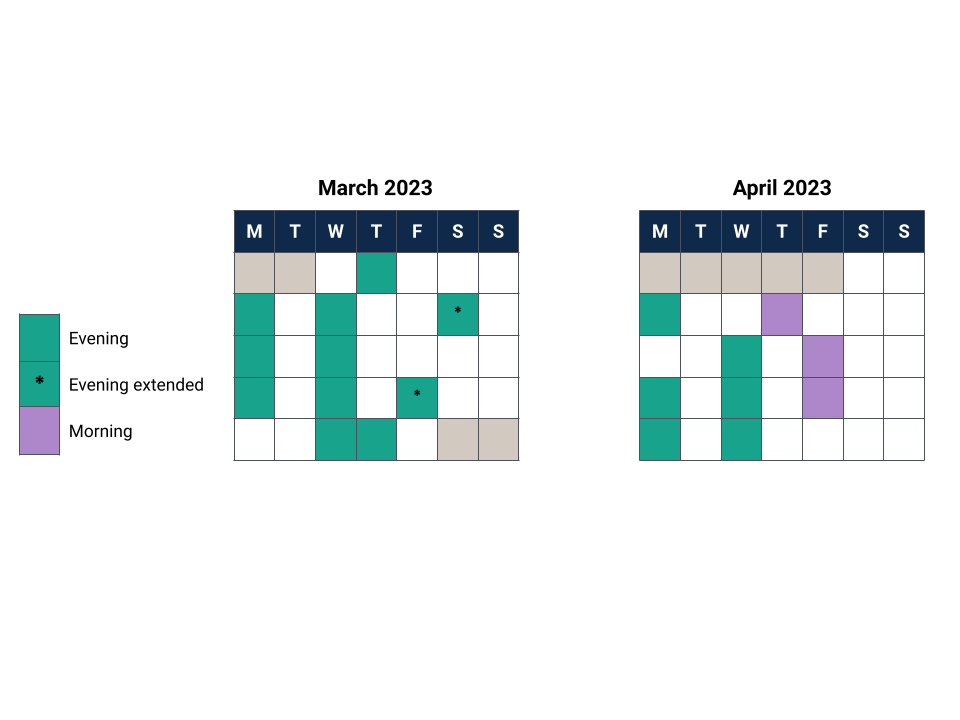
The 12 HeatFlex UK participants were exposed to a total of 20 events, most of them held during the evening peak period, from 16:00 to 20:00. However, some events were extended to a three-hour pre-heating window and another three-hour flexibility window. Additionally, we also tested some morning events during March, from 5:00 to 9:00.
Figure 1. Schedule of when we implemented our events during 2023
1.2 Research aims
The HeatFlex UK project explored three topics.
A) Flexibility potential
- How much demand reduction can we harness from heat pumps used as a flexibility asset?
- Can heat pump demand be flexed whilst maintaining participant thermal comfort and satisfaction?
- How does flexibility potential vary for different characteristics, such as housing fabric?
B) Acceptance of third party automation
- Are participants happy to allow remote control of their heat pumps via a smart thermostat?
- Does this vary for different customer segments on different days or at different times of day?
- How can technology facilitate or hinder acceptance of third party automation?
C) Participant thermal comfort
- Are participants happy for their homes to be hotter or colder than their stated comfort preferences to provide demand flexibility?
- How might participants change their behaviour in response to our intervention?
- How does thermal comfort differ between participants?
- What role does pre-heating play in thermal comfort?
1.3 Key findings
Flexibility potential
- We found indicative evidence that we were able to move electricity consumption to different points in the day.
- We did not find evidence that days with HeatFlex events had different total electricity consumption to days without an event.
- Differences in participants' arrangements of their home may have affected the magnitude of demand reduction.
- Interoperability issues prevented some individuals from participating in our pilot, and may have made it harder for those who could participate to reduce their demand.
Acceptance of third party automation
- Nine out of ten participants reported that the automation of their heating was acceptable.
- There were eleven instances where participants opted out during events - mostly due to being too cold. This does not suggest the automation itself was driving opt-out.
- Some participants made changes to their heating system to improve their thermal comfort during events - such as increasing their flow temperatures to increase the rate of heating during pre-heating windows.
- We found no evidence of detrimental impacts to hot water use during the pilot.
- Participants were less accepting of morning events than afternoon events.
Participant thermal comfort
- Participants' self-reported comfort ranges differed drastically in some cases, with a maximum range of 10°C and a minimum range of 2°C.
- The majority of temperatures that participants self-reported at the end of the pre-heating window were greater than their normal setpoints – suggesting broadly that pre-heating ‘worked'.
- Temperatures generally decreased during the flexibility window by 0.3°C on average from start to end.
- Participants generally reported that their thermal comfort did not change between the start and the end of the flexibility window.
- Some participants changed behaviour to maintain thermal comfort, such as wearing additional clothing or using additional heating sources such as a log burner.
- Primary participants didn't think their experience of the events differed from other household occupants (such as their partner).
- The thermal comfort ratings provided by participants during events did not correlate closely with whether they described temperatures as hot or cold.
1.4 Summary of pilot methodology
In September 2022, CNZ and Nesta started to explore the potential for heat pumps to be used for electricity demand flexibility. We conducted a literature review to explore the current consensus and approach taken by previous studies.
We then designed an intervention that could be used to remotely automate the operation of a heat pump, shifting demand away from typical peak periods of electricity demand.
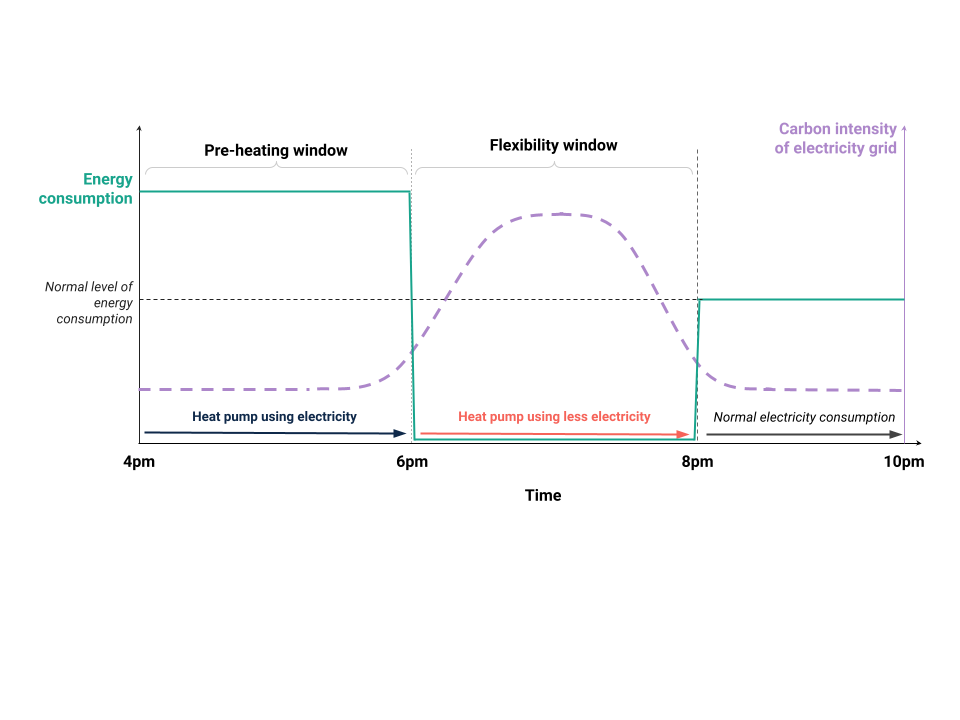
This intervention consisted of a pre-heating window and a flexibility window, each usually lasting two hours. At the beginning of the pre-heating window, the smart thermostat would call for heat from the heat pump in an attempt to reach a predefined maximum acceptable temperature for each household. In the flexibility window, the smart thermostat would then change the setpoint to the minimum acceptable temperature. What we would then expect to happen is that the heat pump stops heating the home until the temperature drops below this setpoint. So electricity demand will reduce, and the temperature may also drop.
participant's home as a prompt. After the events were complete we sent all participants a final survey asking about their experience of the pilot as a whole. The interviews, surveys, opt-out data and emails from participants informed our provisional conclusions about the overall acceptability of the intervention.
The methodology is set out in more detail in section four.
Figure 2. Schematic of our intervention, displaying energy consumption of the heat pump across time
We included pre-heating in our intervention because it forms an important assumption in models of net-zero pathways used by the Climate Change Committee and Department for Energy and Net Zero amongst others. HeatFlex UK aims to understand the extent to which pre-heating does or does not contribute to the overall potential of event style demand flexibility.
We understood that actual implementation of such an intervention would be unlikely to be as straightforward as it appeared on paper. So we conducted a pilot to test our intervention in a real-world setting, assess the effectiveness of our data collection, and highlight any issues with recruitment and implementation prior to the larger scale trial.
We conducted two short test events in early February. The first full-scale event then took place on 2 March 2023. The full-scale events consisted of 2-3 hours of pre-heating followed by 2-3 hours of the flexibility window.
Participants were opted into events by default, but were notified of each event 24 hours in advance, and given the opportunity to opt out. They were then sent a feedback survey after each event. In total we conducted 20 events, averaging 2-3 per week with the final event taking place on the 26 April 2023.
We analysed smart-meter data and temperature data from the smart thermostat to assess whether the intervention had resulted in demand reduction from the heat pumps, whilst achieving the temperatures we were aiming for.
During the live phase we conducted five interviews with five of the pilot participants. These interviews included a structured discussion using a floor plan of the participant's home as a prompt. After the events were complete we sent all participants a final survey asking about their experience of the pilot as a whole. The interviews, surveys, opt-out data and emails from participants informed our provisional conclusions about the overall acceptability of the intervention.
The methodology is set out in more detail in section four.
Recruitment
Before the live pilot, we conducted 19 interviews with owners of heat pumps to gain a better understanding of how they used them, their motivations behind their energy use and their feedback on our pilot design. Some of these interviewees joined the pilot as participants, with others recruited from an Octopus Energy customer forum and respondents to Nesta's previous Heat Pump User Survey. These recruitment channels resulted in participants who tended to be more engaged in their energy use, including some who had quite sophisticated bespoke systems consisting of different combinations of batteries, solar panels and thermal storage. In some cases participants had sophisticated control and monitoring systems for all devices in their homes. This often delivered helpful additional insight from custom data monitoring, but contributes to the unrepresentative nature of the pilot sample.
We initially recruited 16 participants to take part in the pilot, with 12 ultimately going on to take part in the events. These dropouts gave us some useful additional insights around technology interoperability and motivational barriers.
At the start of the pilot, we collected demographic information and household characteristics such as EPC band, number of occupants and location. We also sent a second survey to collect each participant's maximum and minimum thermal comfortable temperature – what we call their thermal comfort zone.
2. Findings from the pilot
Caveat on sample
This report summarises a pilot phase of the HeatFlex UK project, involving a small sample of 12 households. The purpose of this pilot was to test the technical aspects of our intervention, refine our research methodology, and gain real-world insight to inform the design of a larger trial.
We therefore present findings as indicative, and for interest only. We believe they raise important questions for others interested in implementing heat flexibility interventions, or in conducting their own research into the topic.
Our aspiration is to conduct a larger scale trial in winter 2023-2024, with a greater and more representative sample of participants, from which we can more confidently draw conclusions and make recommendations.
We will avoid repeating this caveat throughout this report, but we encourage readers to keep it in mind.
In this section, we set out the key provisional findings from our pilot for each of the research areas.
2.1 Flexibility potential
The core purpose of the pilot was to explore whether we could effectively reduce electricity consumption from heat pumps during the flexibility window. In order to maintain participant thermal comfort and acceptance, our approach was to pre-heat homes in the period immediately preceding the flexibility window.
We primarily used smart-meter data to measure how much we were able to shift electricity consumption.
We also interviewed participants about some of the in-home and behavioural factors that might affect the demand reduction their heat pumps could ideally provide as a flexibility asset.
We found indicative evidence that we were able to move electricity consumption to different points in the day
On implementation of the intervention in pilot households, we would expect to see higher than normal electricity consumption during the pre-heating window, and lower than normal electricity consumption during the flexibility window.
We conducted multivariate regression analysis using the half-hourly electricity consumption data from smart meters in the pilot households. Multivariate regression is a statistical approach which predicts the independent effect of measured variables on an outcome of interest. We used this household-level electricity consumption dataset to explore changes in electricity consumption. We found a general trend in the expected direction, though differences were not statistically significant.
Average electricity consumption on weekday evenings (with no HeatFlex events) was 0.46 kWh across the 12 pilot households. We estimate electricity consumption increased by 7% for the pre-heating window and decreased by 18% during the flexibility window. We note that this is a correlational analysis, which means that we cannot make causal claims about the effect of HeatFlex events.
Figure 3. Results from our multivariate regression analysis on the impact of HeatFlex events on electricity consumption, including shoulder periods (n = 26,659)
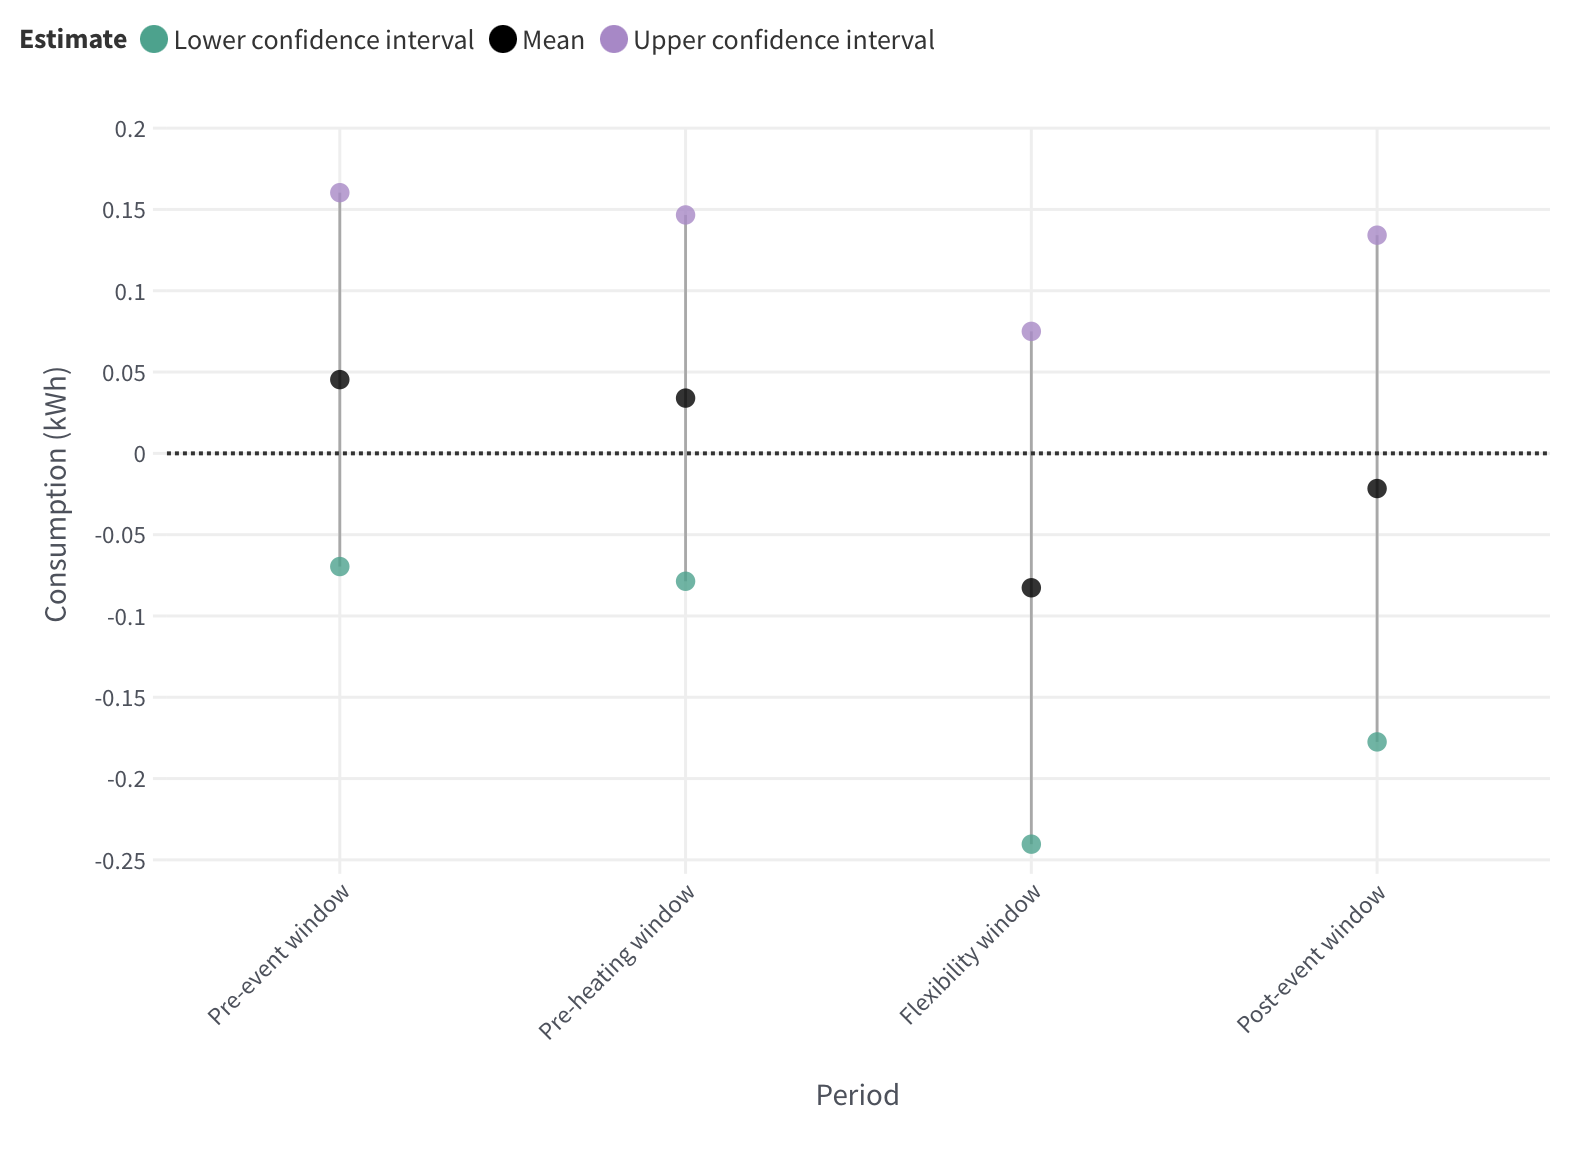
There are a number of factors that contributed to the lack of statistical significance in our estimates:
- Our sample size comprised 12 households across 20 events, meaning that our total sample size was small (and note that not every household participated in each event, further reducing our effective sample size).
- Electricity consumption data has a high amount of variation that is not easily reduced through covariates, especially when analysing small samples. Smart-meter data records electricity consumption from lots of different appliances, not just heat pumps. So an increase in consumption due to use of another appliance may make it harder to distinguish the effect of our intervention from other sources of consumption in a home. Disaggregating heat pump consumption from other household consumption is challenging without device-level monitoring.
Another method to understand the impact of events on electricity consumption is to calculate a baseline-. an estimate of the electricity consumption if there was no HeatFlex event – and compare this baseline to the actual electricity consumption. We did this for our participants using a baselining methodology known as the P376 with in-day adjustment – the same methodology used for National Grid ESO’s Demand Flexibility Service.
This methodology averages consumption during the same half-hour of the day in the 10 most recent similar days immediately preceding an event. However, due to the small sample size and variability in our smart-meter data made, we deemed this approach too unreliable for analysis of our pilot participants' data.
We also found indicative evidence that heat pump customers may be particularly hard to create a baseline for because their consumption is so sensitive to differences in weather in the baseline versus current periods.
We did not find evidence that days with HeatFlex events had different total electricity consumption to those without HeatFlex days
One potential downside of our intervention might be an overall increase in electricity demand. This could be caused by a combination of increased demand during the pre-heating window, and a possible rebound period following the flexibility window. The rebound period is typically caused by lower external temperatures reducing the efficiency of the heat pump during a period where there is a call for heat to raise internal temperatures within a short period of time. Efficiency here would be measured by the heat pump's coefficient of performance - the measure of how much heat is output per unit of electricity input. Varying household demand over time to avoid system peaks may therefore consume more electricity than having the heat pump running continuously and delivering a stable internal temperature.
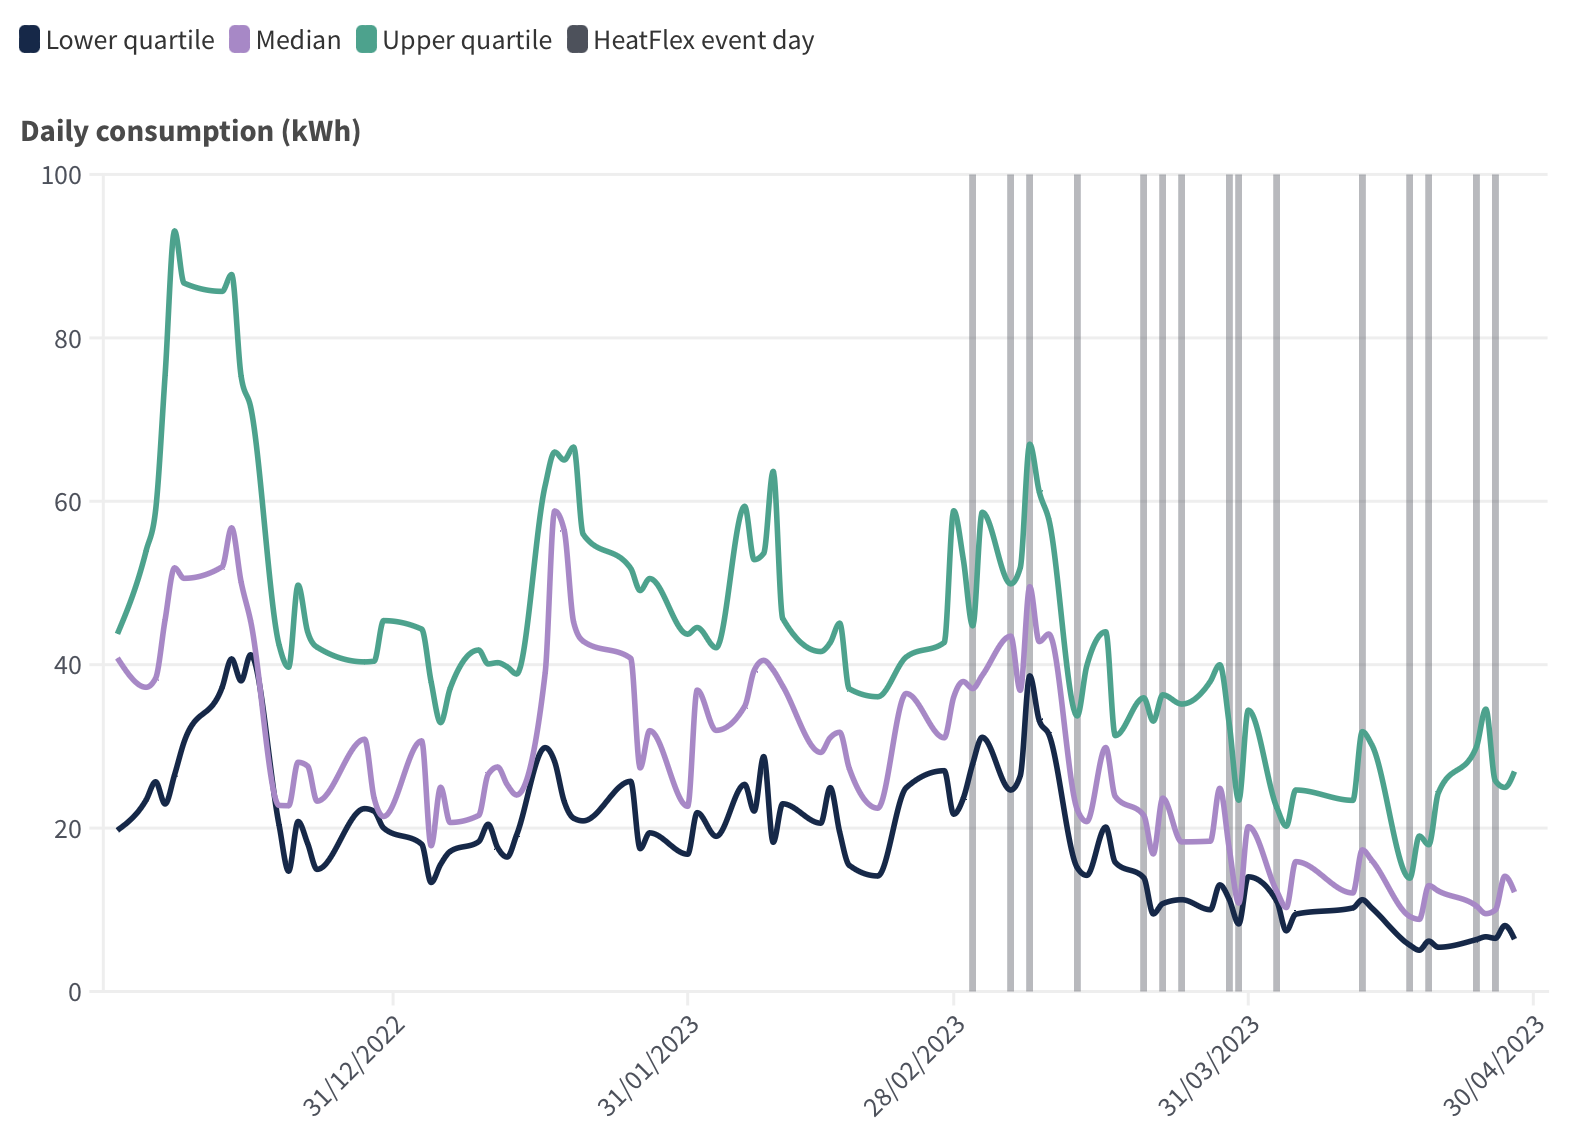
To indicatively assess this trade-off in our pilot, we used a multivariate regression model to estimate the difference in consumption per day (kWh) for days with events and without events. We did not find a statistically significant difference. This indicates that our intervention did not result in higher daily electricity consumption, but again note that this analysis was non-causal and involved the same small sample of pilot participants.
Figure 4. Daily electricity consumption of pilot participants on weekdays (n = 1,043)
Interoperability issues prevented some individuals from participating in our pilot, and may have limited the demand reduction potential for those who participated
Heat pumps and heating controls are designed by different manufacturers, using a range of systems and protocols. Some of these systems and protocols are closed and proprietary, and others are more open and interoperable. A lack of interoperability was initially highlighted during the induction phase, with some participants being unable to take part in the pilot. This was due to the smart thermostat and heat pump being unable to communicate with each other, despite multiple visits from engineers and troubleshooting with manufacturers.
The mid-pilot interviews highlighted further issues around interoperability. Our smart thermostats did not modulate heat pumps' flow temperature or other operating settings. Instead, they could only change the heat pumps' operation by changing setpoints. This resulted in some participants altering other settings, such as the heat pump's weather compensation curve, to achieve the intended effects of our intervention.
Some participants with solar PV and storage had to manually optimise the rest of their energy systems to ensure the most efficient use of their in-home generation and storage in combination with the HeatFlex intervention. In our larger trial it will be interesting to explore how engaged households with sophisticated, customised systems can best optimise their system.
Differences in participants' homes may have contributed to differing flexibility potential
To understand the layout and structure of some of the homes of participants, we asked participants to supply a floor plan detailing the location of windows and doors across all floors. We digitised this floorplan and used it as a prompt for discussion during the mid-pilot interviews. This generated some insights we may not otherwise have gained.
Thermostatic radiator valves (TRVS) may have affected how the HeatFlex intervention worked. During the pilot, only the smart thermostat could ‘call for heat' by which we mean tell the heat pump to provide heat to radiators. A number of the participants had 'smart' TRVs on multiple radiators within their home. In normal operation, any one of these 'smart' TRVs could call for heat individually. However, we asked participants to disable this feature to ensure they did not interfere with the reduced consumption from heat demand we hoped to achieve during the flexibility window.
However, traditional TRVs as well as smart TRVs set in the way we asked participants to set them – may have reduced our ability to pre-heat homes as much as we aimed to. We have seen some evidence from interviews and self-reported temperatures of this happening.
- If a TRV was in the same room as the smart thermostat, and the TRV was set to a temperature lower than the pre-heating window target temperature, the TRV may have prevented the room from ever reaching the required pre-heat temperature by limiting the flow of warm water to the radiator. This would have resulted in the smart thermostat continuing to call for heat from the heat pump even if other areas of the home, without smart TRVs on radiators, had reached or exceeded the pre-heating target.
- Interestingly, we found from participants that sometimes this 'blocking' of pre-heating is desirable. Intentionally overheating prior to a flexibility window is intended to preserve warmth and comfort, but some participants made clear this might not be desirable in all circumstances. For example, a participant noted that "The beauty of TRVs not calling for heat is that the bedroom (radiator) didn't turn on. So the TRV in the bedroom meant that the bedroom didn't over heat. If the house heats up between 5:00-7:00 the warmth would wake me up."
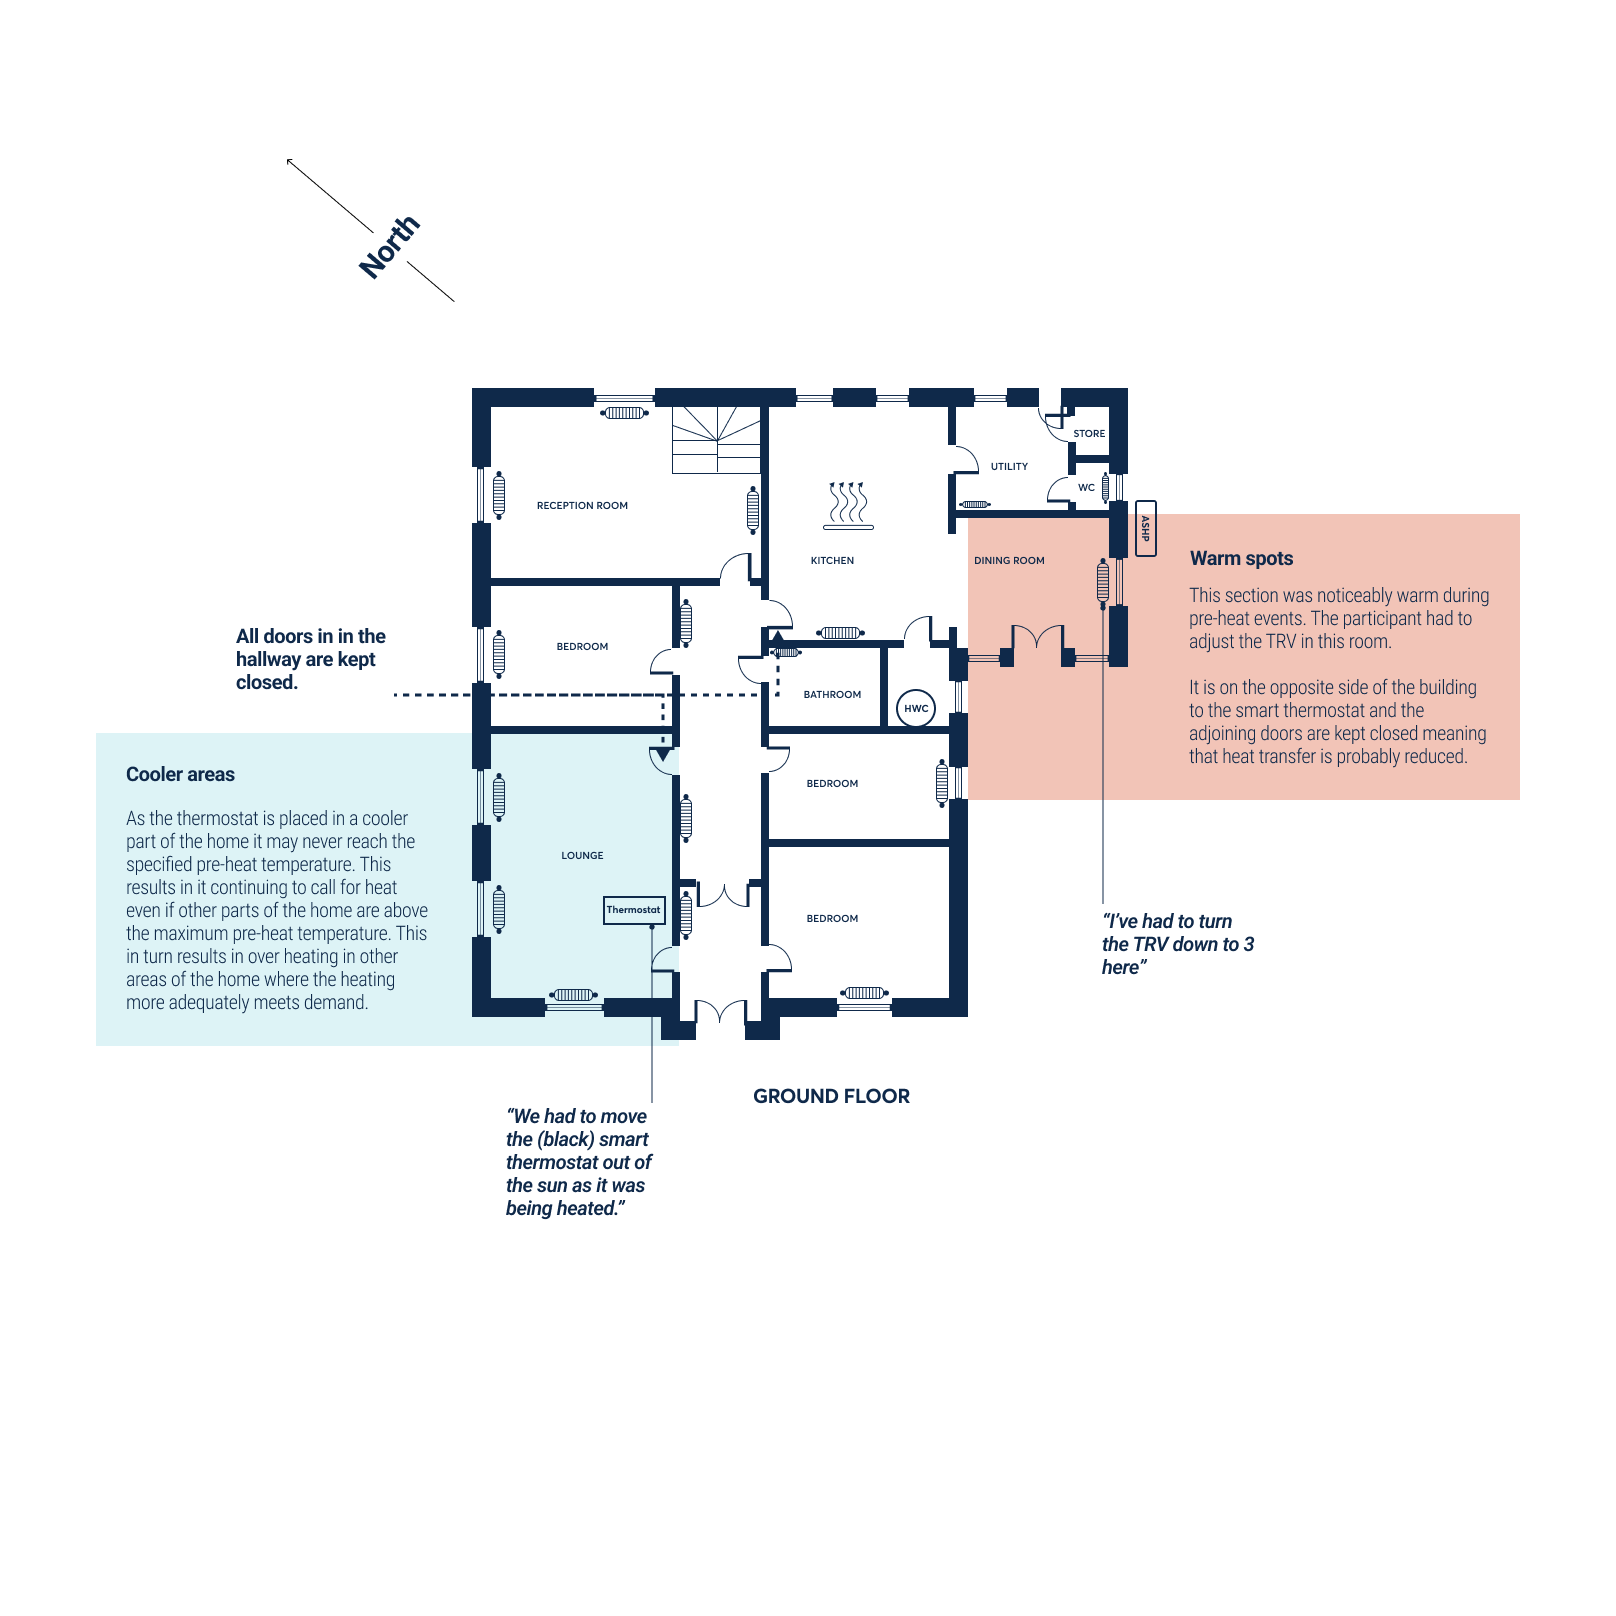
Figure 5. Floorplan of a participant, highlighting the effect of placing the smart thermostat in a cooler part of the home
The location of the smart thermostat may change how well the intervention works
We used a smart thermostat which was portable, rather than fixed in place. Through the mid-pilot interviews we became aware of how crucial the placement of the smart thermostat was for the effectiveness of the intervention, particularly in homes where the fabric efficiency varied significantly from room to room. Smart thermostat location has the potential to significantly affect demand reduction and the acceptability of the HeatFlex events.
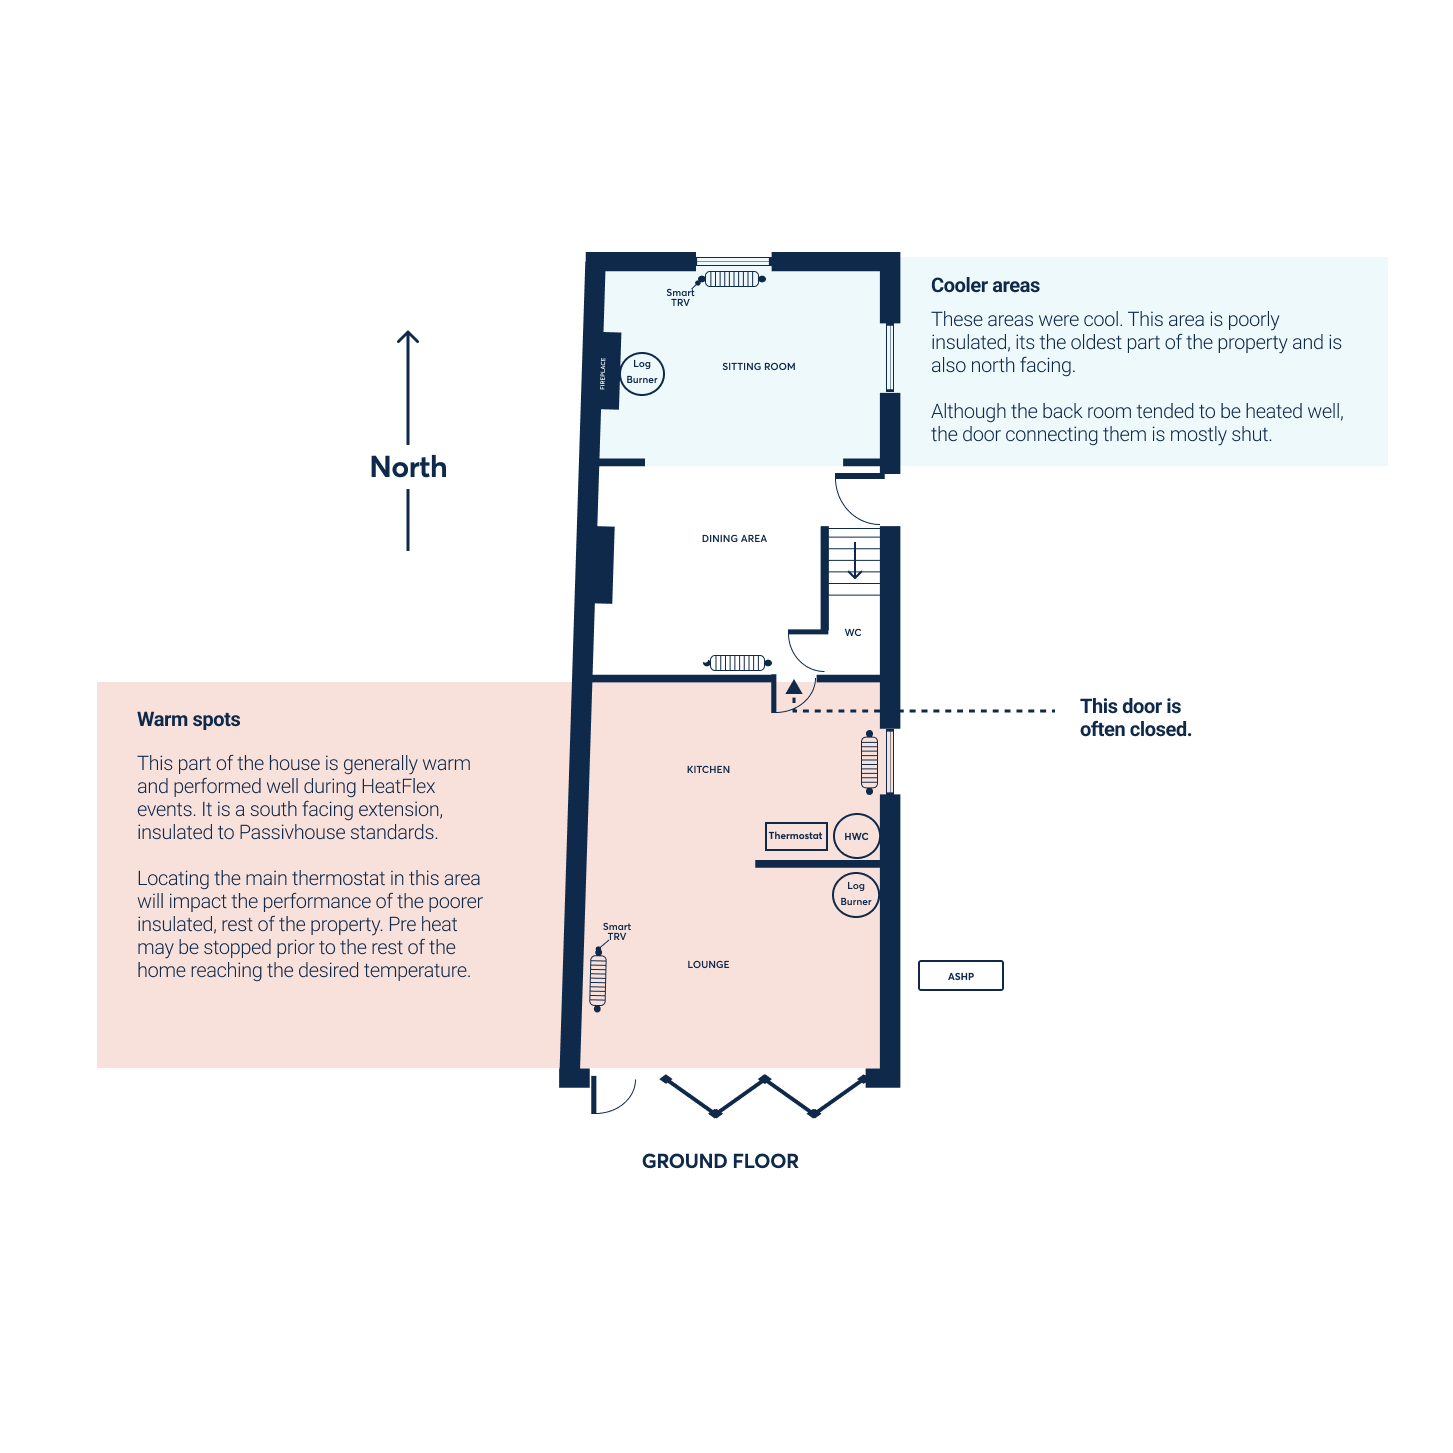
Before the interviews, our only gauge of the thermal performance of the properties included in the pilot was their Energy Performance Certificates (EPCs). However, several homes had areas with very different thermal properties. The placement of the smart thermostat within these areas potentially affected the overall performance of the house.
Placing the thermostat in a well-insulated area of the home with low heat loss could have several effects on the HeatFlex events, and vice versa.
- During the pre-heating window, the thermostat would reach the specified pre-heat temperature quicker than poorer-performing parts of the home. The thermostat would then stop calling for heat from the heat pump, even if areas of the home with a poorer thermal performance were still below the target pre-heat temperature.
- During the flexibility window, the parts of the home with better thermal performance will lose heat at a slower rate. This could result in areas of the property with poor thermal performance falling below the acceptable thermal comfort preferences.
Both of the above outcomes could be mitigated by zoning – setting different target temperatures for different rooms according to preferences. However, this makes the heating system harder to control indirectly. It could also be mitigated by giving advice to participants on the best placement of a portable smart thermostat, though observing how participants behave without this advice might be a truer reflection of their real flexibility potential. We will consider whether or not to give this advice to participants in our larger scale trial.
Figure 6. Floorplan of a participant's property, highlighting the impact of different insulation across their home
Participants' behaviour may have affected the magnitude of flexibility potential
The mid-pilot interviews identified a number of behaviours we believe might consistently affect the amount of demand reduction achieved: moving the smart thermostat around the home, closing doors to limit airflow and reduce heat loss from one room to another, and the type of activity undertaken during events.
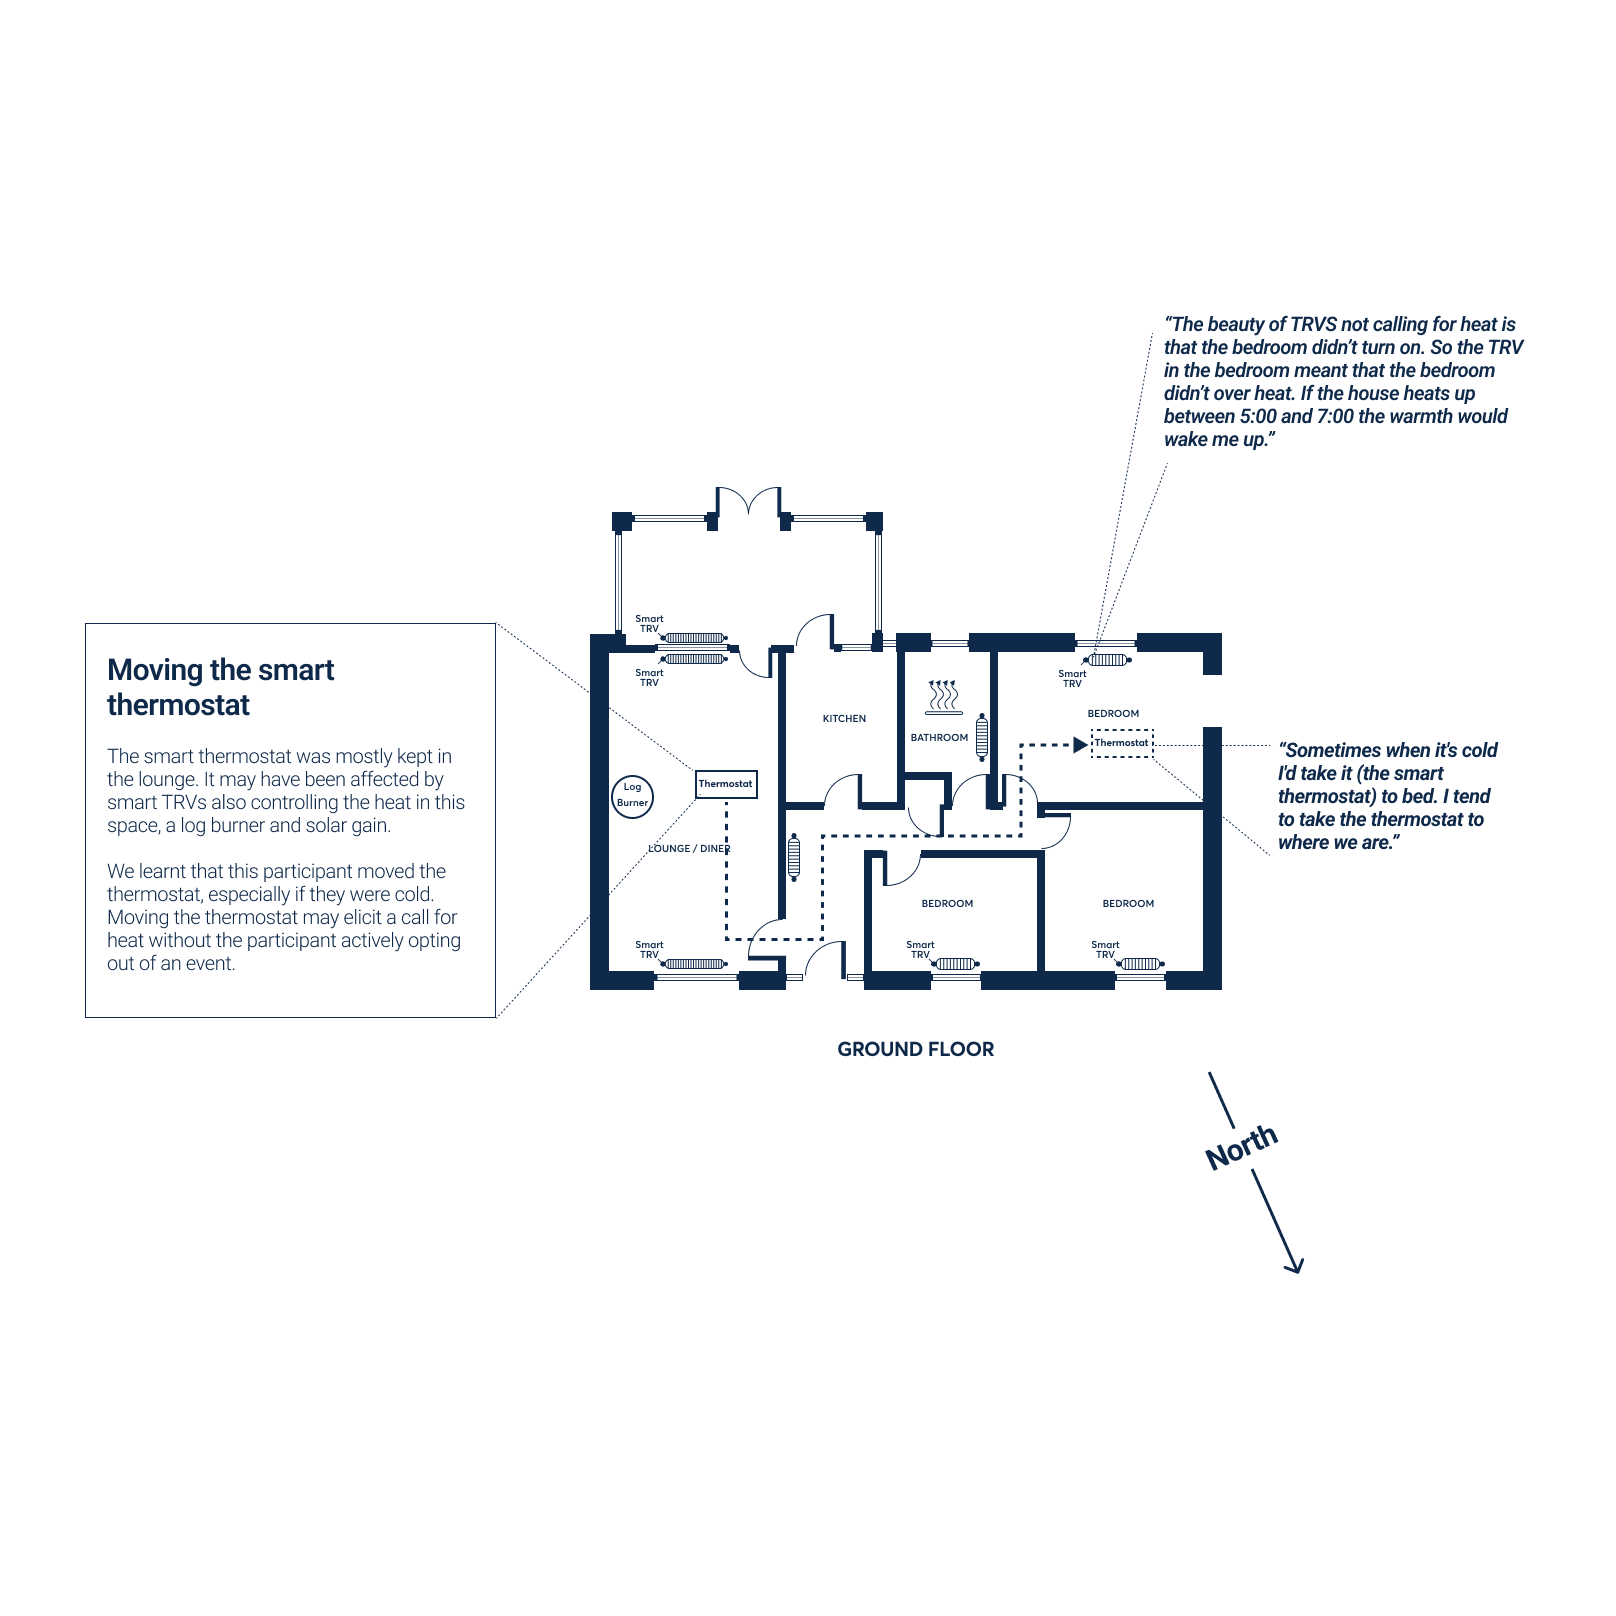
Moving the smart thermostat
The smart thermostat that was used in this pilot was portable. We cannot be confident in how often the smart thermostat was moved during events. This is something that we will look to understand better in the larger scale trial.
In interviews, we heard that the smart thermostat was sometimes moved within rooms to try to elicit a desired response from the system. For example, one participant took it to their bedroom overnight. The impact of moving the smart thermostat depends on whether it was an evening or morning event, the fabric of the property and direct exposure to sunlight.
Figure 7. Floorplan of a participant, highlighting the impact of moving the smart thermostat
Closing doors, limiting airflow
During the interviews, we asked participants whether doors were kept open or closed during the events. We noted that a lot of participants kept doors to adjoining rooms closed during events. This prevented airflow and may have amplified the effect of different thermal properties of the building fabric throughout their home, as warmer areas performed better and cooler areas did not benefit from warm airflow. Homes with greater variation in their fabric energy efficiency would increase the potential effect.
Types of activity
As part of the post-event surveys, we asked participants to list any activities they were doing during flexibility events. When coupled with the floorplan exercise this gave us an insight into how participants were spending their time and the effect it might have on the acceptability of events.
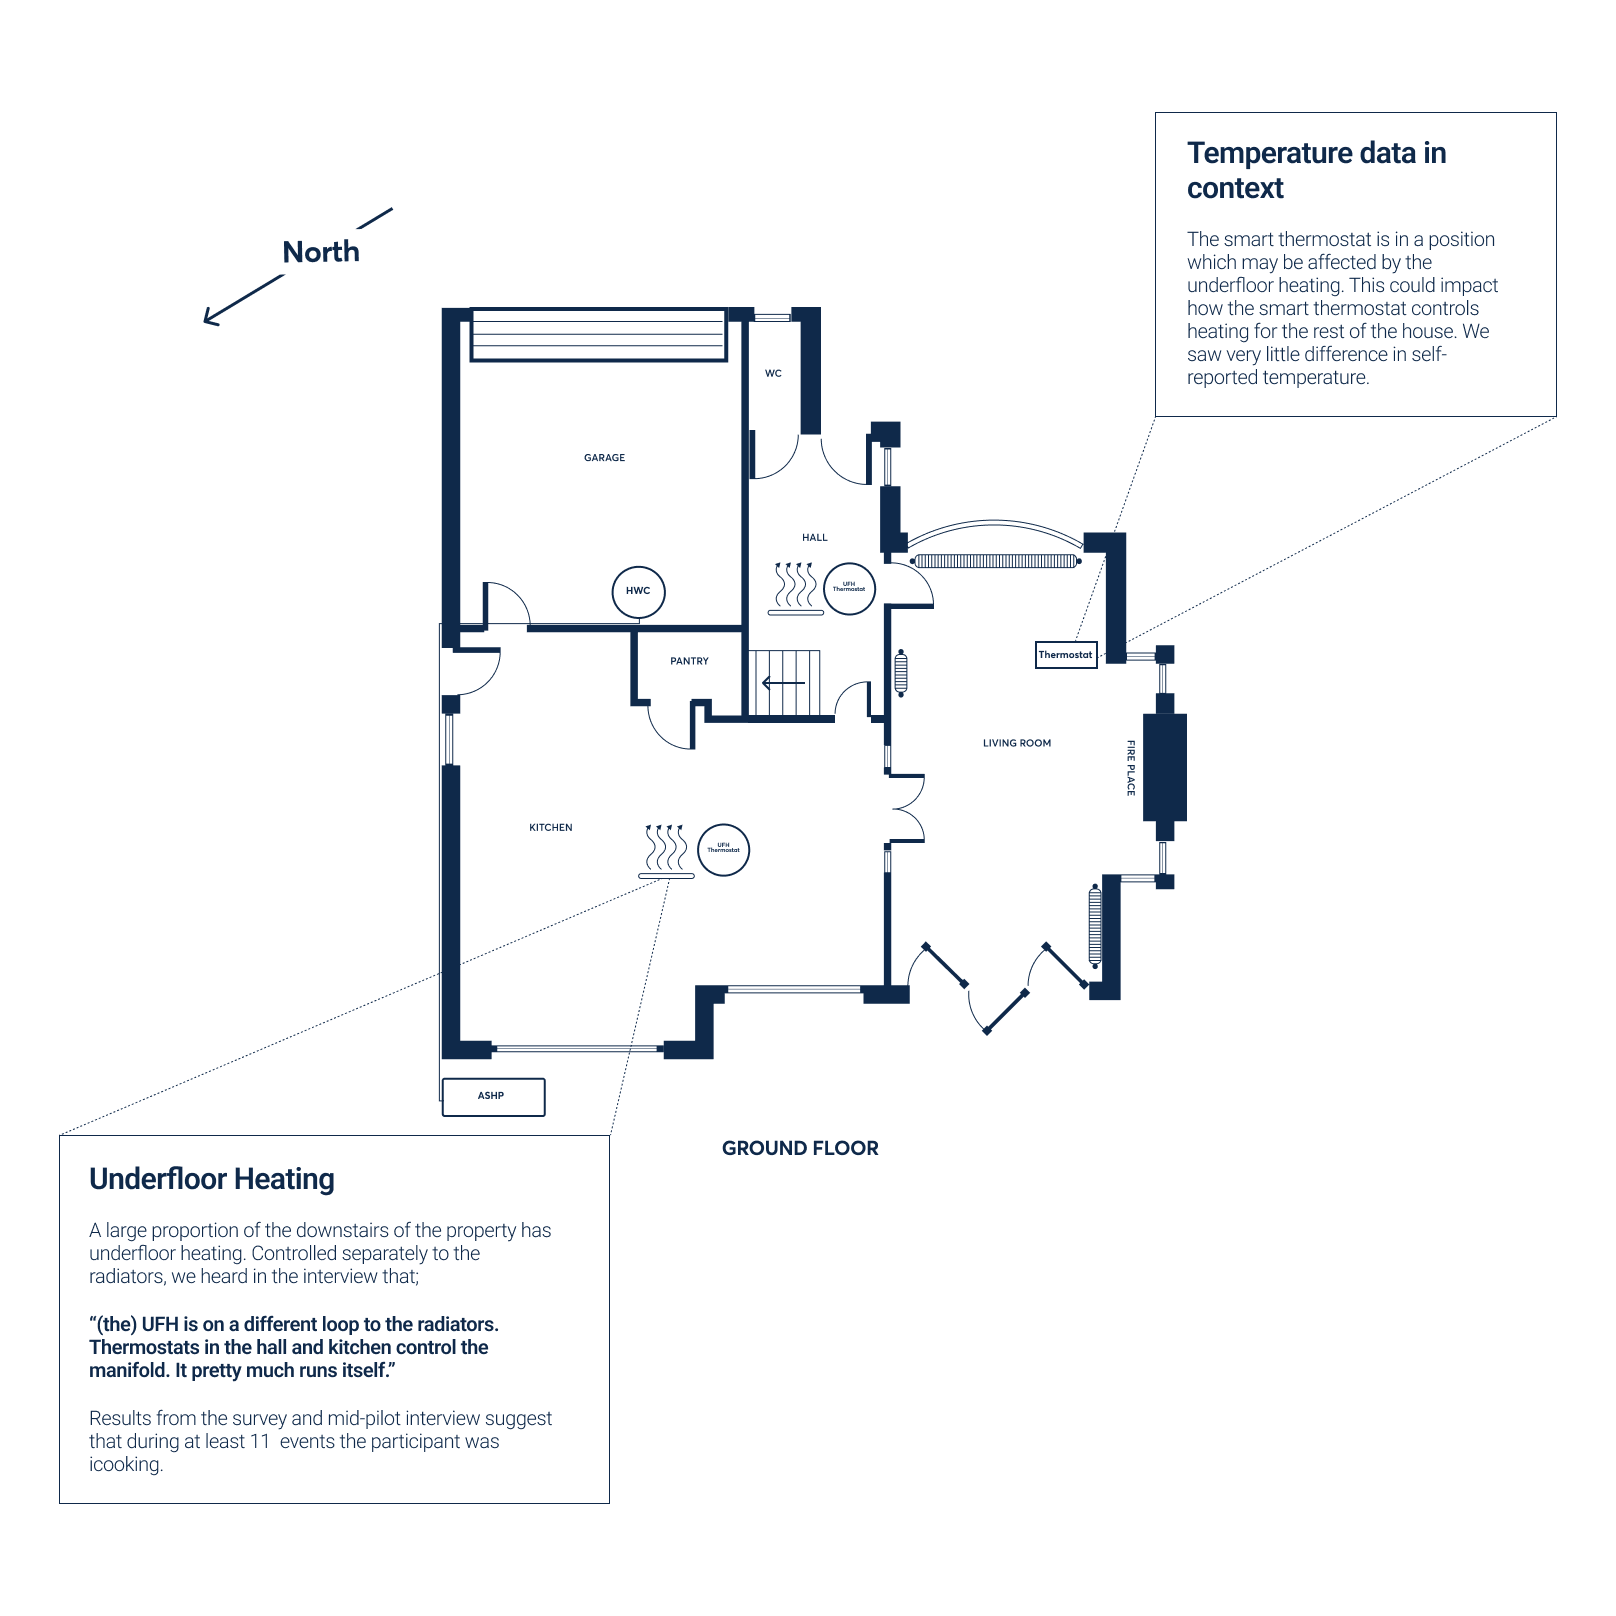
Cooking was often listed as a common activity during evening events and this may impact the internal temperature of the home. A secondary impact is that people tend to be more active when cooking than other commonly reported activities like reading, watching TV or working at a desk. Interestingly, the floorplan exercise allowed us to understand the interaction between common activities and the home itself. For example, one participant had listed cooking as an activity for 11 events. Through the floorplan exercise, we found their kitchen was heated using underfloor heating, controlled by a room thermostat. We were most likely unable to control this electric underfloor heating during the pilot, meaning that the temperature experienced by the participant whilst cooking during HeatFlex events was no different to their normal routine. In our planned larger scale trial we will ensure that we note the presence of heat emitters that we are unable to control remotely.
Figure 8. Floorplan of a participant, highlighting the impact of uncontrolled heat sources and participant behaviour
2.2 Acceptance of third party automation
We used a variety of methods to understand different aspects of participants' experience of the events, including how acceptable they found their heat pumps being remotely controlled.
Primarily, we looked at whether participants opted out of events, and the reasons they gave for doing so. We also used surveys and interviews to capture self-reported data, and insight on participants' attitudes.
9 out of 10 participants reported that our automation of their heating was acceptable
In the survey we distributed at the end of the pilot, we asked participants how acceptable they found their thermostat being remotely controlled during events. Nine participants responded that they found it “acceptable”, and one participant said they found it "slightly acceptable”.
We also asked participants about what they would change to increase their acceptance of their thermostat being remote controlled. The most commonly cited difficulty was with the R&D app that participants were required to use. They told us that the usability of this could be improved to make scheduling their heating easier. Overall, this suggests that participants were comfortable with their heating being automated.
We recognise that our approach to recruitment meant that there would be selection bias towards those who were interested in taking part in our pilot. Given that we provided individuals with an information sheet prior to asking their consent to participate, it would be unlikely that an individual with an aversion to third party automation will participate. However, we do believe that these findings indicate that the experience of our intervention was acceptable.
There were 11 instances where participants opted out during events, indicating that the majority of participants were not uncomfortable with their heating being automated
We provided participants with the opportunity to opt out of each event before it started, for whatever reason. We also specifically instructed participants to opt out if they were not going to be at home.
Participants could also opt out during events by manually overriding the temperature on their smart thermostat. We had informed participants at the start of the pilot that they should opt out if the temperature of their home became uncomfortable, to help us understand their comfort thresholds. We encouraged them not to treat the events as a demand reduction challenge or endurance test.
Across the 20 events, there were 26 instances where participants opted out before events, and 11 instances where participants opted out during events. Being too cold was the reason provided for those who opted out during events. Overall, this suggests that the majority of participants were accepting of their heating being automated by a third party during events.
Some participants adjusted settings on their heating system to improve their thermal comfort during events
Four out of ten respondents said that they had made adjustments to their heating systems to optimise cost and comfort in response to the HeatFlex events.
- One participant altered their heat pump's flow temperature as they noticed increased on-and-off cycling and energy usage. They were unsure whether the increased energy use was due to the smart thermostat interacting suboptimally with the heat pump, or because the installation coincided with a 'cold weather snap'.
- One participant increased their heat pump's flow temperature after experiencing some pre-heating windows where they did not observe a significant temperature change. They changed the output flow temperature to a fixed 38 degrees rather than being variable. This resulted in a 1°C per hour room temperature change during pre-heating.
- One participant changed the settings on their heat pump to make sure it was controlled by the smart thermostat's temperature sensor instead of the heat pump's own sensor.
- Another participant changed their schedule to keep their house warmer at all times (setting the room temperature to a minimum of 19°C). Before installing the smart thermostat they had tended to let the house cool overnight and during the day. They also previously tended to set the temperature to 19.5°C in response to the Octopus Go tariff's night rate, using cheaper electricity to avoid losing heat overnight, and avoid depleting electricity stored in their battery.
This indicates that these participants were able to make the changes they thought necessary to increase their satisfaction during the pilot, but it may be the case that other less engaged participants would not be able to do so.
We found no evidence of detrimental impacts on hot water availability
Reducing space heating demand by lowering a thermostat setpoint can, in some circumstances, cause heat pumps to be more likely to heat hot water, potentially causing higher than normal electricity consumption. We reviewed operating manuals of the heat pumps involved in our pilot, and we found that they all gave hot water priority over space heating. This means that reduced space heating demand will not be likely to cause higher hot water demand – because heat pumps should have already satisfied any outstanding hot water demand.
None of the five midpoint interview participants noted any difference to their hot water availability during the events, and they confirmed that they had not changed their water usage habits. No participants reported any detrimental impact on hot water availability during the end-of-event surveys or the final end-of-pilot survey.
With this said, it is possible that calls for hot water from the heat pump impacted our results in the following two ways.
1If hot water was required during the pre-heating window, space heating would have been deprioritised. This may have resulted in the home becoming unacceptably cold more quickly during the flexibility window.
2A call for hot water during the flexibility window could have resulted in increased electrical consumption, which we would observe in the smart-meter data. However, as noted above, the flexibility window's lower setpoint will not make this call for hot water any more or less likely.
Three themes emerged from the interviews which indicate that the likelihood of hot water usage increasing electricity demand during the flexibility window could be negligible.
1Water heating was often scheduled during the night time to take advantage of electricity tariffs' cheaper overnight unit rates.
"As far as I'm aware the hot water is heating in the evening during the cheap time, 12:30 am onwards so it's carried on. Everything has been exactly the same"
2For some participants, solar panels heated water during the middle of the day.
"No difference, we have a lot of solar. We don't tend to use the water during event windows. Haven't noticed anything. When it's sunny it's all heated up to 60 degrees"
3For other participants, hot water cylinders stored enough hot water to last the whole day.
"Usually, the hot water lasts for a whole day (it's 180 litres) and heats in the morning on cheaper electricity”
Participants were less accepting of morning events than afternoon events
The majority of our events were timed between 16:00 and 20:00 on a weekday, which is typically the time of peak demand on the electricity grid. However, mornings can also be periods of peak electricity demands. To test participant response to morning events, we ran three events where the pre-heating window began at 5:00 and the flexibility window ended at 9:00.
In the post-event surveys, more participants raised concerns about the morning events. Some woke up because they heard their heat pump starting at 5:00, others were unhappy that the room with the smart thermostat in it was heated unnecessarily at a time when they usually did not have the heating on.
When we asked participants about their preferences for event timings throughout the day, 7 out of 10 rated mornings as an acceptable time compared to all participants rating weekday afternoons acceptable. Below, we provide some of the reasons why participants were less favourable about morning events:
“I think any time is acceptable, but my experience of the morning ones was not good. That was because it takes a lot of energy to get our unoccupied sitting room where the [smart thermostat] is located to 20°C which was your target, but in the mornings we would never heat it to that.”
"Morning events were difficult as we wouldn't normally have the heat [on] before we wake up."
These findings mirror those found by others, including research by Sweetnam, Fell, Oikonomou, and Oreszczyn (2018) who memorably quoted a participant complaining of their butter melting due to overnight pre-heating.
2.3 Thermal comfort
In the HeatFlex UK pilot, we treated thermal comfort as if it was 'non-negotiable', in order to understand how much electricity demand could be reduced without compromising it.
In real-world scenarios, consumers are likely to be offered a financial incentive to flex their demand. We would anticipate more discomfort to be acceptable as the level of financial reward increases, but the size of this effect is currently uncertain.
In our pilot, to understand the acceptability of our intervention, we told participants to override our control of their heat pumps manually if they felt too hot or too cold.
We did not assume that being too hot or cold for a few hours would be highly unacceptable to participants. However we would anticipate that if this happened too frequently it would increase the likelihood of participants opting out of individual events, or perhaps ultimately from the whole pilot.
Numerous studies have shown that measuring an individual's thermal comfort is complex due to the variety of ways in which we perceive temperature. In addition, comfort varies between different people, and factors such as gender, occupation, and life-stage all influence how people experience a room's temperature.
This section highlights some of our findings from interviews and surveys regarding how well we maintained thermal comfort, and the challenges we encountered in attempting to measure it.
A key limitation to highlight is our focus on one primary participant from each household. By this we mean the named individual who volunteered to participate in HeatFlex UK, all of whom lived with at least one other person.
Our surveys were typically only completed by the primary participant in each household. We asked about others in their home, but weren't able to directly measure their experience. We will explore ways to address this in the larger-scale trial.
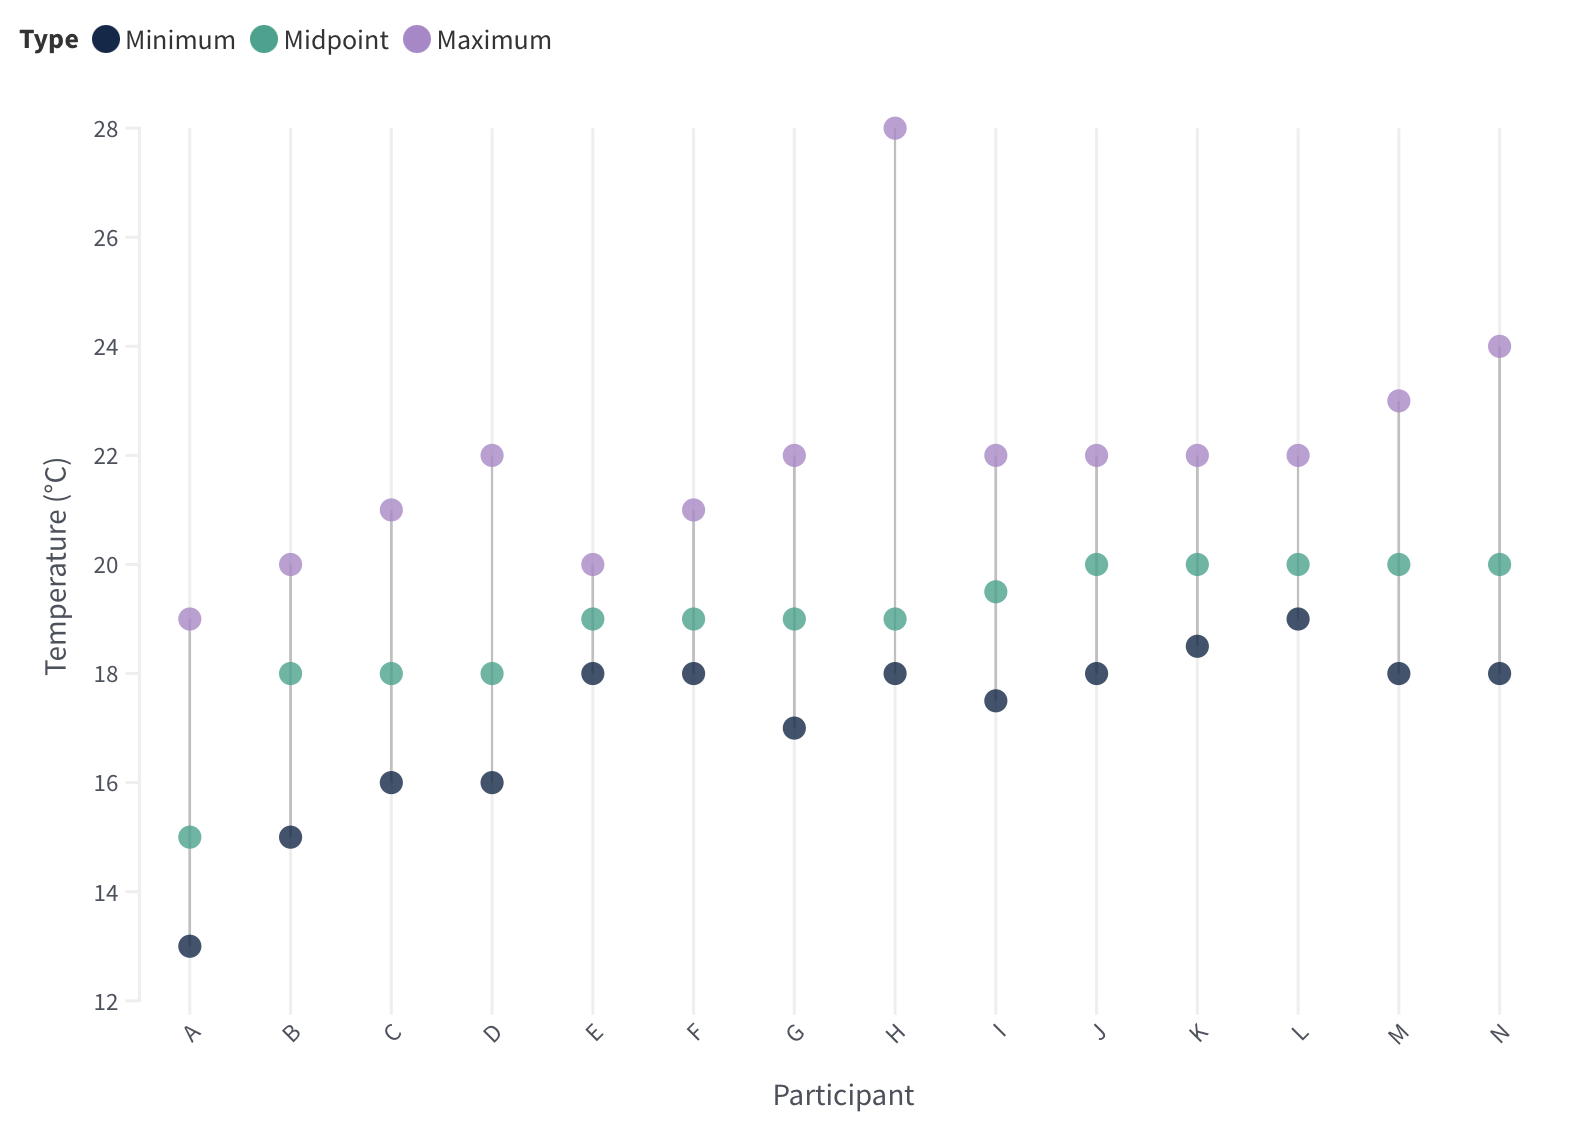
Figure 9. Participants' stated thermal preferences (n = 14)
Self-reported comfort ranges differed between participants
At the start of the pilot we asked participants to provide a minimum and maximum temperature between which they believed they would be thermally comfortable. These figures informed the target temperatures in our intervention. These findings are presented below.
The thermal comfort ranges differed between participants, in terms of the high point and low point, but also the spread between them. For instance, some participants provided ranges of 2°C, whereas some provided broad ranges of 10°C. Note that the ranges above represented the thermal comfort ranges during the day in participants' main living room. The ranges they provided for morning events tended to be slightly tighter.
One area that we were not able to explore in the pilot was the accuracy of the thermal comfort ranges provided by participants. When we asked participants how easy it was to provide a minimum and maximum, some found it difficult to provide these values for a variety of reasons. For example, one participant said that different rooms were different temperatures, so they didn't know which to choose, whereas another said conceptualising a maximum was difficult as they only thought about minimum temperatures. This means that participants' stated preferences may not align with their later reported comfort during events. We also know that experience of thermal comfort can vary for the same given temperature, influenced by factors such as how active a person is at the time.
It is possible that participants experienced thermal discomfort during events, even though their room temperatures may have been within their stated ranges. In a larger scale trial, setting the pre-heat temperature above the maxima, or letting the home cool to below the minima and measuring participants' thermal comfort could help verify the accuracy of the self-reported thermal comfort ranges.
The majority of temperatures that participants self-reported at the end of the pre-heating window were greater than their normal setpoints - suggesting that pre-heating 'worked'
We asked participants to provide self-reported temperature readings from their smart thermostats at the end of the pre-heating window and the end of the flexibility window. To try to understand whether we had successfully pre-heated the homes, we mapped these data onto each participants' normal setpoints and the pre-heating setpoints.
In the majority of the cases, temperatures were greater than participants' normal setpoints (the temperatures participants would set their thermostat to on a day without an event), indicating that our interventions were successfully increasing indoor temperatures.
We asked about experiences during pre-heating and found a variety of responses:
- Some participants reported that pre-heating had worked, increasing the temperature of their home.
- Some reported that the temperature was already greater than the pre-heating setpoint due to the room heating up from the sun. This means that the temperature of homes may have increased for reasons other than pre-heating.
We also recognise that this analysis is based on data from participants who responded to our surveys and is self-reported, so may not be accurate or representative of the whole sample (of the 119 survey responses where participants had participated in events, 71 provided self-reported temperatures).
Temperatures decreased by an average of 0.3°C during the flexibility window
We also asked participants to self-report temperature readings from their smart thermostats at the end of the flexibility window. To help assess the extent to which the temperature of participants' homes changed during the flexibility window, we looked at the difference between these data points for participants who provided this data.
Figure 10. Difference in temperature at the end of the flexibility window compared to the start of the flexibility window for each event where we received temperature data from participants (n = 60)
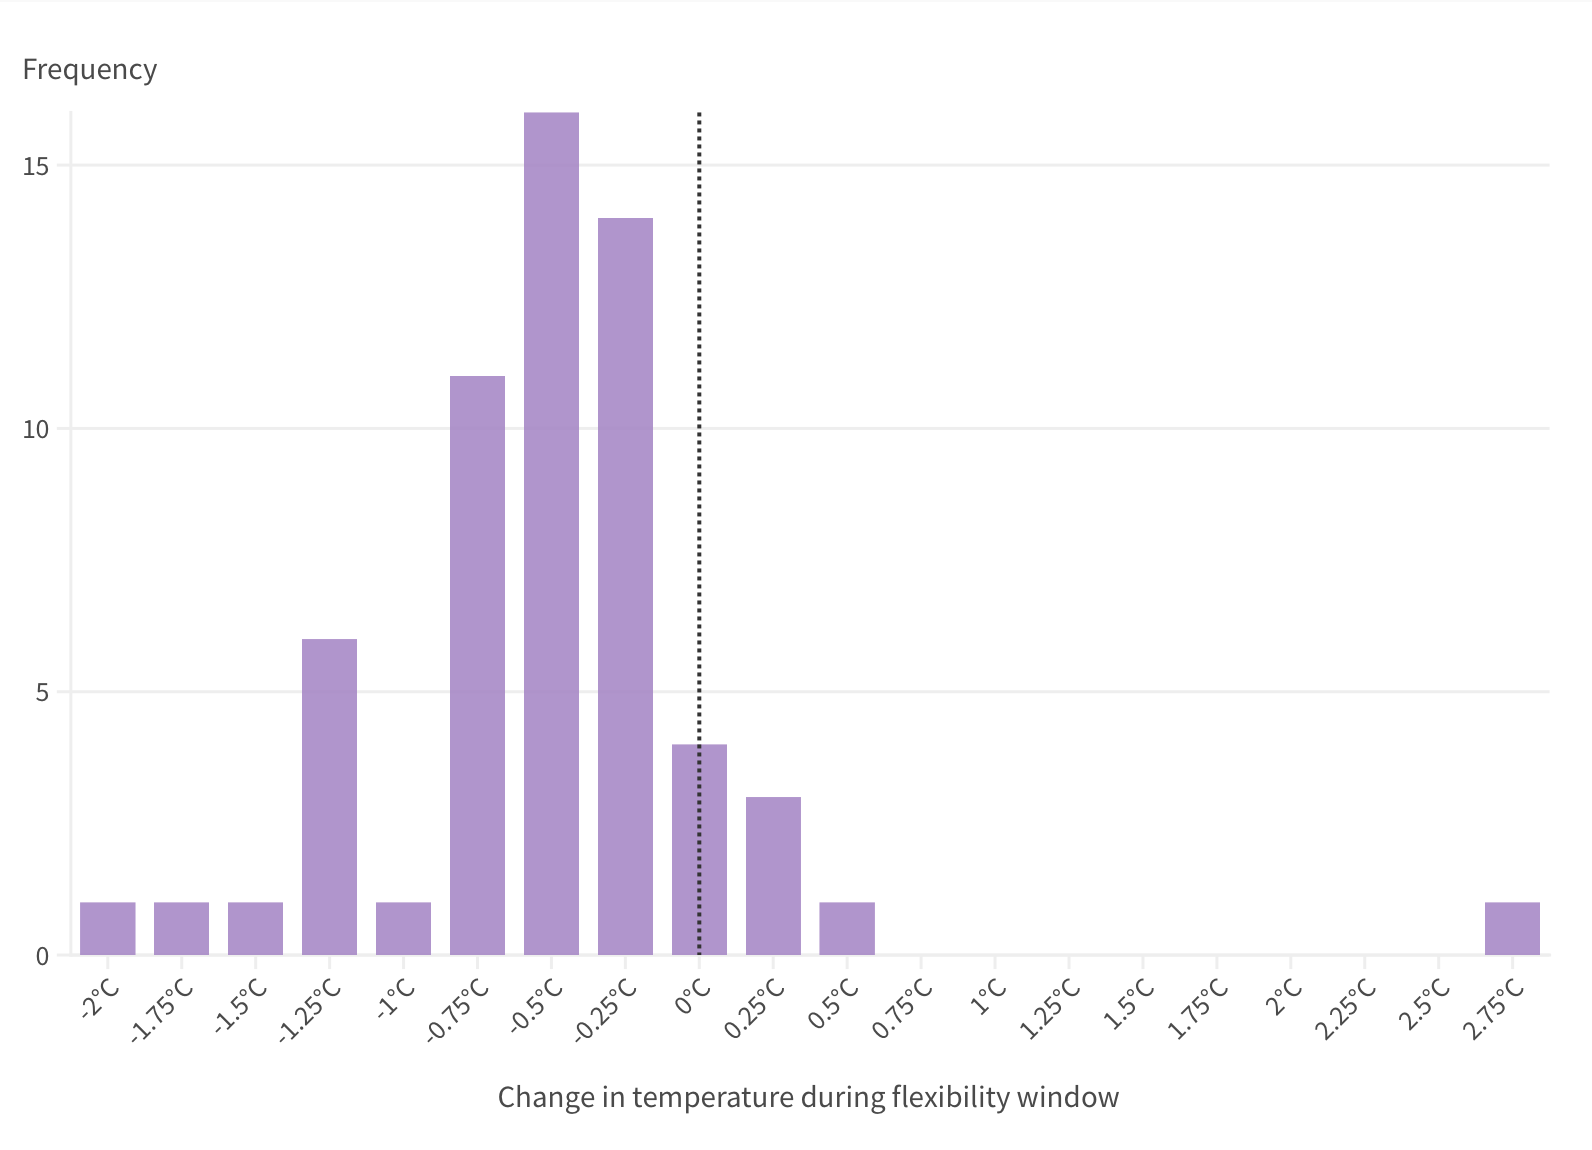
As shown in Figure 10, in the majority of events where participants provided us with self-reported temperature data, we found that temperatures decreased between the start and the end of the flexibility window.
The magnitude of change was typically between 0°C and -1°C across the flexibility window. There are a variety of reasons why this change may appear relatively small. First, our pilot was implemented during relatively warmer external temperatures and our participants tended to have well-insulated homes, so it may be that heat loss was not large. Second, thermal inertia from the pre-heating phase and solar gain may have reduced cooling during the flexibility window. Third, some participants said they used supplemental heating (such as log burners). This was the case for the data point where there was a 3°C increase during the flexibility window.
We note that these data points are self-reported, and may not be representative of the entire sample due to the data only including responders to our survey (we had 71 responses in total where participants provided self-reported data, out of a total of 119 survey responses from participants who participated in events).
Temperature data from the smart thermostat also indicated that pre-heating resulted in higher temperatures
HeatFlex events consisted of two different windows, each usually lasting two hours.
- Pre-heating window: we changed the customer's smart thermostat setpoint to the maximum acceptable temperature.
- Flexibility window: we changed the customer's smart thermostat to the minimum acceptable temperature.
For comparison purposes, we are also interested in the two hour period after the flexibility window ended, when we had stopped controlling the participants' heat pumps.
We collected quarter-hourly temperature data from the smart thermostat for each of these three periods, as well as the period before the pre-heating window began, when the heat pump will have been operating normally.
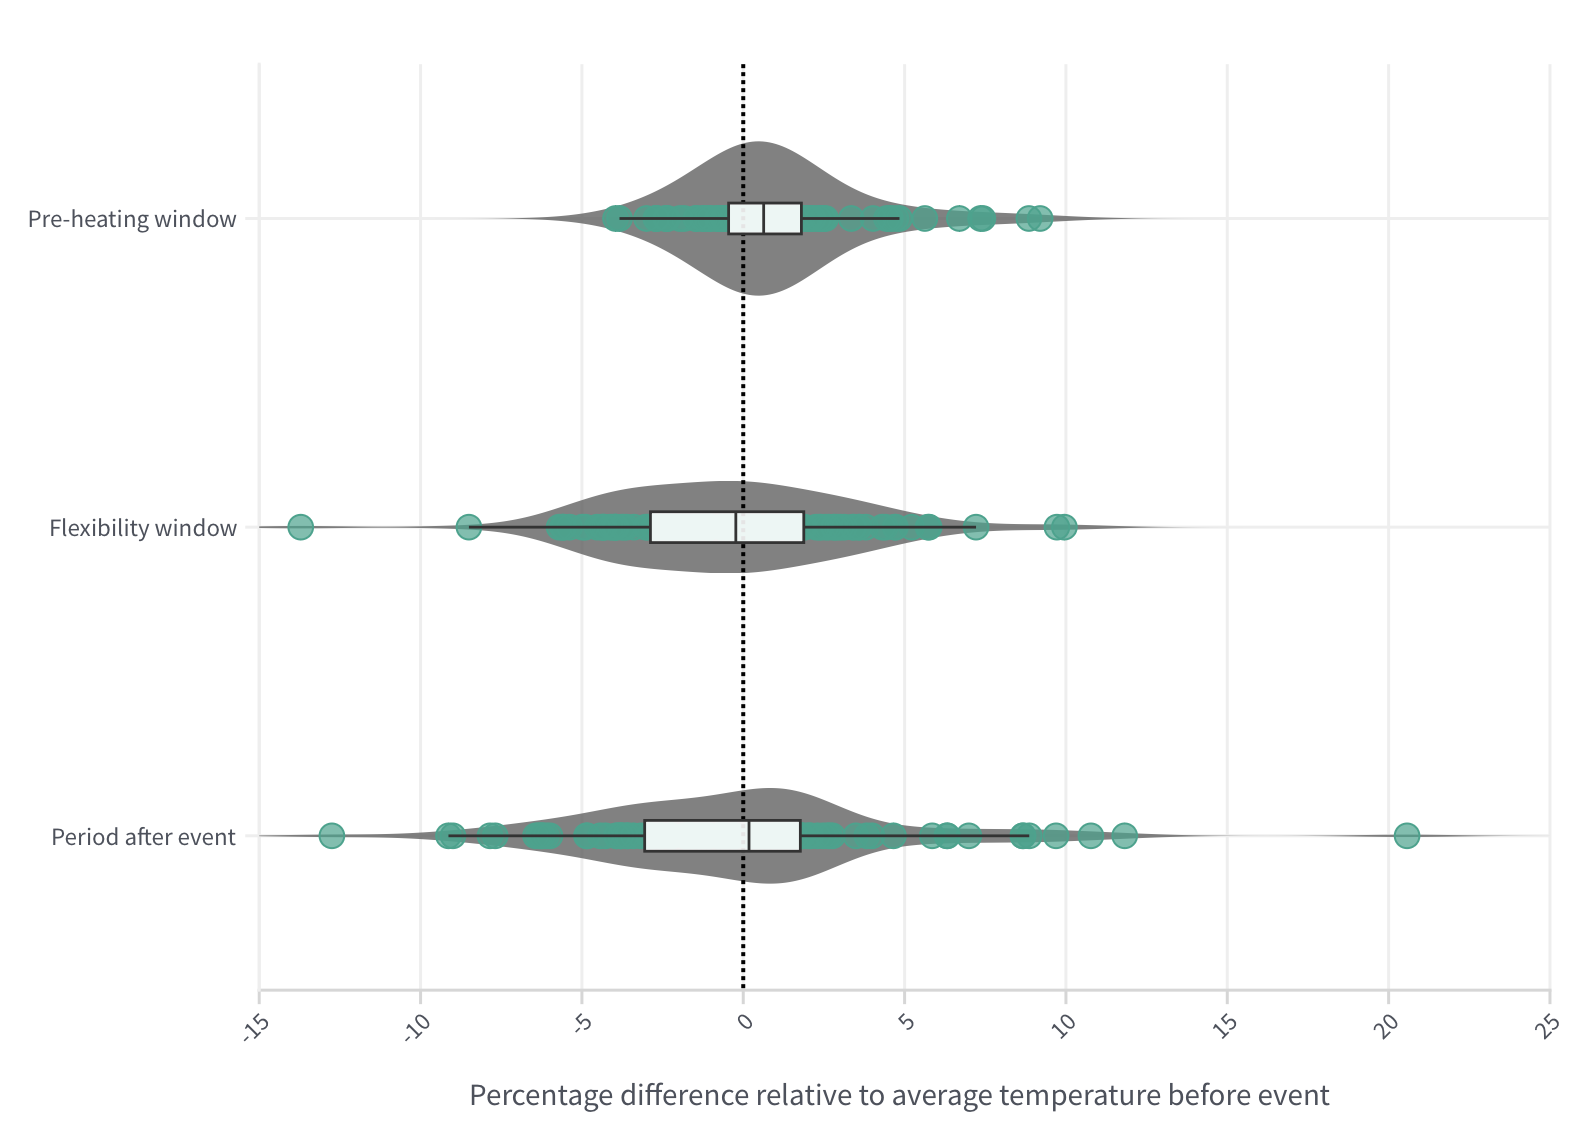
Figure 11, below, shows the results of this analysis. In the pre-heating window, we found that the average temperature increase (compared to the two-hour period immediately before pre-heating began) was 0.9% - which reflects a 0.17°C increase. As shown below, there is a wide distribution, with some instances of 5% to 10% increases in temperature. In some cases, differences were below zero, indicating that the average temperature in the pre-heating window was less than the period before. This corroborates our findings from the self-reported data analysis, where the success of pre-heating varied by participant.
The distribution of temperatures during the flexibility window, and during the period after the HeatFlex event had finished are centred more closely to zero. This indicates that temperatures in these periods are similar to the period before pre-heating began, when the heat pump was operating normally.
Figure 11. Percentage change in temperature for each period relative to two hours before each event (n = 310)
Participants thermal comfort did not change during the flexibility window
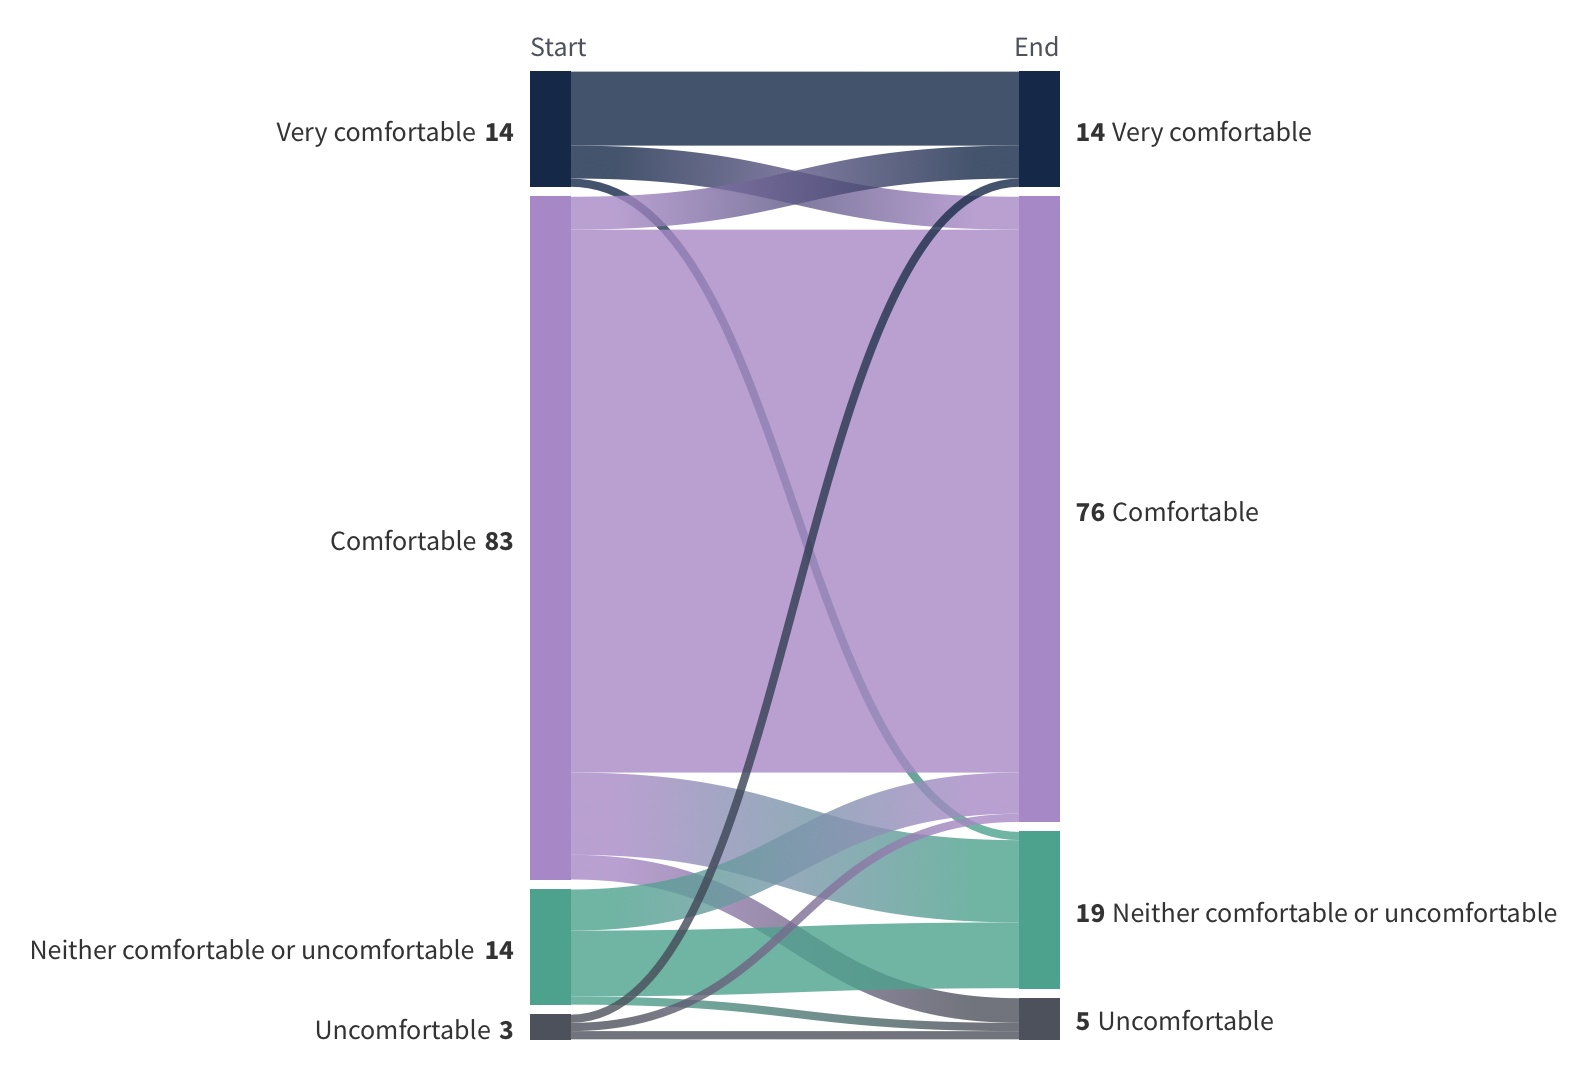
We asked participants to provide a rating of their thermal comfort at the start and the end of the flexibility window in the post-event surveys. We received 119 responses where participants provided thermal comfort ratings.
The majority of responses indicated participants were either “comfortable” or “very comfortable" at the start and end of the flexibility window (82% and 76%, respectively). Very few responses indicated participants felt uncomfortable (three responses at the start of the flexibility window, and five responses at the end).
In 73% of responses, participants' rating of their thermal comfort was the same at the start and the end of the flexibility window. Comfort ratings tended to decrease, but we found instances where they increased (corresponding to when log burners were used).
Figure 12. Participants' thermal comfort at the start and the end of flexibility windows (n = 114)
We also asked participants about the acceptability of the temperature in their home, and our findings were similar to those about thermal comfort. Overall, this indicates that participants were generally comfortable with the temperatures of their homes during flexibility windows. Given that we maintained temperatures within the thermal comfort envelopes that they provided us with, this is an encouraging finding.
Some participants changed behaviour to maintain thermal comfort
A range of other adaptive measures were reported by participants such as putting on a jumper, using a hot water bottle, or putting on the log burner towards the end of an event. It is important to note that interviewees told us they used hot water bottles and jumpers outside of HeatFlex events as well.
We also asked participants about how active they were during events. We found that participants were generally "not very active” (78 responses), while some were "quite active" (46 responses) or "active" (6 responses). When asked about what activities they were doing during events, the most commonly cited activity was cooking, followed by working or eating.
Figure 13. Most commonly occurring words in free text response to "How would you describe your activities during the event?” in the survey sent after events (n = 159)

Previous research on thermal comfort suggests that the level of activity of an individual affects their perception of temperatures and their thermal comfort for a given temperature. Activities such as cooking also often generate heat, which may also affect participants' thermal comfort.
Most primary participants did not think other household occupants' experience differed from their own
We asked primary participants about other occupants' experiences in the post-event surveys. The majority of responses (100 responses out of a total of 109 responses to this question) were that other occupants' experiences did not differ. Of the remaining nine responses, seven were reports of other household members being cold and two were cases where the primary participant didn't know.
We also asked whether the primary participant noticed other occupants changing their behaviour to maintain thermal comfort, and six responded that other occupants had put extra clothes on during events.
Three of the five mid-point interviewees reported that their partners were more sensitive to the cold than themselves. However, only one of the participants stated that they had manually increased the temperature during an event due to their partner being too cold, saying "If it was on my own I think I would have been fine”.
The findings above suggest that other occupants generally had similar experiences to the primary participant. We do not take this at face value, and we believe our approach to testing this could be improved - potentially by asking other occupants to complete surveys. We are aware that household dynamics are an important factor particularly when the thermal preferences of occupants differ. This is an area we aim to build upon for the full scale trial.
Thermal comfort ratings did not correlate closely with descriptions of temperatures
In addition to asking about participants' thermal comfort during flexibility windows, we also asked them to describe their perception of the temperature (for example "hot" or "warm").
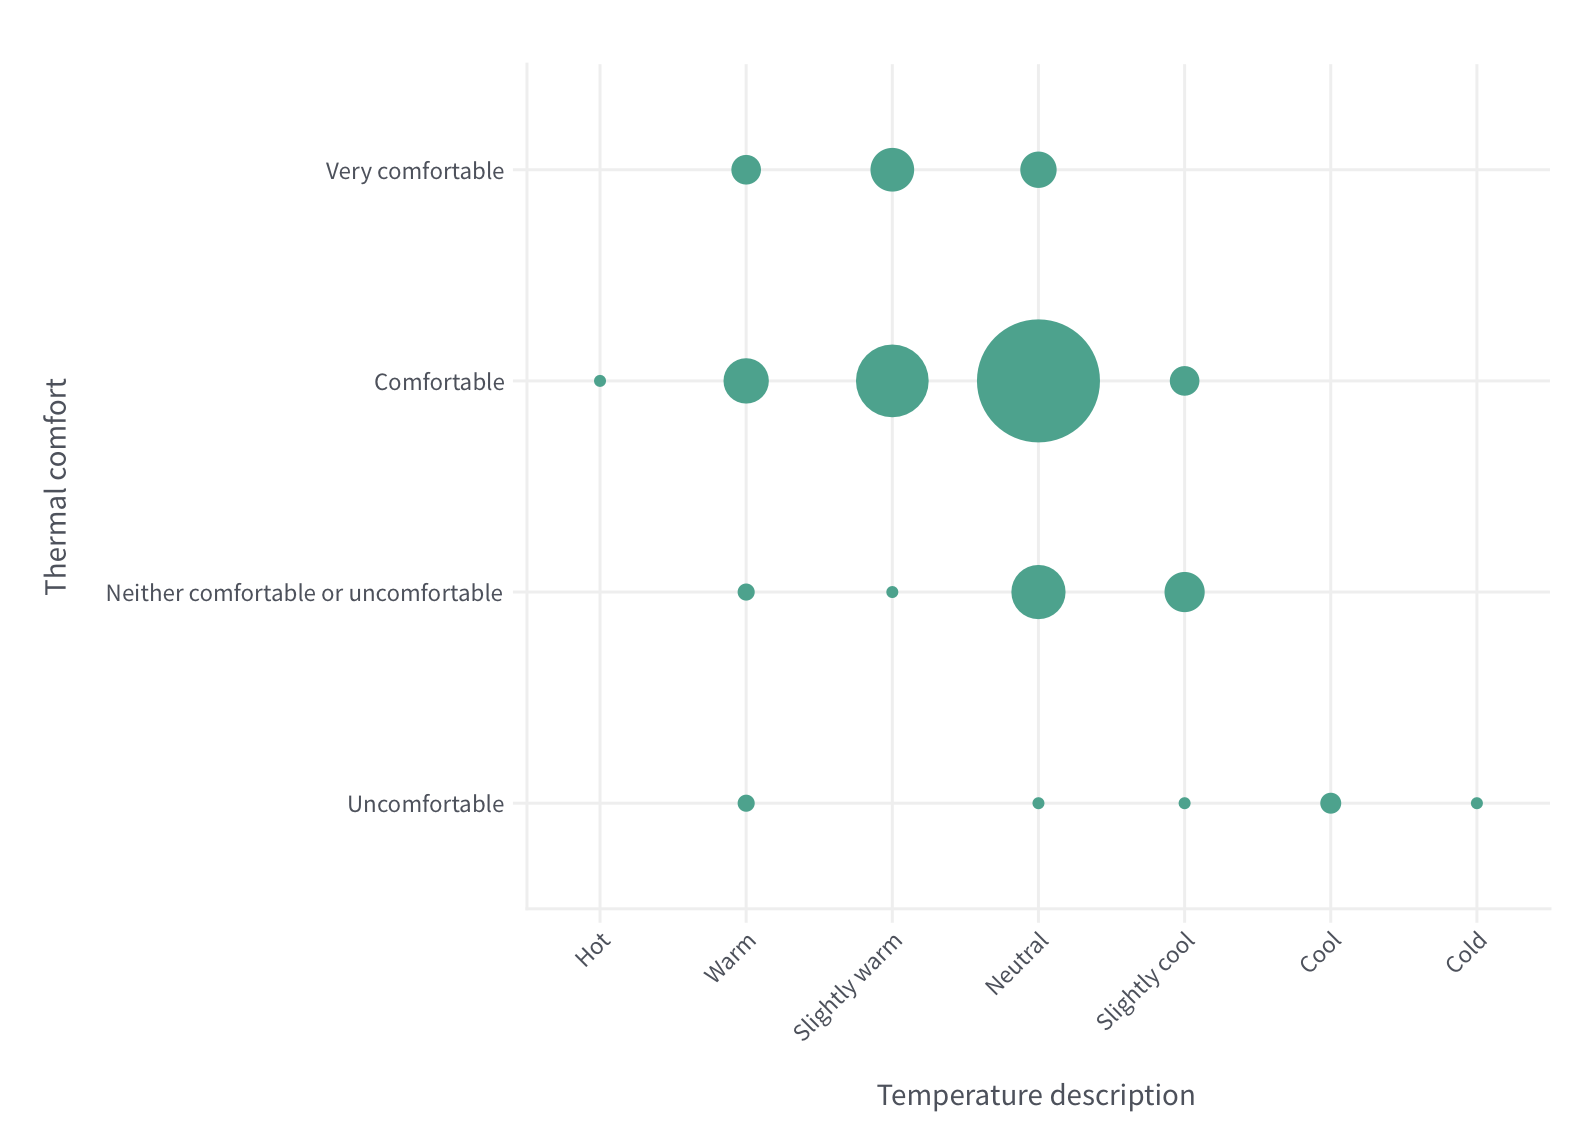
We found great variation in terms of temperatures that participants found "comfortable”, as shown in Figure 14 below. Some participants reported that "slightly cool", "neutral”, “slightly warm”, and one instance of “hot” were all rated as "comfortable". Other participants rated these temperatures as “very comfortable", or as "neither comfortable or uncomfortable".
The variation in ratings for different temperature descriptions suggests that other factors may be involved. Our experience here is typical of the difficulty asking people about their thermal experience and comfort, due to the inherent imprecision and ambiguity of the language we use to describe these subjective feelings. In addition, we also know that factors such as activity levels, humidity, or even the clothes worn all affect thermal comfort. Other research suggests that the rate of change in temperature also affects perception, with greater increases or decreases in temperature feeling hotter or cooler than smaller changes.
These findings support other research that temperature perception is a complex process, including many factors that may be different across our sample of participants, and across different events.
Figure 14. Participants' self-reported thermal comfort and description temperature during events, gathered in the post-event survey (n = 230)
2.4 Next steps
Our aim is to implement a larger-scale trial in winter 2023-2024 to measure the flexibility potential of households. We will use the learnings from the pilot to inform our research design and aim to build further on our initial findings.
One of the limitations of the pilot was that we were very constrained in our ability to make any causal claims about the effect of our intervention. The larger-scale HeatFlex UK will be a randomised controlled trial, which will enable this.
We also aim to improve the representativeness of our sample, though it is likely that our results will still be limited in their generalisability due to the limited number of households with heat pumps currently.
3. Topics for future research
The findings reported in this report represent those that were the most relevant to our original research aims. However our pilot raised additional questions which we briefly outline below, which could be useful topics for future research.
Interoperability as a barrier to flexibility
Interoperability issues resulted in various challenges throughout the recruitment and implementation of our intervention. In particular, we found repeatedly that different types of heat pumps will not function properly with the smart thermostat we were using to remotely control the heat pumps.
We also found that participants had to make changes to their heating and energy systems to increase their thermal comfort. We believe that increasing interoperability could help increase the population of households that could benefit from offering their heat pump as a flexibility asset, and the magnitude of demand reduction that can be achieved for households with complex heating or energy systems.
Quantifying the extent to which flexibility potential could be increased with greater interoperability is beyond the scope of our research, but our experience of implementing the intervention leads us to conclude that improving interoperability across smart home controls, energy and heating systems should be an area of focus to more quickly unlock the potential of aggregated domestic flexibility.
Thermal (dis)comfort as a service
Our research focused on maintaining acceptability and thermal comfort, while maximising flexibility potential. This is based on the assumption that flexibility will decrease if participants are uncomfortable or don't like our intervention. It may be the case that greater flexibility results in financial benefits to participants; if the price of electricity is greater during flexibility windows than pre-heating windows, then the greater the flexibility provided, the more money saved. This means that having wider thermal comfort ranges could result in greater financial savings, at the cost of greater thermal discomfort.
Our research has assumed that all our participants wish to be comfortable at all times, but a future avenue could be exploring the extent to which participants accept thermal discomfort if it results in greater financial savings. This could potentially be developed further into a personalised intervention whereby participants can provide the extent of discomfort they are happy with given a certain expected financial return (similar to risk ratings on financial investments).
The future of third party automation
Our sample comprised individuals who could be considered technophiles, given their keen interest in technology. We know that the wider population comprises a range of sentiments towards third party automation, with some people being averse to it.
However, attitudes vary depending on the context – driverless cars are often feared, yet mobile phones are widely accepted. Where home heating sits on this spectrum is to be determined – and hopefully our large scale trial can provide some more evidence on this.
A potential avenue of interest would be on how to increase the acceptability of third party automation amongst people who are more cautious of it. Whilst we chose not to explore this within the HeatFlex UK pilot, we are curious whether acceptability might be increased through well-chosen messages. It would be interesting to compare messages which emphasise either the benefits of automated home heating to the energy system in the form of reduced costs for all, or benefits to the individual via direct incentive payments.
4. Appendix: detailed methodology
4.1 Event design
Our pilot involved what we have called event style flexibility, taking place across two periods of time where we remotely automated participants' heat pumps:
1Pre-heating window. During this period, we aimed to heat the home to a specific temperature, higher than participants would usually set their thermostat. The aim of this window was to increase the internal temperature of participants' homes, with the hypothesis that the additional retained heat would then improve comfort during the flexibility window which followed.
2Flexibility window. During this period, we aimed to minimise electricity consumption. We did this by setting the smart thermostat lower than the temperature participants usually will. These windows were timed to coincide with periods when electricity demand is usually high.
The goal of the event was to reduce electricity consumption during the flexibility window. We would expect the pre-heating phase to consume more electricity than normal. Ideally, the overall consumption during an event would be lower than usual, but this was not an explicit goal of the intervention
Both windows were two hours long in our base case event, but we also ran some events where both periods were three hours. We assumed two hours would broadly match the duration of evening peak demand, but it also meant the pre-heating phase was long enough for the heat pump to materially increase temperatures.
A key design feature of our intervention is the use of smart thermostat setpoints to indirectly control the heat pumps. Setting the temperature higher than normal should mean the heat pump heats the home until it reaches the setpoint temperature, at which point it maintains it. The heat pump may not be operating for the entirety of the pre-heating window, as once it reaches the target setpoint we would expect it to begin cycling to maintain the temperature.
Similarly, during the flexibility window, once the temperature cools to the setpoint the heat pump will begin to operate to prevent it from decreasing further. This means that it may consume some electricity during the flexibility window, but less than it would without the intervention.
This approach meant that our intervention did not aim to maximise demand reduction, as simply turning the heat pump off theoretically would. Our aim was to achieve the maximum demand reduction within the constraints of thermal comfort and acceptability, so maintaining a minimum temperature was an important feature.
Figure 15. Schematic of our intervention, displaying energy consumption of the heat pump across time.
As discussed in Section 1, the setpoints used in the two windows were based upon temperatures provided by participants. The figure below represents how we would use these setpoints to send control signals to the heat pump.
Figure 16. Schematic of our intervention, displaying setpoints for the smart thermostat across time
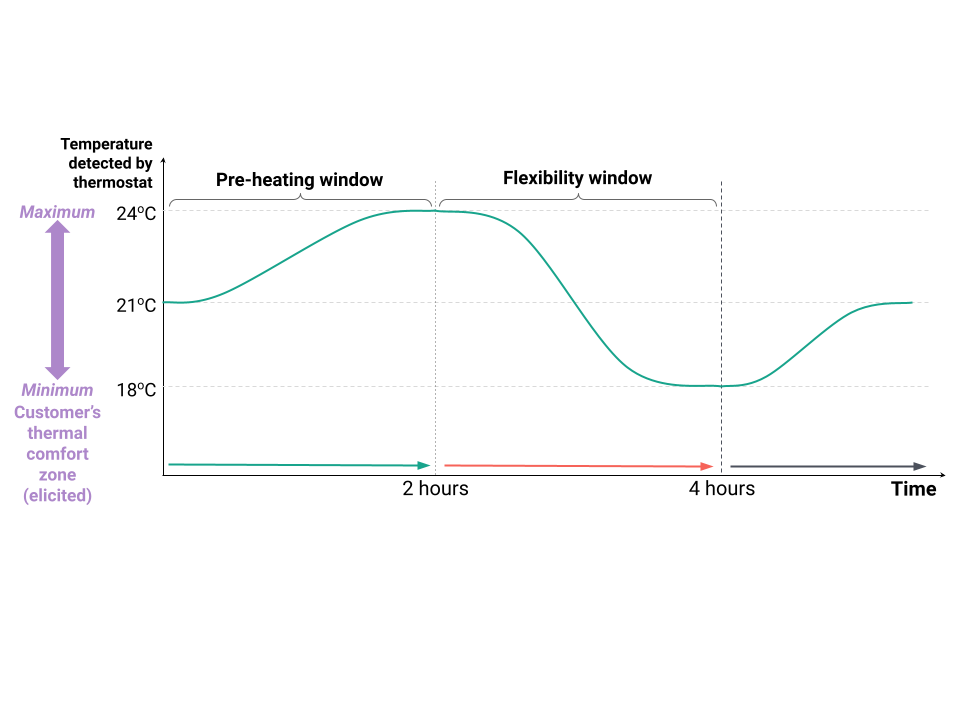
We acknowledge that the above diagrams present the intervention purely conceptually, without the confounding factors which might affect it in a real home.
Opt-outs
We provided participants with two ways to opt out of participating in events:
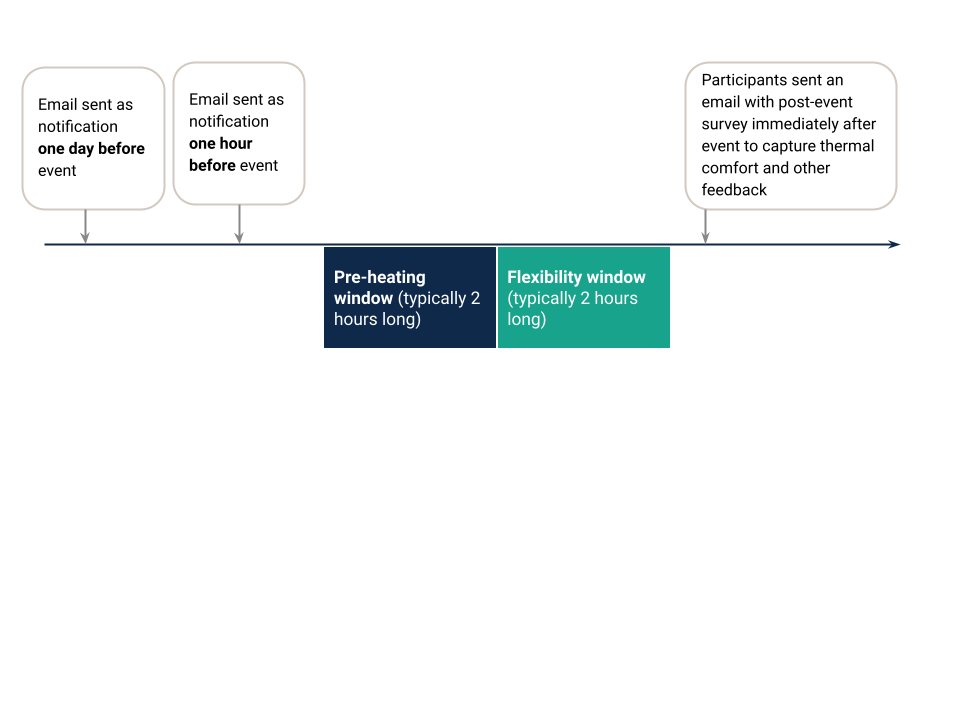
1Pre-event: We sent emails 24 hours in advance to the primary participant with the option of opting out of events up until one hour before. We instructed participants to opt out if they were not going to be at home during the event to avoid pre-heating their homes needlessly.
2In-event: Participants were able to revert their heating to normal by changing the settings on their smart thermostat. We informed participants that they could do this at any point, for any reason, and did not need to endure temperatures that they found uncomfortable. This was intended to minimise participant discomfort during events.
We still asked participants to complete the post-event survey if they opted out so we could understand why.
4.2 Participant communications around events
During the pilot there were three rounds of communication per event:
- Email 24 hours in advance: The email notified participants of the date and time of the event, and gave the option to opt out.
- Reminder email one hour before: The email was sent to the participants who had not yet opted out.
- Post event email: This email contained a link to a post-event survey. One reminder email was sent the day after each event to any participants who had not completed the survey.
Figure 17. Notifications and feedback before and after events
4.3 Data collection
Our pilot involved a number of primary data sources, including interviews, survey and smart-meter data. This section summarises our approach to collecting these data.
Smart-meter data analysis
Smart-meter data for each household was collected from December 2022 to May 2023 at half hourly resolution. The actual consumption on non-event days was compared to event days using:
- Metered consumption
- Regression approach
In the baselining approach, the above methodology was used to estimate consumption on a similar day using historical smart-meter data. The average consumption in individual half hours was compared to the baseline. In the absence of a control group, we can compare average daily consumption on HeatFlex days with non-HeatFlex days. It was possible to compare against typical Octopus Energy customers, but HeatFlex customer demand profiles were too dissimilar.
The regression approach looked at consumption with half-hourly fixed effects, monthly fixed effects and heating degree days to take into consideration diurnal and seasonal cycles as well as impacts from temperature.
P376 with in-day adjustment
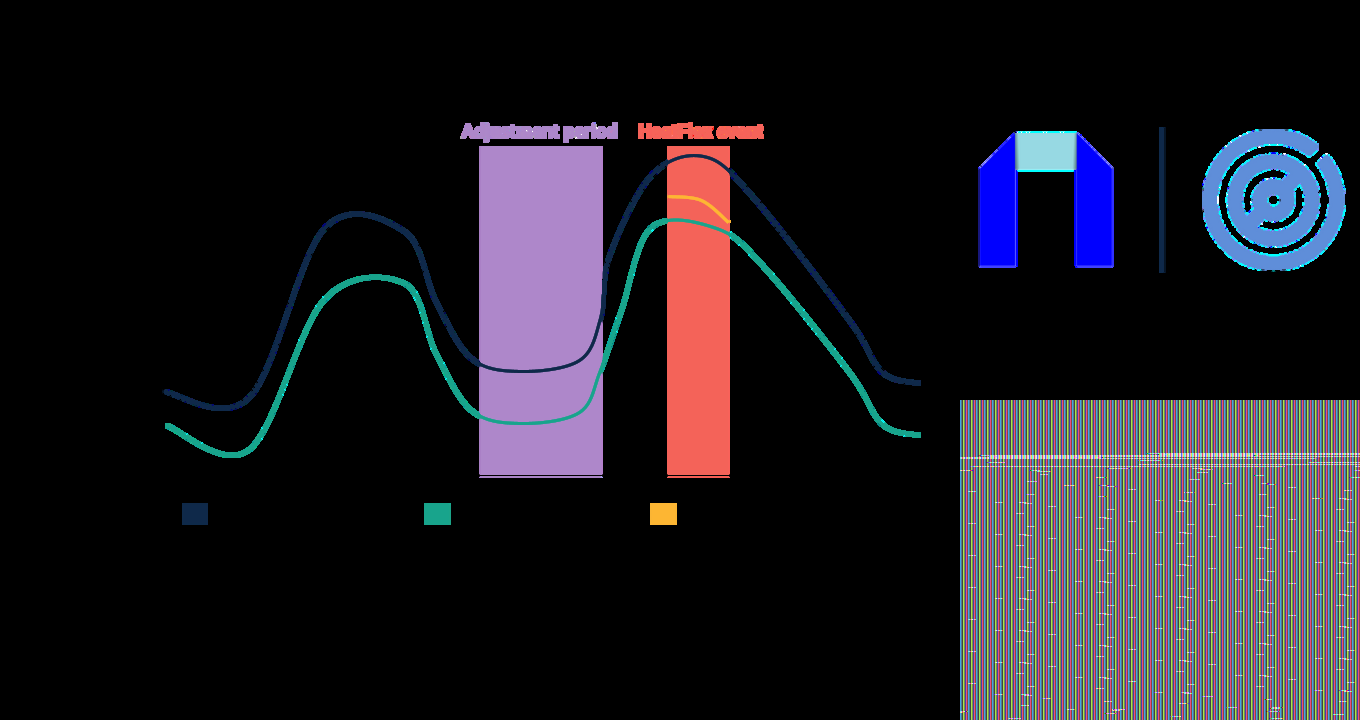
The adjusted P376 baseline methodology is provided by Elexon, and is used for National Grid ESO’s Demand Flexibility Service. This methodology creates an unadjusted baseline using an average of the consumption from the same half-hourly period in the most recent:
- 10 working days for a working day
- 4 non-working days for a non-working day.
It is important to look at the daily consumption of each of these four non-working days and use the two days that have the medium daily consumption, excluding the day that has the highest and lowest daily consumption.
We defined an 'adjustment period' of three hours, ending one hour before the HeatFlex event began, similar to the way that baselining worked for the demand flexibility service during winter 2022-2023. The average error in the adjustment period is added to the unadjusted baseline to correct for any same-day trends (increased or decreased heating demand, atypically being at home or out of the home for the whole day, etc.)
Figure 18. Schematic of P376 baseline for events
4.4 Surveys
We sent online surveys to participants at various points throughout the pilot.
- At the start of the pilot, we collected research consent and participants' thermal preferences via a survey. Participants also provided consent for us to collect, store and use their personal data.
- After each event, we sent emails with links to online surveys to capture experiences of events or reasons why participants opted out of events. We sent reminder emails to participants who had not completed the survey to increase completion rates.
- After the final event, we sent an email with a link to a final survey to capture wider thoughts and experiences about the pilot.
4.5 Interviews
We conducted 19 semi-structured interviews before the pilot began, with individuals with differing levels of technical literacy and engagement in their energy use. We explored people's expectations and assumptions about heat flexibility, and of participating in the pilot.
Headline findings from initial interviews
Behavioural
- The majority of participants considered a per-event opt-out option to be necessary for participation. They gave a range of reasons such as negative impacts to utility bills, events during inconvenient times and simply wanting to have the option.
- The vast majority of interviewees were happy with the idea of their heat pump being remotely automated by a third party. Only one participant indicated that they would not accept their heat pump being remotely controlled, as they were unsure how it would benefit them.
Technical
- Almost all participants had solar panels and more than half had batteries.
- Seven participants had secondary heating sources such as log burners or electric blankets.
- Interest in the pilot was primarily around the mechanism that would be used to automate demand from their heat pump, and what they could learn to improve their own heating system by participating.
- Others were interested in participating so that they could set a green example to others.
Expectations of participating
- There was a mixed response to the expected frequency of events with five responses saying two to three times per week, four saying every day, and three saying one per week.
- There were a range of potential concerns with the pilot, including fear of increased utility bills, internal temperatures dropping too much, and events being too long.
- Interviewees anticipated a range of incentives or benefits for participating, such as keeping the smart thermostat provided, energy savings, results from the research, financial incentives and price guarantees. However most participants expected no incentive for participation.
Mid-point interviews
Half way through the pilot we interviewed five participants for one hour about their experience. We tried to speak to participants with a range of characteristics such as technical literacy, other household members, and who had engaged less with the research team via the dedicated inbox. Two of the five interviews took place with both adult members of the household present. The interviews were structured around two topic areas, and a floor plan exercise that is detailed subsequently.
Prior and post comms
In this topic section we asked the participants how they had found the use of emails for notifications of events, whether they had been unaware of any events due to missed notifications, and if they had a preferred method of notification. We also asked the participants about how they had found the post-event surveys and whether they had any issues with the questions or time taken to complete them.
Experience of events
Two areas that we felt needed to be explored in greater detail were other household members' experiences, and possible impacts to hot water availability during events.
To do this, we asked participants about their hot water usage during events and whether they had noticed anything unusual. The interviewees were prompted to provide examples of times when they or other household members would typically use hot water. We also asked participants to detail their hot water production schedules to determine whether they could have any impact on electricity use during our event windows.
We then asked how the individual members of their households had experienced the events, such as whether they had been aware of them taking place or had any preferences that differed from the primary participant. Two interviews were with both adult household members (the primary participant and their partner), and in these we asked each of them about this separately.
Floor plans methodology
As part of these mid-pilot interviews, we wanted to build an understanding of the impact that participants' behaviour, the fabric of the building and the technology interacted to contribute to the participants' experience of flexibility events and the potential impact on demand reduction.
We asked that participants supply a floorplan of their home, detailing as much as possible the location of windows and doors across all the floors of their home. These were then digitised by our team so that we could use this floorplan as a prompt during the interviews.
During the interviews, we used an interactive whiteboard so that participants could contribute to the floor plan in real time. We asked the participant to highlight on the floor plan:
- the location of the hot water cylinder
- the location of the heat pump outdoor unit
- the location of any smart TRVs
- the primary location of the thermostat
- any areas of the property that were hot or cold during the flexibility events
- whether doors were predominantly open or closed
- the location and type of heat emitters.
Once we had added the layers of detail to the floorplan we then asked questions to look at the behaviours and habits of participants during events. For example, we were able to gain an understanding of where participants were for the majority of events, whether they changed any settings on heating controls other than the smart thermostat and how their experiences differed between morning and evening events.
Endnotes
Centre for Net Zero
5th Floor, UK House, 2 Great Titchfield Street
London W1D 1NN
[email protected]
@CentreNetZero
company/centre-for-net-zero
centrefornetzero.org
Nesta
58 Victoria Embankment
London EC4Y 0DS
+44 (0)20 7438 2500
[email protected]
@nesta_uk
nesta.uk
nesta.org.uk
ISBN: 978-1-916699-04-5
Nesta is a registered charity in England and Wales with company number 7706036 and charity number 1144091. Registered as a charity in Scotland number SC042833. Registered office: 58 Victoria Embankment, London EC4Y 0DS.