Abstract
In this paper we propose an approach, based on structured analysis of online help-wanted advertisements (want ads), for producing low-cost, flexible and real-time estimates of innovative jobs by national, regional, and local levels. We show how this methodology can be used to analyze the geography of innovation in the UK. First we develop the basic procedures for the want-ad approach. Then using U.S. data, we show how the want-ad approach accurately tracks the distribution of computer and mathematical occupations across U.S. states. We then estimate the total number and the distribution of IT occupations, big data occupations, and medtech occupations in the United Kingdom. The paper ends with a discussion of how the want-ad approach can be used as a low-cost methodology for tracking innovative jobs, even on a very local level. We suggest it should be in the tool kit of any economic planning agency.
Keywords: Innovation, jobs, want ads, data collection, Employment, Big data, IT
The Nesta Working Paper Series is intended to make available early results of research undertaken or supported by Nesta and its partners in order to elicit comments and suggestions for revisions and to encourage discussion and further debate prior to publication (ISSN 2050-9820). © Year 2015 by the author(s). Short sections of text, tables and figures may be reproduced without explicit permission provided that full credit is given to the source. The views expressed in this working paper are those of the author(s) and do not necessarily represent those of Nesta.
- FIGURE 1: IT-RELATED OCCUPATIONS AND EMPLOYMENT.................................................................................... 8
- FIGURE 2: KEYWORD LIST FOR IT OCCUPATIONS.................................................................................................. 9
- FIGURE 3: COMPUTER AND MATHEMATICAL OCCUPATIONS BY U.S. STATE: EMPLOYMENT VS. HELP-WANTED ADS, NORMALIZED 10
- FIGURE 4: ACCOUNTING OCCUPATIONS BY U.S. STATE: EMPLOYMENT VS. HELP-WANTED ADS, NORMALIZED............................ 11
- FIGURE 5: ENGINEERING OCCUPATIONS BY U.S. STATE: EMPLOYMENT VS. HELP-WANTED ADS, NORMALIZED........................... 11
- FIGURE 6: LEGAL OCCUPATIONS BY U.S. STATE: EMPLOYMENT VS. HELP-WANTED ADS, NORMALIZED.................................. 11
- FIGURE 7: PHYSICAL AND LIFE SCIENTIST OCCUPATIONS BY U.S. STATE: EMPLOYMENT VS. HELP-WANTED ADS, NORMALIZED.... 11
- FIGURE 8: CARPENTER OCCUPATIONS BY U.S. STATE: EMPLOYMENT VS. HELP-WANTED ADS, NORMALIZED........................... 11
- FIGURE 9: SUMMARY OF OCCUPATION-WANT AD-STATE REGRESSIONS.................................................................... 12
- FIGURE 10: COMPUTER AND MATHEMATICAL OCCUPATIONS BY U.S. STATE: EMPLOYMENT VS. HELP-WANTED ADS, NORMALIZED (CONFERENCE BOARD)........................................................................................................... 13
- FIGURE 11: COMPUTER AND MATHEMATICAL OCCUPATIONS BY U.S METRO AREAS: EMPLOYMENT VS. HELP-WANTED ADS, NORMALIZED (CONFERENCE BOARD)........................................................................................................... 13
- FIGURE 12: U.K. GEOGRAPHIC AREAS........................................................................................................... 14
- FIGURE 13: HELP-WANTED ADS FOR IT OCCUPATIONS, NOVEMBER 2014.................................................................. 15
- FIGURE 14: BENCHMARK CALCULATIONS: IT JOBS VS. IT WANT ADS........................................................................ 15
- FIGURE 15: ESTIMATED EMPLOYMENT FOR IT OCCUPATIONS, NOVEMBER 2014.......................................................... 16
- FIGURE 16: KEYWORD LIST FOR BIG DATA OCCUPATIONS..................................................................................... 17
- FIGURE 17: HELP-WANTED ADS FOR BIG DATA OCCUPATIONS, MARCH 2015............................................................. 17
- FIGURE 18: ESTIMATED EMPLOYMENT FOR BIG DATA OCCUPATIONS, MARCH 2015..................................................... 18
- FIGURE 18A: ESTIMATED EMPLOYMENT FOR BIG DATA OCCUPATIONS, MODIFIED KEYWORD LIST, MARCH 2015.................... 18
- FIGURE 19: KEYWORD LIST FOR MEDTECH DEVELOPMENT WORKERS...................................................................... 20
- FIGURE 20: MEDTECH WANT ADS, NOVEMBER 2014.......................................................................................... 20
- FIGURE 21: BENCHMARK CALCULATIONS: CHEMICAL AND BIOLOGICAL JOBS VS. WANT ADS.......................................... 21
- FIGURE 22: ESTIMATED EMPLOYMENT FOR MEDTECH OCCUPATIONS, NOVEMBER 2014................................................ 21
- FIGURE 23: STABILITY ANALYSIS: IT OCCUPATIONS........................................................................................... 22
- FIGURE 24: STABILITY ANALYSIS: BIG DATA OCCUPATIONS.................................................................................. 22
- FIGURE 25: POOLED VALIDATION RATIO........................................................................................................ 23
- FIGURE 26: COMPARING THE UNITED KINGDOM AND THE UNITED STATES, NOVEMBER 2014........................................... 25
Executive Summary
Late 2014 and early 2015 saw the publication of three excellent and detailed research studies on the size and geography of the United Kingdom's tech economy. "Mapping Information Economy Businesses With Big Data: Findings for the UK" (Nathan, Rosso and Bouet, 2014) used a commercial database to examine the prevalence of information economy businesses by geography. "The Geography of The UK's Creative and High-Tech Economies" (Bakhshi, Davies, Freeman and Higgs, 2015) relied on an innovative and detailed analysis of the Annual Population Survey, a government survey administered by the Office for National Statistics. Finally, "Tech Nation: Powering The Digital Economy 2015" (Tech City UK, 2015) drew on government data and a specially commissioned survey of 2000 companies.
The impressive depth and formidableness of these studies makes them crucial resources for national and regional policymakers. While the three studies each provide a distinctive perspective on the tech/digital/creative economy, taken together they provide unparalleled insights into the nature of UK innovativeness.
However, by their nature, such benchmark studies are time-consuming, expensive, and bounded in many ways by the availability of government statistics and by the need to pay for expensive surveys. In this paper we propose a complementary approach to analyzing the geography of innovation in the UK. Our approach, based on structured analysis of online help-wanted advertisements (want ads), produces low-cost, flexible and real-time estimates of innovative jobs by national, regional, and local levels.
This want-ad approach was first developed by South Mountain Economics as a way of estimating the number of "App Economy" jobs in the United States. (Mandel, 2012; Mandel and Scherer, 2012). It does not replace the sort of large-scale benchmark studies cited above. However, this estimation procedure uses publicly available want-ad data that is updated in real-time, and can be easily adapted to the particular and unique needs of individual economic development agencies or policy-making bodies. Moreover, the want-ad approach is very flexible and can be used to track the jobs and economic activity associated with almost any innovative growth technology.
In this paper, we develop the basic procedures for the want-ad approach. Then using U.S. data, we show how the want-ad approach accurately tracks the distribution of computer and mathematical occupations across U.S. states. We also show how the want-ad approach does relatively well tracking the distribution of accounting, engineering, legal, and physical and life scientist occupations across U.S. states. However, the want-ad approach did not give an accurate picture of the distribution of carpenters.
We then turn to the distribution of IT occupations, big data occupations, and medtech occupations in the United Kingdom. For IT occupations, the want-ad approach suggests that London has an IT employment of 316,000, while Manchester follows with an IT employment of 60,000. These accord well with the results of the Tech City UK study.
We then look at the number and distribution of big data occupations in the United Kingdom. We use two different specifications of keywords, yielding estimates of 203,000 and 119,000 big data jobs in the United Kingdom, respectively. The wide range shows that the absolute level of employment generated by the want-ad approach depends both on the keywords and the benchmark used. However, the distribution of jobs stays roughly same, with London having 43% and 47% of the big data jobs, respectively.
Next we define a keyword list for medtech jobs. This keyword list intentionally excludes want ads including words such as nurse, patient, and sales, in order to focus only on technology-related jobs, rather than sales or patient care. We estimate that there are 26,000 medtech jobs in the United Kingdom, out of which only 17% are in London.
The study ends with a discussion of how the want-ad approach can be used as a low-cost methodology for tracking innovative jobs, even on a very local level. We suggest it should be in the tool kit of any economic planning agency.
1. Introduction
Late 2014 and early 2015 saw the publication of three excellent and detailed research studies on the size and geography of the United Kingdom's tech economy. "Mapping Information Economy Businesses With Big Data: Findings for the UK" (Nathan, Rosso and Bouet, 2014) used a commercial database to examine the prevalence of information economy businesses by geography. "The Geography of The UK's Creative and High-Tech Economies" (Bakhshi, Davies, Freeman and Higgs, 2015) relied on an innovative and detailed analysis of the Annual Population Survey, a government survey administered by the Office for National Statistics. Finally, "Tech Nation: Powering The Digital Economy 2015" (Tech City UK, 2015) drew on government data and a specially commissioned survey of 2000 companies.
The impressive depth and formidableness of these studies makes them crucial resources for national and regional policymakers. While the three studies each provide a distinctive perspective on the tech/digital/creative economy, taken together they provide unparalleled insights into the nature of UK innovativeness.
However, by their nature, such benchmark studies are time-consuming, expensive, and bounded in many ways by the availability of government statistics. In this paper we propose a complementary approach to analyzing the geography of innovation in the UK. Our approach, based on structured analysis of online help-wanted advertisements (want ads), produces low-cost, flexible and real-time estimates of innovative jobs by national, regional, and local levels.
This want-ad approach was first developed by South Mountain Economics as a way of estimating the number of "App Economy" jobs in the United States. (Mandel, 2012; Mandel and Scherer, 2012). It does not replace the sort of large-scale benchmark studies cited above. However, this estimation procedure uses publicly available want-ad data that is updated in real-time, and can be easily adapted to the particular and unique needs of individual economic development agencies or policy-making bodies. Moreover, the want-ad approach is very flexible and can be used to track the jobs and economic activity associated with almost any innovative growth technology.
This want-ad approach is an example of the use of big data for economic and social policy decisions, which is a subject of intense research these days (Einav and Levin, 2013). Perhaps a more precise but less evocative term for big data in this context is 'business practice' data:
Increasingly, however, businesses and individuals are generating detailed electronic data in the normal course of their economic activity. Such data are available either in a firm's administrative records, publicly on the web, or from third parties that collect them in the normal course of economic activity, and can be obtained in digital form from a given firm. Such nontraditional data are referred to here as "business practice" data. (National Research Council, 2014)
In other words, in today's increasingly connected world, economic and social policymakers can make good use of real-time data that is generated in the normal course of business, rather than relying solely on expensive and time-consuming surveys that may often take years to launch and process.
One particular area of interest where big data or business practice data can be especially helpful is tracking innovation. Innovative industries and jobs, almost by definition, fall outside the existing categories collected by government statisticians. For example, 'website designer' existed as an occupation for years before it was incorporated in the 2010 Standard Occupational Classification. The business category 'mobile app development firm,' which dates back perhaps to 2008 or 2009, is still not part of the industrial classification scheme in any country.
Policy analysts also have to contend with the possibility that familiar industry and occupation categories have evolved to the point that they no longer mean the same thing. For example, many innovative manufacturers have increasingly focused on R&D, design, and marketing, while outsourcing the actual production to other enterprises both domestic and abroad. In this way, innovative and successful manufacturing firms create different kinds of jobs than in the past.
Policymakers on the national and local levels are often interested in the location of innovation. For example, the 2010 report "Creative Clusters and Innovation" identified the location of creativity-related jobs in the U.K. (Chapain et al, 2010). Today, policymakers might want to know which areas of their country have clusters of 'big data' jobs, which would signal innovative activity. Local economic development officials might like to know if their area is being successful compared to other areas in terms of attracting innovative industries or jobs.
Similarly, if the U.K. national government funds a new research center in an advanced technology at a university, it would be quite useful to have a systematic and real-time indicator of whether related jobs are being created in the surrounding area. On a national level, a systematic and real-time comparison of big data jobs in the United Kingdom and the United States might help inform workforce policy in both countries.
Conventional government data sets often provide little insight into these questions. The 2010 creativity study mentioned above was able to use a broad industry definition of creative jobs. However, government labor market surveys are not detailed enough to identify robotics-related or big data jobs. Indeed, official occupational and industry definitions often far lag the growth of innovative technologies.
This study uses publicly available online data on help-wanted advertisements (want ads) to address the problem of mapping job locations and economic activity for key innovative technologies. The study develops a UK-specific methodology based on the pioneering and widely cited studies quantifying 'App Economy' jobs in the U.S. (Mandel, 2012; Mandel and Scherer, 2012). Note that this 'want-ad approach' combines unstructured and structured data in a novel way.
Using this want-ad approach, this study reports on the location of U.K. jobs associated with three innovative technologies and occupational categories: IT occupations, big data occupations, and medtech occupations. However, the want-ad approach is very flexible and can be used to track the jobs and economic activity associated with almost any innovative growth technology.
Note that innovative economic activity requires hiring people in these innovative occupations. For example, developing innovative big data applications almost by definition requires hiring workers with big data skills. Similarly, it doesn't make sense to say innovative medtech equipment is being developed in a particular region unless companies in that region are hiring people with the appropriate scientific and engineering skills.
In this paper, we develop the basic procedures for the want-ad approach. Then using U.S. data, we show how the want-ad approach accurately tracks the distribution of computer and mathematical occupations across U.S. states. We also show how the want-ad approach does relatively well tracking the distribution of accounting, engineering, legal, and physical and life scientist occupations across U.S. states. However, the want-ad approach did not give an accurate picture of the distribution of carpenters.
We then turn to the distribution of IT occupations, big data occupations, and medtech occupations in the United Kingdom. For IT occupations, the want-ad approach suggests that London has an IT employment of 316,000, while Manchester follows with an IT employment of 60,000. These accord well with the results of the Tech City UK study.
We then look at the number and distribution of big data occupations in the United Kingdom. We use two different specifications of keywords, yielding estimates of 203,000 and 119,000 big data jobs in the United Kingdom, respectively. The wide range shows that the absolute level of employment generated by the want-ad approach depends both on the keywords and the benchmark used. However, the distribution of jobs stays roughly same, with London having 43% and 47% of the big data jobs, respectively.
Next we define a keyword list for medtech jobs. This keyword list intentionally excludes want ads including words such as nurse, patient, and sales, in order to focus only on technology-related jobs, rather than sale or patient care. We estimate that there are 26,000 medtech jobs in the United Kingdom, out of which only 17% are in London.
The study ends with a discussion of how the want-ad approach can be used as a low-cost methodology for tracking innovative jobs, even on a very local level. We suggest it should be in the tool kit of any economic planning agency.
2. Background
This study is based on using online-help wanted ads as a tool to study labor markets for occupations associated with innovative industries. In recent years, it's become the norm for employers seeking workers to list the job openings in a form that is accessible via the Internet. For example, the giant retailer Tesco has a series of web pages devoted to listing available jobs, both in stores and in headquarters. Smaller employers will post their job openings to a specialized job board or to a large site such as Indeed.co.uk. Alternatively, an employer will post the job through an intermediary such as a recruitment company, especially in areas such as technology.
To track jobs and economic impact related to innovative technologies in the U.S., we developed a methodology using online want ads, which have several desirable characteristics as a data source. First, almost every fast-growing Innovative enterprise will use want ads to find the skilled workers they need. Second, these want ads must contain enough information about the needed skills to attract the right workers. Third, these want ads must include some information about the location of the job. Note that this information is available even if openings go through recruitment companies. However, it is much harder to infer the industry of the job.
Finally, in terms of usefulness for analysis, it is extremely helpful that there are several large want-ad aggregators: Firms that specialize in aggregating available want ads from all available sources, updated daily or more frequently. The want ads are presented in a form that is easily searchable by keywords and by location.
In the United Kingdom, two of the want-ad aggregators are Indeed.co.uk and Simplyhired.co.uk. These want-ad aggregators take great care to make their want-ad data as useful as possible for job seekers. That means eliminating stale and duplicate ads; and using sophisticated algorithms to correctly assign ads to the correct geographical locations.
It's necessary to stress two very important points about the data generated by want-ad aggregators. First, for a given search, want-ad aggregators typically provide a count of all the ads that fit the criteria. Conceptually, these are universe counts, not samples.
Second, and seemingly contradictory, different want-ad aggregators may give very different counts of the number of want ads that meet a specific list of criteria. The reason is that they may implement their aging, deduplication, and geography algorithms differently. In addition, some aggregators may do fuzzy search. For example, an April 2014 search for "Android developer" in London yields 453 results for Indeed.co.uk and 1019 results for simplyhired.co.uk. The search for the keyword "economist" in the state of California in the United States yields 79 ads for Indeed.com, while the same search on Simplyhired.com yields 18442 ads (yes, you read that right-it's so high because the board searches on the word "economics" as well). The Conference Board, which has a very useful HWOL database, reports 72 ads for an economist in California.
In addition, as will be discussed in a later section, want ads must be used carefully as a data source. In particular, there is no one-to-one correlation between the number of want ads and the number of vacancies. A company can place one job ad to attract multiple candidates. Meanwhile, an ad will be duplicated on multiple job boards or even on the same job board.
However, properly analyzed, want ads contain an enormous amount of information about local labor markets. For example, an August 2012 Brookings Institution paper used want ads to analyze labor supply and demand mismatch by local metro areas. (Rothwell, 2010)
In 2012, South Mountain Economics produced two studies of the 'App Economy' in the US. The two studies developed a new methodology for analyzing a large real-time database of U.S. online help-wanted ads assembled by The Conference Board. (Conference Board, 2014) The first study analyzed want ads as of December 2011, and estimated that there were 465,000 jobs in the U.S. that either used mobile app-related skills, or were supported by such jobs utilizing those skills. The second study estimated the number of App Economy jobs by state, as of April 2012, along with state-level economic impact of these jobs.
Want ads also contain an enormous amount of information about innovative economic activity (see, for example, National Research Council, 2014). Small startups can be founded by friends or through work networks, without going through a formal hiring process. But once an innovative company gets large enough—say, more than ten or twenty people—it must actively hire and advertise for workers with the necessary cutting-edge skills. For example, a company engaged in development of big data applications must hire and advertise for data scientists and software developers with knowledge of big data programs such as Hadoop.
For that reason, this study focuses on jobs associated with innovative technologies as the main indicator of innovative economic activity. The very definition of innovation is that it is something new, and therefore requires professionals with the skills to create new products and services. By tracking the location of those innovative professionals, we can understand the geographic distribution of innovative activity.
3. The Relationship Between Want Ads and Job Vacancies
Employers place want ads when they have a job vacancy. However, want ad counts contain very different information than job vacancy statistics. The number of job vacancies is a macroeconomic indicator collected by both the U.K. and U.S. statistical agencies. That is, a position is defined as a vacancy if:
- It is newly created and/or unoccupied, or identified as becoming vacant in the near future;
- The employer has taken active steps to fill the position, and is prepared to take more steps; and
- It is available for a suitable candidate, and open to people from outside the business or organisation concerned, either immediately or in the near future after the necessary recruitment procedure.
The businesses are asked the following question:
"How many job vacancies did your business or organisation have on [DATE] for which you were actively seeking recruits from outside your business or organisation?"
In other words, the concept of a 'job vacancy' is specifically designed and standardized to be the mirror of an unemployed worker.' That enables economists to calculate the 'vacancy rate', which is the number of vacancies as a share of total employment. Just as the unemployment rate measures the difficulty that workers have finding jobs, the vacancy rate measures the difficulty that employers have in filling positions. Both the vacancy rate and the unemployment rate are macroeconomic indicators, in the sense that they tell us something about the overall state of the labor market and the economy.
However, the surveys that collect data about unemployed workers are generally much more informative than the surveys that collect information about unfilled positions. Economists generally know the personal characteristics of unemployed workers, including their age, education, race, occupation, and industry. In addition, economists generally know how long they have been unemployed. However, job vacancy surveys generally just report the industry and size of the establishment reporting the vacancy, but very little information about the vacant position itself.
Want ads, by contrast, are problematic as a macroeconomic indicator. First, as bears repeating, there is no one-to-one relationship between want ads and job vacancies. Companies may place a single want ad to fill multiple vacancies. This is especially true for job categories with predictable high turnover, such as retail sales clerks and bank cashiers. Barclays need only place one ad looking for cashiers, even though it may have multiple positions open.
At the same time, multiple ads for the same position may be duplicated multiple times across different job boards. That's especially true in cases where the workers are in high demand, so the employer wants to make sure to gain the maximum visibility for the ad. Some of these duplicates may be easy to remove from the data, but some are more difficult to weed out.
In addition, the number of want ads can vary over time for reasons, which have nothing to do with the underlying state of the labor market. A new job board may open up, or an existing one may disappear. A large employer in a particular city may change the way they post their vacancies.
At least one aggregator, The Conference Board in the U.S., has made sustained efforts to standardize its want ad counts to provide useful information over time. That involves redoing old numbers, for example, as job boards get added and subtracted.
4. Using Want Ads to Map Geographical/Occupational Patterns
The previous section has given the reasons why government surveys of job vacancies and unemployment are specifically designed to be better macroeconomic indicators than want ad counts. However, government surveys are limited in several very important ways.
Government surveys are expensive and viewed as a burden by businesses. They are therefore limited in the questions that can be regularly asked. Limited survey sizes and/ or confidentiality requirements make it difficult to collect information about small geographic areas. It is a slow process to change government data collection to accommodate new and innovative industries and occupations Indeed, the area where government surveys are likely to fall short is precisely those innovative industries and occupations that we care about.
By contrast, want ads carry far more useful information about the nature of employment, including far more detailed location and skill content data than can be obtained from government surveys. We make the claim that for any particular occupation, the geographic distribution of want ads for that occupation can be used to map out the geographic distribution of employment for that occupation. This really breaks down to two claims.
- Claim 1: The number of want ads for an occupation i; in a geographic area g is a good proxy for the gross hires for occupation i in geographic g (where gross hires are all hires, both replacements and new positions).
- Claim 2: Under normal circumstances, the number of gross hires in an occupation and geographic area is closely correlated with the total employment in that occupation in that area.
Claim 1 is common sense, basically—if employers have more open positions to fill for data scientists, say, they run more want ads looking for data scientists. Note that this is true even if not all positions are filled through public want ads.
Claim 2 is more interesting, and depends on some stylized facts about how labor markets work.
- Gross labor market flows, such as gross hires and gross separations, are primarily generated by ordinary turnover and replacement rather than net changes in employment level.
- Different industries within the same country will have significantly different gross hiring rates (hiring as a share of the current workforce)(see OECD 2009, Figure 2.1, for example). This corresponds to different turnover rates. In the U.S., the gross hire rate in the hotel and food service industry in 2013 (total hires as a share of the workforce) was 66%. The gross hire rate in the finance and insurance industry was 26% in 2013.
- The relative ranking of industries by hire rate tends to remain stable over time, so that industries with relatively high hiring rates tend to remain relatively high. Moreover, except during regime changes such as the 2007-2009 financial crisis, the gross hiring ratio for each industry is relatively stable over time.
- Industry-specific factors for hiring appear to be correlated across countries (OECD 2009). That is, industries with high hire rates in one country tend to have high hire rates in other countries. The report notes, "this suggests that industry-specific factors, which apply to all countries, are more important drivers of the creation of jobs and job matches, than of job destruction and separations."
Taken together, these stylized facts suggest that want ads for a particular occupation, in most cases, are a good cross-sectional indicator of employment levels across geographic regions. That is, within a particular occupation, an area with a higher employment level of that occupation will tend also to produce more want ads for that occupation relative to an area with a lower employment level of that occupation.
5. Description of the Data
This study principally uses the public data generated by Indeed.com and Indeed.co.uk, which is part of Indeed. The company calls itself:
Indeed is the #1 job site worldwide, with over 100 million unique visitors per month. Indeed is available in more than 50 countries and 26 languages, covering 94% of global GDP.
Indeed offers an advanced search function for its want-ad database, which is continually being updated. This study used only the total counts generated by Indeed searches, not any of the individual ads.
There are advantages and disadvantages to using Indeed as a source of data. One enormous advantage is that Indeed publishes aggregated want ads for a very wide range of countries, including both the United States and the United Kingdom. The company also uses the same advanced search function for each country's want-ad database. That makes cross-country comparisons relatively easy.
Another benefit of Indeed's want-ad database is that the company has an interest in providing the best search results possible for jobseekers and employers. That means the company develops location algorithms, which are as accurate as possible, while eliminating of stale and duplicated ads. Moreover, the search counts are public. The company notes that "Indeed Web Services may be used free of charge for commercial and non-commercial purposes."
On the other hand, Indeed is in the business of providing the best search results possible for jobseekers and employers. As a consequence, the company may at any point adjust their methodology to better suit the needs of its users. There is no guarantee that data collected over time will be consistent.
Indeed allows for search by city or postcode, with the ability to specify by distance ('only in', 'within 5 miles of', 'within 10 miles of,' and so forth). We chose to search 'within 25 miles of' for all cities except for London, where we chose to search 'within 5 miles of.' The analysis does not change substantively if the radius around London is extended to 10 or 25 miles.
In addition, later in the paper we also use an alternative source of data on want ads for computer and mathematical occupations by state and by metro area, The Conference Board's HWOL database (Conference Board, 2012). An important note here is that The Conference Board and Indeed.com give substantially different absolute want ad counts, both for the economy as a whole and for individual occupations. However, as we will see, our methodology accounts for the differences between the different aggregators.
6. Building Key Word Lists
In order to identify innovative occupations from want ads, we have to construct the appropriate search request. We call the search request a keyword list. Building an effective keyword list for an innovative occupation is more art than science. The goal is to pick up as many of the relevant jobs in the target occupations, while excluding the ones that are not appropriate. That means it's important to understand which job titles are in use, and which skills are relevant to the target occupations.
The good news is that the nature of want ads eases the task of building keyword lists, because the typical want ad specifies several different skills and requirements. That means the keyword list doesn't have to have every possible relevant word in order to hit most of the target ads. For example, one actual want ad was looking for a "Big Data Systems Administrator" with the following competencies.
Big Data System Administrator — Hadoop, MapReduce, HBase, Cassandra, Linux, Puppet, NoSQL
A keyword list incorporating any of those terms will correctly identify this want ad as being a big data occupation. For that reason, expanding the list of keywords eventually reaches the point of diminishing returns.
Here's an example of how the keyword list would work. As of April 2014, blinkbox, an online music and TV streaming service, was advertising for a "Senior Development Engineer, Big Data Reporting - Music". Right in the heading was the keyword phrase 'big data', which as a later section will show, is naturally part of the big data keyword list. Equally important, the ad clearly specifies that the position will be in the blinkbox Oxford office.
The first innovative occupations we examine are the information technology (IT)-related occupations. We start from the U.K. 2010 Standard Occupational Classification, which offers up nine major occupations that are IT-related (see Figure 1). Taken together, these correspond to the United States category of computer and mathematical occupations (with the addition of IT managers). In section 15, we will compare the two directly.
FIGURE 1: IT-RELATED OCCUPATIONS AND EMPLOYMENT
| OCCUPATION TITLE |
EMPLOYMENT (THOUSANDS) APRIL-JUNE 2013 |
| 1136 Information technology and telecommunications directors |
78 |
| 2133 IT specialist managers |
183 |
| 2134 IT project and programme managers |
68 |
| 2135 IT business analysts, architects and systems designers |
102 |
| 2136 Programmers and software development professionals |
274 |
| 2137 Web design and development professionals |
70 |
| 2139 Information technology and telecommunications professionals nec |
151 |
| 3131 IT operations technicians |
100 |
| 3132 IT user support technicians |
87 |
| Total IT Occupations |
1112 |
Data: ONS
We note that this classification list includes managers, professionals, and technicians. We don't believe that the current structure of the IT industry allows one to clearly distinguish, say, between website designers and website operators.
The next task was to construct the keyword list (Figure 2). We started with the 2010 Standard Occupational Classification, volumes 1 and 2. Volume 2, which contained alternative job titles, was particularly helpful (Office for National Statistics, 2010). Then we pared down the list to a reasonable size. The same keyword list can be used for the United States as well.
FIGURE 2: KEYWORD LIST FOR IT OCCUPATIONS
|
| Actuary |
| Android |
| Big data |
| Business analyst |
| Computer programmer |
| Computer science |
| Database |
| Help desk |
| iOS |
| IT project manager |
| Java |
| Linux |
| Network administrator |
| Network technician |
| Software developer |
| Software development |
| Software engineer |
| Software quality assurance |
| Software tester |
| Systems administrator |
| Systems analyst |
| Unix |
| User support |
| Web developer |
Data: South Mountain Economics LLC
7. Testing the Claims
This section presents results that support the hypothesis that there is a close link between the number of want ads for computer and mathematical occupations in a geographic region, and the employment level for computer and mathematical occupations in that geographic region. In addition, we examine other selected occupations, and show that a similar link exists for most but not all of them.
Our data for this section will be drawn from the United States, where the Census Bureau conducts an annual survey called the American Community Survey (ACS) (Census Bureau, 2013). Because the survey contacts 3.5 million households annually, it can provide decent data down to the level of metropolitan statistical areas. In particular, the ACS provides information on employment in computer and mathematical occupations down to the state and metropolitan statistical area, on an annual basis. For example, the ACS reports that in 2013 there were 143,937 workers in Pennsylvania employed in computer and mathematical occupations.
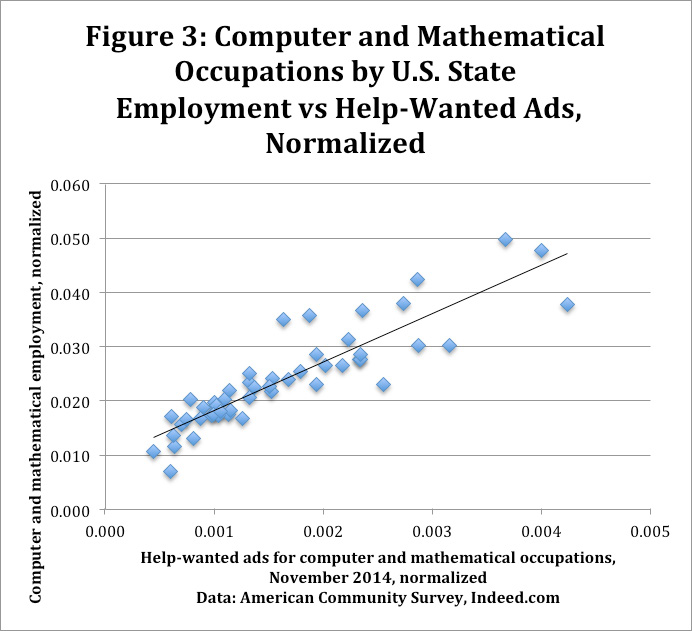
Let's start with a state-level analysis. For each state, we use the keyword list in Figure 2 to get a count of want ads for computer and mathematical occupations for that state as of November 2014. Then we get data on computer and mathematical occupations and total employment by state from the 2013 ACS. Finally, we normalize both the want ad count and computer and mathematical employment by dividing by total employment. So if WAi is the number of want ads for computer and mathematical occupations for state j, CMi is the number of people in computer and mathematical occupations in state i, TOTi is the total employment in state i, then our variables are normalized want ads WAI/TOTi and normalized computer and mathematical CMI/TOTI (this expression represents computer and mathematical employment as a share of employment).
FIGURE 3: COMPUTER AND MATHEMATICAL OCCUPATIONS BY U.S. STATE EMPLOYMENT VS HELP-WANTED ADS, NORMALIZED
Data: American Community Survey, Indeed.com
gression analysis of normalized computer and mathematical jobs on normalized want ads shows a coefficient, which is highly significant at the p<.001 level, and an R2 of .79. States, which have a large number of CM want ads, relative to their employment base, also have a large number of CM jobs.
The implication is that the number of want ads for computer and mathematical occupations by geographical region can be used to develop a fairly accurate estimate of recent computer and mathematical employment in that region. In this case, assuming that employment patterns don't change much over time, recent CM want ads by state enable a good prediction of CM employment in that state.
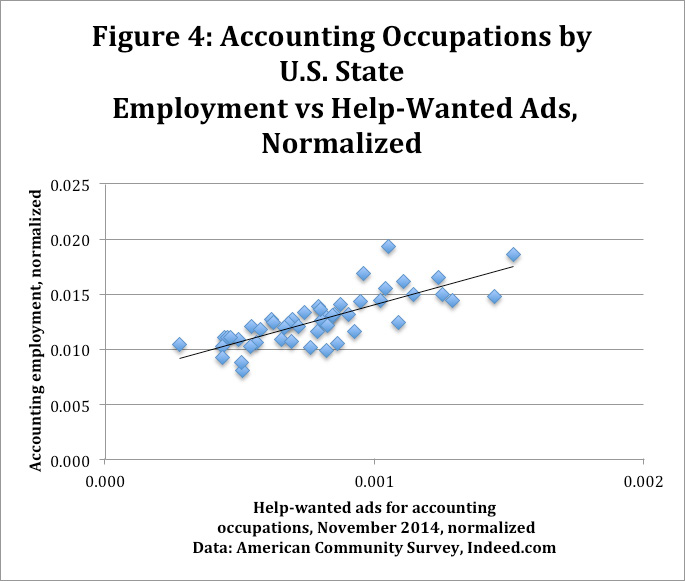
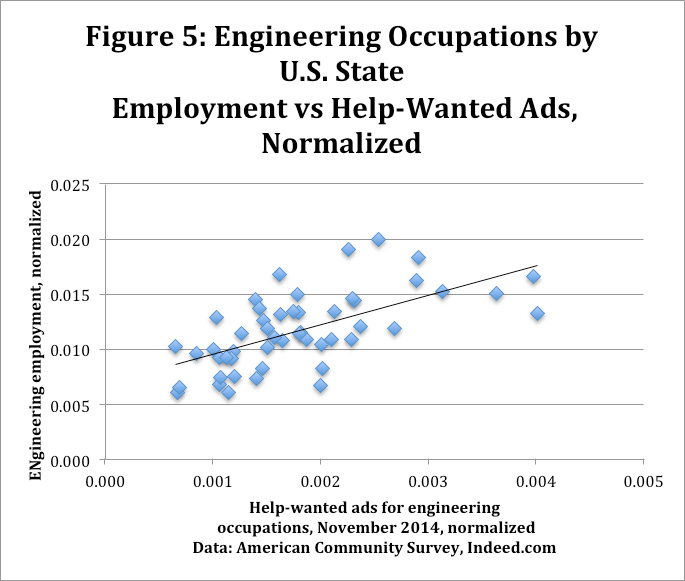
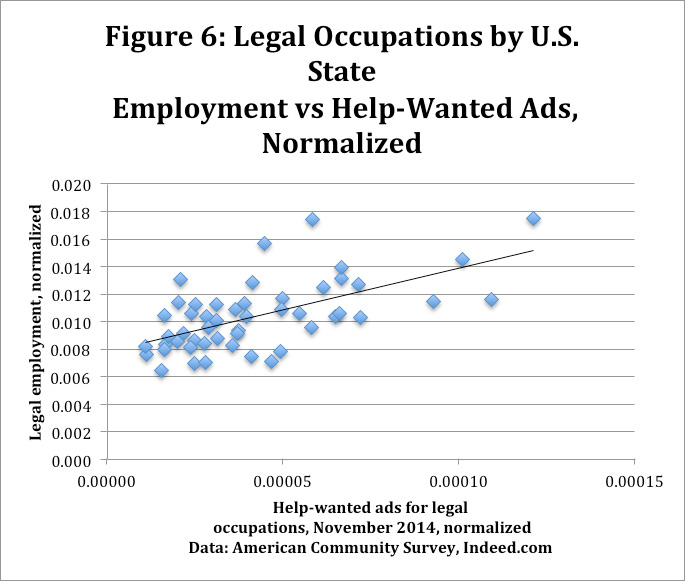
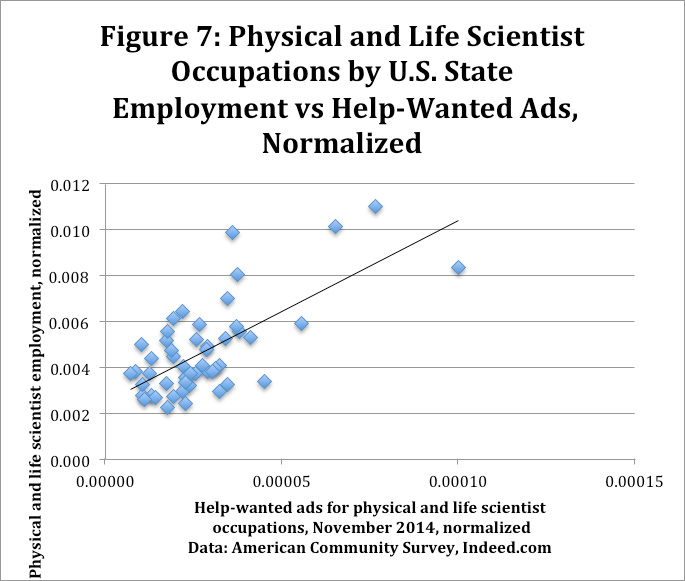
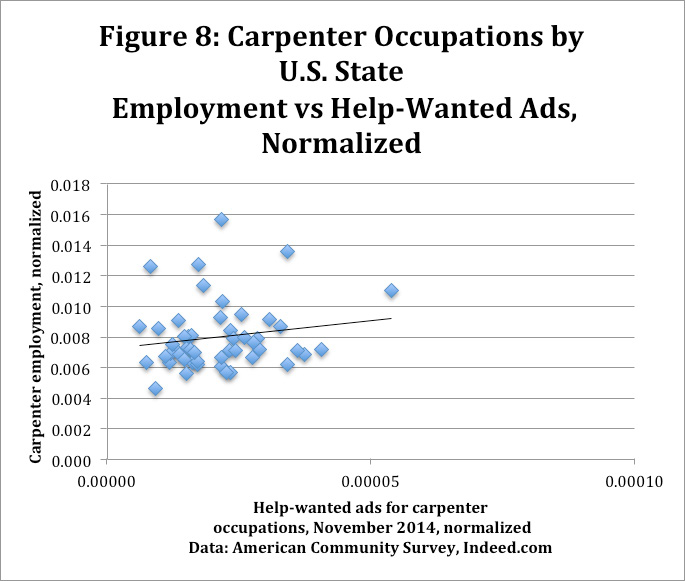
What about other occupations? We did a similar analysis for accounting occupations, engineering occupations, legal occupations, physical and life science occupations, and carpenters (just to throw in one blue collar profession). We show scatterplots of these occupations in Figures 4 through 8, plus a summary of regression results in Figure 9.
The conclusion is that for white-collar skilled occupations, want ads for an occupation in an area appear to contain a considerable amount of information about employment levels for that occupation. However, for carpenters, want ads appear to contain little information about employment.
FIGURE 4: ACCOUNTING OCCUPATIONS BY U.S. STATE [EMPLOYMENT VS HELP-WANTED ADS, NORMALIZED]
Data: American Community Survey, Indeed.com
FIGURE 5: ENGINEERING OCCUPATIONS BY U.S. STATE [EMPLOYMENT VS HELP-WANTED ADS, NORMALIZED]
Data: American Community Survey, Indeed.com
FIGURE 6: LEGAL OCCUPATIONS BY U.S. STATE [EMPLOYMENT VS HELP-WANTED ADS, NORMALIZED]
Data: American Community Survey, Indeed.com
FIGURE 7: PHYSICAL AND LIFE SCIENTIST OCCUPATIONS BY U.S. STATE [EMPLOYMENT VS HELP-WANTED ADS, NORMALIZED]
Data: American Community Survey, Indeed.com
FIGURE 8: CARPENTER OCCUPATIONS BY U.S. STATE [EMPLOYMENT VS HELP-WANTED ADS, NORMALIZED]
Data: American Community Survey, Indeed.com
FIGURE 9: SUMMARY OF OCCUPATION-WANT AD-STATE REGRESSIONS
| OCCUPATION |
KEYWORDS |
COEFFICIENT |
CONSTANT |
R SQUARED |
| Computer and mathematical |
As noted in Figure 2 |
8.9*** |
0.01 |
0.79 |
| Accounting |
Accountant, auditor, accounting |
6.7*** |
0.007 |
0.61 |
| Engineering |
Engineer, engineering |
2.7*** |
0.007 |
0.39 |
| Legal |
Lawyer, paralegal, legal assistant |
60.4*** |
0.008 |
0.37 |
| Life and physical science |
Chemist, physicist, biochemist, biologist, microbiologist, medical scientist |
79.0*** |
0.003 |
0.46 |
| Carpenter |
Carpenter |
37.1 |
0.007 |
0.03 |
*** Significant at the p<.001 level
Each row reports on the regression of the normalized employment in that occupation in 2013 on the normalized count of want ads for that occupation in November 2014.
Data: American Community Survey, Indeed.com, South Mountain Economics LLC
8. An Alternative Data Source
As noted earlier, there are multiple want-ad aggregators, which use different algorithms and arrive at different absolute counts for the number of want ads for a particular occupation and geography. In this section we will look at want ad results for The Conference Board's HWOL database Conference Board, 2012).
Generally speaking, The Conference Board database gives roughly twice as many "computer and mathematical occupation" want ads as does the Indeed database. For example, as of October 2014, the HWOL database was reporting 577 thousand want ads for computer and mathematical occupations (Conference Board, 2014). That compares to 311 thousand want ads for computer and mathematical occupations using the Indeed database and the keywords in Figure 2.
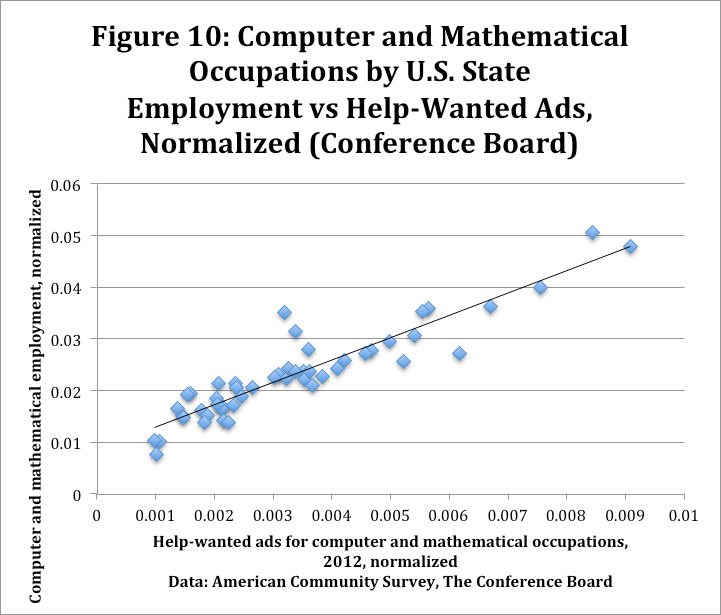
From the perspective of estimating employment, this disparity is not a problem because, as section 10 shows, we benchmark want ads to national employment in either case However, we do want to show that The Conference Board database shows roughly the same qualitative type of link between want ads and information technology want ads and employment as does the Indeed database. We regressed 2012 computer and mathematical employment by state on the number of want ads by state in 2012, drawn from The Conference Board database, normalized by total jobs in each state.
The resulting scatter plot is shown in Figure 10. The regression coefficient of 4.3 is roughly half that of the corresponding regression done on Indeed.com data (as shown in Figures 3 and 9). However, that difference simply reflects the larger counts for The Conference Board data. The regression gives an R2 of 0.85, roughly comparable to the earlier regression.
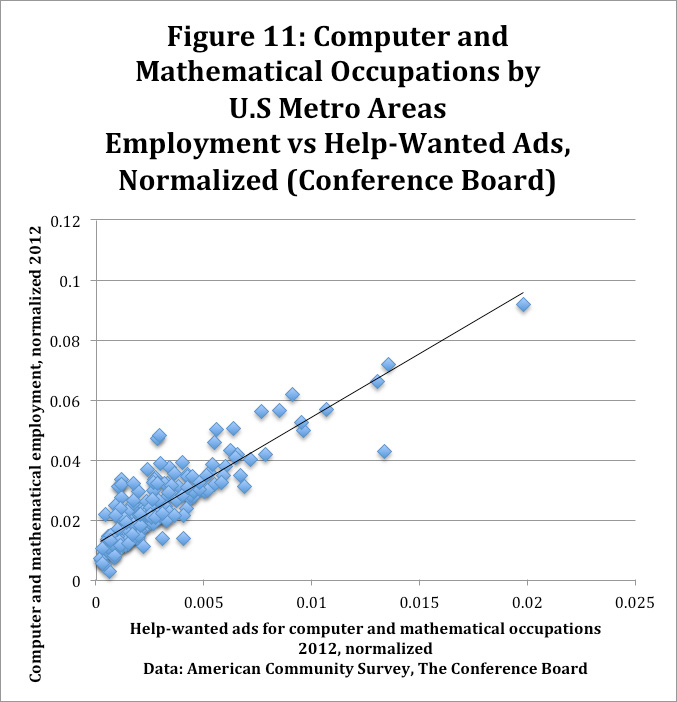
The same exercise was then undertaken for 202 U.S. metropolitan statistical areas for which we had both employment data and Conference Board want-ad data for 2012, normalized by total jobs. The resulting regression showed an almost identical fit, with a coefficient of 4.2 and an R2 of .76.
FIGURE 10: COMPUTER AND MATHEMATICAL OCCUPATIONS BY U.S. STATE [EMPLOYMENT VS HELP-WANTED ADS, NORMALIZED (CONFERENCE BOARD)]
Data: American Community Survey, The Conference Board
FIGURE 11: COMPUTER AND MATHEMATICAL OCCUPATIONS BY U.S METRO AREAS [EMPLOYMENT VS HELP-WANTED ADS, NORMALIZED (CONFERENCE BOARD)]
9. Geographic Areas
The primary goal of the study is to examine the distribution of innovative occupations in the United Kingdom, which would also serve as an indication of economic activity. The geographic list started with the top 25 metropolitan areas, by population, in the United Kingdom, plus Oxford and Cambridge. These university towns are especially strong locations of innovative activity. For example, as of April 2014, Cambridge Broadband Networks, located in Cambridge, was advertising for an "iOS/Android app developer." Natural-Motion, a games developer in Oxford, had several openings, including one for a games programmer.
The study focused on a region of 25 miles (or 40 kilometers) around the central urban areas of each of these metropolitan regions, with the exception of London (5 miles). Upon examination, several locality pairs—for example, Leeds and Bradford—were located within 25 miles of each other, giving them overlapping labor markets by our methodology. After combining these pairs, we were left with 24 central urban areas/geographic regions (Figure 4). These became the focus of our analysis.
Note first that each urban area includes all job locations within 25 miles of the named city. So the area around Leeds includes Bradford, for example, while the 25-mile radius around Oxford includes Reading. In some cases, the 25-mile areas of two localities overlap—for example, Leicester and Nottingham. We judged it better, however, to keep them as separate areas. The overall UK number does not rely on adding up the individual urban areas, so there is no overall duplication.
Note that this approach relies heavily on Indeed's location algorithms to correctly distinguish between geographic locations with similar identical names. For example, Stoke-on-Trent is different from Stoke Bishop in Bristol. However, our tests of the algorithm suggest that it does a very good job.
FIGURE 12: U.K. GEOGRAPHIC AREAS
| CENTRAL POINT |
INCLUDES WITHIN 25 MILES |
| Belfast |
Lisburn |
| Birmingham |
Wolverhampton |
| Bournemouth |
Poole, Christchurch |
| Brighton |
Worthing, Eastbourne |
| Bristol |
Bath |
| Cambridge |
Huntingdon |
| Cardiff |
Newport |
| Edinburgh |
Kirkcaldy |
| Glasgow |
Stirling |
| Hull |
Beverley |
| Leeds |
Bradford |
| Leicester |
Loughborough |
| Liverpool |
Southport |
| London |
5-mile radius* (ie Brixton) |
| Manchester |
Blackburn |
| Middlesbrough |
Stockton-on-Tees |
| Newcastle |
Sunderland |
| Norwich |
Lowestoft |
| Nottingham |
Derby |
| Oxford |
Aylesbury, Reading |
| Sheffield |
Doncaster |
| Southampton |
Portsmouth |
| Stoke-on-Trent |
Stafford |
| Swansea |
Neath |
*Any job tagged as 'London' will show up in this category, even if it is outside the 5-mile radius
Data: South Mountain Economics LLC
10. Example: Information Technology Occupations
We did multiple data draws, in August 2013, April 2014, and November 2014. The November 2014 data is used for geographic analysis, while the two earlier data draws are used for stability analysis (section 13). Each data draw gave us a count of IT occupation ads by geographic area, as well as a count for the United Kingdom as a whole (Figure 13).
The next step is to translate want ad counts into employment estimates. This requires two steps. First, we need to compare the total number of IT occupation want ads with the total IT occupational employment for the country (Figure 14). The latest published data on detailed occupational employment from the Office of National Statistics comes from April-June 2014 (ONS 2014, table emp04). These figures include both the self-employed and people working for employers.
Then we divide the national employment level for IT related occupations by the number of want ads. This gives us a job/want ad multiplier of 11.4. In other words, each IT occupation want ad translates into 11.4 people in IT occupations.
We then apply the job/want ad multiplier directly to the counts from Figure 13. The results shown in Figure 15 provide a mapping of the location of IT-related jobs and IT-related economic activity in the United Kingdom. For example, Manchester and surrounding area is estimated to have 60,000 people in IT-related occupations as of November 2014, while Leeds is estimated to have 46,000.
FIGURE 13: HELP-WANTED ADS FOR IT OCCUPATIONS, NOVEMBER 2014
|
NUMBER |
SHARE |
| London |
27711 |
28.5% |
| Manchester |
5269 |
5.4% |
| Birmingham |
4794 |
4.9% |
| Oxford |
4306 |
4.4% |
| Leeds |
4042 |
4.2% |
| Cambridge |
3209 |
3.3% |
| Leicester |
3078 |
3.2% |
| Bristol |
2838 |
2.9% |
| Southampton |
2756 |
2.8% |
| Nottingham |
2610 |
2.7% |
| Brighton |
2566 |
2.6% |
| Liverpool |
2358 |
2.4% |
| Sheffield |
2123 |
2.2% |
| Stoke-on-Trent |
1817 |
1.9% |
| Edinburgh |
1812 |
1.9% |
| Bournemouth |
1564 |
1.6% |
| Glasgow |
1459 |
1.5% |
| Belfast |
1351 |
1.4% |
| Cardiff |
1216 |
1.3% |
| Newcastle |
1020 |
1.0% |
| Norwich |
574 |
0.6% |
| Middlesbrough |
396 |
0.4% |
| Swansea |
263 |
0.3% |
| Hull |
253 |
0.3% |
| Total UK |
97186 |
|
Data: Indeed.co.uk, South Mountain Economics LLC
All ads collected at 25-mile limit except for London, which is 5 miles.
FIGURE 14: BENCHMARK CALCULATIONS: IT JOBS VS. IT WANT ADS
|
|
| Employment in IT occupations, April–June 2014 (thousands of workers) |
1112 |
| Total IT want ads, November 2014 |
97186 |
| Estimated jobs per want ad |
11.4 |
Data: ONS, Indeed.co.uk, South Mountain Economics LLC
These numbers can be compared to the local figures for workers in digital companies generated by the Tech City UK study (2015), which shows 56,000 workers in digital companies in Manchester, and 45,000 in Leeds.
For some regions there is an apparently wide differential between the want-ad approach and the Tech City UK estimates. For example, we estimate 49,000 IT jobs in Oxford, while Tech City UK only estimates 22,000. In that case the difference has to do with the definition of regions. We use a 25-mile radius around all non-London cities. For Oxford that radius includes Reading, barely, whereas the Tech City study treats Reading as a separate area. Using a 10-mile radius around Oxford would have given us a much closer match with the Tech City study.
FIGURE 15: ESTIMATED EMPLOYMENT FOR IT OCCUPATIONS, NOVEMBER 2014
|
ESTIMATED JOBS (THOUSANDS) |
| London |
316 |
| Manchester |
60 |
| Birmingham |
55 |
| Oxford |
49 |
| Leeds |
46 |
| Cambridge |
37 |
| Leicester |
35 |
| Bristol |
32 |
| Southampton |
31 |
| Nottingham |
30 |
| Brighton |
29 |
| Liverpool |
27 |
| Sheffield |
24 |
| Stoke-on-Trent |
21 |
| Edinburgh |
21 |
| Bournemouth |
18 |
| Glasgow |
17 |
| Belfast |
15 |
| Cardiff |
14 |
| Newcastle |
12 |
| Norwich |
7 |
| Middlesbrough |
5 |
| Swansea |
3 |
| Hull |
3 |
| Total UK |
1112 |
Data: ONS, Indeed.co.uk, South Mountain Economics LLC
Job/ad multiplier = 11.4
11. Example: Big Data Occupations
Big data, a term in widespread use these days, used to be defined as the
"collection of data sets so large and complex that it becomes difficult to process using on-hand database management tools or traditional data processing applications." (Wikipedia 2014)
However, 'big data' is increasingly defined in terms of an approach that relies heavily on data as a way of defining and solving problems. From that perspective there are two ways to identify big data occupations. First, there is a class of new job titles, such as 'data scientist,' which are clearly defined as big data occupations. When employers advertise for a data scientist, there is no doubt that they want a big data worker.
However, big data jobs can also be identified by the skills required. In particular, there are a number of specific big data programs, such as Hadoop and Cassandra, which are necessary for anyone who needs to work with very large data sets.
So when we put together the 'big data' keyword list, we include both big data job titles and big data-related skills (Figure 16). Note that we are not restricting big data want ads to be IT want ads, as defined in Figure 2. It's possible for a want ad for an economist or a biochemist to require big data skills. However, we would expect most of the big data want ads to also be identified as IT occupation want ads.
FIGURE 16: KEYWORD LIST FOR BIG DATA OCCUPATIONS
|
| "Big Data" |
| "Bigdata" |
| "Cassandra" |
| "Data Analyst" |
| "Data Analytics" |
| "Data Engineer" |
| "Data Scientist" |
| "Data Warehouse" |
| "Hadoop" |
| "MapReduce" |
| "MongoDB" |
| "Nosql" |
| "Python" |
| "Scala" |
Data: South Mountain Economics LLC
The data for the big data want ads was drawn in November 2013, April 2014, November 2014, and March 2015. The geographic distribution for March 2015 is presented in Figure 17. Note that big data jobs are more concentrated in London (42.6% of all want ads) than IT-related occupations (where London has 28.5%). Next come Oxford and Cambridge, with 5.0% and 4.5% respectively. By contrast, Manchester is second on the IT-occupation list.
FIGURE 17: HELP-WANTED ADS FOR BIG DATA OCCUPATIONS, MARCH 2015
|
NUMBER |
SHARE |
| London |
7601 |
42.6% |
| Oxford |
884 |
5.0% |
| Cambridge |
803 |
4.5% |
| Leeds |
652 |
3.7% |
| Manchester |
563 |
3.2% |
| Bristol |
536 |
3.0% |
| Birmingham |
507 |
2.8% |
| Edinburgh |
416 |
2.3% |
| Brighton |
360 |
2.0% |
| Leicester |
348 |
2.0% |
| Southampton |
336 |
1.9% |
| Nottingham |
287 |
1.6% |
| Glasgow |
277 |
1.6% |
| Liverpool |
276 |
1.5% |
| Belfast |
237 |
1.3% |
| Sheffield |
230 |
1.3% |
| Stoke-on-Trent |
221 |
1.2% |
| Cardiff |
191 |
1.1% |
| Bournemouth |
186 |
1.0% |
| Newcastle |
121 |
0.7% |
| Norwich |
61 |
0.3% |
| Middlesbrough |
39 |
0.2% |
| Hull |
28 |
0.2% |
| Swansea |
25 |
0.1% |
| Total UK |
17840 |
|
Data: Indeed.co.uk, South Mountain Economics LLC
All ads collected at 25-mile limit except for London, which is 5 miles.
Comparing November 2013 to March 2015, it's interesting to note that London's share of big data want ads has declined (from 54% to 43%). That's consistent with the idea that as big data becomes more mainstream, the jobs become less concentrated.
In Figures 18 and 18a the IT job/ad multiplier is used to both estimate the total number of big data jobs in the United Kingdom, and to map the distribution number of big data jobs across different regions. Figure 18 uses the keywords listed in Figure 16. By contrast, Figure 18a uses a somewhat smaller set of keywords, omitting 'python' and 'data analyst', terms that sometimes come up in non-big-data want ads. We see that the estimated number of big data jobs is 203,000 from the broad set of keywords, and 119,000 from the restricted set of keywords.
This range of estimates shows several important points. First, when doing an analysis of innovative jobs, it's necessary to pick out a set of keywords that best fits the goal of the analysis. There is never going to be a bright line distinguishing 'big data' jobs from other types of jobs. A smaller set of keywords will generate lower estimates.
FIGURE 18: ESTIMATED EMPLOYMENT FOR BIG DATA OCCUPATIONS, MARCH 2015
|
ESTIMATED JOBS (THOUSANDS) |
| London |
86.7 |
| Oxford |
10.1 |
| Cambridge |
9.2 |
| Leeds |
7.4 |
| Manchester |
6.4 |
| Bristol |
6.1 |
| Birmingham |
5.8 |
| Edinburgh |
4.7 |
| Brighton |
4.1 |
| Leicester |
4.0 |
| Southampton |
3.8 |
| Nottingham |
3.3 |
| Glasgow |
3.2 |
| Liverpool |
3.1 |
| Belfast |
2.7 |
| Sheffield |
2.6 |
| Stoke-on-Trent |
2.5 |
| Cardiff |
2.2 |
| Bournemouth |
2.1 |
| Newcastle |
1.4 |
| Norwich |
0.7 |
| Middlesbrough |
0.4 |
| Hull |
0.3 |
| Swansea |
0.3 |
| Total UK |
203 |
Data: ONS, Indeed.co.uk, South Mountain Economics LLC
Job/ad multiplier = 11.4
Not restricted to IT occupations
FIGURE 18A: ESTIMATED EMPLOYMENT FOR BIG DATA OCCUPATIONS (RESTRICTED KEYWORD LIST), MARCH 2015
|
ESTIMATED JOBS (THOUSANDS) |
| London |
55.6 |
| Oxford |
5.2 |
| Leeds |
4.2 |
| Manchester |
4.1 |
| Bristol |
3.6 |
| Birmingham |
3.1 |
| Edinburgh |
2.5 |
| Cambridge |
2.4 |
| Brighton |
2.2 |
| Liverpool |
2.1 |
| Leicester |
1.8 |
| Stoke-on-Trent |
1.8 |
| Glasgow |
1.7 |
| Southampton |
1.6 |
| Nottingham |
1.5 |
| Cardiff |
1.4 |
| Sheffield |
1.2 |
| Belfast |
1.2 |
| Bournemouth |
0.9 |
| Newcastle |
0.8 |
| Norwich |
0.4 |
| Middlesbrough |
0.3 |
| Swansea |
0.2 |
| Hull |
0.2 |
| Total UK |
119 |
Data: ONS, Indeed.co.uk, South Mountain Economics LLC
Modified keyword list does not include 'python' or 'data analyst'
Job/ad multiplier = 11.4
Not restricted to IT occupations
Second, the two sets of keywords show similar but not identical geographic distributions. In both cases London and Oxford top the list. However, with the restricted set of keywords, Leeds goes to number 3, replacing Cambridge. Once again, the purpose of the analysis determines which geographical distribution is more appropriate.
Finally, the employment estimates were generated by benchmarking want-ad data against an authoritative source—in this case, the Annual Population Survey data on IT occupations, as shown in Figure 14. We could have chosen a different benchmark—say, a study that estimated national big data jobs at a particular point in time. Then the want-ad approach becomes a way of generating a geographical distribution of jobs.
12. Example: Medtech Occupations
The third category of innovative occupations that we examined is 'medtech,' short for 'medical technology.' Our goal is to understand the geographic distribution of workers who help develop medical technology, which these days includes everything from medical devices to medical apps.
In terms of skills, medtech includes scientists, engineers, and software developers who have medical-related specialties. For example, the following three job titles all might fit into the category of medtech.
- Principal Engineer—Instrumentation Technology
- Biostatistics Manager
- Medical Devices Human Factors Consultant
We chose to exclude downstream and patient-facing occupations from our definition of medtech. These are workers who maintain medical technology, or deliver medical care using technology. Such jobs are well paying and perfectly reasonable careers' but they do not offer insight into the geographical distribution of medtech development jobs.
Figure 19 indicates the keyword list that we constructed for medtech, after looking for common terms in medtech want ads. Note that the '-' sign indicates an excluded term. For example, we exclude want ads that contain the word 'sales,' in order to rule out the large number of want ads for people who sell medical technology. Similarly, we exclude want ads that contain the word 'maintains,' indicating that the ad is directed toward someone who maintains medical technology.
We acknowledge that there are some want ads for medtech development workers that will not be picked up by this keyword list, given the diversity of medtech. However, remember that we are looking for the geographical distribution of medtech. So as long as the keyword list is picking up a sizable proportion of medtech development jobs, the odds are that the geographic distribution will be representative.
FIGURE 19: KEYWORD LIST FOR MEDTECH DEVELOPMENT WORKERS
|
| Biomedical |
| Biostatistics |
| Medical Device |
| Medical Diagnostics |
| Medical Equipment |
| Medical Technology |
| Customer |
| Maintains |
| Nurse |
| Patient |
| Sales |
| Technologist |
| Technician |
Data: South Mountain Economics
Note: A '-' means that term is excluded.
FIGURE 20: MEDTECH WANT ADS, NOVEMBER 2014
|
NUMBER |
SHARE |
| London |
492 |
17.0% |
| Cambridge |
272 |
9.4% |
| Brighton |
228 |
7.9% |
| Oxford |
185 |
6.4% |
| Birmingham |
128 |
4.4% |
| Manchester |
94 |
3.2% |
| Liverpool |
79 |
2.7% |
| Leeds |
73 |
2.5% |
| Cardiff |
69 |
2.4% |
| Norwich |
67 |
2.3% |
| Edinburgh |
58 |
2.0% |
| Bristol |
56 |
1.9% |
| Glasgow |
52 |
1.8% |
| Nottingham |
51 |
1.8% |
| Stoke-on-Trent |
50 |
1.7% |
| Leicester |
47 |
1.6% |
| Southampton |
44 |
1.5% |
| Sheffield |
28 |
1.0% |
| Bournemouth |
26 |
0.9% |
| Newcastle |
25 |
0.9% |
| Belfast |
14 |
0.5% |
| Swansea |
10 |
0.3% |
| Hull |
9 |
0.3% |
| Middlesbrough |
4 |
0.1% |
| Total, United Kingdom |
2893 |
|
Data: Indeed.co.uk, South Mountain Economics LLC
All ads collected at 25-mile limit except for London, which is 5 miles.
Figure 20 gives the distribution of medtech development want ads, as of November 2014. London still has the bulk of the ads, but the differential between London and the next three cities on the list, Cambridge, Brighton and Oxford, is much less than in the case of either IT occupations or big data occupations.
It should be noted that Brighton, including a 25-mile radius, includes such medtech companies as Meridian Medical Limited, in Littlehampton; Varian Medical Systems UK Ltd in Crawley; Gallops and Jarvis Manufacturing in Eastbourne; and Rochester Medical and Eschmann Equipment in Lancing. In addition, there are pharma manufacturing operations nearby, including GlaxoSmithKline in Worthing and Teva UK in Eastbourne.
What about jobs? We need a job/ads multiplier for medtech occupations, but we cannot use the multiplier that we previously calculated for IT occupations. Medtech occupations tend to be in scientific and engineering jobs such as biochemists and biomedical engineers. These tend to have lower turnover than IT jobs, and as a result have fewer want ads per employee. Fewer want ads per employee translate into a higher job/ad multiplier.
In Figure 21, we compare government figures for chemist, biologists and other chemical and biological occupations with the want ad figures for those occupations. This procedure gives us a job/ad multiplier of 51.9 for chemical and biological occupations. This multiplier for scientific occupations is much larger than the multiplier for IT occupations. This fits very well with similar U.S. comparisons between IT and scientific occupations.
In Figure 22 we use the multiplier to estimate medtech occupational employment by urban area. This is also an indicator of the location of medtech related economic activity. Because of the diversity of medtech occupations, we consider this to be a fairly rough estimate. For example, the 25-mile area around Brighton is estimated to have 11.8 thousand people employed in medtech occupations. Note that the actual number of people employed by medtech firms may be larger, because they also hire non-medtech occupations such as human resources and IT.
FIGURE 21: BENCHMARK CALCULATIONS: CHEMICAL AND BIOLOGICAL JOBS VS. WANT ADS
| CHEMICAL AND BIOLOGICAL OCCUPATIONS |
THOUSANDS OF WORKERS APRIL-JUNE 2014 |
| Chemical scientists |
29 |
| Biological scientists and biochemists |
101 |
| Laboratory technicians |
85 |
| Employment in chemical and biological occupations |
215 |
| Total chemical and biological want ads, November 2014* |
4139 |
| Estimated jobs per want ad |
51.9 |
Data: ONS, Indeed.co.uk, South Mountain Economics LLC*
Based on the following keyword list: (chemist or "chemical scientist" or biologist or biochemist or biological or biomedical or "medical scientist" or microbiologist)
FIGURE 22: ESTIMATED EMPLOYMENT FOR MEDTECH OCCUPATIONS, NOVEMBER 2014
|
ESTIMATED JOBS (THOUSANDS) |
| London |
25535 |
| Cambridge |
14117 |
| Brighton |
11833 |
| Oxford |
9602 |
| Birmingham |
6643 |
| Manchester |
4879 |
| Liverpool |
4100 |
| Leeds |
3789 |
| Cardiff |
3581 |
| Norwich |
3477 |
| Edinburgh |
3010 |
| Bristol |
2906 |
| Glasgow |
2699 |
| Nottingham |
2647 |
| Stoke-on-Trent |
2595 |
| Leicester |
2439 |
| Southampton |
2284 |
| Sheffield |
1453 |
| Bournemouth |
1349 |
| Newcastle |
1298 |
| Belfast |
727 |
| Swansea |
519 |
| Hull |
467 |
| Middlesbrough |
208 |
| Total, United Kingdom |
150147 |
Data: Indeed.co.uk, South Mountain Economics LLC
Job/ad multiplier = 51.9
13. Stability Analysis
Thus far, the analysis performed has been done on active want ads at a specific point in time. We have calculated a relative ranking and estimated jobs for all three. But this strategy leaves an open question: Does the number of want ads bounce around a lot? If we drew the data sample at another time, would we get a similar or very different ranking?
During our previous work in the U.S., we experienced want ad rankings as being relatively stable over time. States that were high in the ranking at one time generally were nearly in the same position a year later.
To confirm the relative stability for the U.K., we drew two samples for both IT occupations and big data occupations. We then compared the rankings (Figures 17 and 18). We see that the rankings for the IT occupations barely moved. All the cities that were in top the 11 before are still in the top 11. The biggest shift is that Bristol dropped from #5 to #9. On average, the absolute rank change was just over 1.
For big data occupations, the ranking changes were somewhat larger but still relatively minor. The average absolute rank change was 1.6, and the top 4 cities remained the same.
FIGURE 23: STABILITY ANALYSIS: IT OCCUPATIONS
|
RANK AUG-13 |
RANK APR-14 |
ABSOLUTE DIFFERENCE |
| London |
1 |
1 |
0 |
| Oxford |
2 |
3 |
1 |
| Manchester |
3 |
2 |
1 |
| Birmingham |
4 |
4 |
0 |
| Southampton |
5 |
9 |
4 |
| Cambridge |
6 |
5 |
1 |
| Leicester |
7 |
7 |
0 |
| Leeds |
8 |
6 |
2 |
| Nottingham |
9 |
10 |
1 |
| Brighton |
10 |
11 |
1 |
| Bristol |
11 |
8 |
3 |
| Liverpool |
12 |
12 |
0 |
| Bournemouth |
13 |
13 |
0 |
| Stoke-on-Trent |
14 |
17 |
3 |
| Edinburgh |
15 |
16 |
1 |
| Sheffield |
16 |
14 |
2 |
| Belfast |
17 |
18 |
1 |
| Glasgow |
18 |
15 |
3 |
| Cardiff |
19 |
20 |
1 |
| Newcastle |
20 |
19 |
1 |
| Middlesbrough |
21 |
22 |
1 |
| Norwich |
22 |
21 |
1 |
| Hull |
23 |
23 |
0 |
| Swansea |
24 |
24 |
0 |
| Average rank difference |
|
|
1.167 |
Data: Indeed.co.uk, South Mountain Economics LLC
All ads collected at 25-mile limit except for London, which is 5 miles.
FIGURE 24: STABILITY ANALYSIS: BIG DATA OCCUPATIONS
|
RANK NOV-13 |
RANK APR-14 |
ABSOLUTE DIFFERENCE |
| London |
1 |
1 |
0 |
| Cambridge |
2 |
2 |
0 |
| Oxford |
3 |
3 |
0 |
| Manchester |
4 |
4 |
0 |
| Leeds |
5 |
9 |
4 |
| Edinburgh |
6 |
8 |
2 |
| Birmingham |
7 |
7 |
0 |
| Bristol |
8 |
6 |
2 |
| Leicester |
9 |
14 |
5 |
| Southampton |
10 |
5 |
5 |
| Belfast |
11 |
11 |
0 |
| Brighton |
12 |
12 |
0 |
| Nottingham |
13 |
16 |
3 |
| Liverpool |
14 |
13 |
1 |
| Glasgow |
15 |
10 |
5 |
| Bournemouth |
16 |
15 |
1 |
| Stoke |
17 |
18 |
1 |
| Sheffield |
18 |
17 |
1 |
| Newcastle |
19 |
20 |
1 |
| Norwich |
20 |
21 |
1 |
| Cardiff |
21 |
19 |
2 |
| Hull |
22 |
23 |
1 |
| Middlesbrough |
23 |
24 |
1 |
| Swansea |
24 |
22 |
2 |
| Average rank difference |
|
|
1.6 |
Data: Indeed.co.uk, South Mountain Economics LLC
All ads collected at 25-mile limit except for London, which is 5 miles.
14. Validation Analysis
The intuition behind validation is simple: The want-ad aggregators such as Indeed have an incentive to make their location algorithms as useful as possible, since their users who are searching for jobs and the employers who are placing the ads want that.
However, the algorithms used to identify want ads by location are not perfect. Want ads can fail to convey accurate information in two ways. First, the ad may be assigned to the wrong geographic area. Second, it may be assigned to the wrong occupation.
It's possible—especially in the case of geographic areas with similar names—for the location algorithm to make mistakes and identify the place for ads. Alternatively, some ads specify multiple locations, which makes it very difficult for the location algorithm. Or an employer may place the ad in a different region than the job, in order to attract people from other parts of the country.
Similarly, the keyword list has the potential for accidentally pulling up ads that do not correspond to the target occupations. For example, if by some chance there was a large restaurant named 'Android' in a city advertising for baristas, the keyword list for IT occupations would incorrectly pull up those ads as IT. Or an ad that says "we are looking for someone who can teach economists how to write" will show up in the count for economists.
So the logical procedure is to pull up a sample of ads from each city and 'validate' them—that is, check each sampled ad individually to make sure it fits the location and target occupation. This gives us a 'validation ratio' for each location and occupation.
In past work, we used the validation ratio to adjust the final reported job result. For example, in our estimates of App Economy jobs for U.S. states, we averaged the raw state validation ratio and the overall validation ratio for each states, and used that to adjust the final job number.
We followed a different validation procedure for this paper. For each city and for each sample, we pulled 10 want ads and validated each manually for correct location and target occupation. That gave us a sample of 720. For each city, we calculated the pooled validation ratio for all three target occupations. We can see in Figure 25 that, for most cities, the validation ratio was in excess of 75%. There are only four cities for which the validation ratio is under 60% (marked in yellow).
FIGURE 25: POOLED VALIDATION RATIO
|
|
| Belfast |
100% |
| Birmingham |
87% |
| Bournemouth |
53% |
| Brighton |
70% |
| Bristol |
80% |
| Cambridge |
93% |
| Cardiff |
78% |
| Edinburgh |
83% |
| Glasgow |
80% |
| Hull |
90% |
| Leeds |
97% |
| Leicester |
75% |
| Liverpool |
57% |
| London |
97% |
| Manchester |
90% |
| Middlesbrough |
73% |
| Newcastle |
83% |
| Norwich |
33% |
| Nottingham |
83% |
| Oxford |
80% |
| Sheffield |
57% |
| Southampton |
80% |
| Stoke |
93% |
| Swansea |
77% |
Ads validated for correct location and occupation. Validation rate based on sample of 720 want ads (10 want ads per city per occupation). Based on August 2013(IT occupations), November 2013(big data occupations), and January 2014(medtech occupations) data samples.
Grey lines identify potentially worrisome locations
Data: South Mountain Economics LLC
15. Cross-Country Comparisons
The want-ad methodology presented in this study allows the possibility of cross-country comparisons. This section will focus on comparing employment in IT occupations in London (U.K.) to employment in IT occupations in New York City (U.S.) and San Francisco/Silicon Valley (U.S.), using a consistent methodology.
First, note that direct comparison of want ads between regions in different countries is not a valid procedure. The reason is that we are not entitled to assume that the job/ad multiplier is the same in different countries, even for the same occupation. Despite globalization, labor markets are still national rather than international. So the first step is to find a way of adjusting for the difference in job search and worker recruitment in the United Kingdom and the United States.
The keyword list from Figure 6 is used to estimate the number of want ads for IT occupations in the U.K. Then the results are compared to overall employment in IT occupations, and used to derive a job/ad multiplier for IT occupations in the U.K. (Figure 26).
Then we do the same calculation for the United States. Note that the job/ad multiplier for IT occupations in the U.S. is roughly twice that of the U.K. Or to put it another way, for every person employed in an IT occupation, there are twice as many ads in the U.K. compared to the U.S.
Once we have calculated the national job/ad multipliers for the two countries, we are ready to apply them to individual regions. We focus on London in the U.K., and New York City and San Francisco/Silicon Valley in the U.S. We take the number of IT want ads in London, and multiply that number by 11.4, the U.K. job/ad multiplier. Then we take the number of IT want ads in New York City and San Francisco/Silicon Valley, and multiply those two numbers by 16.3, the US job/ad multiplier for IT occupations.
The results are shown in Figure 26. Basically, London's IT employment, by this procedure, is greater than New York City's and less than San Francisco/Silicon Valley's. In theory, the same procedure can be used to compare big data jobs, or any other sort of innovative occupation across countries.
FIGURE 26: COMPARING THE UNITED KINGDOM AND THE UNITED STATES, NOVEMBER 2014
| UNITED KINGDOM |
|
| Employment in IT occupations, April–June 2014 (thousands of workers) (1) |
1112 |
| Total IT want ads, November 2014(2) |
97186 |
| Job/ad multiplier |
11.4 |
| UNITED STATES |
|
| Estimated employment in IT occupations, October 2014 (thousands of workers) (3) |
5071 |
| Total IT want ads, November 2014(4) |
311054 |
| Job/ad multiplier |
16.3 |
| IT WANT ADS, NOVEMBER 2014 |
|
| London, UK (5) |
27711 |
| New York City, US (6) |
17736 |
| San Francisco/Silicon Valley, US (7) |
28840 |
| CALCULATED EMPLOYMENT IN IT OCCUPATIONS (8) |
|
| London, UK (thousands of workers) |
316 |
| New York City, US (thousands of workers) |
289 |
| San Francisco-Silicon Valley, US (thousands of workers) |
470 |
(1) As estimated in Figure 1
(2) As reported in Figure 12
(3) As reported by the Bureau of Labor Statistics, plus computer and information systems managers
(4) Applying the keyword list in Figure 2 to the United States
(5) As reported in Figure 12
(6) Applying the keywords list in Figure 2 to New York City, 5-mile radius
(7) 50 mile radius around Palo Alto, CA
(8) Using job/ad multipliers for respective countries
Data: Office of National Statistics; Indeed.com; Indeed.co.uk; Bureau of Labor Statistics; South Mountain Economics LLC
16. Setting Up a Real-Time Jobs Dashboard
What is the appropriate use of the want-ad methodology? Government figures about jobs in innovative occupations, when they are available, are generally the gold standard. Government statisticians in the United Kingdom and the United States are skilled at picking the appropriate sampling frame, avoiding or minimizing sample bias, and not reporting results unless they are statistically valid.
In the absence of government data, then the next best option is a specially commissioned large-scale survey, as the one that Tech City UK did. That can be used to assess detailed questions of key interest.
However, there are many situations in which neither option is useful. The occupational categories in government surveys tend to be broad and significantly lag the changes in the labor market. What's more, government surveys tend to be censored below a certain level of geographical specificity, either because the sample size is too small or because revealing the data would break confidentiality.
On the other hand, large-scale private surveys are expensive to administer, and time-consuming to clean and analyze the data. As such, they cannot be done very often, and certainly not in real-time
So what's need is a method of tracking innovative jobs that fits the following criteria:
- Can be applied to new occupations
- Can be applied to small geographic areas
- Can repeated frequently, or even in real-time
The want-ad approach fits all of these criteria. By use of the appropriate keyword list, it can be applied to new occupations. The geographic search function allows the area to be narrowed quite a bit. And since the want-ad database is continually being updated, the results are virtually real-time.
The one caveat: To be useful, the want-ad approach needs to be benchmarked against a more authoritative source of data. In this study we used the annual government labor survey as the authoritative source. However, a specially commissioned survey could be used as the benchmark as well. For example, we could use the Tech City UK (2015) study as our benchmark, or Nesta's study of the "The Geography of The UK's Creative and High-Tech Economies" (Bakhshi, Davies, Freeman and Higgs, 2015).
After benchmarking, the want-ad data can be used to make cross-sectional geographic comparisons of employment in innovative occupations. However, policymakers in a particular region often want to know whether innovative employment or innovative activity is growing or shrinking in their region.
For example, suppose that a local university received a large grant to set up a new center for nanotechnology. University officials and local economic development agencies might want to know whether the center is helping stimulate nanotech related activity in the region, and helping create nanotechnology-related jobs.
Government surveys are not up to the task. By their nature, these surveys cannot incorporate cutting-edge industrial and occupational categories until years have passed. For cost reasons and the difficulties of doing large surveys, they usually cannot supply accurate and detailed results for small geographic areas. And even when they can, confidentiality requires that many small area results are masked.
The obvious alternative is to set up a real-time innovation dashboard using want ads targeted for a particular innovative technology. This can be done for any size geographic area and any particular innovative technology.
For example, suppose that we wanted to monitor big data jobs and big data economic activity in Liverpool. Then we could set up a monthly, weekly, or even daily count of big data want ads in the vicinity of Liverpool, using the keyword list constructed in Figure 16. Do the same thing for several different technologies, and you have yourself the beginnings of an innovative job/activity dashboard that can be customized to any locality.
However, this simple version of a dashboard is not enough. As noted earlier in this study, want ad counts are driven by employer and aggregator needs, rather than a consistent data collection process. As a result, the want ad process is susceptible to shocks over time that are not directly related to changes in employment, such as improvements in the methodology used by the want-ad aggregator.
So to increase the accuracy of a dashboard, it's essential to do comparisons with other similar regions, as well as the national average. So a nanotechnology dashboard for Nottingham, for example, would also have to track nanotech-related jobs in Cambridge, London, and the U.K. as a whole. And then the dashboard would be set to register relative as well as absolute changes.
17. Conclusion
This study has shown how want ads can be used to study the geographic distribution of innovative jobs and innovative economic activity in the United Kingdom. This is an extremely flexible methodology, which can be targeted to any innovative technology and associated job market.
In a broader sense, this study has also shown how a 'big data' approach to economic statistics does not necessarily require huge data sets. More generally, the study uses the flow of information generated in the normal course of business by employers to understand the job market. Moreover, to the degree that hiring behavior reflects overall innovative activity, this study has shown the way to mapping innovation in the United Kingdom.
References
Bakhshi, Hasan, John Davies, Alan Freeman and Peter Higgs. 2015. "The Geography of The UK's Creative and High-Tech Economies," Nesta, January 2015. http://www.nesta.org.uk/sites/default/files/geography_uks_creative_high-tech_economieswv20151.pdf
Census Bureau, 2013. American Community Survey Information Guide. Available: https://www.census.gov/acs/www/Downloads/ACS_Information_Guide.pdf
Chapain, Caroline, Phil Cooke, Lisa De Propris, Stewart MacNeill, and Juan Mateos-Garcia. 2010. "Creative Clusters and Innovation." Nesta, November 2010. Available: http://www.nesta.org.uk/publications/creative-clusters-and-innovation-report
Conference Board, 2012. "The Conference Board Help Wanted OnLine® Data Series Technical Notes," August 2012.
Conference Board, 2014. "Online Labor Demand Edged Up 11,700 in October," November 5, 2014. Available: https://www.conference-board.org/pdf_free/press/PressPDF_5314_1415125554.pdf
Einav, Liran and Jonathan Levin, 2013. "The Data Revolution and Economic Analysis." NBER Working paper19035. Available: http://www.nber.org/papers/w19035
European Union, 2010. "1st and 2nd International Workshops on Methodologies for Job Vacancy Statistics Proceedings." Available: http://epp.eurostat.ec.europa.eu/cache/ITY_OFFPUB/KS-RA-10-027/EN/KS-RA-10-027-EN.PDF
Mandel, Michael. 2012. "Where the Jobs Are: The App Economy," South Mountain Economics research paper prepared for Technet, February 2012. Available: http://southmountaineconomics.files.wordpress.com/2012/09/technet-app-economy-study.pdf
Mandel, Michael and Jonathan Liebenau, "London: Digital City on the Rise," South Mountain Economics research paper prepared for Bloomberg Philanthropies, June 2014. Available: http://southmountaineconomics.files.wordpress.com/2014/06/london-digital-city-on-the-rise.pdf
Mandel, Michael and Judith Scherer. 2012. "The Geography of the App Economy," South Mountain Economics research paper prepared for CTIA, October 2012. Available: http://southmountaineconomics.files.wordpress.com/2012/11/the_geography_of_the_app_economy-f.pdf
Nathan, Max and Anna Rosso, with Francois Bouet. 2014. "Mapping Information Economy Businesses With Big Data: Findings for the UK," Nesta, November 2014. http://www.nesta.org.uk/sites/default/files/mapping_information_economy_businesses_with_big_data.pdf
Nathan, Max and Anna Rosso, with Tom Gatten, Prash Majmudar and Alex Mitchell. 2013. "Measuring The UK's Digital Economy With Big Data", National Institute of Economic and Social Research, July 2013. Available: http://niesr.ac.uk/sites/default/files/publications/S1024_GI_NIESR_Google_Report12.pdf
National Research Council, 2014 (edited by Robert E. Litan, Andrew W. Wyckoff, and Kaye Husbands Fealing). Capturing Change in Science, Technology, and Innovation:Improving Indicators to Inform Policy. National Academies Press, 2014. Available: http://www.nap.edu/catalog.php?record_id=18606
OECD. 2009. OECD Employment Outlook 2009. "Chapter 2:How Do Industry, Firm and Worker Characteristics Shape Job and Worker Flows?" Available: http://www.oecd.org/els/emp/45219606.pdf
Office of National Statistics, 2010. Standard Occupational Classification, Volumes 1 and 2. Available: http://www.ons.gov.uk/ons/guide-method/classifications/current-standard-classifications/soc2010/index.html
Office of National Statistics, 2014. "Labour Force Survey Employment status by occupation, April - June 2014." Available: http://www.ons.gov.uk/ons/rel/lms/labour-force-survey-employment-status-by-occupation/april---june-2014/index.html
Rothwell, Jonathan. 2012. "Education, Job Openings, and Unemployment in Metropolitan America," Brookings Institution, August 2012. Available: http://www.brookings.edu/research/papers/2012/08/29-education-gap-rothwell#M10420
Tech City UK. 2015. "Tech Nation: Powering The Digital Economy 2015,” http://www.techcityuk.com/wp-content/uploads/2015/02/Tech%20Nation%202015.pdf




