Husain Taibjee, Anish Chacko, John Barber, Frances Bain, Clare Brennan and Shabeer Rauf
Key points
- Obesity is a critical public health challenge in the UK, with two-thirds of adults now living with excess weight. The out-of-home (OOH) sector (comprising food and drink that is prepared or cooked away from the home) is a core component of population diets, contributing an average of 14% of daily calories consumed by adults aged 19-64 between 2019 and 2023. A recent report by the Office for Health Improvement and Disparities shows the number of OOH sales increased by 10.6% in 2023 compared to 2021. Yet, it has received less attention from policymakers.
- The healthy food standard announced in the recent 10 Year Health Plan for England commits to mandatory data reporting and healthy sales targets across large food businesses. Nesta's health targets for supermarkets demonstrate how health targets could be designed and implemented in the grocery retail sector. The proposal balances being relatively low-cost for businesses and consumers, feasible to implement in the near term, and impactful in improving public health.
- In this report, we set out our exploration of how health targets could be applied to the out-of-home sector, during which we consulted with stakeholders from industry, including eight leading UK OOH businesses and sector organisations, policymakers, and health NGOs.
- Our findings suggest that health targets present a feasible, impactful regulatory option for large OOH businesses. Our modelling, based on 2021 data, suggests that either a group absolute or a relative reduction target could reduce calorie intake among populations living with overweight and obesity by an average of **
7 kcal per person per day**, whilst also being achievable and economically viable for a majority of the market. This change would result in a 2.5% reduction in the prevalence of obesity over 3 years of targets being achieved and generate around £1.5 billion in annual cost savings to society.¹
- However, our exploration leaves a number of important policy development questions unanswered, which could only be answered following the submission of commercial data by large businesses:
- Measure of healthiness: having explored a wide range of metrics upon which to base a target, we recommend that sales weighted average energy (calories) per product (SWA EPP) or sales weighted average nutrient profiling model (SWA NPM) would be the most appropriate measures with which to set health targets for the OOH sector. The SWA EPP likely optimises impact on obesity (due to being more portion size sensitive) and speed of implementation due to data availability. SWA NPM presents a more holistic route to improving health and aligns with our recommendation for mandatory targets for retailers.
- Sector diversity: The size and heterogeneity of the large business OOH market means that it would not be possible to follow an absolute target approach where a target is based on the best in the sector. Rather, a target would likely need to be relative (eg, based on each business' own baseline) or use a group absolute target approach where businesses are grouped, eg, by food type or service delivery type, and a target based on the best in a specific sector. The former likely prioritises policy simplicity and the latter fairness. Our analysis suggests that both could generate a similar impact at similar levels of achievability; however, to understand this fully and decide on the best approach would require using commercial data that we did not have access to.
- Implications for healthy food standard implementation:
- Given that further policy development will rely on the submission of commercial data, this makes a strong case for expediting the mandatory reporting of data on food sales. We would therefore recommend that the government should build on the proposals published by the Food and Data Transparency Partnership (FDTP).
- Based on our modelling, the impact of targets for grocery retailers is likely to be significantly higher than targets for OOH ([
20% reduction in prevalence of obesity over 3 years](https://www.nesta.org.uk/report/health-targets-for-supermarkets/) compared to 2.5% – this is because sales from the major retailers account for a significantly larger proportion of our diets (over 80%)). The setting of targets for retailers is also likely to be feasible more quickly than for OOH, given there are fewer unanswered policy development questions (the type of target and metric are clear), the number of businesses involved and the readiness of those businesses to comply (eg, requisite data systems are more likely to exist). Therefore, if government is seeking to prioritise the speed and size of public health impact, it should not let challenges of setting targets for large OOH businesses delay the process of setting targets for grocery retailers.
The case for action
Rising obesity prevalence is reshaping the landscape of national health and economic productivity. Obesity rates have doubled since the 1990s and now two-thirds of the UK adult population is living with overweight or obesity. The distribution is not equal: children living in the most deprived areas are twice as likely to live with obesity as those living in the most affluent areas. Excess weight carries a £126 billion societal cost, including £12 billion in costs to the NHS. Many health problems driven by or exacerbated by excess weight (eg, musculoskeletal, endocrine and mental health conditions) are preventable.
People want change. Polling suggests that almost half of UK adults want to lose weight and are trying to eat more healthily. However, maintaining a balanced diet and achieving weight loss can be challenging, particularly given the higher availability of less healthy food options in local environments. Crucially, 74% of people support Government action on obesity.
Obesity is a solvable issue. To halve obesity prevalence requires those living with excess weight to reduce their daily calorie intake by 8.5% or 216 calories, roughly equivalent to a single slice of medium pepperoni pizza – a modest change. Achieving this change at a population level is only possible through shifts in our food environment, making the healthier option the easiest and most affordable, whilst maintaining the joy we take from food. Yet past policies have, on the whole, focused on other approaches, often prioritising information provision or voluntary initiatives. Impending junk food advertising restrictions may have a greater impact. However, the Healthy Food Standard announced in the NHS 10 year plan represents a sea change in approach and potential impact by seeking to reduce obesity rates through potentially highly impactful outcome-based regulation of large food businesses.
We know where people buy their food and, therefore, where to focus new and improved policy for maximum impact. It is encouraging that the healthy food standard clearly commits to setting targets to increase the healthiness of sales of large businesses, including grocery retailers. Our recent analysis shows that over 80% of calories purchased come from just 11 of the largest grocery retailers in the UK. Our health targets for supermarkets policy would have an estimated impact of reducing obesity prevalence by ~20% over 3 years, with minimal likelihood of increased costs to businesses or consumers.
Alongside supermarkets, the other main contributor to calorie consumption is the out-of-home (OOH) sector.
OOH food and drink are defined as food prepared or cooked away from home. This covers food provided by various food service establishments for on-premise dining, immediate consumption, on-the-go, or later consumption, including restaurants, fast food outlets, coffee shops, pubs, and food-to-go bought from supermarkets and other venues.
On average, the OOH sector contributes ~340 calories per person per day to our diets based on 2021 data. This average masks significant disparities, with evidence suggesting that lower incomes and higher levels of deprivation are associated with increased consumption and exposure to fast food and other OOH outlets. Our estimates suggest that at least 60% of meals sold in the sector exceed the recommended number of calories per meal. In calorie sampling work of meals commonly sold by small and medium enterprises, we showed that 57% exceeded double the average recommended intake per meal (1200 calories).
A recent report by the Office for Health Improvement and Disparities shows the volume (ie, number) of OOH sales increased by 10.6% in 2023 compared to 2021. This sector is rapidly growing and by 2028 the UK food-to-go market is expected to increase in value by almost 40% on 2019 levels. Ambitious policy is therefore needed to support public health alongside sector growth, ensuring a level regulatory playing field, improving food healthiness, and reducing health inequalities from unhealthy OOH products.
That is why we sought to explore how our health target policy proposal could be broadened to the OOH sector to improve the healthiness of the food on offer.
The routes for action
There are a number of policy approaches that could potentially have a positive impact on the out-of-home sector. See Table 1 for a summary of these approaches.
- Regulating business practices – direct restrictions on sales, marketing, or composition of unhealthy foods (eg, banning price promotions on high-fat, salt, and sugar (HFSS) foods or calorie labelling on menus).
- Fiscal measures – taxes or subsidies to discourage unhealthy choices and incentivise healthier options (eg, the soft drinks industry levy).
- Outcome-based regulation – setting a mandatory health improvement outcome for businesses, allowing them flexibility in how they achieve it (eg, health targets for large grocery retailers).
Table 1: Appraisal of different regulatory approaches to improving the healthiness of the out-of-home food environment
|
Regulating business practices |
Fiscal measures |
Outcome based regulation |
| Sector Coverage |
✓ Can potentially apply to the entire sector, including SMEs |
✓ Can apply to the entire sector, including SMEs |
! Initially limited to large businesses, but an expandable framework |
| Immediate Implementation Feasibility |
! Complex implementation across thousands of businesses |
✓ Can be applied downstream to producers/importers |
! Currently only implementable for large businesses |
| Monitoring & Enforcement |
X Resource-intensive monitoring is difficult in practice |
✓ Extensive history of tax monitoring and enforcement |
! Currently only feasible for businesses with existing reporting capability |
| Business & Consumer Costs |
! Moderate implementation costs but may restrict business models |
! Possible associated costs, particularly during the cost-of-living crisis |
Flexibility of targets minimises excessive business costs |
| Flexibility for businesses |
! Moderate implementation costs but may restrict business models |
! Possible associated costs, particularly during the cost-of-living crisis |
Flexibility of targets minimises excessive business costs |
Regulating business practice can and has been a powerful tool to improve the healthiness of products and consumer purchasing by reducing exposure to methods that incentivise unhealthy choices. Applying this regulation cross-sector (the majority of regulations have affected retailers) ensures all businesses follow the same standards, preventing competitive disadvantages for those voluntarily making healthier changes. However, in the OOH sector, particularly for SMEs, such regulation may be difficult to standardise given the diversity of businesses, products and sales methods used. Furthermore, compliance across thousands of food service outlets would require extensive monitoring and enforcement, making implementation highly resource-intensive. While enforcement could be incorporated into existing food safety inspections, this would still demand significant resources, reducing the viability of this policy approach.
Fiscal measures can provide an effective regulatory approach. Options have been proposed in the National Food Strategy (NFS), are currently being extensively modelled by academic institutions (see NIHR-funded studies), and receive strong support from NGO coalitions (see Recipe for Change). One such measure is a salt and sugar tax, as proposed in the NFS, that levies a £3 per kilogram tax on sugar and a £6 per kilogram tax on salt across retail, manufacturing, and out-of-home settings, similar to the existing Soft Drinks Industry Levy (SDIL). This “upstream” tax, applied to producers and importers of salt and sugar at the point of sale to commercial food businesses, would incentivise product reformulation by increasing wholesale prices, reducing direct compliance and enforcement burden across all OOH businesses (especially for SMEs), making healthier options relatively cheaper.
While taxes would affect the entire out-of-home sector, including both large and small businesses, and provide public health benefits, there are challenges to their viability as a regulatory approach, given that they may raise costs for consumers or businesses could offset costs by slightly reducing portion sizes, both of which could be challenging given the ongoing cost-of-living crisis.
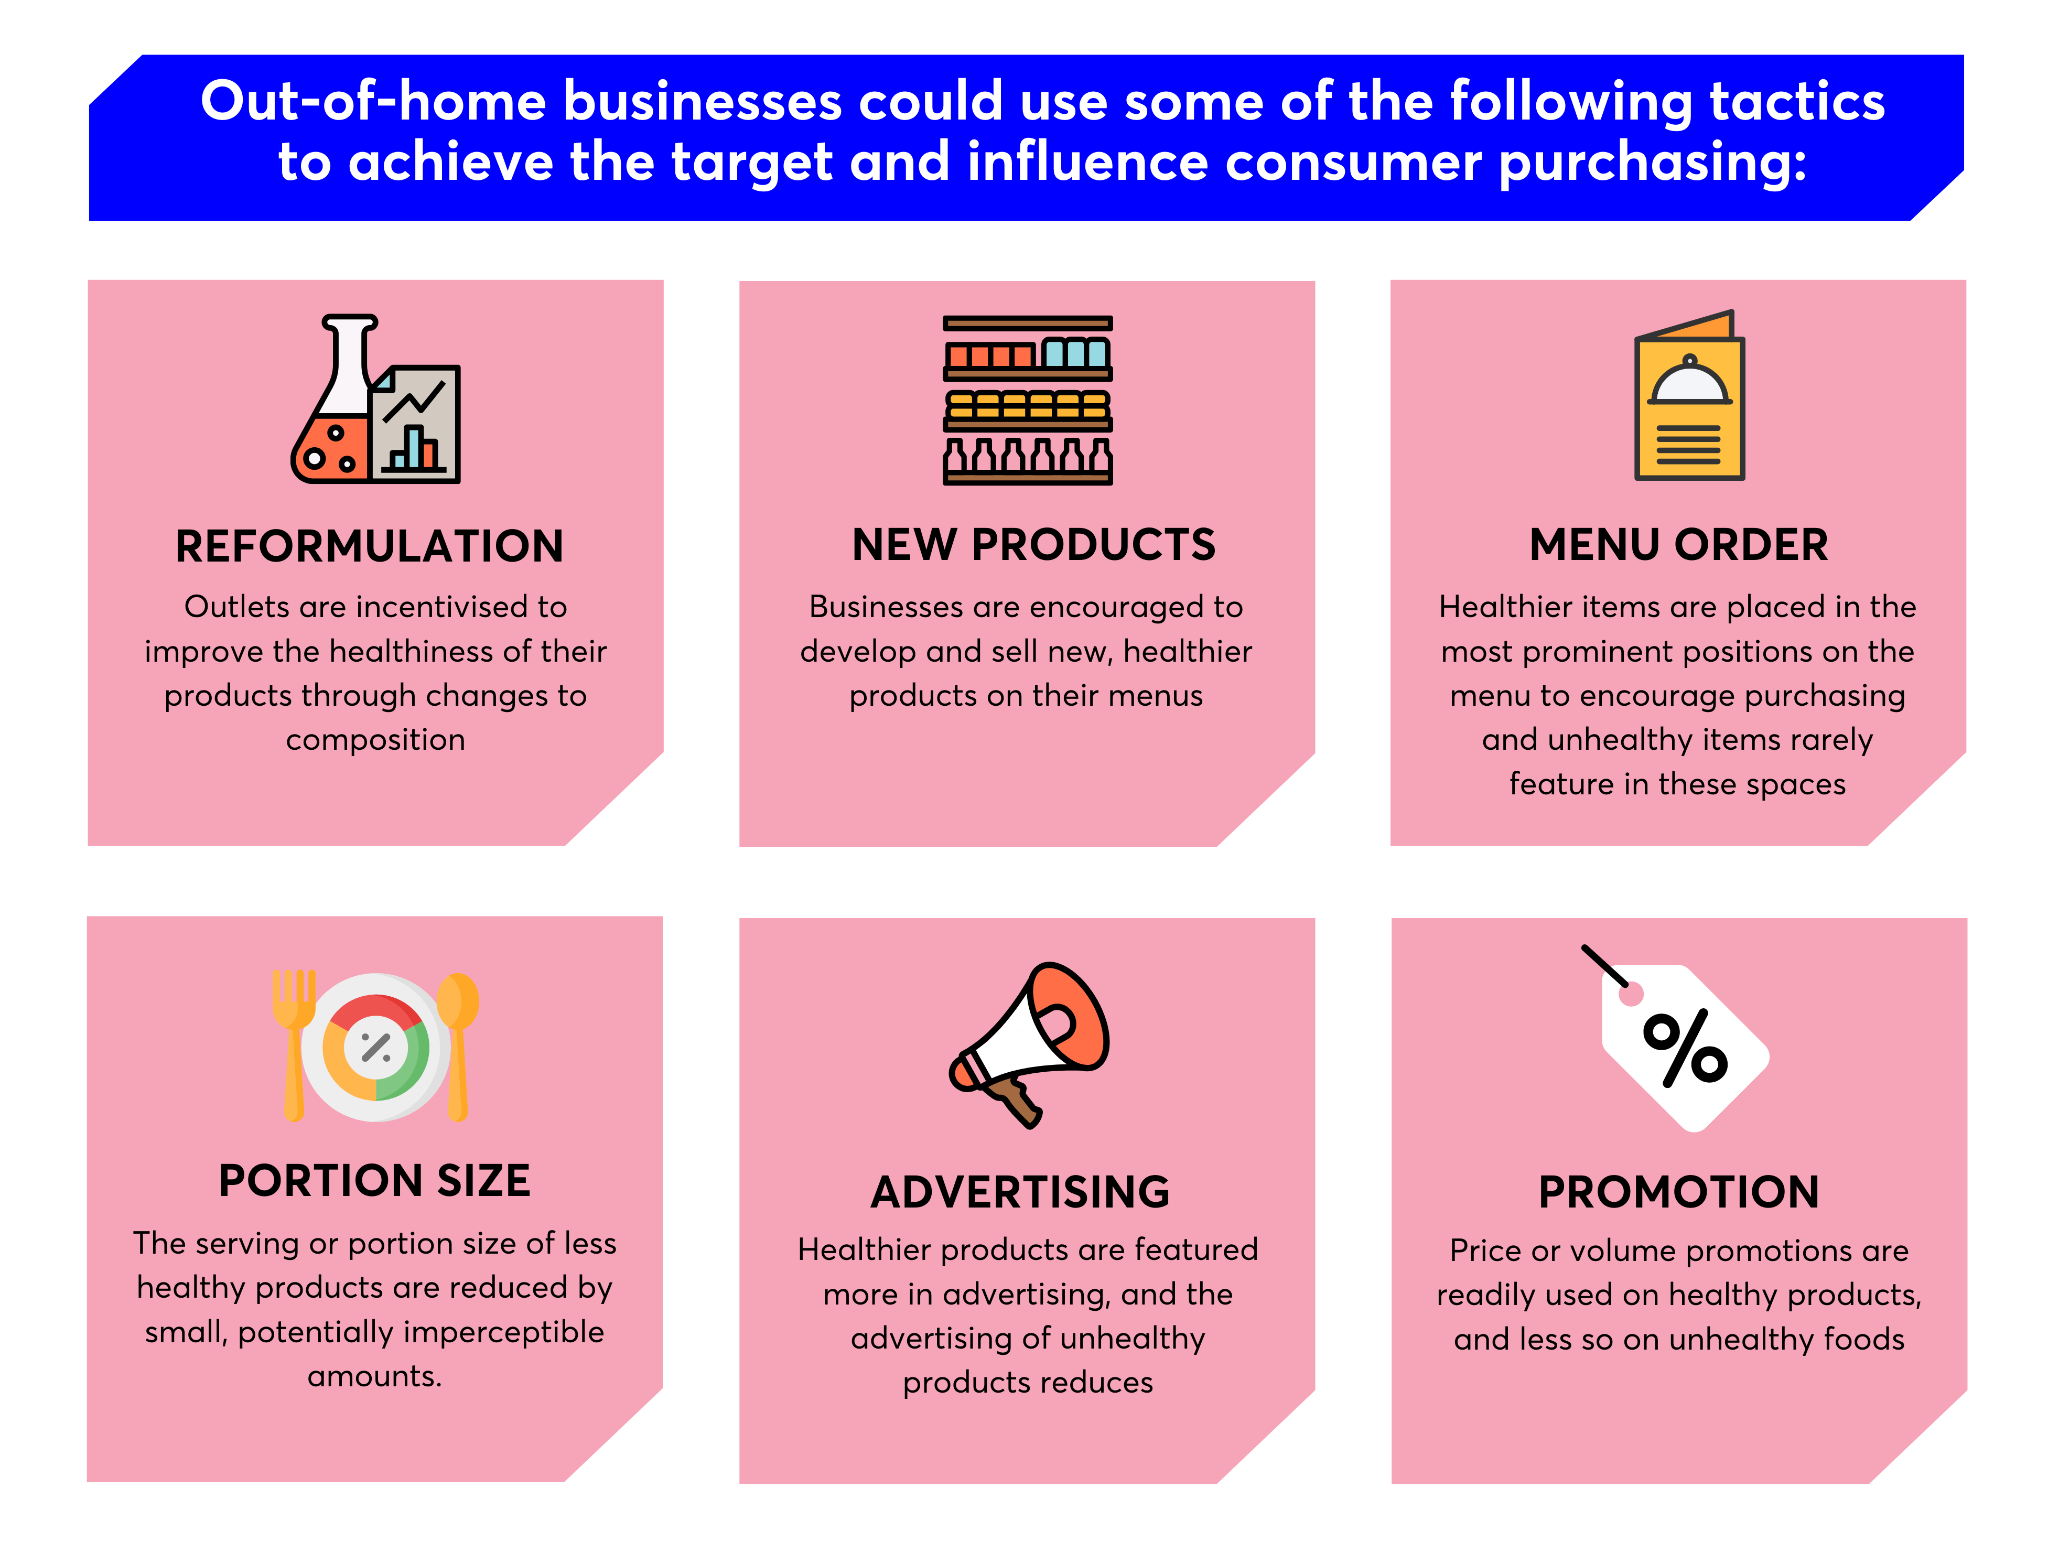
Outcome-based policy, such as mandatory health targets, seeks to overcome the limitations of other regulatory approaches by setting ambitious, measurable goals while allowing businesses flexibility in how they achieve them. Unlike direct regulation of practices, health targets enable businesses to improve the nutritional quality of their sales through existing practices that align with their operational models, eg, through reformulation, menu adjustments, pricing strategies, or marketing shifts (see Figure 1). This approach minimises excessive business costs and provides a more adaptable framework for compliance compared to fiscal measures, which carry higher risks of increasing costs for consumers. One limitation is that outcome-based targets are not yet viable for SMEs; however, the framework in this report could expand to include them if compliance barriers, such as knowing the nutritional content of food and the ability to link this data to sales, are addressed.
Figure 1: Approaches out-of-home (OOH) businesses could take to improve the healthiness of their offering
We decided to focus on outcome-based regulation in the form of health targets for large out-of-home businesses to understand if they may offer a more viable and impactful immediate solution for positive change in the current climate.
Framework for designing an out-of-home (OOH) health target
To explore targets for the OOH sector we sought to adapt our existing retailer health targets framework which focuses on achieving a single, absolute target set near the level of the current top performer. Using this outcome-based framework, we aimed to explore the feasibility of designing a policy which would ensure consistent regulation across sectors and create a level regulatory playing field through policy which could be implemented now.
Our framework for developing an OOH health target had five core questions. At each decision stage, we prioritised options that enable an achievable policy solution that is implementable quickly and delivers a meaningful public health impact. These key questions include:
- Which businesses fall within the target's scope?
- Should the target be mandatory?
- What data should businesses have to monitor and report to evidence compliance with a target?
- Which sales-weighted metric is the most appropriate measure of health?
- What type of target framing should be used, absolute (the same for all based on a single business' performance), group absolute (a target based on a group's top performer) or relative (a company's target is based on its own baseline)?
We used a mixed-methods approach to design and evaluate options for each question. To create options for health targets, we designed an analytical model to simulate changes in the healthiness of business sales (see data and modelling). To ensure our modelling reflected business changes that were feasible and minimised cost, and to establish assessment criteria for target options, we conducted a three-stage policy design process with external experts to refine the target design.
Over 20 stakeholders, including representatives from eight major OOH businesses, trade bodies, policymakers, and health NGOs, contributed insights to refine the policy. Firstly, semi-structured interviews were conducted to present and test initial ideas regarding target metrics and ways to group large OOH businesses. Key objectives included identifying potential barriers to implementing certain metrics and refining the classification of businesses to account for the sector's diversity. Following this, an industry focus group was held to validate business groupings, evaluate health metrics, and refine model parameters. Finally, a policy improvement workshop was held, bringing all stakeholders together. Here, we presented final options for health metrics, target frameworks and ambition levels to consider the relative feasibility and impact of potential policy approaches.
We outline each consideration step, the available options, and our recommendations in this report.
1. Which businesses fall within the target's scope?
The OOH sector in the UK is diverse. This is especially apparent when compared to the retail sector, where just 11 retailers represent over 95% of the grocery market and have relatively homogenous product portfolios.
Large businesses, as defined by English calorie labelling legislation, have 250+ employees, covering about 695 UK out-of-home businesses in 2024, including quick and full-service restaurants, pubs, cafes, catering companies, and hotel chains. By contrast, micro, small and medium enterprises (<250 employees) account for approximately 211,000 UK businesses.²
The ratio of contribution to consumer spend is very different to this: although large chain businesses make up less than 1% of all OOH businesses in the UK, they account for 35% of total consumer spend (as seen in Figure 2), with micro, small and medium-sized enterprises (SMEs) accounting for 65%. Large businesses, therefore, represent a practical and impactful starting point for policy intervention.
Figure 2: Proportion of businesses and consumer spend attributed to micro, small, medium (SMEs), and large businesses within the OOH sector
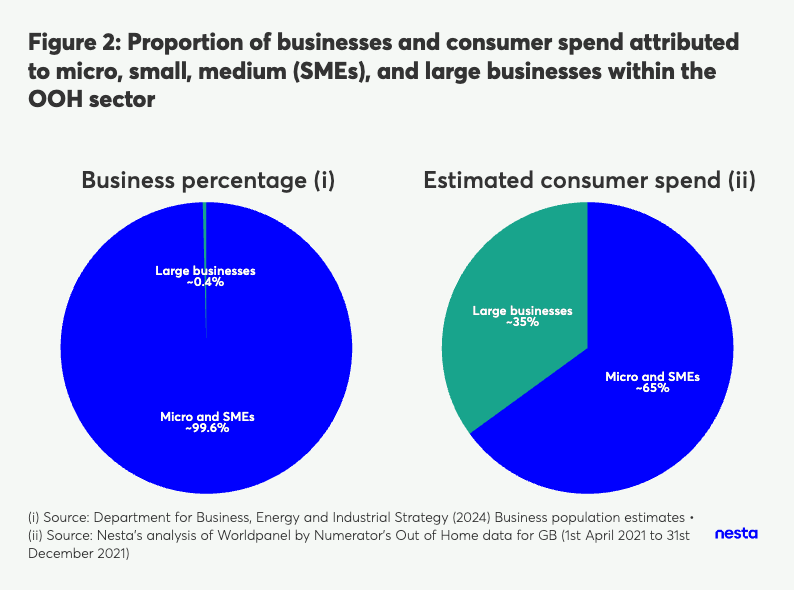
(i) Source: Department for Business, Energy and Industrial Strategy (2024) Business population estimates
(ii) Source: Nesta's analysis of Worldpanel by Numerator's Out of Home data for GB (1st April 2021 to 31st December 2021)
Large grocery retailers also play a significant role, contributing 18% of the 340 average daily calories purchased from the OOH sector through their food-to-go offerings (eg, meal deals, hot counters). However, they are not classified as OOH businesses, and these sales would, in practice, be captured by our previous retailer health targets proposal. Therefore, we have excluded these large grocery retailers from Figure 2 and this report's scope. The businesses visualised in Figure 2 and covered in this policy report account for the remaining ~82% of average daily OOH calorie purchases.
Health targets should ideally apply to all OOH businesses to ensure a level playing field. However, SMEs face significant barriers to compliance, including limited capacity to meet data and reporting requirements, for example, reporting nutritional data and linking sales to this nutritional information. The financial constraints of SMEs make investment in this infrastructure unfeasible. To make policy viable for all businesses, these compliance barriers for SMEs must be addressed, although it is not for this paper to do so.
In contrast, large businesses have greater resources and better data infrastructure, making them well-positioned to implement and report against health targets. Therefore, as a first step, we set out to explore the viability of mandatory health targets for large OOH businesses as an immediate policy solution to improve the healthiness of their food sales.³ This step enables policymakers to create an effective framework for improving the OOH food environment now, whilst considering the potential to expand to SMEs as data, monitoring, and implementation challenges are addressed.
We note that there are considerations for policy makers in limiting the scope of health targets to large businesses. Firstly, it is plausible that limiting targets, or any regulation, to large OOH businesses only could risk shifting consumer demand for less healthy meals to SMEs, which may lack incentives to improve, potentially increasing the demand or consumption of less healthy meals. Moreover, large businesses are key economic contributors, and imposing such targets could mean they face unbalanced economic implications compared to SMEs – potentially affecting their operational efficiencies, employment, and revenue streams relative to unregulated SMEs. Evidence highlights the importance of addressing SME food offerings with recent Nesta analysis of independent takeaway meals, finding an average of 1,289 calories per meal, with 99% exceeding the recommended 600 kcal and some surpassing the recommended daily intake of 2,000-2500 kcal for women and men, respectively. Therefore, the likelihood and scale of this displacement risk would need to be evaluated before implementing targets for large businesses in isolation.
Despite this consideration, implementing health targets for large businesses remains a strong and practical first step in improving the OOH food environment that creates a level playing field, at least for large food businesses. These businesses generate a significant share of sector revenue, have better data infrastructure, and are well-positioned to drive meaningful change now. Therefore, policy makers should not delay.
Looking ahead, it is important to consider how SMEs might eventually be brought into the policy framework. Advances in novel technologies offer promising solutions: for example, innovative methods such as image-based calorie estimation can help approximate the nutritional content of products without the need for extensive laboratory analysis. Nesta is currently running a project to work with a partner to create a solution which uses machine learning and publicly available data to estimate the calorie content of SME meals as a way of reducing one of these compliance barriers.
In addition, modern point-of-sale systems could be integrated with nutritional databases to track the healthiness of products alongside their sales data automatically. With clear policy intent and targeted investment in these technologies, SMEs could gradually be supported to overcome current compliance challenges, paving the way for a more comprehensive, sector-wide approach to improving public health.
In conclusion, large businesses are in a state of much greater readiness to comply with outcomes-based regulation compared to SMEs and comprise a significant proportion of the OOH sector. Policy makers are therefore right to expedite action on large businesses, as committed to in the healthy food standard, whilst also considering options and facilitating solutions for SMEs in parallel.
2. Should the target be mandatory?
The OOH sector has historically experienced limited public health-related regulatory pressure, especially in contrast to the retail sector, which has been subject to several policies aimed at restricting the placement, promotion and advertising of high-fat, salt, sugar (HFSS) products. Existing OOH measures such as the junk food advertising ban, mandatory calorie labelling and voluntary sugar, calorie, and salt reduction targets are not the most effective solutions.
Mandatory calorie labelling, while potentially useful for incentivising reformulation, portion control, and informed decision-making, places the onus on consumers to translate information into behaviour change – an approach proven to be of low impact at scale. Voluntary targets have yielded some improvements in the salt content of food, but progress has stalled, and other targets have failed to meaningfully reduce sugar and calorie levels across the board, despite their robust design. Data shows that retailers and manufacturers have delivered some degree of change, but no overall improvements have been achieved in sugar content across OOH categories and average calories per serving have even increased across some main product categories.
Therefore, mandatory policy is essential to ensure compliance and impactful action from businesses. It is promising that the announced healthy food standard commits to mandatory targets.
3. What data should businesses have to monitor and report to evidence compliance with a target?
A mandatory health target policy relies on a robust metric that accurately reflects the healthiness of the food products sold by businesses. To establish such a metric, businesses would have to internally monitor the nutritional content of their offering and report these data externally to assess compliance. However, it is also important that businesses track and report the sales volumes of their products alongside their nutritional content. Incorporating sales with nutrition data creates a sales-weighted metric.
A sales-weighted health metric accounts for the actual sales volume of products, ensuring that high-selling items influence a business' overall health measure more than low-selling ones (see Box 1 for a worked example). This provides a more accurate picture of what consumers are actually buying.
The alternative – a simple average – gives equal weight to all products, regardless of sales. This is sub-optimal because a rarely purchased healthy item would hold the same influence as a best-selling high-calorie meal, failing to reflect the true health impact of a business' food offerings (see Box 1 for a worked example).
Given that a sales-weighted metric is significantly more accurate, businesses should be required to provide both sales and nutrition data (rather than just the composite metrics based on these data) and internally be able to link the two to monitor and report against a target based on a sales-weighted health metric. Without this reporting, meaningful health targets would be difficult to accurately track. Since this level of data collection and integration is relatively complex, it is likely that only large businesses, which already collect calorie data under labelling laws, would be able to comply.
Box 1: Why sales weighting matters: a worked example
Imagine a business sells two meals:
- Salad (300 kcal) – Sold 1,000 times
- Burger (800 kcal) – Sold 10,000 times
A simple average would calculate the business's health score as:
(300 + 800) ÷ 2 = 550 kcal per product
A sales-weighted average properly accounts for actual sales:
((300 × 1,000) + (800 × 10,000)) ÷ (1,000 + 10,000) = 770 kcal per product
This shows that while the simple average suggests healthier sales (550 kcal), the sales-weighted metric (770 kcal) reflects the reality that businesses predominantly sell the higher-calorie option.
4. Which sales-weighted metric is the most appropriate measure of health?
Suggested Approach:
Based on our appraisal of several metric options, we find that sales-weighted average (SWA) energy per product (EPP) and SWA Nutrient Profiling Model (NPM) both offer potentially viable approaches with different trade-offs. SWA EPP is likely more feasible in the near term (as it requires data businesses already collect to comply with calorie labelling legislation), may deliver more impact on obesity and better incentivise portion size reduction. By contrast, SWA NPM offers a route to more holistic improvement in health and is consistent with our recommendation for targets for grocery retailers.
For those interested in the methodology for identifying these metrics, the following section explores our appraisal of several metrics in detail.
We appraised several sales-weighted healthiness metrics (see Table 2 for all metrics) to underpin a target for the OOH sector against the following criteria:
- Metrics should be continuous/semi-continuous, not binary:
Targets based on a continuous metric (a type of quantitative data that can take on any value within a given range, allowing for infinite precision) incentivise change across a business' product portfolio, whereas a binary (measures an outcome with only two possible results) target only incentivises change in a narrow subset of products close to the threshold. This makes continuous metrics more impactful for public health and gives businesses a wider set of options to improve product healthiness.
- Metrics should use readily available nutrition data and be based on an existing metric:
Given varying data capabilities across OOH businesses, targets should leverage existing or planned industry metrics to ensure swift implementation without creating undue reporting burdens.
- Metrics should incentivise portion size reduction:
Portion size is a core part of the operating model of many OOH businesses (as compared to grocery retail). Evidence shows that portion sizes in the OOH sector can be excessively large. Health measures should be sensitive to portion size in order to incentivise businesses to make subtle reductions in portion size to maximise health improvements.
- Metrics should be holistic and capture several elements of health:
The healthiness of food is dictated by a range of factors, primarily its macronutrient (calories, salt, sugar, saturated fat, protein, fibre, etc) content, which should be measured by the health metric.
Table 2: Summary evaluation of different health metric options against our appraisal criteria
| Metric |
Definition |
Continuous |
Available Data & Existing Metric |
Incentivises Portion Size Reduction⁴ |
Holistic |
| Calorie density (per 100g) |
Total calories per 100 grams of a product. |
✓ |
✓ |
X |
X |
| Energy per product |
Total calories in a single product. |
✓ |
✓ |
✓ |
X |
| UK Nutrient Profiling Model (NPM) score |
A scoring system that evaluates the overall nutritional quality of a food product based on its nutrient composition. |
✓ |
✓ |
X |
✓ |
| 'Negative' NPM points score |
A scoring method that only assigns points for less healthy nutrients, with higher scores indicating lower nutritional quality. |
✓ |
X |
X |
✓ |
| Portion size adjusted NPM scores |
NPM scores that are modified to account for the size of food portions. |
✓ |
X |
✓ |
✓ |
Considering these criteria, we shortlisted two health metrics, already used across the food industry, to try to model health targets – SWA energy per product and UK nutrient profiling model scores.
- Energy per product is a measure of the total calories in a single food product or portion served in the out-of-home sector. It is the same information that is required on menus for large OOH businesses, following the introduction of calorie labelling legislation.
- Nutrient profiling model (NPM) score is a holistic measure of health that assigns a numerical score to food products based on their nutritional content (energy, sugar, saturated fat, sodium, protein, fruit, vegetables and nuts, and fibre).
The energy per product metric provides the most direct route to reducing rates of obesity as it specifically incentivises a reduction in both portion sizes of products and their total calorie content, making it more impactful than an NPM-based measure for obesity reduction. Stakeholders also expressed that data required to report progress against this metric should also already be held by all large businesses in the UK, as they currently face a legislative requirement to display energy per product information on menus. This may facilitate the policy being implemented at a faster rate than if using an NPM metric, as currently, large OOH businesses may not have consistent data coverage for all the nutrient components of the NPM for all products. However, it should be noted that the infrastructure to link sales and health data may be lacking across a large proportion of businesses. Energy per product may also be more feasible for SMEs to track compared to composite health measures like NPM scores, as it could potentially be estimated using calorie calculations based on product ingredients or novel image-based calorie estimation technologies. However, we note that facilitating this shift for SMEs would require clear policy intent, along with investment and support to overcome their compliance challenges.
Depending on the criteria one prioritises, the SWA NPM score metric also has advantages, as it is a more holistic measure of health and would align implementation across retail (the SWA NPM metric is the basis for our retailer health targets proposal) and OOH sectors. However, its key limitation is its lack of sensitivity to portion size, as it measures healthiness according to nutrient density per 100g rather than overall nutrients per product. This means a product can appear healthy when considered per 100g while providing excessive calories in a single portion, eg, a single Burger King Double Whopper qualifies as ‘healthy' under the NPM metric⁵ but contains 813kcals in the whole burger, nearly 40% of an adult female's daily intake. Policymakers and stakeholders from NGOs expressed the priority of addressing portion sizes, recognising the greater sensitivity of the energy-per-product metric to this.
Given the benefits of a holistic health measure, a calorie- or portion-size-adjusted NPM would provide the most ideal, comprehensive health metric. However, no government-endorsed version currently exists. Therefore, this ideal long-term approach falls outside the scope of this proposal.
Both SWA EPP and SWA NPM offer viable measures of health, which would be the most appropriate choices for a health target in the OOH sector, though both have tradeoffs. The specific choice by policy makers would be partly dependent on relative impact, which would require submission of data by businesses to assess (see next section – we were unable to reliably model an SWA NPM target due to the limited availability of all elements of the NPM).
Box 2: A note on reporting
Mandatory data reporting, as committed to in the healthy food standard, would be a crucial first step in setting targets in the out-of-home sector. Expediting this process is crucial, and the government should therefore build on proposals published by the Food and Data Transparency Partnership (FDTP).
Considering the published FDTP recommendations against the two metrics considered optimal in this report, SWA NPM is already included; however, some businesses told us that data systems are not in place to monitor or report this metric (though this may have changed as businesses prepare for advertising restrictions to be implemented, which will require businesses to hold accurate NPM data on advertised products). Therefore, announcing the data required in reporting as soon as possible is crucial to give large OOH businesses lead in time to ensure systems are in place to monitor and report this metric.
SWA EPP is not included within recent FDTP recommendations, which include sales-weighted calorie content per/100g as the metric most appropriate for the OOH sector. We recommend that SWA EPP should be included in mandatory reporting, given that it much better accounts for portion size. Importantly, the monitoring and reporting of SWA EPP would require businesses to collect no new data, given it is already used to comply with mandatory calorie labelling regulations.
Reporting should be as granular as possible to ensure that improvements in top-line metrics really are delivering the improvements intended, not leading to unintended consequences and that metrics are not being gamed. For example, reporting nutrient profiling model (NPM) score should not just be whether a food is HFSS or non-HFSS, or the overall NPM, but the full NPM score, and the content of any metrics that go into that composite measure. To understand NPM's impact on obesity, it is necessary to know which specific nutrients (sugar, protein, and fibre) are being altered.
The energy per product metric is vulnerable to potential manipulation, where businesses could reclassify what constitutes a 'product' to artificially lower their SWA energy per product score without achieving substantial changes in the overall healthiness of their product offerings. For example, a business could split a standard packaged sandwich into two smaller packaged halves and classify each half as a separate product. This would artificially lower the SWA energy per product score without reducing the total calories consumed, undermining the intended health improvements.
These examples present important reasons why reporting should be granular to enable meaningful monitoring. As these data are already required by businesses to calculate SWA NPM and SWA EPP scores, this should not be a significant additional burden.
5. What type of target framing should be used, absolute, group absolute or relative?
Suggested approach:
Having explored various options for target structures, we found that an absolute target approach, as we recommended for grocery retailers, would not be feasible. However, a group absolute, or a relative reduction health target, could both offer viable options for a targets-based approach, with the former maximising fairness, and the latter, simplicity. It is plausible that both could offer a similar balance of achievability and impact; however, further analysis of real-world business data would be necessary to assess which framing is optimal and, therefore, mandatory data reporting should be expedited.
Read ahead for more details on our appraisal of absolute, group absolute and relative target structures.
Box 3: Data and modelling
To determine the best framing and ambition level for a target based on our shortlisted health metric, we developed a modelling approach that simulates changes in OOH business products and sales to model how businesses could meet the target and the expected public health benefits.
1. The data
For our analysis, we used Worldpanel by Numerator's OOH data for GB from 1st April 2021 to 31st December 2021 from a sample of 7,500 people aged 18+ in Great Britain, augmented with nutritional data (whilst the sample includes data for those aged 13,+ our analysis was for aged 18+ only).⁶ The data captured the nutritional profile of sales portfolios for 90 of the [700 large OOH businesses in the UK](https://www.nesta.org.uk/report/health-targets-for-out-of-home-food-sector-technical-appendix/) in 2021, offering the most comprehensive available sector overview. The nutrition and sales data were used to calculate the healthiness of each OOH business (using branded and own-brand food products).
2. Modelling improvement in business portfolio healthiness
Using this data, we modelled the changes that would be required to each businesses' sales in 2021 to improve the overall healthiness of sales per business, without changing spend (so cost to consumers or the revenue per business). We modelled a combination of two potential changes for each business to their goods sold in the Kantar dataset:
- Reformulating – reducing the total calorie content of unhealthy products. In practice, this can occur via recipe or portion size change.
- Shifting sales towards healthier options
We sought to apply realistic modelling constraints which were informed by structured consultation with industry representatives. This ensured the final conditions reflected realistic improvements that would not incur a significant financial burden. This collaborative approach grounded the conditions in industry perspectives, minimising the risk of major cost increases and higher consumer prices. For information on modelling constraints, see our technical appendix.
We chose to keep consumer spend (our proxy for business revenue and market share) constant, as we did not intend to model market growth or shifts in market distribution between businesses, and also to ensure changes were economically viable for businesses. These constants were built into our model to show if and how businesses could meet proposed targets from their baselines, in a way that aligned with our goal of minimising economic disruption for businesses and consumers while supporting public health.
Model limitations
We note that this is an experimental model, intended to demonstrate that there are alternative combinations of products that can be sold by UK large OOH businesses, that would lead to significant population health improvements, with feasible changes to their product portfolios and without impacting revenue. It is not a predictive model of the impact of implementing a target on the UK economy or population health in 2025.
This model is built on the best available (but ultimately imperfect) data. Kantar Worldpanel is a consumer survey, representative of individual consumption rather than business sales. Estimates of the shares of products and the market share of individual businesses below should therefore be treated with caution, particularly for businesses with a lower market share overall.
We were unable to reliably model an SWA NPM target due to the limited availability of all elements of the NPM. Conclusions below are therefore for SWA energy per product only.
Our current complimentary proposal for retailer health targets follows an 'absolute' target framing – it proposes a single target set around the level of the current top performer. An 'absolute' target framing is ideal as it ensures a uniform, achievable standard for all businesses, creating a level playing field whilst driving impact. To adapt this framework for the OOH sector, two conditions would need to be met:
- The product offerings of businesses need to be relatively similar to ensure comparisons between them are appropriate.
- Businesses must be similar enough in the healthiness of their offer to ensure the target is achievable within reasonable parameters, unless it is acceptable for many businesses to miss the target and face potential enforcement.
Initial assessment of all large OOH businesses in the UK demonstrates that these conditions are not met. Unlike the 11 largest UK retailers, large OOH businesses offer very different cuisines and products, ranging from British to South African cuisine to pizza and sushi. As a result, these businesses have large variations in their baseline healthiness. Given these large baseline differences, our modelling suggests that getting every large business to the same level as the top performer of the whole sector would require potentially unfeasible changes for many businesses, meaning our second condition for an absolute target set near the level of the best player is not met for OOH.
The observed differences in businesses' product offerings and healthiness signal the need for alternative target framings. We appraised the following alternatives:
1. Group absolute target
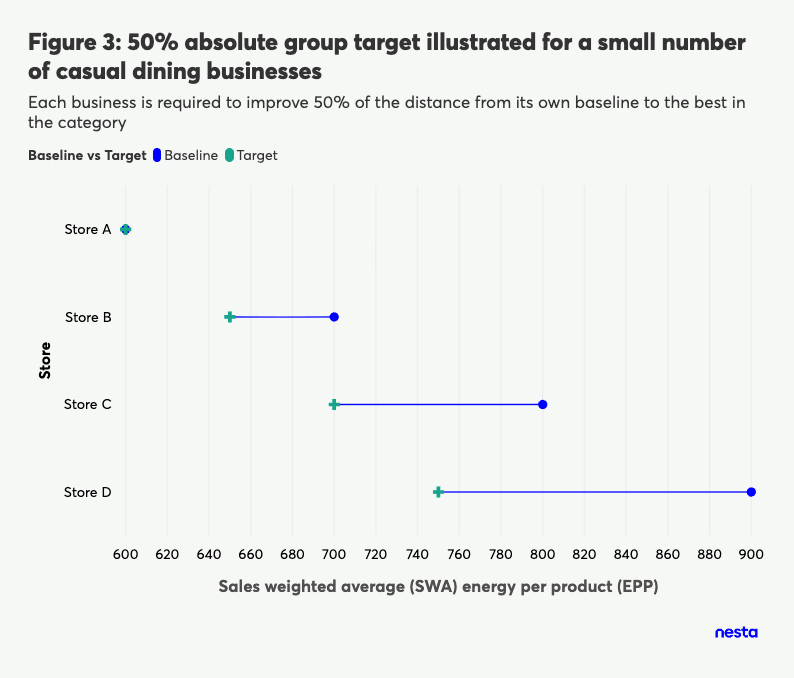
Group businesses then have an overall goal at or just above the level of the current top performer for all businesses to reach within their respective groups. There are a number of ways this could be implemented, but we have explored setting a health target for all businesses to either reach the level of the group's top performer or to each reduce the distance between themselves and this level by X% (illustrated for SWA EPP in Figure 3).
Figure 3: 50% absolute group target illustrated for a small number of casual dining businesses
Each business is required to improve 50% of the distance from its own baseline to the best in the category
2. Relative target
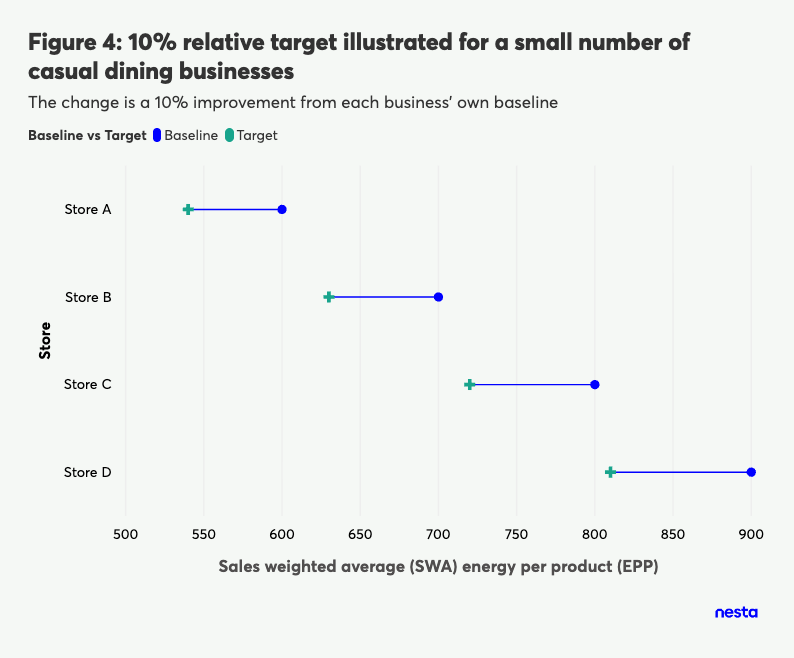
Set a target for all businesses to improve from their own baseline by X%. In this framing, a business is only being compared to itself rather than a competitor (see figure 4 below).
Figure 4: 10% relative target illustrated for a small number of casual dining businesses
The change is a 10% improvement from each business' own baseline
To decide the optimal option, we assessed the 'group absolute' vs 'relative' targets against the following criteria:
Simplicity – Does this framing remove the added complexity of business groupings to set the target?
Fairness – Does this framing recognise top performers and their past efforts to improve health?
Achievability-impact balance – Does one approach offer a higher impact with more attainable thresholds?
The group absolute target approach requires OOH businesses to be categorised to create an appropriate overall goal for businesses to meet. We developed a set of categories through industry consultation, grouping businesses on key characteristics such as cuisine type and operational channel, eg, quick service restaurant, full service restaurant, cafes etc, (see technical appendix for more details). Even after splitting businesses into these groups, we still find large inter- and intra-group differences in baseline healthiness as seen in Figure 5. This level of variation in baseline healthiness was not seen with the large GB grocery retailers.
Figure 5: Distribution of the SWA energy per product across large OOH businessess
Baseline healthiness differs greatly within and across similar business groups
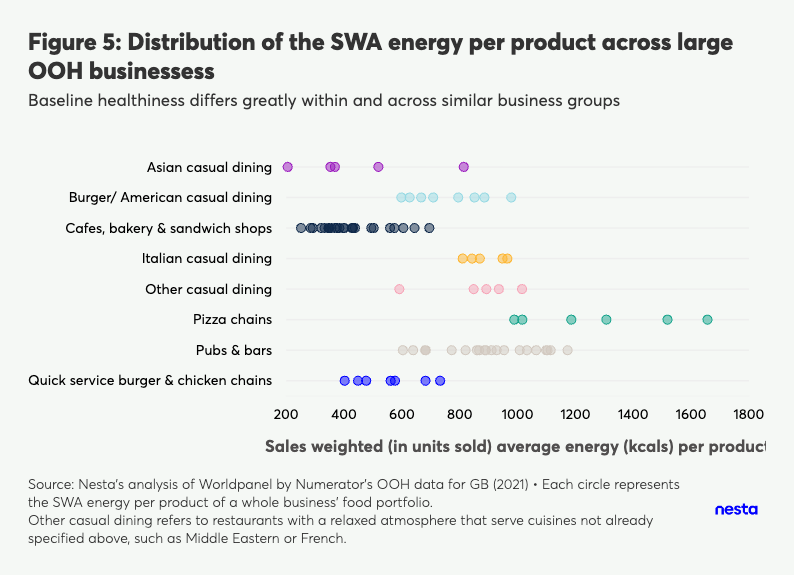
Source: Nesta's analysis of Worldpanel by Numerator's OOH data for GB (2021) • Each circle represents the SWA energy per product of a whole business' food portfolio.
Other casual dining refers to restaurants with a relaxed atmosphere that serve cuisines not already specified above, such as Middle Eastern or French.
In practice, stakeholders articulated that defining these business groupings for policy may be contentious, as there is no existing framework or legal requirement for businesses to classify themselves. However, a group absolute target would likely be fairer as it holds all businesses to the standard of current top performers and recognises their existing efforts (also deemed important by stakeholders).
By contrast, in a relative target framing, a business is compared to its own baseline; hence, its business group becomes superfluous, making it a simpler option. However, it seems intuitive that a group absolute target would overall be fairer than setting the same relative target (eg 10%) for all businesses. It is true, though, that a relative target would not be completely 'unfair' as for top performers, lower numerical improvements are required compared to businesses with a poorer baseline to hit the same relative reduction target. For example, under a 10% relative reduction target, a healthier business with a SWA energy per product of 200 calories would need to reduce the SWA EPP by 20 calories, while an unhealthier one with a SWA energy per product of 300 calories would need to reduce by 30 calories. We were unable to compare the fairness of these approaches fully due to our sample and this should be explored by policy makers using a whole sample of large business data. One possible approach which could increase the fairness of a relative target could be to set a different (staggered) target depending on the existing baseline of different businesses (eg businesses in the top third would be set a 5% target, those in the middle third a 10% target and those in the bottom third a 15% target).
Calculating the maximum improvements that businesses can make in the conditions of our model through the different target framings allowed us to evaluate the best achievability-impact balance for different target framings (see Table 3).
Table 3: Comparison of the achievability-impact balance of the target options for a relative vs group absolute target framing
Relative target (% SWA EPP)
| Target level |
Kcal reduction per person per day (without compensation) |
Kcal reduction (with compensation) |
% businesses meeting the target |
% market share achieving the target |
| 5% |
6 |
5 |
100% |
100% |
| 10% |
9 |
7 |
98% |
100% |
| 15% |
13 |
10 |
73% |
99% |
| 20% |
17 |
13 |
6% |
1% |
| 25% |
18 |
14 |
2% |
1% |
Group absolute target (% represents improving SWA EPP x% towards best in category)
| 25% |
5 |
4 |
100% |
100% |
| 30% |
6 |
5 |
92% |
99% |
| 40% |
7 |
6 |
77% |
98% |
| 50% |
9 |
7 |
57% |
95% |
| 75% |
10 |
9 |
31% |
54% |
| 100% |
11 |
9 |
29% |
53% |
A 7 kcal per person per day reduction (factoring in compensation⁷) could be achieved if a similar proportion of the market share (within our sample) achieved either a 10% relative SWA-EPP target or a 50% SWA-EPP group absolute target. The proportion of the market share able to meet these targets is comparable (100% vs 95%), which suggests these changes may be economically viable for the sector. The proportion of businesses achieving the target is significantly different (98% vs 57%); however, as discussed in the technical appendix, the dataset used does not completely capture all unique products that are sold by relatively smaller OOH businesses and therefore, strong assertions should not be made regarding the proportion of businesses achieving a target. In summary, it is plausible that there could be a similar achievability-impact balance for both types of target framing, though it seems more likely that this would be more optimal for relative framing. Further analysis of real-world business data would be necessary to assess which framing is optimal and therefore, mandatory data reporting should be expedited.
The impact of out-of-home (OOH) health targets on obesity
Our modelling, based on 2021 data, suggests that either a group absolute or a relative reduction target could reduce calorie intake among populations living with overweight and obesity by an average of approximately 7 kcal per person per day, whilst also being achievable and economically viable for a majority of the market (all estimates factor in compensatory intake of 23%). A sustained calorie reduction of this magnitude over a three-year period would lead to an approximate 2.5% relative reduction in the prevalence of obesity in the UK (based on an absolute 0.7 percentage point reduction from 29.1% to 28.4%) and a 1.6% relative reduction in people living with excess weight (based on a 1.0 percentage point reduction from 66.6% to 65.6%) (see technical appendix for more detail).
This would translate to around 320,000 fewer people living with obesity in the UK and around £1.5 billion in annual cost savings to society on average over three years.
To contextualise this impact, it's important to understand the OOH sector's contribution to overall calorie consumption. The sector contributed an average of 14% of daily calories consumed by adults aged 19-64 between 2019 and 2023. However, this average hides a large variation, with ~15% of the UK population consuming over 500 calories per day from OOH (in 2021). For this population group, the impact of the health target may be significantly larger. It should also be noted that the potential impact would be significantly higher if the removal of implementation barriers brought SMEs into the scope of mandatory health targets.
Implementation plan for out-of-home (OOH) health targets
In our earlier work on retailer targets, we created a comprehensive five-year implementation plan for the Government to ensure maximum impact from the policy. The OOH health targets we have explored are distinct from our previous retail proposal and require a tailored implementation approach. We have not been able to derive the same level of specificity of recommendations for the structure of a target for OOH as we were for retailers due to the complexity of the sector and the nature of the data we have been able to use (which is representative of consumer purchases in the UK but is not stratified by business and does not contain comprehensive nutritional information). However, we are able to present more general but nonetheless clear recommendations from this work for the implementation of OOH targets and the healthy food standard as a whole.
Apply targets to large OOH businesses.
The healthy food standard is right to focus on large businesses. We have defined large businesses as those with 250+ employees, as classified in the existing UK calorie labelling legislation. This would capture approximately 700 businesses, including restaurants, pubs, cafes, catering companies, and hotel chains, but would exclude supermarket food-to-go, which would be covered under our retailer targets proposal. Alternative definitions could be explored during policy consultation.
Develop a mandatory reporting and monitoring infrastructure at pace, building on the Food Data Transparency Partnership.
The healthy food standard commits to mandatory reporting and targets for large businesses. This is crucial given the impact of previous voluntary schemes. Collection of granular data is crucial to enable further refinement of an OOH targets policy, such as defining which metrics and which target framing are optimal. In order to expedite this process, the government should build on the work carried out by the Food Data Transparency Partnership (FDTP) at pace. Reporting will facilitate comparison across different OOH companies, but also between OOH and retail.
Better data is the rate-limiting step to determine the framing of a target (eg relative vs group absolute) and the baseline for business improvement targets.
The process for determining which type of target is optimal and subsequently setting businesses' baselines for a target is likely to be a more complex exercise than for targets for large grocery retailers due to the need for further policy development (regarding the optimal metric and target framing) and the large number of companies involved. This presents another important reason to expedite mandatory data reporting.
Monitoring and enforcement.
Reporting should be as granular as possible to ensure that improvements in top-line metrics really are delivering the improvements intended, not leading to unintended consequences and that metrics are not being gamed. As per our recommendation for mandatory targets for grocery retailers, financial penalties for poor compliance should be enforced with sufficient lead time so that businesses have enough time to make changes to their practices to achieve the targets and avoid the costs of fines. The structure of financial penalties will likely need consideration after the target framing is chosen: eg whilst a relative target approach makes it viable to set broadly achievable targets across a highly heterogeneous OOH sector, government would need to consider how any financial penalty structure could be applied equitably: it may be unfair to level the same proportional fine on businesses which have significantly different overall healthiness of sales. An organisation such as the Food Standards Agency (FSA) should hold the powers to enforce the targets and impose penalties.
Staggering implementation timelines of targets for retail and OOH.
The OOH sector has historically faced fewer health policy requirements than major retailers. As noted above, there are likely reasons why setting of targets for large OOH businesses will take longer than for retailers, whichever metric is chosen. In addition, the impact expected for targets in the large business OOH sector is estimated to be significantly smaller than for retailers. This is because sales from the major retailers account for a significantly larger proportion of our diets (over 80%). We estimate that our mandatory retailer targets proposal estimate could achieve an approximate 20% reduction in obesity prevalence and generate £16bn in annual value to society. Therefore, if government is seeking to prioritise the speed of public health impact, it should not let challenges of setting targets for large OOH businesses delay the process of setting targets for grocery retailers (however, the respective timelines for enforcement of targets for retail and OOH, and if or how these should be staggered, requires further consideration). Deciding the necessary incentives for retailers to meet targets or penalties for not reaching them does not need to delay targets being put in place, so these can start improving people's health.
As government legislates the healthy food standard, they should ensure powers are included to set targets across all large food businesses within this parliament, independent of where they are implemented first (assuming doing this does not delay targets becoming mandatory for grocery retailers).
Whilst target setting will take longer for OOH, this will send a clear message of intent to the whole food sector regarding the importance of a level playing field, even if setting OOH targets happens later.
Given the rapid expansion of the OOH sector and growing evidence of its impact on public health, a balanced and proactive policy approach is essential. The commitment within the healthy food standard to set mandatory health targets for large OOH businesses is a viable and impactful policy solution. What is clear is that maintaining the status quo is not an option. The continued growth of the OOH sector and its influence on public health demand decisive action. Our initial work suggests that getting this right could lead to around 320,000 fewer people living with obesity in the UK, and that every year we wait could result in the loss of £1.5 billion in annual cost savings to society.