Nesta Working Paper 14/09
October 2014 (Revised in October 2015)
www.nesta.org.uk/wp14-09
Abstract
This paper focuses on the sources of labour productivity at a disaggregated sector level using a range of methods for decomposition and varying a number of the underlying assumptions. Pulling together this body of evidence offers us one of the most holistic pictures of British sectoral dynamics and labour productivity over the period 1998 to 2007. The introduction of the dynamic Olley and Pakes decomposition method by Melitz and Polanec (2012) offers an alternative approach to the standard dynamic decomposition developed by Foster, Haltiwanger and Krizan (2001). Our findings indicate that at the firm level, entry and exit have played a relatively minor role in improving labour productivity growth, although this masks a great deal of variability in the performance of entrants and exitors. A much more significant contribution to labour productivity throughout the period was achieved through the market share growth of incumbent firms with above average productivity. The interpretation of findings is sensitive to underlying assumptions and the approach adopted.
JEL Classification: L11; O47
Keywords: Productivity decomposition, Labour productivity, sector dynamics
This work was based on data from the Business Structure Database and the Annual Business Inquiry, produced by the Office for National Statistics (ONS) and supplied by the Secure Data Service at the UK Data Archive. The data are Crown Copyright and reproduced with the permission of the controller of HMSO and Queen's Printer for Scotland. The use of the data in this work does not imply the endorsement of ONS or the Secure Data Service at the UK Data Archive in relation to the interpretation or analysis of the data. This work uses research datasets which may not exactly reproduce National Statistics aggregates. We would especially like to thank Albert Bravo-Biosca, NESTA, who has been instrumental in the development of this paper, and also an anonymous referee for their helpful comments. Corresponding Author: Dr Chiara Rosazza Bondibene, NIESR, 2 Dean Trench Street, London, SW1P 3HE, [email protected]
This paper was originally issued in October 2014. Some amendments have been done to the original research and a corrected version has been re-issued in October 2015.
The Nesta Working Paper Series is intended to make available early results of research undertaken or supported by Nesta and its partners in order to elicit comments and suggestions for revisions and to encourage discussion and further debate prior to publication (ISSN 2050-9820). Year 2014 by the author(s). Short sections of text, tables and figures may be reproduced without explicit permission provided that full credit is given to the source. The views expressed in this working paper are those of the author(s) and do not necessarily represent those of Nesta.
Key findings
This paper focuses on the sources of labour productivity growth at a disaggregated sector level using a range of methods for decomposition and varying a number of the underlying assumptions.
In general, productivity growth at sector level is expected to benefit greatly from market competition which helps to reallocate resources from comparatively low-productivity firms to high-productivity firms. However, our new evidence for Britain suggests that allocative efficiency (a measure of the relationship between market share and productivity at firm level) declined rapidly in some large service sectors such as retail and hotels and catering during the pre-recession period 1998-2007. Since services account for a large majority share of employment in the economy, these developments contributed to a decline in allocative efficiency between 1998-2007 across all firms with ten or more employees.
During this period internal restructuring within continuing firms contributed an estimated 20 percentage points (pp) to growth in average labour productivity in the total economy (including firms with 1-9 employees). But average labour productivity in the total economy grew by only 16% over this period as the effects of internal restructuring within continuing firms were partly offset by negative growth of -4 pp in the combined effects of external restructuring (such as the reallocation of resources between continuing firms as some of them gained market share and others lost it, and the reallocation of resources arising from firms entering and exiting particular markets).
The main sectors where external restructuring had negative effects on productivity were hotels and restaurants, transport and storage, real estate and other business services, mining and utilities, food and drink manufacturing and textiles manufacturing.
The net effects of firm entry and exit on productivity were found to be relatively small for the aggregate economy between 1998-2007. However, when entrants and exitors were disaggregated between firms with above-average productivity and those with below-average productivity, the overall negative effect of net entry was found to conceal a positive contribution of 1.5 pp by high-productivity entrants which was more than cancelled out by the -2.3 pp contribution of low-productivity new firms. At the same time the relatively small positive net effect of firms exiting their markets concealed a 7.7 pp contribution by low-productivity exitors which was heavily offset by the -5.9 pp impact of firms exiting even though they had above-average productivity levels.
Low-productivity entrants were most conspicuous in business service sectors and in transport equipment manufacturing. This may reflect above-average ease of entry for weaker performers in those sectors. Further research would be useful to explore the extent to which such entrants survive and manage to improve their performance over time.
The exit of low-productivity firms made an important contribution to productivity growth in business services, construction and food and drink manufacturing but not in most other service or manufacturing sectors. In sectors such as post and telecommunications, hotels and catering, retail, wood products, chemicals and transport equipment, the exit of low-productivity firms appears to have happened too slowly or on an insufficient scale for this form of restructuring to contribute substantially to productivity growth.
Furthermore, in several sectors the exit of low-productivity firms was offset to a great extent by the exits of high-productivity firms. Examples of sectors in this category included mining/utilities, other business services, electrical and optical equipment manufacturing, non-metallic minerals manufacturing, construction, wholesale trade, renting of machinery and equipment and computer services.
Further research should be able to shed light on the main reasons for some high-productivity firms failing to survive in these and other sectors. Possible explanations include market imperfections such as funding constraints or anti-competitive practices.
requirement that firms maintain their composition over time. Therefore, it is entirely possible that
reporting units can change the local units that they report for. The third level is the enterprise
reference level. This is an economically meaningful unit which remains consistent over time. The
final unit is the ultimate owner (WOWENT), which aggregates firms up to holding company level.
For this study we take the enterprise as the unit of analysis (classified as ENTREF in the IDBR). A
limitation of doing so is that analysis based on clearly defined geography is more complicated. A
number of the decomposition studies that have been carried out, particularly for the UK, have been
based on plant level data (i.e. units below the enterprise level). As a unit of business within
manufacturing, the plant makes intuitive sense but this is arguably less relevant in the context of
service sectors. Moreover, because financial data are not collected at the local unit level, any data
needs to be spread back from reporting units on the basis of employment information, thus in
principle assuming the same level of productivity across all the local units which form part of each
reporting unit. In the majority of cases, firms are single site enterprises and so the plant is
equivalent to the firm or enterprise. The ARD contains on average around 50,000 enterprises in any
single year.
3.1.2 Sampling issues
A problem faced when using the ARD is that smaller firms are surveyed on a sample basis and
therefore can exit the data set not only as a result of business closure but also because of sampling
rules. In Section 3.2.1 below, we elaborate on how this is dealt with. Complications arise not just
because of difficulties in defining entry and exit components but because the decomposition
approaches in this study rely on market shares. However, while a large number of enterprises 'drop
out' of the ARD on the basis of employment size due to sampling, these account for a relatively small
proportion of overall output. In terms of our decomposition, we include all firms available in the
ARD, although we acknowledge that our coverage of the under 100 employee enterprises is less
than complete because of the issues highlighted. This may raise the question why the ARD is used
rather than the BSD for the decomposition analysis. The advantage of the ARD is that it includes
value added information, a more appropriate measure for labour productivity. In our analysis below
we consider the sensitivity of the findings to whether the BSD or the ARD is analysed.
3.2 Data construction
The period of analysis is 1998 to 2007. More recent data are available but, at the time of analysis,
there were a number of unresolved coding issues with some post-2008 data, particularly with
respect to the enterprise reference number (entref), our chosen unit of analysis. Moreover, given
that the financial crisis began to take hold in 2008 there is something of a structural break around
this time. We therefore have 10 years for our analysis and we are able to split this into 3 periods for
the static decomposition and into 2 equal sub-periods for the dynamic decomposition.
Data are stored at the reporting unit level, so our first task was to construct enterprise level data.
This required a number of assumptions, starting with the allocation of enterprises to particular
industries. In most cases, firms operated in a single area of the Standard Industrial Classification
(SIC). However multisite organisations could often be allocated to two or more industries. We
assumed that the firm was operating chiefly in the industry in which it had the largest employment
share. Employment in the ARD and the BSD is measured as a headcount. There is no information on
hours worked or on the quality of workers employed, although information on the wage bill is
available. Finally, we note that financial data used throughout this paper have been deflated using
2-digit SIC deflators derived from EUKLEMS, which are based on PPI series from ONS.
3.2.1 False entrants and exits
Dynamic decompositions rely on firm level data at two points in time (t and t+k). Combining these
two time periods, we note that there are three categories of firms - those that exist throughout the
period (continuers), those that exist in t but not in t+k (exitors) and those that exist by t+k but were
not in the data at point t (entrants). However, because data in the ARD are sampled at the smaller
end of the size distribution, there will be situations when firms without information for period t+k
should not be classed as exiting firms since they will reappear in future years. Conversely, there are
firms for which data are missing for the period t, but which were simply not sampled in that year and
so are not genuine entrants.
In order to deal with false entrants and exits, we supplement the ARD with information from the
BSD. Because the BSD is to all intents and purposes a census of firms, we match firms classified as
births and deaths into the BSD to check their status, which is determined by whether or not
employment and turnover information are available in the year in question, whether or not the firm
is classified as having died or been born before or after t or t+k, and whether or not the firm is
classed as "active". If we are able to locate firms, the question then is, how can we impute
information on labour productivity for these firms in t or t+k using BSD data on employment and
turnover to estimate productivity growth. On occasion, we find that employment information is
missing in the ARD and in these instances we are able to use the BSD data to supplement the ARD.
Another issue we have noticed is that the ARD may flag firms as being continuers when the BSD
suggests they have exited. This may in part be an issue of timing since the BSD data lags the ARD.
We take the view that the ARD survey data is the most accurate data available.
Table 3.2 shows the percentage of surviving, entering and exiting firms in the ARD data by sector.
We can see that on average the share of entering and exiting firms is about 16% with the percentage
of entering firms being slightly higher than the percentage of exiting firms. However, the table shows
some heterogeneity across sectors.
| Industry |
%Surviving |
%Entering |
%Exiting |
Total |
| Mining and Quarrying, Electricity, gas and water supply |
78.14 |
9.56 |
12.3 |
732 |
| Manufacture of food, beverages and tobacco |
85.63 |
4.43 |
9.94 |
2,707 |
| Manufacture of textile and leather products |
88.43 |
3.41 |
8.15 |
2,343 |
| Manufacture of wood products |
89.35 |
4.5 |
6.15 |
911 |
| Manufacture of pulp, paper and printing |
85.35 |
4.71 |
9.94 |
3,653 |
| Manufacture of chemicals |
87.74 |
4.15 |
8.11 |
1,591 |
| Manufacture of rubber |
88.25 |
3.83 |
7.92 |
1,906 |
| Manufacture of non-metallic minerals |
85.47 |
4.65 |
9.88 |
1,184 |
| Manufacture of basic metals and fabricated metal products |
90.44 |
4.12 |
5.44 |
4,929 |
| Manufacture of machinery and equipment NEC |
90.59 |
3.21 |
6.2 |
3,113 |
| Manufacture of electrical and optical equipment |
88.38 |
3.74 |
7.87 |
3,340 |
| Manufacture of transport equipment |
87.99 |
4.76 |
7.24 |
1,491 |
| Manufacturing NEC |
88.81 |
6.08 |
5.1 |
2,038 |
| Construction |
80.97 |
11.95 |
7.08 |
10,308 |
| Sale, maintenance and repair of motor vehicles |
86.95 |
5.86 |
7.19 |
6,314 |
| Wholesale trade |
87.71 |
5.89 |
6.4 |
15,524 |
| Retail trade |
83.36 |
8.75 |
7.9 |
16,006 |
| Hotels and restaurants |
77.25 |
12.34 |
10.41 |
6,400 |
| Transport and storage |
85.96 |
7.66 |
6.38 |
5,877 |
| Post and telecommunication |
65.47 |
22.75 |
11.78 |
611 |
| Real estate |
78.46 |
14.51 |
7.03 |
3,046 |
| Renting of machinery and equipment |
81.7 |
10.44 |
7.85 |
1,197 |
| Computing and related activities |
74.47 |
16.05 |
9.48 |
3,376 |
| R&D and other business services |
79.55 |
12.56 |
7.89 |
16,571 |
| Total |
83.87 |
8.5 |
7.63 |
115,168 |
Source: ARD data, various years, authors' calculations
3.2.2 Industrial classification issues
Industry groups in the analyses are determined largely by sample sizes and meaningful industrial
groupings. We favour a 24 sector split which broadly corresponds to sub-sectors of the 2003 SIC
(standard industrial classification), although to address sample size issues, we have merged some
sectors. For the static decompositions, a more detailed industry breakdown has been used and we
average our scores over three years to smooth any outliers (there are fewer sample size problems
when entrants and exits are not identified).
Another complication is that firms can change industries over time. Because the decomposition
analysis relies on firms' shares in sector totals, it is difficult to accommodate firms switching
industries. We therefore assume that firms remain in the industry to which they were initially
allocated in period t. If the SIC code is missing (as it will be for entrants between t and t+k), then the
SIC for t+k is defined according to the value it has in that year. If both SICs are missing, we use the
SIC supplied by the BSD.
3.2.3 Population weighting
As discussed above, the ARD comprises a census of firms with 250 or more employees and a sample
of firms with employment below this level. Thus, the data under-represent the smaller end of the
employment size distribution. To correct the decomposition to reflect a firm's share in the actual
total sector employment (or output), the data could be population weighted. In earlier studies using
the ARD data some have used population weights (Disney et al, 2003 and Harris and Robinson, 2005)
and others have not (Oulton, 2000). In this report we do not use population weights because of
concerns about volatility arising from the relatively large weights attached to firms with fewer than
250 employees in the ARD. It is also unclear how appropriate it would be to use ARD cross-sectional
weights for a dynamic decomposition sample which has been supplemented with BSD information
to try and correct for false entrants and exits (see Section 3.2.1). One concern about using
unweighted data is that the extent of entry and exiting may be overstated (Oulton, 2000). This
concern can be alleviated by correcting for false entrants and exits using BSD information.
By way of sensitivity test, and specifically to check the extent to which our decomposition results
had been affected by not using population weights, we also compare decomposition estimates
based on ARD data (with labour productivity defined as real value added per employee) with
estimates based on BSD data (with labour productivity defined as real turnover per employee). As
reported in Appendix A, this comparison shows little evidence of bias in terms of our general findings
for dynamic decompositions for the periods under consideration.
However, the same is not true for comparisons of static decomposition estimates of allocative
efficiency over time, with the BSD-based estimates casting doubt on the representativeness of ARD-
based findings when micro-firms (those with fewer than 10 employees) are included in the analysis
without using population weights (see Appendix Table A7). By contrast, the BSD-based estimates are
more in line with static decomposition results for firms with ten or more employees (Appendix Table
A8). Accordingly, in Section 5 below, we present static decomposition results only for firms with ten
or more employees. These firms account for just over 80% of total value added in UK market
sectors.
3.3 Market share indicators: employment versus output
Another element of uncertainty in conducting the decomposition is whether the market share
weights used in the decomposition analysis should be defined in terms of output or employment. In
this study our main results are based on using employment shares as weights (rather than output
shares) since employment is theoretically more appropriate to a labour productivity measure of
performance. However, in Appendix A we present an extended discussion of the choice of
appropriate market share weights together with some sensitivity tests where output shares are used
instead of employment shares.
4. Decomposition methods
We explore the sources of labour productivity performance by making use of the Olley and Pakes
static decomposition and the dynamic decompositions set out by Foster, Haltiwanger and Krizan
(2001) and Melitz and Polanec (2012). Each method is outlined in detail below. In the dynamic
framework, industries are composed of new firms (entrants), dying firms (exits) and existing firms
(incumbents/continuers). In the static framework, entrants and exits cannot be directly identified,
as we have only one point in time.
4.1: Olley and Pakes Static Decomposition
This method starts with a definition of aggregate productivity at time t in sector I as a share-
weighted average of firm productivity Πit:

where the shares in each industrial sector | Sit ≥ 0 sum to 1.
Following their methodology, the share-weighted average sector productivity level in period t can be
decomposed in two terms (where the weight is the firm share in total sector employment or sales):

where I indicates the industrial sector; i indicates the firm; t indicates time, π indicates the logarithm
of productivity and s is the firm share in total sector employment or sales. Bars over variables
indicate unweighted sectoral averages.
Thus, the equation demonstrates that the share-weighted average sector productivity in period t,
Πit, can be decomposed into two terms. The first term, π, is the unweighted average of firm-level
productivity at sectoral level. The second term,

is a
sample covariance term, between productivity and the sales or employment shares, a cross-term
that reflects the cross-section efficiency of the allocation activity. This term reflects the extent to
which firms with greater efficiency have greater shares in total sector employment or sales.
The allocative efficiency term is largely interpreted as reflecting whether resource allocation is
correlated with firm productivity. That is, if the allocative efficiency is positive, firms with above
average productivity levels tend to have above average market shares. In other words, a positive
allocative efficiency can be interpreted as an indication of sales or employment shares moving to the
more productive firms in the sector. Conversely, the allocative efficiency is negative if small firms
with below average shares tend to have above average productivity levels. In other words, a
negative allocative efficiency means that resources are disproportionately allocated towards poor
productivity firms in that sector. However, the allocative efficiency term not only captures the
extent to which resources are allocated to the most productive firms but also reflects the
productivity distribution of firms within the sector, that is, the extent to which there is homogeneity
in the sector. Thus, changes over time (as we compare across OP measures) in the allocative
efficiency term may be reflective of increased heterogeneity amongst firms, as they become more
different in their productivity profiles, or whether resources are reallocated towards higher
productive firms. We return to this again when considering the dynamic Olley Pakes approach
below.
The Olley and Pakes method is computationally simple, calculated as the difference between the
share-weighted average sector productivity and the unweighted average sectoral productivity.
Despite being a static measure, the Olley and Pakes approach can also be used to examine trends in
allocative efficiency over time by comparing snapshots based on different annual data. A drawback
of the approach is that it does not allow separate analysis of entry and exit of firms over time, which
are believed to be a major source of sectoral productivity gain (the result of Schumpeterian churn).
However, this is still a powerful tool for considering the degree of allocative efficiency within
industries.
4.2: Foster, Haltiwanger and Krizan (FHK) Dynamic Decomposition
The static decomposition of labour productivity helps us to understand the extent to which firms
with higher productivity make a greater contribution to sector productivity and therefore the extent
to which the sector is technically efficient. However, what it does not allow us to do is consider the
allocation of resources as a process, with resources shifting from productive units over time, with
firms entering and exiting. We consider now the sector composed of firms that are continuing,
entering and exiting the industry and their relative contribution to labour productivity growth
between two time periods (t=1 to 2).
Similar to the Olley Pakes static decomposition, the FHK method starts with a definition of aggregate
productivity at time t as a share weighted average of firm productivity Πit:

where the shares in each industrial sector | Sit ≥ 0 sum to 1. However, the variable of interest now
is the change in aggregate productivity in sector I over time (from t=1 to 2) ΔΠI= ΠI2 - ΠI1. Since
this productivity change is measured in differences, it is assumed that the underlying productivity
measure Πit is in logs, so ΔΠ, represents a percentage change.
The change in the share weighted aggregate productivity of the industry I can be decomposed into 5
terms:
Mathematical equation (4.4) showing a complex decomposition of productivity change, involving sums over continuing, entering, and exiting firms, and various productivity and share terms. The OCR for this equation was too broken to accurately transcribe as text.
where I indicates the specific sector of the analysis; i indicates firms; time is indicated by t = 1 to 2,
π indicates log of labour productivity of firm i, and S is the firm share in total sector employment
or sales. In our analysis we use employment shares in line with the literature because we are
focussing on labour productivity. C, N and X denote the set of continuing, entering and exiting firms.
Continuing firms (C) in sector I are present both at time 1 and time 2. N indicates the set of entering
firms in sector I and identifies firms that are present only in period 2. Exiting firms (X) in sector I are
present only at time t=1.
The first line of the decomposition captures the contribution of continuing firms to productivity
changes. The second line captures the contribution of entry and exit and can be re-written in terms
of the aggregate shares and productivity levels as: SN2 (ΠN2 - ΠI1) - SX1 (ΠX1 - ΠI1) as shown in
the fourth line.
In order to interpret this formula, the five terms into which the change in the share-weighted
aggregate productivity of the industry has been decomposed can be described as follows.
For the continuing firms (C), the growth rate of the share-weighted average industry I productivity is
expressed as the sum of:
- The share weighted productivity change within the firm (the within component).
- Two terms that summarize the effect of structural change on aggregate productivity growth
among the continuing firms of the industry under consideration:
- The share cross-term which is positive if firms with above average productivity
also tend to increase their shares of sales or employment (the between
component).
- A covariance-type term which is positive if firms with increasing productivity
tend to gain in terms of their shares of sales or employment (the cross firm
component).
The final two terms of the formula capture the contributions of entering (N) and exiting (X) firms to
aggregate productivity growth of industry I:
- The contribution of an entering (N) firm to aggregate productivity change is positive if it has
a productivity level above the aggregate productivity in period t=1, ΠI1.
- The contribution of an exiting (X) firm to aggregate productivity growth is positive if its
productivity level is below the aggregate productivity in period t=1, ΠI1.
The entry and exit components summarize these contributions, weighted by the firm share in total
industry employment.
4.3: Olley and Pakes Dynamic Decomposition with Entry and Exit
Melitz and Polanec (2012) propose an extension of the productivity decomposition method of Olley
and Pakes (1996). This extension accounts for the contributions of both firm entry and exit to
aggregate productivity changes. It breaks down the contribution of surviving firms into a component
accounting for changes in the firm-level distribution of productivity and another accounting for
market share reallocations among those firms, following the same methodology proposed by Olley
and Pakes (1996). They apply their decomposition to the large increases of productivity in Slovenian
manufacturing during the 1995-2000 period. They compare and contrast their results with those of
other dynamic decompositions such as the FHK methodology.
Again we begin with a definition of aggregate productivity at time t in sector I as a share-weighted
average of firm productivity Πit:
Mathematical equation (4.5) defining aggregate productivity Πit as the sum of Sit * πit. The OCR for this equation was too broken to accurately transcribe as text.
where the shares in each industrial sector | Sit ≥ 0 sum to 1. As with the FHK decomposition, the
key variable of interest is the change in aggregate productivity over time (from t = 1 to 2)
ΔΠI = ΠI2 – ΠI1. Again, since this productivity change is measured in differences, it is assumed
that the underlying productivity measure Πit is in logs, so ΔΠ, represents a percentage change.
To understand this decomposition it is necessary to write aggregate productivity in each period of
analysis (t=1 and t=2) of the aggregate share and aggregate productivity of the three group of firms
in industry I: continuers (C), entrants (N) and exiters (X). Continuers are those firms that we observe
both at t=1 and 2. Entrants are those firms that we observe only in the final period t=2. Finally, we
observe exiting firms only in the first period of analysis t=1.
Mathematical equations (4.6) and (4.7) defining aggregate productivity in periods t=1 (ΠI1) and t=2 (ΠI2) in terms of continuing (C), entrant (N), and exit (X) firm components. The OCR for these equations was too broken to accurately transcribe as text.
where the aggregate productivity of continuers in each period (t=1 and t=2) is simply
Π = ∑ (Sit / SCt) Πit, and SCt = ∑ Sit. That is, the aggregate productivity of continuers is defined as
aggregate productivity in sector I (5.5) but only restricted to the set of continuing (C) firms.
It is then possible to write the change in productivity in sector I ΔΠI = ΠI2 - ΠI1 in terms of these
components and then apply the Olley Pakes decomposition (1996) to the set of continuing firms.
Mathematical equation (4.8) decomposing the change in productivity ΔΠI into components related to continuing, entering, and exiting firms. The OCR for this equation was too broken to accurately transcribe as text.
The first line decomposes the aggregate productivity change into components for the three groups
of firms in industry I: continuers (C), entrants (N) and exits (X). The second line rewrites the first term
in equation 1; the Olley Pakes decomposition is applied to the group of continuers, disentangling the
change in labour productivity into two components: the unweighted change in average productivity
of continuers, ΔπC, and the change in the covariance between market share and productivity for
continuers, ΔcovC, (ie. the change in the allocative efficiency term in the Olley and Pakes
decomposition, which is induced by market share reallocations or changes in sector dispersion,
discussed above).
Notice that using this methodology implies the following:
- entrants (N) generate positive productivity growth only if they have higher productivity ΠN2
than the remaining (surviving) firms ΠC2 in the same time period when entry takes place
(t=2).
- Exiting firms (X) generate positive productivity growth only if they have lower productivity
ΠX1 than the remaining (surviving) firms ΠC1 in the same time period when exit takes place
(t=1).
This interpretation of the terms differs from the FHK decomposition where the contributions of
entrants and exits are evaluated relative to the aggregate productivity level in Year 1. Under the FHK
approach, entrants (N) generate positive productivity growth only if they have higher productivity
than all firms in period t=1 ΠI1 (where I=C+X). Similarly, exiting firms (X) generate positive
productivity growth only if they have lower productivity than all firms in period t=1 ΠI1 (where
I=C+X).
Compared to the Melitz and Polanec approach, the reference group productivity level in the FHK
decomposition will necessarily lead to a bias in measuring the contributions of both groups (and
especially entrants). This is because ΠC2 is higher than ΠI1 for two reasons: firstly, it excludes firms
which exited in period 1 (assuming exiting firms have on average a lower productivity change), and
secondly, it captures any productivity improvements of continuers between periods 1 and 2. Thus,
under the FHK approach the measured contribution of entrants will be biased upwards and the
contributions of continuers and exiting firms will be biased downwards.
As we show below in Section 6.4, Melitz and Polanec's choice of reference group productivity levels
for entrants and exiting firms is more intuitively appealing than the FHK approach and enables us to
look in some detail at what is going on within the groups of entrant and exiting firms. In particular,
we are able to identify the following subgroups of interest:
- Surviving firms over the two years of analysis (C)
- Year 2 entrants with higher average labour productivity levels than continuing firms in year 2
(Nhigh)
- Year 2 entrants with lower average labour productivity levels than continuing firms in year 2 (Nlow)
- Year 1 exits with higher average labour productivity levels than continuing firms in year 1 (Xhigh)
- Year 1 exits with lower average labour productivity levels than continuing firms in year 1 (Xlow)
In terms of the effects of entry and exit on sector I productivity growth, only categories 2 and 5 will
have positive effects on sector productivity growth between Years 1 and 2.
Our productivity growth decomposition will therefore be equal to:
Mathematical equation (4.9) showing a detailed productivity growth decomposition, considering subgroups of high and low productivity entrants and exiters. The OCR for this equation was too broken to accurately transcribe as text.
This disaggregation enables us to see the extent to which heterogeneity in entry and exit is obscured
by the aggregation procedure. Results from the static decomposition of levels of productivity are
presented in the following section and findings in relation to the dynamic decompositions are
presented in section 6.
5. Static decomposition estimates
Table 5.1 presents estimates of the Olley Pakes static decomposition for firms with ten or more
employees in Manufacturing, Services and Other Production sectors between 1998 and 2007. In this
analysis market shares have been defined in terms of employment shares while aggregation up to
broad industry group and total economy levels has been carried out on a bottom-up basis (that is,
aggregating over three digit sector-level decompositions). In later sections of this report we discuss
the results of sensitivity tests using different approaches to both the definition of market shares and
to aggregation procedures.
In each row of Table 5.1, the employment-weighted average log labour productivity level (Column 1)
corresponds, as shown in equation 4.2, to the sum of the unweighted average log labour
productivity level (Column 2), and the allocative efficiency measure (Column 3). The last column N
reports the number of firms in each specific cell. The exercise is repeated for three groups of years
(1998-2000, 2001-2003 and 2004-2007) where the measures are smoothed to reduce any distortion
due to outliers. These estimates provide us with snapshots of allocative efficiency in different time
periods which can be compared to give some indication of trends over time.
Table 5.1: Static Olley Pakes decomposition at total economy and broad industry group levels,
1998-2007, analysed by sub-period, firms with 10 or more employees
| Industry |
Average Productivity (weighted) |
Average Productivity (unweighted) |
Allocative Efficiency |
N |
| 1998-2000 |
|
|
|
|
| Total Economy |
3.215 |
2.978 |
0.237 |
78027 |
| Manufacturing |
3.550 |
3.388 |
0.163 |
28533 |
| Services |
3.026 |
2.744 |
0.282 |
43691 |
| Other Production |
3.968 |
3.918 |
0.050 |
5803 |
| 2001-2003 |
|
|
|
|
| Total Economy |
3.214 |
3.028 |
0.186 |
82299 |
| Manufacturing |
3.527 |
3.388 |
0.139 |
27664 |
| Services |
3.055 |
2.856 |
0.200 |
48109 |
| Other Production |
3.952 |
3.739 |
0.212 |
6526 |
| 2004-2007 |
|
|
|
|
| Total Economy |
3.314 |
3.153 |
0.161 |
94345 |
| Manufacturing |
3.682 |
3.512 |
0.170 |
31341 |
| Services |
3.167 |
3.001 |
0.167 |
56005 |
| Other Production |
4.001 |
3.951 |
0.050 |
6999 |
Source: ARD various years, authors' calculations (firms with 10 or more employees; employment weights;
bottom-up aggregation; see notes to Appendix Tables C1-C3).
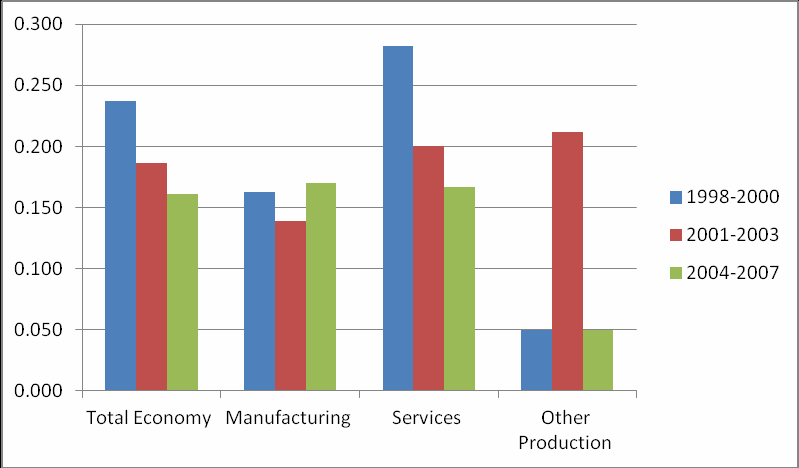
The allocative efficiency term can be interpreted as the difference in percentage terms between
weighted and unweighted productivity levels in the sectors under consideration. Thus, to give an
example for the period 1998-2000, allocative efficiency among firms with ten or more employees in
the total economy was 23.7 per cent, that is, allocative efficiency is 23.7% higher than it would have
been if all firms had an equal market share. When we look at results by broad industry group, we
note that this estimate of allocative efficiency derives mainly from Services (28%) where it is
substantially higher than the allocative efficiency scores for Manufacturing and Other Production (16
and 5%, respectively).
Note that the allocative efficiency measure at total economy level tends to fall over time and this
largely reflects a decline in allocative efficiency in Service sectors. In the case of Manufacturing
sectors, the positive allocative efficiency measure is slightly higher in 2004-07 than in 1998-2000.
Figure 5.1 illustrates the dominant impact of services on trends in allocative efficiency over time. As
shown below in Section 5.3, the sharp fluctuations in allocative efficiency in Other Production
sectors were largely driven by developments in electricity, gas and water. However, the Other
Production sectors are too small in employment terms to have much effect on the total economy
measure of allocative efficiency.
Figure 5.1: Allocative efficiency at total economy and broad industry group levels, 1998-2007,
analysed by sub-period, firms with 10 or more employees
Source: ARD various years, authors' calculations (firms with 10 or more employees; employment weights;
bottom-up aggregation; see notes to Appendix Tables C1-C3).
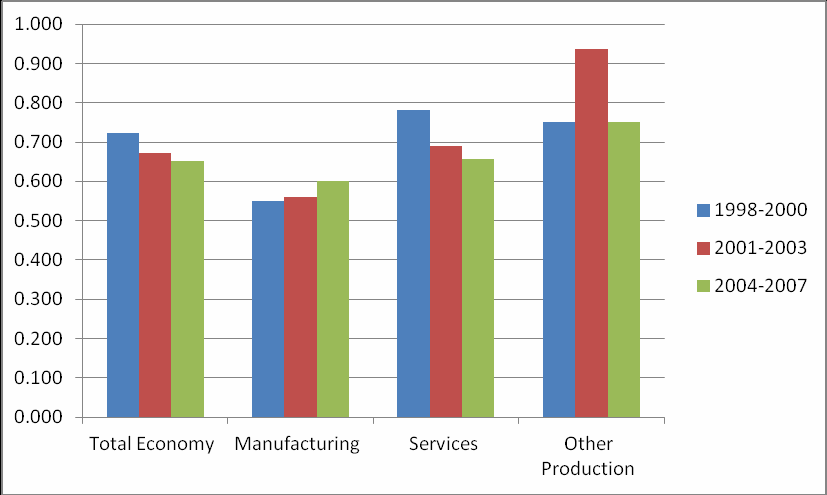
5.1: Static decompositions using output share weights
An alternative to defining market shares in terms of each firm's share of total sector employment is
to use output shares instead. Results for static decompositions using gross value added (GVA) share
weights are presented in Table 5.2 and the differences between the two weighting choices are
illustrated in Figure 5.2. In general, using GVA weights increases estimated levels of labour
productivity and boosts the perceived contribution of larger firms which makes a large difference to
estimated allocative efficiency in Other Production sectors that are notably capital intensive. But,
overall, the main trends identified when using employment weights -- declining allocative efficiency
over time in Services and the total economy -- are still identified when GVA weights are used as
indicators of market share.
Table 5.2: Static Olley Pakes decomposition of labour productivity using GVA share weights (1998-
2007), firms with 10 more employees
| Industry |
Average Productivity (weighted) |
Average Productivity (unweighted) |
Allocative Efficiency |
N |
| 1998-2000 |
|
|
|
|
| Total Economy |
3.702 |
2.978 |
0.724 |
78,027 |
| Manufacturing |
3.938 |
3.388 |
0.550 |
28,533 |
| Services |
3.525 |
2.744 |
0.781 |
43,691 |
| Other Production |
4.667 |
3.918 |
0.750 |
5,803 |
| 2001-2003 |
|
|
|
|
| Total Economy |
3.699 |
3.028 |
0.671 |
82,299 |
| Manufacturing |
3.947 |
3.388 |
0.559 |
27,664 |
| Services |
3.545 |
2.856 |
0.690 |
48,109 |
| Other Production |
4.675 |
3.739 |
0.936 |
6,526 |
| 2004-2007 |
|
|
|
|
| Total Economy |
3.804 |
3.153 |
0.651 |
94,345 |
| Manufacturing |
4.113 |
3.512 |
0.601 |
31,341 |
| Services |
3.658 |
3.001 |
0.657 |
56,005 |
| Other Production |
4.701 |
3.951 |
0.75 |
6,999 |
Source: ARD various years, authors' calculations (firms with 10 or more employees; GVA weights; bottom-up
aggregation).
Figure 5.2: Allocative efficiency at total economy and broad industry group levels, 1998-2007,
analysed by sub-period, firms with 10 or more employees, using GVA weighted shares
Source: ARD various years, authors' calculations (firms with 10 or more employees; GVA weights; bottom-up
aggregation).
5.2: Aggregation to broad sector group and total economy levels: top-down versus bottom-up approaches
In Table 5.1 we presented results in which aggregation up to broad industry group and total
economy levels had been carried out on a bottom-up basis (that is, aggregating over three digit
sector-level decompositions, using employment shares as weights). An alternative approach would
be a top-down procedure in which decompositions are carried out directly at broad industry group
and total economy levels using measures of aggregate output and employment that have been
derived by summing across firm-level data on output and employment within each industry group
and the total economy.
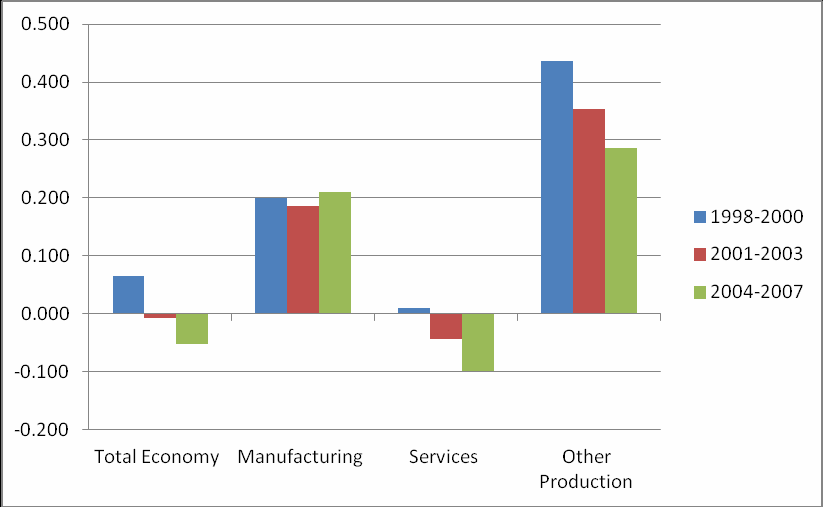
Estimates using a top-down approach are shown in Table 5.3 and Figure 5.3 and display considerable
differences in absolute levels of unweighted labour productivity at broad sector group and total
economy levels compared to those found using the bottom-up approach to aggregation (see Table
5.1 and Figure 5.1). These differences show that aggregation procedures are important and can
influence findings. However, in the present case we still observe declining allocative efficiency over
time in services and the total economy (for firms with ten or more employees) when using a top-
down approach to aggregation just as was found when using a bottom-up approach.
Table 5.3: Static Olley Pakes decompositions of labour productivity, 1998-2007, firms with 10 or
more employees, top-down approach to aggregation
| Industry |
Average Productivity (weighted) |
Average Productivity (unweighted) |
Allocative Efficiency |
N |
| 1998-2000 |
|
|
|
|
| Total Economy |
3.215 |
3.149 |
0.066 |
78027 |
| Manufacturing |
3.466 |
3.266 |
0.200 |
28533 |
| Services |
3.026 |
3.015 |
0.010 |
43691 |
| Other Production |
4.023 |
3.586 |
0.437 |
5803 |
| 2001-2003 |
|
|
|
|
| Total Economy |
3.214 |
3.221 |
-0.007 |
82299 |
| Manufacturing |
3.529 |
3.343 |
0.186 |
27664 |
| Services |
3.056 |
3.100 |
-0.044 |
48109 |
| Other Production |
3.952 |
3.598 |
0.354 |
6526 |
| 2004-2007 |
|
|
|
|
| Total Economy |
3.316 |
3.368 |
-0.053 |
94345 |
| Manufacturing |
3.682 |
3.471 |
0.211 |
31341 |
| Services |
3.169 |
3.268 |
-0.099 |
56005 |
| Other Production |
4.000 |
3.713 |
0.286 |
6999 |
Source: ARD various years, authors' calculations (firms with ten or more employees; employment weights; top-
down aggregation; see notes to Appendix Tables C4-C6).
5. Allocative Efficiency
5.3. Trends in allocative efficiency at disaggregated sector level
Source: ARD various years, authors' calculations (firms with ten or more employees; employment weights; top-down aggregation; see notes to Appendix Tables C4-C6).
Disaggregated results for the static Olley Pakes decomposition of labour productivity using employment share weights are shown in Figure 5.4 and presented in detail in Appendix C. Recall that allocative efficiency in the total economy for firms with ten or more employees was estimated to have fallen from 23.7% in the 1998-2000 period to 16.1% between 2004-07 (Figure 5.1), with the bulk of the decline occurring in the broad services industry group. The disaggregated results show wide variation between service sectors in the extent to which this reduction in allocative efficiency occurred, with much of the decline concentrated in the retail and hotels and catering sectors (Figure 5.4B). By contrast, in some transport and business service sectors, allocative efficiency actually increased over the same period. There was also some diversity in manufacturing where allocative efficiency grew more rapidly over this period in chemicals and non-metallic mineral products than other sectors and actually declined slightly in sectors such as food and drink manufacturing and rubber and plastics. Among other production sectors, allocative efficiency declined in mining and quarrying between 1998-2007 and fluctuated sharply between sub-periods in electricity, gas and water (Figure 5.4A).
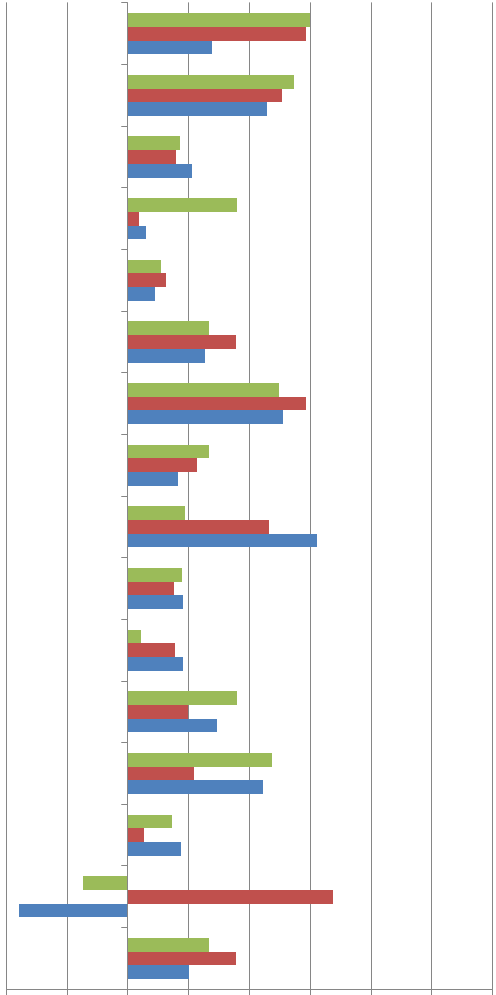
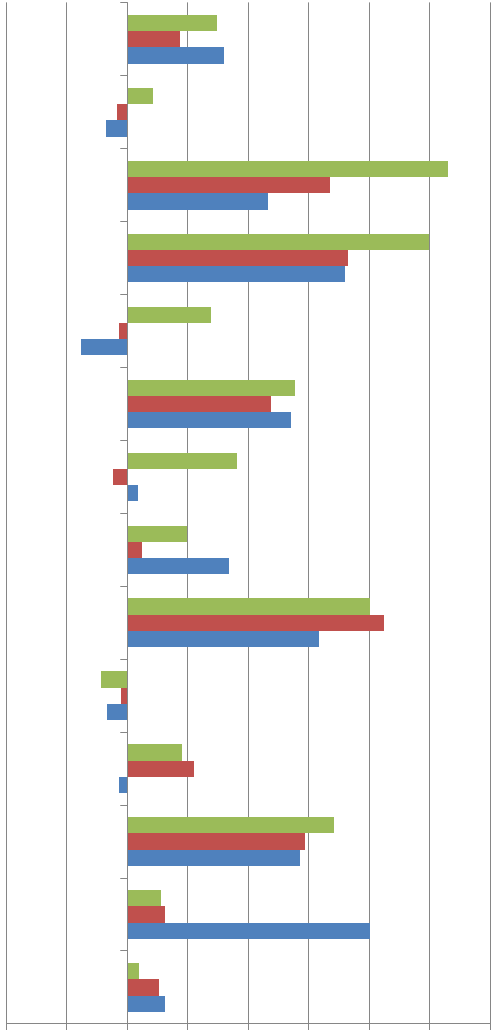
Source: ARD, authors' calculations (firms with ten or more employees; employment weights; bottom-up aggregation). Detailed estimates are shown in Appendix Tables C1-C3.
Appendix Tables C4 to C6 show detailed results for static Olley and Pakes decompositions for firms with ten or more employees using a top-down approach to aggregation in which decompositions are computed directly for each of the broad sectors listed in the tables rather than taking a weighted average of the productivity decompositions of smaller sectors. Any differences in allocative efficiency measures between Tables C1 to C3 and Tables C4 to C6 could be due to the reallocation of resources from one sector to another, although the results do not seem to differ a great deal. This is most likely because we are looking at a relatively short period of time, without a significant structural readjustment of the economy requiring reallocation from one sector to another.
Taking an overview of all these static decomposition results, one possible explanation for declining allocative efficiency in some sectors is that competitive pressures are not sufficiently strong to ensure that the most productive firms gain market share at the expense of less productive firms. In these circumstances less productive firms may not only be able to survive but may even be able to increase their shares of total employment in their sectors.
Another possibility in some sectors is that rapid changes in technologies and products may enable more innovative firms – many of them new entrants to the market – to implement new ideas and technologies that improve their productivity performance. However, it may take time for these firms to build up their market shares and meanwhile less productive firms may still be able to maintain relatively large market shares rather than be forced to cut back heavily on employment or come under pressure to exit the market.
In this scenario firm-level variation in innovation and technological progress should eventually, through market competition, contribute to reallocation of resources from less productive uses to more productive uses. However, this process is likely to unfold in different ways and on different timescales in each sector. In order to shed more light on inter-sectoral differences of this kind, we turn to alternative approaches to analysing productivity growth that take account of industry dynamics including the entry of new firms and the exit of other firms.
6. Dynamic decomposition estimates
Dynamic decompositions rely on snapshots of data at two points in time (t1 and t2). In this paper data for 1998, 2002, 2003 and 2007 have been used. We present findings for the 10 year period (1998-2007) and two 5 year sub-periods, beginning with a discussion of the total economy level (subject to the omissions that have been noted in section 3 above), using both the Foster, Haltiwanger and Krizan (FHK) and Melitz and Polanec (MP) decomposition methodologies. All dynamic decompositions use the top-down approach to aggregation rather than the bottom-up approach discussed in Section 5 because of restrictions on the use of estimates derived from small sample sizes relating to entrants and exitors in three-digit sectors. Because of concern about the reliability of data from micro firms, we report decompositions both including and excluding firms with fewer than 10 employees. Theoretically, including small firms is preferred, since our methodologies are based on each firm's productivity being weighted according to its 'size' (either output or employment weighted). Excluding them therefore is likely to bias our findings. Moreover, a practical consideration is the drop in sample sizes when small firms are excluded, particularly when we explore the decompositions at more detailed levels of sectoral disaggregation.
6.1. Aggregate results
In order to assess the effectiveness and impact of resource reallocation at sector level, it is useful to draw on elements of both the FHK and MP decompositions.
As noted in Section 5.4, the FHK decomposition can be criticised on the grounds that the productivity levels of entrants (which we observe only at the end of the period) and exitors (which we observe only at the start of the period) are both benchmarked against average productivity for all firms observed in the initial period. The MP decomposition offers a more appropriate reference productivity level when assessing the contribution of entry and exit to aggregate productivity performance. In the MP decomposition, the productivity levels of entering and exiting firms are referenced against the average productivity of continuing firms at the times when entry and exit, respectively, take place.
But although the MP approach is more useful for evaluation of the effects of new entrants and exiting firms, it has drawbacks with regard to resource reallocation within and between continuing firms. In particular, the second component of the MP distribution (which measures the changing relationship between market share and productivity among continuing firms) does not just capture resource reallocation but also moves in line with changes in productivity performance at firm level even when no reallocation of resources has occurred (for example, when rapid productivity growth takes place within large firms). By contrast, the FHK decomposition offers a clearer way to assess the relative importance of productivity changes within firms and productivity changes which can be attributed to external restructuring.
Table 6.1 compares the FHK and MP results at the aggregate economy level. The table presents the aggregate decompositions over three time periods (the full period and 2 five year periods). The final column shows the change in labour productivity over each period and is therefore the same for each set of decompositions, regardless of the method used.
FHK-based estimates suggest that, between 1998-2007, internal restructuring within continuing firms contributed an estimated 20 percentage points (pp) to growth in average labour productivity in the total economy but this was partly offset by negative growth of -4% in the combined effects of external restructuring so that productivity in the total economy grew by an estimated 16 pp over this period.
When we look more closely at the different components of external restructuring (comprising reallocation of resources between continuing firms as well as entry and exit), it is clear that the main negative effect is coming from the cross-firm component, suggesting that many firms with increasing productivity have not succeeded in gaining increased market shares. This could occur if firms with increasing productivity see their employment share reducing over the period, which implies labour shedding (or firm employment growth slower than sector growth).
In both the FHK and MP approaches, the estimated contributions of entry and exit to productivity growth are relatively small. However, when entrants and exitors are disaggregated between firms with above-average productivity and those with below-average productivity, applying the MP decomposition, it is notable that the small net effects of entry and exit conceal a more interesting pattern of events below the surface (Table 6.2). First, high-productivity entrants make a positive contribution of 1.5 pp to aggregate productivity growth but this is more than cancelled out by the -2.3 pp contribution of new firms that show relatively low productivity levels when they first start up. Second, it is notable that the exit of low-productivity firms adds an average 7.7 pp to annual productivity growth between 1998-2007 but this is offset to a considerable extent by the -5.9 pp contribution of firms that exit with above average productivity levels.
Thus the small estimated net effects of entry and exit hide two phenomena of potentially great interest to policy-makers. First, a sizeable proportion of new entrants about 47% of all new entrants between 1998-2007 appear to need time to develop and improve their performance before they will contribute positively to aggregate productivity performance. Second, many firms that fail to survive (40% of all exitors between 1998-2007) are above-average performers in terms of productivity: their inability to survive may reflect market imperfections such as funding constraints or anti-competitive practices.
|
Surviving Firms |
|
|
|
Entering Firms |
Exiting Firms |
|
|
ΔΠΕ |
Δcovc |
Entering |
Exiting |
ΔΠΙ |
|
|
|
(Unweighted average firm-level productivity) |
(Allocative efficiency) |
Firms |
Firms |
(Change in share-weighted average productivity level) |
|
|
| MP |
|
|
|
|
|
|
|
| 1998-2007 |
|
|
|
|
|
|
|
| all firms |
0.01 |
0.14 |
-0.01 |
0.02 |
0.16 |
|
|
| excluding firms < 10 employees |
0.09 |
0.05 |
-0.01 |
0.02 |
0.15 |
|
|
| 1998-2002 |
|
|
|
|
|
|
|
| all firms |
-0.07 |
0.07 |
-0.00 |
0.02 |
0.01 |
|
|
| excluding firms < 10 employees |
-0.01 |
0.01 |
-0.00 |
0.02 |
0.01 |
|
|
| 2003-2007 |
|
|
|
|
|
|
|
| all firms |
0.03 |
0.10 |
-0.00 |
-0.00 |
0.12 |
|
|
| excluding firms < 10 employees |
0.06 |
0.07 |
-0.00 |
-0.00 |
0.12 |
|
|
| FHK |
Surviving Firms |
|
|
|
Entering |
Exiting |
|
| 1998-2007 |
Within |
Between |
Cross |
Firms |
Firms |
ΔΠΙ |
|
| all firms |
0.20 |
0.15 |
-0.20 |
0.00 |
0.01 |
0.16 |
|
| excluding firms < 10 employees |
0.19 |
0.12 |
-0.17 |
0.00 |
0.02 |
0.15 |
|
| 1998-2002 |
|
|
|
|
|
|
|
| all firms |
0.07 |
0.10 |
-0.17 |
-0.00 |
0.02 |
0.01 |
|
| excluding firms < 10 employees |
0.07 |
0.07 |
-0.14 |
-0.00 |
0.02 |
0.01 |
|
| 2003-2007 |
|
|
|
|
|
|
|
| all firms |
0.15 |
0.11 |
-0.13 |
-0.00 |
-0.00 |
0.12 |
|
| excluding firms < 10 employees |
0.14 |
0.10 |
-0.11 |
-0.00 |
-0.00 |
0.12 |
|
Source: ARD and BSD various years, authors' calculations (employment share weights used)
|
Surviving Firms |
Entering Firms |
Exiting Firms |
Change in share-weighted average productivity level |
|
Unwtd Avg LP |
Alloc-eff |
Above avg |
Below avg |
| 1998-2007 |
|
|
|
|
| TOTAL ECONOMY |
0.01 |
0.14 |
0.015 |
-0.023 |
| %share |
83.87 |
|
3.90 |
4.60 |
| 1998-2002 |
|
|
|
|
| TOTAL ECONOMY |
-0.07 |
0.07 |
0.01 |
-0.012 |
| %share |
92.95 |
|
2.04 |
2.52 |
| 2003-2007 |
|
|
|
|
| TOTAL ECONOMY |
0.03 |
0.1 |
0.004 |
-0.008 |
| %share |
94.79 |
|
1.70 |
1.92 |
Source: ARD various years, authors' calculations (employment share weights used)
Turning to the sensitivity of our findings to the exclusion of firms with fewer than 10 employees, Table 6.3 reveals the effects on sample sizes of such an exclusion. Whilst sample sizes are substantial enough to present aggregate results, a detailed sectoral breakdown becomes less feasible, partly because of disclosure issues and partly because the absence of small firms makes any findings less economically meaningful.
| all firms |
Surviving |
Entering Firms |
Exiting Firms |
Total |
| 1998-2007 |
96,590 |
9,786 |
8,792 |
115,168 |
| 1998-2002 |
125,554 |
6,156 |
3,362 |
135,072 |
| 2003-2007 |
118,262 |
4,527 |
1,975 |
124,764 |
| excluding firms with <10 employees |
|
|
|
|
| 1998-2007 |
50,734 |
3,425 |
5,508 |
59,667 |
| 1998-2002 |
67,660 |
2,006 |
2,276 |
71,942 |
| 2003-2007 |
67,426 |
1,084 |
1,699 |
70,209 |
Source: ARD and BSD various years, authors' calculations, Employment share weights used.
Figure 6.1 shows the FHK decomposition for the total economy with and without firms with fewer than 10 employees. The results suggest that the FHK decomposition is generally less sensitive to the exclusion of small firms than is the MP decomposition. We note also considerable heterogeneity across the periods. In the FHK-based estimates the within component remains virtually the same between the full sample and the truncated sample. The categories most clearly affected by the change in sample are the cross and the between components, both of which appear noticeably smaller when small firms are excluded.
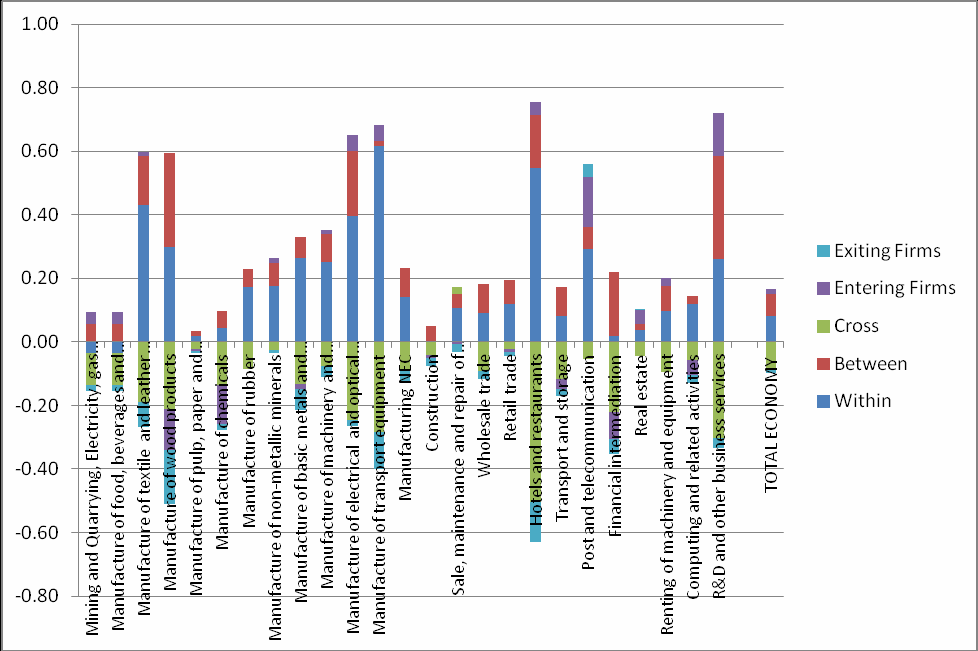
Source: ARD and BSD various years, authors' calculations, Employment share weights used.
As Figure 6.2 shows, using the MP decomposition results in the same overall level of change in labour productivity over the truncated sample as for the full sample (as expected given that smaller firms account for relatively small market shares). However, excluding the small firms yields a very different pattern in the sources of productivity change in the MP-based results, with the change in allocative efficiency (increasingly productive firms becoming larger) becoming noticeably less important when we exclude small firms. By contrast, the net effects of entry and exit in the MP approach do not change greatly when small firms are excluded. According to further analysis (not reported here), the story regarding entrants and exitors with above/below average productivity levels also remains broadly the same regardless of whether small firms are included in or excluded from the sample.
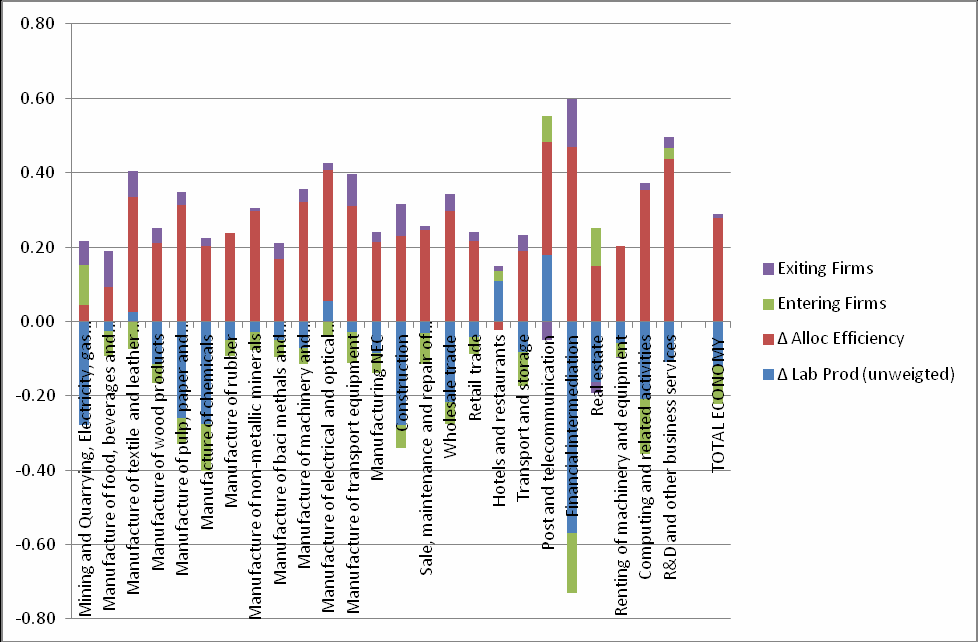
Source: ARD and BSD various years, authors' calculations, Employment share weights used.
6.2. Dynamic decompositions: detailed sector results
In view of the comparative strengths of the FHK and MP decompositions described above, we present two sets of disaggregated sector-level estimates, one using the FHK decomposition to examine resource reallocation within and between continuing firms; and the other using the MP decomposition to explore how new entrants and exiting firms divide between above-average and below-average productivity performers.
Figure 6.3A shows FHK-based estimates which suggest that labour productivity growth between 1998-2007 ranged from 40%+ in textiles, electrical and optical equipment, transport equipment and post and telecommunications to -12% in food and drink manufacturing and combined mining/utilities. In all manufacturing sectors except for non-metallic minerals, productivity growth attributable to productivity changes within continuing firms tended to outweigh the contribution made by external restructuring. Here external restructuring involving continuing firms is defined as the sum of productivity changes arising from reallocation of resources between continuing firms (as some of them gain market share and others lose it) and the ‘cross-firm' component which is positive if firms with increasing productivity tend to gain in terms of market share, or negative if market share tends to be gained by firms with decreasing productivity. The highest rates of within-firm productivity growth occurred in textiles, electrical and optical equipment and transport equipment manufacturing.
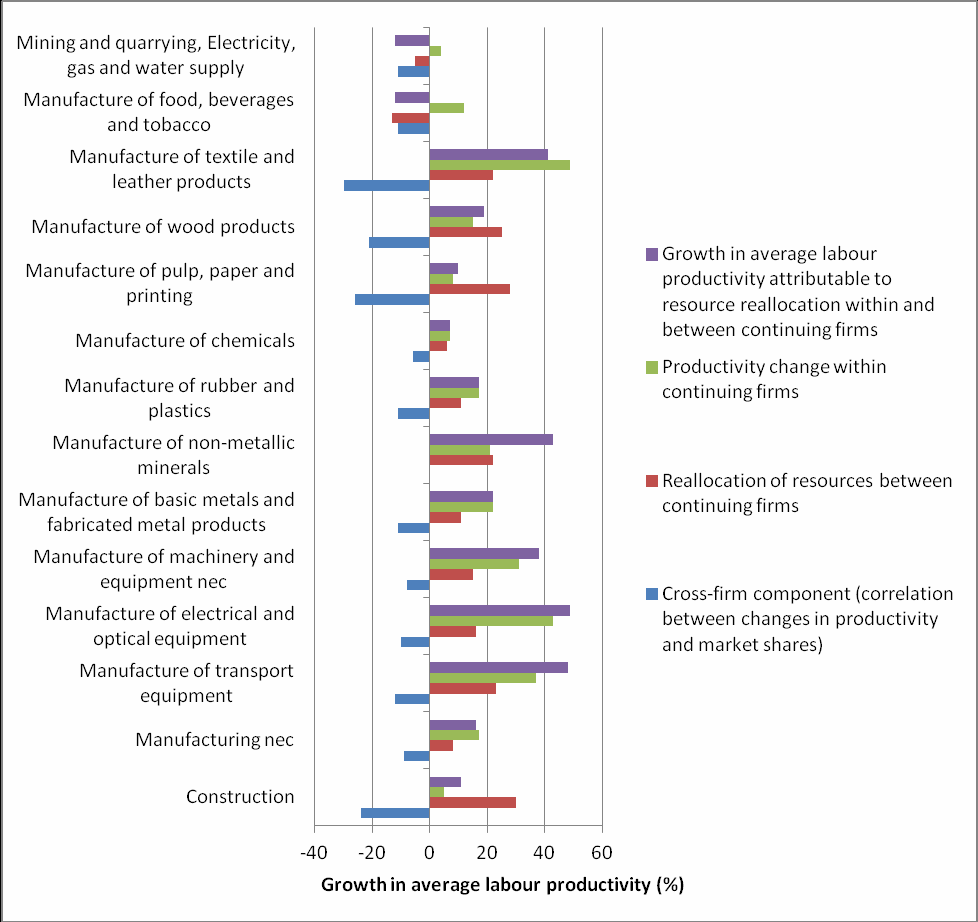
By contrast with manufacturing sectors, in the construction sector the effects of within-firm productivity changes were matched by the impact of external restructuring. And in the combined mining and utilities sectors the effects of within-firm productivity changes were completely outweighed by negative productivity effects arising from external restructuring (Figure 6.3A).
In all service sectors within-firm productivity changes predominated over the effects of external restructuring on continuing firms. In four service sectors external restructuring had negative effects on productivity: hotels and restaurants, transport and storage, real estate and other business services (Figure 6.3B).
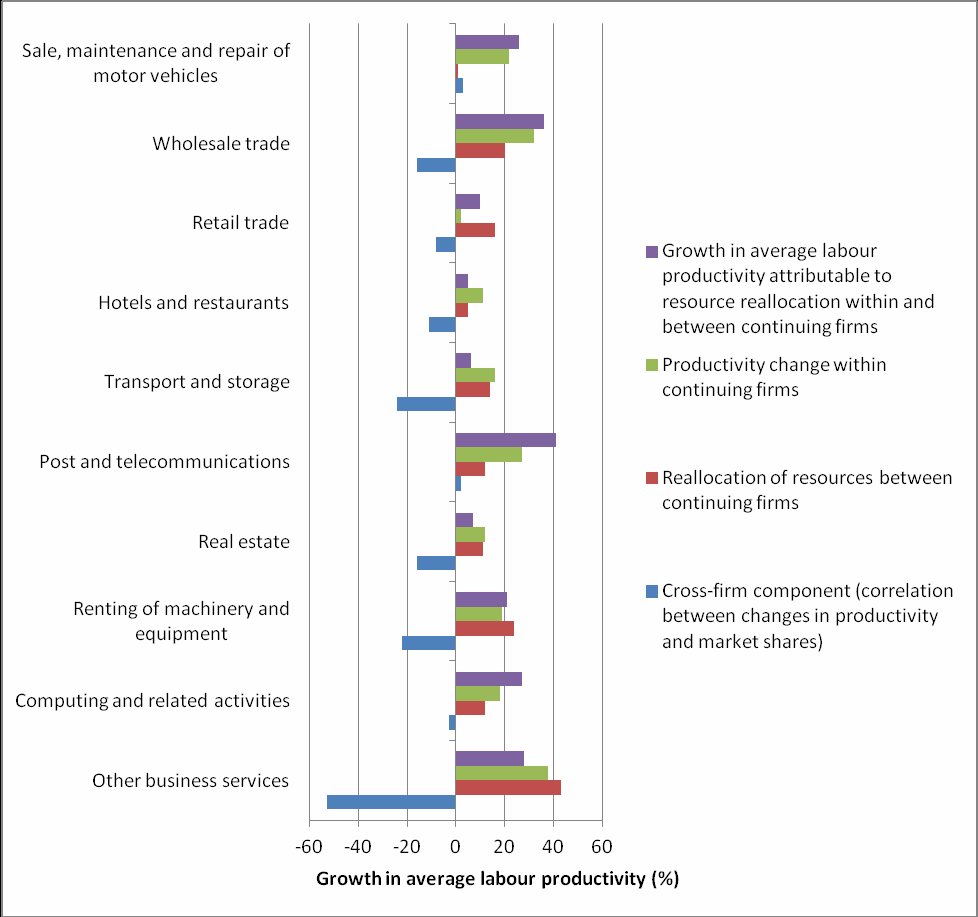
Source: ARD, authors' calculations. Detailed estimates are shown in Appendix Table D9.
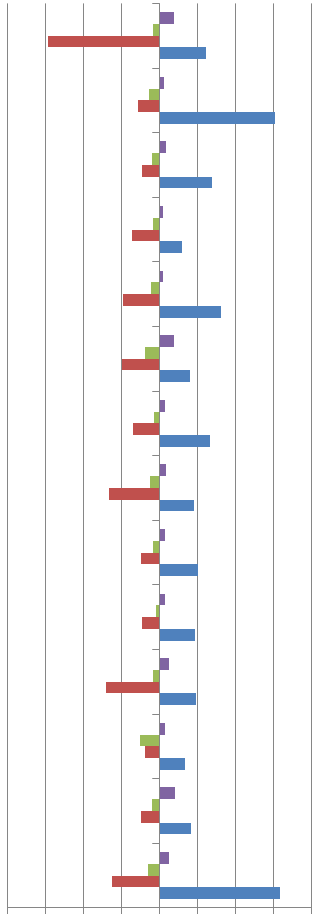
Turning to MP-based estimates of the effects of firm entry and exit on labour productivity growth at detailed sector level, the results show marked differences between sectors.
In 14 out of 24 sectors, the net effect of firm entry on sectoral productivity between 1998-2007 was small and negative, in line with the total economy, while in six sectors the productivity impact of net entry was small and positive. In four sectors net entry had a negative effect on productivity which was conspicuously greater than the economy-wide average (Figures 6.4A and 6.4B):
- Real estate services: where new entrants with relatively low productivity levels depressed average labour productivity by -9 pp over the period, only partly offset by the 2 pp contribution of high-productivity entrants
- Computer services: -6 pp contribution from low-productivity entrants; 1 pp contribution from high-productivity entrants
- Other business services: -5 pp contribution from low-productivity entrants; 3 pp contribution from high-productivity entrants
- Transport equipment: -3 pp contribution from low-productivity entrants; 1 pp contribution from high-productivity entrants
In these sectors the relatively high contribution made by low-productivity entrants presumably reflects above average ease of entry for weaker performers. Further research would be useful to explore the extent to which such entrants survive and manage to improve their performance over time.
In 16 out of 24 sectors net exits had a positive effect on productivity performance between 1998-2007, reflecting high rates of departure for low-productivity firms as would be expected in competitive market conditions. This is particularly the case in real estate, computing and other business services, construction and food and drink manufacturing where the contributions to productivity growth from low-productivity exitors ranged from 11-17 pp (see Figures 6.4A and 6.4B). But in a range of other service and manufacturing sectors – such as post and telecommunications, hotels and catering, retail, wood products, chemicals and transport equipment the exit of low-productivity firms appears to be happening too slowly or on an insufficient scale for this form of restructuring to contribute substantially to productivity growth.
Many sectors recorded sizeable exit rates for firms with above-average productivity levels which partly or wholly offset the effects of weaker firms departing. Prominent examples included:
- Mining/utilities: where exitors with relatively high productivity levels depressed average labour productivity by -15 pp over the period, more than cancelling out the 6 pp contribution of low-productivity exitors
- Other business services: -8 pp contribution from high-productivity exitors, partly offsetting the relatively high 17 pp contribution from low-productivity exitors
- Electrical and optical equipment manufacturing: -7 pp contribution from high-productivity exitors, more than offsetting the 5 pp contribution from low-productivity exitors
- Non-metallic minerals manufacturing: -7 pp contribution from high-productivity exitors, more than offsetting the 5 pp contribution from low-productivity exitors
Other sectors with above-average reductions in productivity due to high-productivity exitors are construction, wholesale trade, renting of machinery and equipment and computer services. Further research should be able to shed light on the main reasons for some high-productivity firms failing to survive in these and other sectors, for example, market imperfections such as funding constraints or anti-competitive practices.
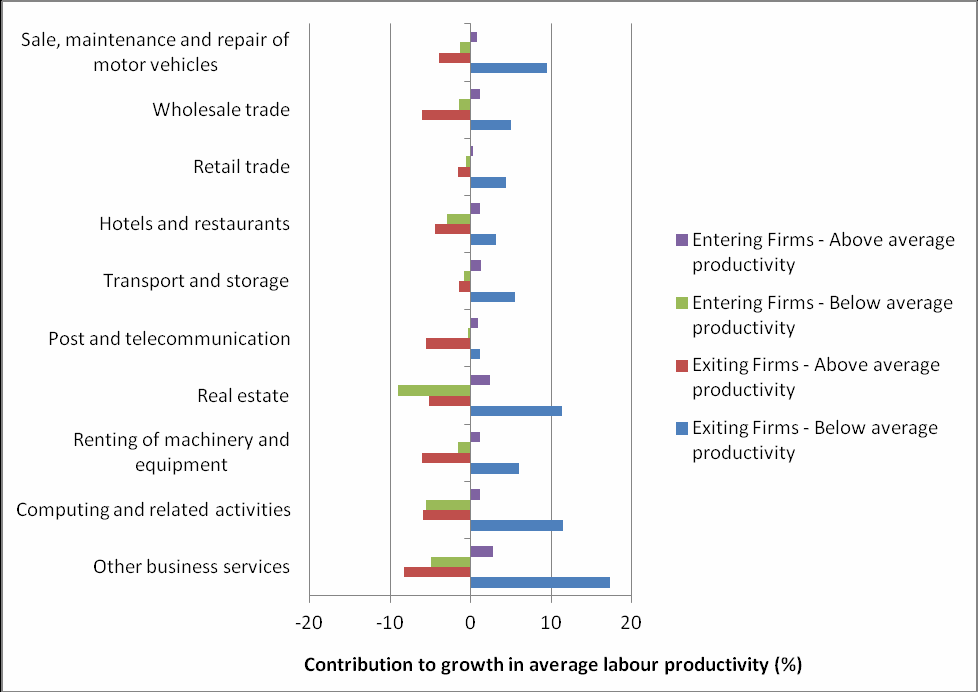
Source: ARD, authors' calculations. Detailed estimates are shown in Appendix Table D9.
7. Conclusions
The prime objective of this research paper has been to improve our understanding of allocative efficiency and the dynamics of labour productivity among firms using British data for the period 1998-2007. Compared to earlier papers for the Britain or the UK, we provide a more sectorally disaggregated breakdown and explicitly extend the analysis to include the service sector. In addition, we apply a series of approaches to consider the relationships between firm dynamics and performance at a detailed sector level for the first time in the British literature.
There are a number of components to our analysis. The first analytical strand considers the static decomposition of labour productivity levels using a detailed level of sectoral disaggregation. Our results show that allocative efficiency declined among firms with ten or more employees between 1998-2007, with the bulk of the decline occurring in service sectors such as retail and hotels and catering. However, by their nature, static decompositions are unable to disentangle entry and exit components of sectoral change from incumbent firm changes.
We therefore move to dynamic decompositions to look at sources of productivity growth at a disaggregated sectoral level in more detail. In line with a number of the plant level studies for the UK and other countries, we find that much of the reallocation takes place within and between continuing firms rather than as a result of entry and exit of firms in the Schumpeterian spirit. However, estimates of the net effects of entry and exit are found to conceal sizeable negative contributions to sectoral productivity growth made by some new entrants with below-average productivity levels and some exiting firms with above-average productivity levels. The latter finding should be of particular interest to policy-makers since it shows that some enterprises with above-average productivity levels are failing to survive. This may reflect market imperfections such as funding constraints or anti-competitive practices.
This report offers a comprehensive look at the contribution of allocative efficiency to labour productivity in the UK at a disaggregated level using a variety of methodological approaches and reporting a number of sensitivity tests. Further discussion of sensitivity test results and related data and measurement issues are discussed in the accompanying appendices. Appendix A focuses on the sensitivity of our findings to the choice of data construction weights and methods. Appendix B contains a discussion of High Growth Firms (HGFs) and their contribution to productivity growth. This appendix contains an overview of HGFs in the ARD and BSD and also highlights the relative productivity positions of these firms. Appendix C provides full details of the static decomposition findings at disaggregated sector level. Appendix D provides equivalent disaggregated results for the dynamic decomposition findings. Finally, Appendix E contains the market shares by detailed sector to provide an indication of how these sector shares vary depending on whether employment or value added shares are considered. What is clear from our analysis to date is the sensitivity of findings to the assumptions made.
As a final word of caution, our findings relate to changes in average labour productivity (ALP) and these represent only a partial measure of performance. Total factor productivity (TFP) is a useful measure of the efficiency of resource utilisation and indeed it may be that firms experiencing high ALP growth do not necessarily experience high TFP growth, particularly if the ALP growth is due primarily to the substitution of capital for labour inputs. Further development of enterprise level capital stocks estimates would allow the ARD analysis to be extended to explore TFP effects.
References
Ahn, S. (2001) 'Firm dynamics and productivity growth: A review of Micro evidence from OECD countries' OECD Economics Department Working Paper 297, OECD Publishing.
Aw, BY. Chen, X. and Robets, M. (1997). 'Firm level evidence on productivity differentials, turnovers, and exports in Taiwanese manufacturing', NBER Working Paper n. 6235.
Bartelsman, E. J., J. Haltiwanger, S. Scarpetta (2004) ‘Microeconomic evidence of creative destruction in industrial and developing countries', Tinbergen Institute Discussion Paper TI 2004-114/3.
Bartelsman, E. J., J. Haltiwanger, S. Scarpetta (2013) ‘Cross Country Differences in Productivity: the role of allocation and selection', The American Economic Review, 103 (1), 305-334.
Baldwin J. and W. Gu (2003) ‘Plant turnover and productivity growth in Canadian Manufacturing', Statistics Canada April.
Baily, MN., Hulten, C. and Campbell, D. (1992). 'Productivity dynamics in manufacturing plants', Brookings Papers on Economic activity (Microeconomics), 187-249.
Benhabib, J. and M. Speigel (2005) 'Human Captial and Technology Diffusion', Handbook of Economic Growth, (eds) P. Aghion and S. Durlaff, Volume 1, Edition 1, Chapter 13, 935-966.
Bloom, N., R. Sadun and J. van Reenen (2012) 'The Organization of Firms Across Countries', The Quarterly Journal of Economics, 127 (4), 1663-1705.
Bravo-Biosca, A. (2012) ‘A Look at Business Growth and Contraction in Europe', NESTA Working Paper 11/02, available at: http://www.nesta.org.uk/wp11-02
Cantner, U. and J. J. Kruger (2008). 'Micro-heterogeneity and Aggregate Productivity Development in the German Manufacturing Sector. Results from a Decomposition Excercise', Journal of Evolutionary Economics, 18, 119-133.
Disney, R., J. Haskel and Y. Heden (2003) 'Restructuring and productivity Growth in UK Manufacturing', The Economic Journal, 113 (489), 666-694.
Foster, L. J. Haltiwanger and C. J. Krizan (2001) Aggregate Productivity Growth: Lessons from Microeconomic Evidence, in Hulten, C., Dean, E. R. and Harper, M. J. (eds.) New Developments in Productivity Analysis, University of Chicago Press.
Foster, L., J. Haltiwanger and C. J. Krizan (2002) 'The Link between Aggregate and Micro productivity growth: Evidence from Retail Trade’, NBER Working Paper 9120.
Geroski, P. A., J. Mata and P. Portugal (2010) 'Founding Conditions and the Survival of New Firms', Strategic Management Journal, 31 (5), 510-529.
Griliches, Z. and H. Regev (1995) 'Firm Productivity in Israeli Industry: 1979-1988', Journal of Econometrics, 65:1, 175-203.
Haltiwanger, J. C. (1997) ‘Measuring and analysing aggregate fluctuations: The importance of Building from Microeconomic Evidence', Federal Reserve Bank of St Louis Review 79, 55-77.
Haskel, J. and R. Martin (2002) 'The UK Manufacturing Productivity Spread', CERIBA Discussion Paper, available at http://www.ceriba.org.uk/pub/CERIBA/UKManuSpread/spreads_oct17.pdf
Harris, RID and J. Moffat (2012) ‘Total Factor Productivity Growth in Local Economic Partnership Regions in Britain, 1997-2008', SERC Discussion Paper 112.
Harris, RID, and C. Robinson (2005) 'Impact of Regional Selective Assistance on Sources of Productivity Growth: Plant level Evidence from UK Manufacturing', Regional Studies, 39 (6), 751-765.
Jeon and Miller, (2005) ‘An ‘Ideal' Decomposition of Industry dynamics: An Application to the Nationwide and State-level US Banking Industry', University of Connecticut, Department of Economics Working Paper series, 2005-25.
Law, D. And N. McLellan (2005) 'The Contributions from Firm entry, exit and continuation to Labour productivity growth in New Zealand', New Zealand Treasury Working Paper 05/01.
Liu, L. and Tybout, JR. (1996). 'Productivity Growth in Chile and Columbia: the Role of Entry, Exit and Learning', in Roberts and Tybout (eds.), Industrial Evolution in Developing Countries: Micro Patterns of Turnover, Productivity and Market Structure, Oxford University Press for the World Bank, 73-103.
Office for National Statistics, Annual Respondents Database, 1973-2008: Secure Data Service Access [computer file]. Colchester, Essex: UK Data Archive [distributor], March 2011. SN: 6644, http://dx.doi.org/10.5255/UKDA-SN-6644-1
Office for National Statistics, Business Structure Database, 1997-2010: Secure Data Service Access [computer file]. 2nd Edition. Colchester, Essex: UK Data Archive [distributor], November 2011. SN: 6697, http://dx.doi.org/10.5255/UKDA-SN-6697-1.
Olley, S. and A. Pakes (1996) 'The Dynamics of Productivity in the Telecommunications Equipment Industry', Econometrica, 64, 1263-1298.
Oulton, N. (2000). 'A Tale of Two Cities: Closure, Downsizing, and Productivity Growth in UK Manufacturing, 1973-89', National Institute Economic Review, 173, 66-79.
Melitz, M. and S. Polanec (2012) 'Dynamic Olley-Pakes Productivity Decompositions with Entry and Exit', NBER Working Paper 18182.
Riley, R. and C. Robinson, (2011), ‘UK Economic Performance: How far do intangibles Count?', Innodrive Working Paper 14 available at: http://www.innodrive.org/attachments/File/workingpapers/Innodrive_WP_14_RileyRobinson2011_b.pdf
Riley, R. and Rosazza Bondibene, C. (2015), Sources of labour productivity growth at sector level in Britain since the 2008-09 recession: a firm-level analysis, NESTA Working Paper 15/15 (forthcoming).
Van Beveren, I. (2012) ‘Total Factor Productivity Estimation: A Practical Review', Journal of Economic Surveys, 26(1), 98-128.
APPENDIX A: Extended discussion and sensitivity tests
In this appendix we explore the sensitivity of the methodologies to differences in data, and the extent to which these inform our understanding of the contribution to labour productivity growth.
A1 Employment versus output weights
One element of uncertainty in conducting the decomposition is whether an output or employment weight should be used. A review of the leading methodological papers on this topic indicates that generally, empirical analyses tend to limit themselves to one or the other weight rather than presenting results using both approaches (Table 8.1 in Foster et al, 2001 summarises all the early studies, including Baily, Hulten and Campbell (1992) and Griliches and Regev (1995)). In addition, we note that by and large, the research papers tend to restrict themselves to the choice of weight that is most consistent with their measure of productivity. Thus, we see that analyses based on TFP use output or value added weights, whilst labour productivity measures (be they man hours or employment based) tend to use an employment weight. However, careful reading of the papers does not reveal why they choose the approach they do. Table B1 summarises some of the evidence. It builds on a table in Foster et al (2001, p.311), but includes a number of more recent papers also that are relevant to our study.
Disney et al (2003) run a number of sensitivity tests on their findings, highlighting a number of sources for possible measurement error. Firstly, they point to the problems with employment as the market share weight used. They find that 'weighting establishments by output rather than employment only marginally reduces the net entry effect, raises the cross (covariance) effect in the FHK decomposition and reduces the within effect' (p.683). Melitz and Polanec (2012) conduct their analysis using a couple of existing methods (GR and FHK), as well as their new approach and across both labour productivity and TFP. In the case of the labour productivity decomposition, they choose to use an employment weight, while in their TFP decomposition, they use a value added weight.
Foster et al (2001) provides the best explanation as to why TFP is best conducted using output weights whilst labour productivity favours employment weights. Essentially they highlight that the major differences occur in relation to continuing plants. They find that when labour shares are used, within components tend to be larger. This is consistent with the Disney et al (2003) finding for the UK, discussed above. Moreover, we note that this is consistent with what we find. Also, a much larger contribution from the cross covariance term is evident when using output based shares rather than labour shares. To unpick the reasons, Foster et al (2001) look at the correlation between growth rates of labour and total factor productivity, capital, materials, output and employment. They note a distinct lack of correlation between employment and output growth and TFP growth. These are due in part to measurement errors, they say but also due to changes in factor intensities (which may or may not be productivity enhancing).
Table A1: A comparison of decomposition weights in recent studies
| Country |
Period |
Sectoral coverage |
Productivity measure |
Weight used to calculate within plant changes |
Study |
| US |
1972-1987 (5 yrs) |
Selected manufacturing |
TFP |
Output (t-k) |
Baily et al (1992) |
| US |
1977-1987 (5 and 10 year) |
All manufacturing |
TFP |
Output (t-k) |
Haltiwanger (1997) |
| Taiwan |
1981-1991 (5yr) |
Selected manufacturing |
TFP |
Average of Output (t-k) and t |
Aw et al (1997) |
| Columbia |
1978-1986 (annual) |
Selected manufacturing |
TFP |
Input index (average of t-k and t) |
Lui and Tybout (1996) |
| US |
1977-1987 (10 year) |
All manufacturing |
Labour productivity growth |
Employment (t-k) |
Baily et al (1996) |
| Israel |
1979-1988 (3 year) |
All manufacturing |
Labour productivity growth |
Employment (average [t-k]) and t) |
Griliches and Regev (1995) |
| US |
1977-1987 |
All manufacturing |
TFP |
Gross output |
Foster et al (2001) |
| US |
1977-1987 |
All manufacturing |
Labour productivity per hour |
Gross output Man hours Employment |
Foster et al (2001) |
| UK |
1980-1992 |
All manufacturing |
TFP |
Employment (with some sensitivity testing) |
Disney et al (2003) |
| UK |
1980-1992 |
All manufacturing |
Labour productivity |
Employment |
Disney et al (2003) |
| Slovenia |
1995-2000 |
All manufacturing |
TFP |
Gross value added |
Melitz and Polanec (2012) |
| Slovenia |
1995-2000 |
All manufacturing |
Labour productivity |
Employment |
Melitz and Polanec (2012) |
Source: Based on an extending table 8.1 in Foster et al (2001).
For an intuition of the underlying reasons for this, if we consider what we know about labour productivity, it is an efficiency term whereby inputs are turned into outputs, taking labour as the base input. What it assumes, when we use this measure as an indicator of (improvements in) efficiency, is that factor input combinations (other than labour) remain the same over the period of consideration (and across firms). If we weight these changes by shares in output we are missing the point, because changes in output could have been brought about by changes in other factor inputs. If we use shares in labour, this is consistent with labour productivity. In the case of MFP, it is derived from a production function where (supposedly) all factor inputs have been taken into account and is therefore a more direct representation of efficiency but also emphatically not representing changes in input mix. Therefore an output based measure is more suitable.
There are of course more general measurement problems that might lead us to conclude that output (or GVA in our case) is a less good weight. Prices are assumed to be the same across the sector and as Foster et al (2001) point out, entrants tend to price their output lower than incumbent firms, which affects output weights, understating the contribution from entrants in particular.
The empirical papers to date have tended to focus on aggregate performance of manufacturing. Aw et al (2001) is one of the few papers that disaggregates manufacturing in Taiwan. They decompose TFP growth only but find that by and large, net entry has a positive effect, except in clothing and transport equipment in the early period (1981-86). In these sectors, TFP growth was negative. The contribution of net entry varied considerably by sector, accounting for four fifths of the growth in TFP in electrical machinery. At a broad sectoral level, they identify differences between sectors, but highlight a number of common trends.
In conclusion, it is apparent from our reading of the literature that the theoretically preferred approach in our case would be to use the employment shares. For the sake of comparison, we present valued added weighted results for the models estimated in Figures A7 and A8 below. There are a number of differences, but the overall impression is broadly the same. We find a small role for entry and exit over the period we consider, when we look at the firm (entref) level for disaggregated industrial sectors that span both manufacturing and service sectors.
We present here the Melitz and Polanec chart and FHK at the detailed level of industrial classification for the full period using value added weights. As such, these are directly comparable to figures 6.3 and 6.6 above. Data underlying these charts are included at the end of this appendix. In addition, we include a table to provide sector shares based on employment and GVA to provide some indication of how each sector is weighted in the total economy over time.
The most notable difference is the scale, with GVA weights producing a much larger productivity effect for some sectors (in particular the sale, maintenance and repair of vehicles). As a consequence, unweighted productivity in the M&P decomposition is a small component of change. The cross term in the FHK approach is less negative, suggestive of productivity increases not being associated with corresponding rises in labour. However, the total economy pictures are not dramatically different.
Figure A1: Melitz and Polanec Productivity Decompositions, 1998-2007 (GVA weights)
Source: ARD and BSD data, authors' calculations, various years
Figure A2: FHK Productivity Decompositions, 1998-2007 (GVA weights)
Source: ARD and BSD data, authors' calculations, various years
A.2 Sensitivity analysis using BSD only data
One concern about using the ARD data as the base source of labour productivity data for this analysis is that there is sampling for small firms (those with less than 100 employees). One approach that has been used elsewhere has been to adjust the weight to account for the population; however, given that the BSD data are available for all firms in the population, an alternative which is based on less assumptions is to present a similar decomposition using the BSD data. The only substantial difference between these data and those presented above is that instead of GVA data, data on turnover is available. Turnover per head is a less preferred indicator of labour productivity and so the results are not directly comparable to those in figures 6.3 and 6.6 in the main text, but they are broadly similar and thus we feel this demonstrates that the sampled nature of the ARD is not biasing our findings dramatically for the dynamic decompositions.
However, as noted in Section 3.2.3 in the main text, the same is not true for comparisons of static decomposition estimates of allocative efficiency over time, with the BSD-based estimates casting doubt on the representativeness of ARD-based findings when micro-firms (those with fewer than 10 employees) are included in the analysis without using population weights (see Appendix Table A7 below). By contrast, the BSD-based estimates are more in line with static decomposition results for firms with ten or more employees (Appendix Table A8). Accordingly, in Section 5 in the main text, we present static decomposition results only for firms with ten or more employees.
Figure A3: Melitz and Polanec Productivity Decompositions (Average turnover per employee; BSD data), 1998-2007 (employment weights)
Source: BSD files, authors' calculations, various years
Figure A4: FHK Productivity Decompositions (Average turnover per employee; BSD data), 1998-2007 (employment weights)
Source: BSD files, authors' calculations, various years
A3 Disaggregating by 'age' of entrants using the BSD
As well as considering how the level of labour productivity on entry and exit to the industry might influence the productivity decompositions, we may also look at the extent to which the age of the firm has a role to play on entry. We therefore disaggregate entrants by whether it is old or new entry (that is, whether entry has taken place in the first half of the period (1998-2002) or the second half of the period (2003-2007). Because of the sensitivity of the ARD data to false entry and exits in particular (discussed above), we focus exclusively on the BSD decomposition for the full period. Results are presented below in charts A5 and A6 for the Melitz and Polanec decomposition and the FHK decomposition.
Figure A5: Disaggregated Melitz and Polanec decomposition, 1998-2007 (employment weights)
Source: BSD files, authors' calculations, various years
Figure A6: Disaggregated FHK decomposition, 1998-2007 (employment weights)
Source: BSD files, authors' calculations, various years
A4: Contributions of relatively high and low productivity entrants and exits for sub-periods
Figures A7 and A8 complement figure 6.9 in the paper, disaggregating by sub-period the extended Melitz and Polanec decomposition. The story remains broadly the same although in the first period we see a large negative contribution from below average productivity firms entering real estate. More worrying perhaps is computing which sees above average exit and below average entry suggesting unproductive churn. By the later period, exit plays a larger part with entry being less obvious.
Figure A7: Disaggregated Melitz and Polanec decomposition, 1998-2002 (employment weights)
Source: ARD and BSD data, authors' calculations, various years
Figure A8: Disaggregated Melitz and Polanec decomposition, 2003-2007 (employment weights)
Source: ARD and BSD data, authors' calculations, various years
Table A2: Data underlying Figure A1 (M&P GVA weights, 1998-2007)
| Industry |
Surviving Firms ▲ Lab Prod (unweigted) |
Surviving Firms ▲ Alloc Efficiency |
Entering Firms |
Exiting Firms |
All Firms |
| Mining and Quarrying, Electricity, gas and water supply |
-0.021 |
0.389 |
0.005 |
-0.196 |
0.178 |
| Manufacture of food, beverages and tobacco |
0.009 |
-0.262 |
-0.009 |
0.162 |
-0.100 |
| Manufacture of textile and leather products |
0.195 |
0.449 |
-0.010 |
0.041 |
0.675 |
| Manufacture of wood products |
-0.066 |
-0.198 |
-0.001 |
0.060 |
-0.204 |
| Manufacture of pulp, paper and printing |
-0.038 |
0.114 |
-0.002 |
0.061 |
0.135 |
| Manufacture of chemicals |
-0.069 |
0.323 |
0.005 |
0.014 |
0.273 |
| Manufacture of rubber |
0.069 |
0.295 |
-0.003 |
0.009 |
0.370 |
| Manufacture of non-metallic minerals |
-0.010 |
0.640 |
-0.008 |
0.007 |
0.629 |
| Manufacture of basic metals and fabricated metal products |
0.078 |
0.256 |
-0.003 |
0.036 |
0.367 |
| Manufacture of machinery and equipment NEC |
0.131 |
0.522 |
0.008 |
0.036 |
0.697 |
| Manufacture of electrical and optical equipment |
0.271 |
0.394 |
-0.009 |
-0.022 |
0.633 |
| Manufacture of transport equipment |
0.185 |
0.184 |
-0.030 |
0.055 |
0.394 |
| Manufacturing NEC |
0.027 |
0.175 |
0.071 |
0.014 |
0.287 |
| Construction |
-0.223 |
0.403 |
-0.019 |
0.073 |
0.234 |
| Sale, maintenance and repair of motor vehicles |
0.061 |
1.141 |
-0.020 |
0.150 |
1.332 |
| Wholesale trade |
-0.020 |
0.379 |
0.020 |
0.015 |
0.394 |
| Retail trade |
-0.015 |
0.208 |
0.002 |
-0.005 |
0.190 |
| Hotels and restaurants |
0.108 |
0.131 |
-0.011 |
-0.034 |
0.194 |
| Transport and storage |
-0.009 |
-0.033 |
0.023 |
0.053 |
0.034 |
| Post and telecommunication |
0.194 |
0.378 |
0.036 |
-0.089 |
0.519 |
| Real estate |
-0.120 |
0.492 |
-0.085 |
0.049 |
0.336 |
| Renting of machinery and equipment |
0.060 |
0.878 |
-0.018 |
-0.116 |
0.804 |
| Computing and related activities |
-0.135 |
0.467 |
-0.029 |
0.058 |
0.362 |
| R&D and other business services |
0.042 |
0.510 |
-0.018 |
0.001 |
0.534 |
| TOTAL ECONOMY |
0.006 |
0.323 |
0.002 |
-0.043 |
0.288 |
Table A3: Data underlying Figure A2: FHK, GVA weights, 1998-2007
| Industry |
Surviving Firms Within |
Surviving Firms Between |
Surviving Firms Cross |
Entering Firms |
Exiting Firms |
All Firms |
| Mining and Quarrying, Electricity, gas and water supply |
-0.04 |
0.05 |
0.28 |
0.01 |
0.13 |
0.18 |
| Manufacture of food, beverages and tobacco |
-0.03 |
-0.50 |
0.31 |
-0.01 |
-0.13 |
-0.10 |
| Manufacture of textile and leather products |
0.36 |
0.03 |
0.24 |
0.01 |
-0.03 |
0.67 |
| Manufacture of wood products |
-0.43 |
-0.37 |
0.55 |
0.00 |
-0.05 |
-0.20 |
| Manufacture of pulp, paper and printing |
-0.04 |
0.02 |
0.11 |
0.00 |
-0.04 |
0.13 |
| Manufacture of chemicals |
-0.10 |
-0.03 |
0.37 |
0.02 |
-0.01 |
0.27 |
| Manufacture of rubber |
0.08 |
0.03 |
0.24 |
0.01 |
-0.01 |
0.37 |
| Manufacture of non-metallic minerals |
0.17 |
0.19 |
0.25 |
0.01 |
-0.01 |
0.63 |
| Manufacture of basic metals and fabricated metal products |
0.06 |
-0.08 |
0.35 |
0.01 |
-0.03 |
0.37 |
| Manufacture of machinery and equipment NEC |
0.21 |
0.04 |
0.39 |
0.03 |
-0.03 |
0.70 |
| Manufacture of electrical and optical equipment |
0.21 |
-0.11 |
0.53 |
0.02 |
0.02 |
0.63 |
| Manufacture of transport equipment |
0.10 |
-0.24 |
0.49 |
-0.01 |
-0.05 |
0.39 |
| Manufacturing NEC |
0.06 |
-0.04 |
0.16 |
0.09 |
-0.01 |
0.29 |
| Construction |
-0.19 |
-0.09 |
0.47 |
-0.01 |
-0.05 |
0.23 |
| Sale, maintenance and repair of motor vehicles |
0.26 |
-0.25 |
1.19 |
0.02 |
-0.12 |
1.33 |
| Wholesale trade |
-0.04 |
-0.27 |
0.66 |
0.03 |
-0.01 |
0.39 |
| Retail trade |
-0.07 |
0.06 |
0.20 |
0.00 |
0.00 |
0.19 |
| Hotels and restaurants |
0.03 |
-0.05 |
0.23 |
0.00 |
0.03 |
0.19 |
| Transport and storage |
-0.15 |
-0.23 |
0.35 |
0.02 |
-0.05 |
0.03 |
| Post and telecommunication |
0.19 |
0.24 |
0.12 |
0.05 |
0.08 |
0.52 |
| Real estate |
-0.37 |
-0.50 |
1.21 |
-0.04 |
-0.04 |
0.34 |
| Renting of machinery and equipment |
0.06 |
0.15 |
0.69 |
0.00 |
0.09 |
0.80 |
| Computing and related activities |
0.02 |
-0.05 |
0.35 |
0.00 |
-0.04 |
0.36 |
| R&D and other business services |
0.04 |
-0.08 |
0.55 |
0.02 |
0.00 |
0.53 |
| TOTAL ECONOMY |
0.00 |
-0.12 |
0.43 |
0.01 |
0.03 |
0.29 |
Table A4: Sample sizes for data underlying Figures A1 and A2:
| Industry |
Surviving |
Entering Firms |
Exiting Firms |
Total |
| Mining and Quarrying, Electricity, gas and water supply |
572 |
70 |
90 |
732 |
| Manufacture of food, beverages and tobacco |
2,318 |
120 |
269 |
2,707 |
| Manufacture of textile and leather products |
2,072 |
80 |
191 |
2,343 |
| Manufacture of wood products |
814 |
41 |
56 |
911 |
| Manufacture of pulp, paper and printing |
3,118 |
172 |
363 |
3,653 |
| Manufacture of chemicals |
1,396 |
66 |
129 |
1,591 |
| Manufacture of rubber |
1,682 |
73 |
151 |
1,906 |
| Manufacture of non-metallic minerals |
1,012 |
55 |
117 |
1,184 |
| Manufacture of basic metals and fabricated metal products |
4,458 |
203 |
268 |
4,929 |
| Manufacture of machinery and equipment NEC |
2,820 |
100 |
193 |
3,113 |
| Manufacture of electrical and optical equipment |
2,952 |
125 |
263 |
3,340 |
| Manufacture of transport equipment |
1,312 |
71 |
108 |
1,491 |
| Manufacturing NEC |
1,810 |
124 |
104 |
2,038 |
| Construction |
8,346 |
1,232 |
730 |
10,308 |
| Sale, maintenance and repair of motor vehicles |
5,490 |
370 |
454 |
6,314 |
| Wholesale trade |
13,616 |
914 |
994 |
15,524 |
| Retail trade |
13,342 |
1,400 |
1,264 |
16,006 |
| Hotels and restaurants |
4,944 |
790 |
666 |
6,400 |
| Transport and storage |
5,052 |
450 |
375 |
5,877 |
| Post and telecommunication |
400 |
139 |
72 |
611 |
| Real estate |
2,390 |
442 |
214 |
3,046 |
| Renting of machinery and equipment |
978 |
125 |
94 |
1,197 |
| Computing and related activities |
2,514 |
542 |
320 |
3,376 |
| R&D and other business services |
13,182 |
2,082 |
1,307 |
16,571 |
| Total |
96,590 |
9,786 |
8,792 |
115,168 |
| % |
83.87 |
8.5 |
7.63 |
100 |
Table A5: Data underlying Figure A3: M&P Decomposition (Average turnover per employee), BSD data only, 1998-2007
| Industry |
▲ Lab Prod (unweighted) |
▲ Alloc Efficiency |
Entering Firms |
Exiting Firms |
All Firms |
| Mining and Quarrying, Electricity, gas and water supply |
-0.28 |
0.05 |
0.11 |
0.07 |
-0.06 |
| Manufacture of food, beverages and tobacco |
-0.03 |
0.09 |
-0.07 |
0.10 |
0.10 |
| Manufacture of textile and leather products |
0.03 |
0.31 |
-0.08 |
0.07 |
0.33 |
| Manufacture of wood products |
-0.12 |
0.21 |
-0.05 |
0.04 |
0.09 |
| Manufacture of pulp, paper and printing |
-0.26 |
0.31 |
-0.07 |
0.03 |
0.02 |
| Manufacture of chemicals |
-0.28 |
0.20 |
-0.13 |
0.02 |
-0.18 |
| Manufacture of rubber |
-0.05 |
0.24 |
-0.04 |
0.00 |
0.14 |
| Manufacture of non-metallic minerals |
-0.03 |
0.30 |
-0.05 |
0.01 |
0.23 |
| Manufacture of basic metals and fabricated metal products |
-0.05 |
0.17 |
-0.05 |
0.04 |
0.12 |
| Manufacture of machinery and equipment NEC |
-0.07 |
0.32 |
-0.04 |
0.04 |
0.24 |
| Manufacture of electrical and optical equipment |
0.06 |
0.35 |
-0.04 |
0.02 |
0.39 |
| Manufacture of transport equipment |
-0.03 |
0.31 |
-0.08 |
0.09 |
0.28 |
| Manufacturing NEC |
-0.09 |
0.21 |
-0.05 |
0.03 |
0.10 |
| Construction |
-0.28 |
0.23 |
-0.06 |
0.09 |
-0.03 |
| Sale, maintenance and repair of motor vehicles |
-0.03 |
0.25 |
-0.08 |
0.01 |
0.14 |
| Wholesale trade |
-0.22 |
0.30 |
-0.06 |
0.04 |
0.07 |
| Retail trade |
-0.04 |
0.22 |
-0.05 |
0.03 |
0.15 |
| Hotels and restaurants |
0.11 |
-0.02 |
0.03 |
0.02 |
0.13 |
| Transport and storage |
-0.08 |
0.19 |
-0.09 |
0.04 |
0.06 |
| Post and telecommunication |
0.18 |
0.31 |
0.07 |
-0.05 |
0.50 |
| Financial intermediation |
-0.57 |
0.47 |
-0.16 |
0.13 |
-0.13 |
| Real estate |
-0.16 |
0.15 |
0.10 |
-0.03 |
0.06 |
| Renting of machinery and equipment |
-0.06 |
0.20 |
-0.04 |
0.00 |
0.11 |
| Computing and related activities |
-0.21 |
0.35 |
-0.15 |
0.02 |
0.02 |
| R&D and other business services |
-0.11 |
0.44 |
0.03 |
0.03 |
0.39 |
| TOTAL ECONOMY |
-0.12 |
0.28 |
-0.10 |
0.01 |
0.07 |
Table A6: Data underlying Figure A4: FHK Decomposition (Average turnover per employee), BSD data only, 1998-2007
| Industry |
Within |
Between |
Cross |
Entering Firms |
Exiting Firms |
All Firms |
| Mining and Quarrying, Electricity, gas and water supply |
-0.04 |
0.06 |
-0.10 |
0.04 |
-0.02 |
-0.06 |
| Manufacture of food, beverages and tobacco |
-0.04 |
0.06 |
-0.10 |
0.04 |
-0.02 |
-0.06 |
| Manufacture of textile and leather products |
0.43 |
0.15 |
-0.19 |
0.01 |
-0.08 |
0.33 |
| Manufacture of wood products |
0.30 |
0.30 |
-0.21 |
-0.13 |
-0.17 |
0.09 |
| Manufacture of pulp, paper and printing |
0.02 |
0.02 |
-0.02 |
-0.01 |
-0.01 |
0.02 |
| Manufacture of chemicals |
0.04 |
0.05 |
-0.13 |
-0.13 |
-0.02 |
-0.18 |
| Manufacture of rubber |
0.17 |
0.06 |
-0.09 |
0.00 |
0.00 |
0.14 |
| Manufacture of non-metallic minerals |
0.18 |
0.07 |
-0.03 |
0.02 |
-0.01 |
0.23 |
| Manufacture of basic metals and fabricated metal products |
0.26 |
0.07 |
-0.13 |
-0.02 |
-0.07 |
0.12 |
| Manufacture of machinery and equipment NEC |
0.25 |
0.09 |
-0.08 |
0.01 |
-0.03 |
0.24 |
| Manufacture of electrical and optical equipment |
0.40 |
0.20 |
-0.24 |
0.05 |
-0.02 |
0.39 |
| Manufacture of transport equipment |
0.62 |
0.02 |
-0.28 |
0.05 |
-0.12 |
0.28 |
| Manufacturing NEC |
0.14 |
0.09 |
-0.09 |
0.00 |
-0.04 |
0.10 |
| Construction |
0.00 |
0.05 |
-0.04 |
-0.01 |
-0.03 |
-0.03 |
| Sale, maintenance and repair of motor vehicles |
0.11 |
0.04 |
0.02 |
-0.01 |
-0.02 |
0.14 |
| Wholesale trade |
0.09 |
0.09 |
-0.09 |
0.00 |
-0.02 |
0.07 |
| Retail trade |
0.12 |
0.08 |
-0.02 |
-0.01 |
-0.01 |
0.15 |
| Hotels and restaurants |
0.55 |
0.17 |
-0.50 |
0.04 |
-0.13 |
0.13 |
| Transport and storage |
0.08 |
0.09 |
-0.12 |
-0.03 |
-0.02 |
0.06 |
| Post and telecommunication |
0.29 |
0.07 |
-0.06 |
0.16 |
0.04 |
0.50 |
| Financial intermediation |
0.02 |
0.20 |
-0.22 |
-0.09 |
-0.05 |
-0.13 |
| Real estate |
0.04 |
0.02 |
-0.04 |
0.04 |
0.00 |
0.06 |
| Renting of machinery and equipment |
0.10 |
0.08 |
-0.10 |
0.03 |
0.00 |
0.11 |
| Computing and related activities |
0.12 |
0.02 |
-0.06 |
-0.05 |
-0.02 |
0.02 |
| R&D and other business services |
0.26 |
0.32 |
-0.30 |
0.14 |
-0.03 |
0.39 |
| TOTAL ECONOMY |
0.08 |
0.07 |
-0.08 |
0.02 |
-0.02 |
0.07 |
Table A7: Static Olley Pakes decompositions (average turnover per head; BSD data only), total economy and broad industry group levels, 1998-2007, analysed by sub-period, all firms
| Industry |
Average Productivity (weighted) |
Average Productivity (unweighted) |
Allocative Efficiency |
N |
| 1998-2000 |
|
|
|
|
| Total Economy |
4.095 |
4.002 |
0.093 |
4,615,422 |
| Manufacturing |
4.352 |
4.034 |
0.318 |
540,528 |
| Services |
3.939 |
3.948 |
-0.009 |
3,449,706 |
| Other Production |
4.672 |
4.421 |
0.251 |
625,188 |
| 2001-2003 |
|
|
|
|
| Total Economy |
4.108 |
4.004 |
0.104 |
4,712,595 |
| Manufacturing |
4.402 |
4.034 |
0.368 |
509,432 |
| Services |
3.96 |
3.959 |
0.001 |
3,568,719 |
| Other Production |
4.524 |
4.302 |
0.222 |
634,444 |
| 2004-2007 |
|
|
|
|
| Total Economy |
4.197 |
4.063 |
0.135 |
6,935,789 |
| Manufacturing |
4.517 |
4.064 |
0.453 |
642,884 |
| Services |
4.071 |
4.035 |
0.036 |
5,343,587 |
| Other Production |
4.553 |
4.302 |
0.251 |
949,318 |
Source: BSD various years, authors' calculations (all firms; employment weights; bottom-up aggregation)
Table A8: Static Olley Pakes decompositions (average turnover per head; BSD data only), total economy and broad industry group levels, 1998-2007, analysed by sub-period, all firms with ten or more employees
| Industry |
Average Productivity (weighted) |
Average Productivity (unweighted) |
Allocative Efficiency |
N |
| 1998-2000 |
|
|
|
|
| Total Economy |
4.122 |
3.989 |
0.133 |
530,610 |
| Manufacturing |
4.444 |
4.2 |
0.244 |
135,476 |
| Services |
3.929 |
3.855 |
0.074 |
350,934 |
| Other Production |
4.915 |
4.636 |
0.279 |
44,200 |
| 2001-2003 |
|
|
|
|
| Total Economy |
4.146 |
4.021 |
0.125 |
542,712 |
| Manufacturing |
4.455 |
4.200 |
0.256 |
126,652 |
| Services |
3.961 |
3.898 |
0.063 |
363,031 |
| Other Production |
4.747 |
4.522 |
0.225 |
53,029 |
| 2004-2007 |
|
|
|
|
| Total Economy |
4.242 |
4.103 |
0.139 |
710,062 |
| Manufacturing |
4.588 |
4.284 |
0.304 |
149,740 |
| Services |
4.082 |
4.009 |
0.074 |
487,549 |
| Other Production |
4.76 |
4.482 |
0.279 |
72,773 |
Source: BSD various years, authors' calculations (all firms with ten or more employees; employment weights; bottom-up aggregation)
Appendix B: Productivity and High Growth Firms
The UK is generally noted for having a large proportion of its firms that show little sign of growth (Bravo-Biosca, 2012). In this Appendix we present some general descriptive analysis of the data employed for the dynamic decomposition. Chiefly we describe the relationships observable between high growth firm status and labour productivity levels at the beginning and end of our sample periods. We identify HGFs as those firms that experience three years of consecutive employment growth over 20%. This is slightly stricter than the OECD definition which requires an average of 20% growth over three years. We distinguish between those that have more than 10 employees and the full survey sample. Data here are raw averages and not weighted by firm size. That said, the decomposition explicitly weights the firm by its market share and therefore, when we look at labour productivity change in section B.2, we use the weighted average labour productivity measures.
B.1: Labour productivity 1998-2007
Around 29 per cent of firms are classified as high growth (summing together those that have less than 10 employees, and those that have more in table B1). Whilst this is high, we note that all HGFs are included here, including the firms with less than 10 employees. If we consider the definition of HGF being restricted to firms that have more than 10 employees, this percentage share falls to 11 per cent (although the labour productivity level remains pretty much the same for HGFs), which is closer to other estimates, particularly when we account for the fact that we include any firm that achieves the HGF status in the five year period over which our decompositions are based (see section 6). It is clear that high growth firms appear to have significantly higher labour productivity at the beginning of the period (i.e. before they are identified as high growth) but that there is a less clearly discernible difference between the mean levels of labour productivity by the end of the period. Indeed, the difference is more pronounced for the larger HGFs by the end of the period.
Table B1 Labour productivity by HGF status (1998 and 2002)
|
mean (rgva/emp) |
Standard deviation |
N |
| 1998 |
|
|
|
| non-HGFs |
36.07 |
117.38 |
52,119 |
| HGFs<10 emp |
84.62 |
219.96 |
9,568 |
| HGFs>10 emp |
75.52 |
214.15 |
5,792 |
| Total |
46.34 |
147.65 |
67,479 |
| 2002 |
|
|
|
| non-HGFs |
44.10 |
150.79 |
55,713 |
| HGFs<10 emp |
44.18 |
138.30 |
9,081 |
| HGFs>10 emp |
49.82 |
165.37 |
7,019 |
| Total |
44.67 |
150.78 |
71,813 |
Source: ARD, authors' calculations
Comparing Table B2 with Table B1 we see similar levels of mean productivity and the pattern remains the same across both sub-periods of our analysis.
Table B2: labour productivity by HGF status (2003 and 2007)
|
mean (rgva/emp) |
Standard deviation |
N |
| 2003 |
|
|
|
| non-HGFs |
38.72 |
109.14 |
49,316 |
| HGFs<10 emp |
83.56 |
270.91 |
6,400 |
| HGFs>10 emp |
71.81 |
177.77 |
4,047 |
| Total |
45.76 |
141.66 |
59,763 |
| 2007 |
|
|
|
| non-HGFs |
52.93 |
163.86 |
49,316 |
| HGFs<10 emp |
55.61 |
177.45 |
6,400 |
| HGFs>10 emp |
60.33 |
166.29 |
4,047 |
| Total |
53.71 |
165.54 |
59,763 |
Source: ARD, authors' calculations
In tables B3 and B4 we identify the proportion of high growth firms that experience above average levels of labour productivity at the beginning and the end of each sub period, 1998-2002 and 2003-2007, respectively. We note that around 43% of smaller HGFs and 54.5% of the larger HGFs experience above average labour productivity in 1998, however by the end of the period in 2002, this has dropped to less than a third of the HGFs. In the second period, only around 40% of HGFs are showing above average labour productivity, but this has fallen to between one fifth and a quarter of HGFs by the end of the period in 2007.
Table B3: Percentage share of HGFs with above average labour productivity (1998 and 2002)
|
HGF<10emp |
HGF>10emp |
| Labour productivity 1998 |
42.7 |
54.4 |
| Labour productivity 2002 |
27.1 |
29.2 |
| n |
9,639 |
7,344 |
Source: ARD, authors' calculations
Table B4: Percentage share of HGFs with above average labour productivity (2003 and 2007)
|
HGF<10emp |
HGF>10emp |
| Labour productivity 2003 |
38.1 |
40.4 |
| Labour productivity 2007 |
21.6 |
26.9 |
| n |
6,400 |
4,047 |
Source: ARD, authors' calculations
Thus, HGFs have a smaller proportion of above average enterprises than we perhaps might have though, however, when we remind ourselves that our labour productivity measure is dependent on employment this may not be especially surprising.
Table B5 provides unweighted labour productivity levels by HGF status. In general 1998 labour productivity figures appear to show labour productivity is highest for the small HGF enterprises, almost certainly a function of the denominator (employees) being small at the beginning of the period. In all cases, average labour productivity in 1998 is higher for HGFs than for non HGFs. By the end of the period, presented in Table B6, the difference in mean levels of labour productivity across HGFs status is not so clear.
Table B5: labour productivity levels, 1998, by sector and HGF status (£000s, 2005 prices)
|
Industry |
Non HGF Mean |
Non HGF Std. Dev. |
Non HGF N |
HGF<10emp Mean |
HGF<10emp Std. Dev. |
HGF<10emp N |
HGF>10emp Mean |
HGF>10emp Std. Dev. |
HGF>10emp N |
| C, E |
Mining and quarrying, Electricity, gas and water supply |
209.25 |
477.14 |
316 |
292.75 |
795.43 |
32 |
474.06 |
1,055.55 |
50 |
| DA |
Manufacture of food, beverages and tobacco |
33.28 |
64.97 |
1,270 |
190.71 |
471.00 |
93 |
60.29 |
71.87 |
166 |
| DB, DC |
Manufacture of textile and leather products |
19.00 |
17.44 |
1,221 |
78.46 |
132.52 |
66 |
33.21 |
29.61 |
76 |
| DD |
Manufacture of wood products |
28.71 |
19.13 |
448 |
71.32 |
89.90 |
58 |
45.21 |
31.03 |
42 |
| DE |
Manufacture of pulp, paper and printing |
36.62 |
43.17 |
1,800 |
114.84 |
311.31 |
163 |
68.22 |
120.76 |
216 |
| DG |
Manufacture of chemicals |
60.61 |
164.04 |
746 |
115.74 |
215.51 |
43 |
87.88 |
118.13 |
86 |
| DH |
Manufacture of rubber |
28.67 |
18.92 |
896 |
117.03 |
197.83 |
71 |
46.51 |
33.96 |
124 |
| DI |
Manufacture of non-metallic minerals |
30.15 |
24.23 |
573 |
98.84 |
157.07 |
43 |
62.55 |
52.15 |
69 |
| DJ |
Manufacture of basic metals and fabricated metal products |
28.81 |
23.52 |
2,349 |
127.43 |
376.00 |
193 |
57.23 |
49.30 |
247 |
| DK |
Manufacture of machinery and equipment NEC |
32.70 |
50.29 |
1,504 |
89.64 |
96.29 |
103 |
64.54 |
156.12 |
144 |
| DL |
Manufacture of electrical and optical equipment |
27.22 |
49.00 |
1,572 |
126.09 |
354.41 |
125 |
58.90 |
121.71 |
210 |
| DM |
Manufacture of transport equipment |
33.09 |
25.60 |
690 |
111.37 |
233.74 |
55 |
55.91 |
59.39 |
86 |
| DN |
Manufacturing NEC |
27.76 |
22.34 |
900 |
67.46 |
92.59 |
118 |
49.16 |
35.46 |
109 |
| F |
Construction |
39.68 |
77.56 |
3,969 |
100.33 |
174.18 |
1,597 |
97.18 |
243.28 |
621 |
| 50 |
Sale, maintenance and repair of motor vehicles |
30.39 |
109.46 |
3,146 |
82.30 |
318.33 |
463 |
65.91 |
153.65 |
274 |
| 51 |
Wholesale trade |
42.13 |
130.38 |
6,613 |
83.74 |
144.14 |
1,256 |
92.60 |
210.03 |
716 |
| 52 |
Retail trade |
16.30 |
38.24 |
7,828 |
33.14 |
88.91 |
1,657 |
36.93 |
59.61 |
411 |
| H |
Hotels and restaurants |
13.87 |
15.63 |
3,194 |
26.75 |
64.61 |
527 |
24.21 |
32.02 |
376 |
| 60, 61, 6 |
Transport and storage |
47.37 |
133.03 |
2,605 |
92.99 |
227.43 |
476 |
74.46 |
253.78 |
374 |
| 64 |
Post and telecommunications |
45.80 |
178.79 |
197 |
85.52 |
195.79 |
67 |
74.40 |
105.17 |
55 |
| 70 |
Real estate |
94.14 |
324.45 |
1,348 |
163.99 |
384.19 |
326 |
251.34 |
734.42 |
82 |
| 71 |
Renting of machinery and equipment |
78.30 |
264.58 |
498 |
161.95 |
596.64 |
113 |
162.21 |
457.60 |
84 |
| 72 |
Computing and related activities |
58.45 |
165.71 |
1,229 |
102.91 |
206.21 |
478 |
92.88 |
90.96 |
170 |
| 73, 74 |
R&D and other business services |
41.64 |
137.12 |
7,207 |
89.85 |
216.22 |
1,445 |
69.71 |
141.90 |
1,004 |
| Total |
|
36.07 |
117.38 |
52,119 |
84.62 |
219.96 |
9,568 |
75.52 |
214.15 |
5,792 |
Source: ARD and BSD authors' calculations
Table B6: labour productivity levels, 2002, by sector and HGF status (£000s, 2005 prices)
|
Industry |
Non HGF Mean |
Non HGF Std. Dev. |
Non HGF N |
HGF<10emp Mean |
HGF<10emp Std. Dev. |
HGF<10emp N |
HGF>10emp Mean |
HGF>10emp Std. Dev. |
HGF>10emp N |
| C, E |
Mining and quarrying, Electricity, gas and water supply |
247.59 |
601.56 |
336 |
136.07 |
202.89 |
32 |
392.63 |
860.72 |
58 |
| DA |
Manufacture of food, beverages and tobacco |
40.59 |
142.00 |
1259 |
35.48 |
61.00 |
93 |
38.43 |
59.11 |
185 |
| DB, DC |
Manufacture of textile and leather products |
24.52 |
51.42 |
1247 |
30.98 |
31.82 |
65 |
32.21 |
36.09 |
85 |
| DD |
Manufacture of wood products |
36.44 |
77.50 |
447 |
45.93 |
83.54 |
56 |
37.67 |
25.23 |
52 |
| DE |
Manufacture of pulp, paper and printing |
40.60 |
68.29 |
1760 |
47.14 |
94.14 |
158 |
41.32 |
29.87 |
242 |
| DG |
Manufacture of chemicals |
63.22 |
104.78 |
749 |
57.29 |
114.08 |
43 |
57.77 |
49.31 |
86 |
| DH |
Manufacture of rubber |
34.83 |
61.94 |
891 |
36.65 |
39.40 |
72 |
37.09 |
51.07 |
130 |
| DI |
Manufacture of non-metallic minerals |
37.22 |
79.79 |
569 |
29.64 |
20.92 |
44 |
59.30 |
216.42 |
81 |
| DJ |
Manufacture of basic metals and fabricated metal products |
36.15 |
74.44 |
2410 |
39.50 |
35.90 |
194 |
41.16 |
39.50 |
275 |
| DK |
Manufacture of machinery and equipment NEC |
35.74 |
61.55 |
1497 |
43.91 |
71.32 |
102 |
41.55 |
38.01 |
158 |
| DL |
Manufacture of electrical and optical equipment |
36.42 |
125.18 |
1545 |
39.52 |
40.70 |
124 |
38.76 |
55.71 |
232 |
| DM |
Manufacture of transport equipment |
38.41 |
44.38 |
700 |
57.24 |
137.74 |
55 |
38.78 |
48.20 |
103 |
| DN |
Manufacturing NEC |
35.84 |
60.47 |
967 |
37.22 |
43.19 |
119 |
32.98 |
28.77 |
119 |
| F |
Construction |
46.53 |
111.61 |
4606 |
48.93 |
157.97 |
1544 |
48.80 |
108.24 |
697 |
| 50 |
Sale, maintenance and repair of motor vehicles |
39.40 |
140.35 |
3285 |
37.80 |
100.65 |
434 |
53.40 |
230.49 |
320 |
| 51 |
Wholesale trade |
48.42 |
158.77 |
6849 |
56.50 |
184.05 |
1204 |
52.90 |
128.05 |
827 |
| 52 |
Retail trade |
18.87 |
52.84 |
8288 |
18.35 |
43.77 |
1554 |
25.07 |
55.70 |
584 |
| H |
Hotels and restaurants |
17.92 |
50.68 |
3818 |
13.29 |
18.95 |
477 |
16.69 |
39.50 |
498 |
| 60, 61, 6 |
Transport and storage |
61.39 |
222.85 |
2724 |
57.33 |
124.53 |
466 |
53.36 |
224.41 |
448 |
| 64 |
Post and telecommunications |
85.39 |
296.83 |
281 |
38.14 |
32.57 |
63 |
74.08 |
160.17 |
80 |
| 70 |
Real estate |
112.75 |
376.28 |
1530 |
106.23 |
362.42 |
305 |
93.88 |
195.22 |
115 |
| 71 |
Renting of machinery and equipment |
91.64 |
235.43 |
532 |
58.78 |
160.57 |
104 |
153.43 |
443.72 |
104 |
| 72 |
Computing and related activities |
72.01 |
210.41 |
1473 |
59.78 |
154.33 |
426 |
68.33 |
102.77 |
239 |
| 73, 74 |
R&D and other business services |
53.79 |
162.19 |
7950 |
46.42 |
112.70 |
1347 |
49.98 |
176.24 |
1301 |
| Total |
|
44.10 |
150.79 |
55713 |
44.18 |
138.30 |
9081 |
49.82 |
165.37 |
7019 |
Source: ARD and BSD authors' calculations
Table B7: labour productivity levels, 2003, by sector and HGF status (£000s, 2005 prices)
|
Industry |
Non HGF Mean |
Non HGF Std. Dev. |
Non HGF N |
HGF<10emp Mean |
HGF<10emp Std. Dev. |
HGF<10emp N |
HGF>10emp Mean |
HGF>10emp Std. Dev. |
HGF>10emp N |
| C, E |
Mining and quarrying, Electricity, gas and water supply |
176.27 |
460.57 |
261 |
564.44 |
1275.50 |
21 |
391.98 |
1008.63 |
40 |
| DA |
Manufacture of food, beverages and tobacco |
33.41 |
33.51 |
1061 |
70.90 |
169.41 |
77 |
45.97 |
74.97 |
111 |
| DB, DC |
Manufacture of textile and leather products |
31.40 |
152.69 |
912 |
59.58 |
65.82 |
49 |
36.88 |
35.03 |
45 |
| DD |
Manufacture of wood products |
33.53 |
36.09 |
402 |
53.88 |
50.33 |
34 |
53.52 |
53.61 |
24 |
| DE |
Manufacture of pulp, paper and printing |
40.57 |
120.93 |
1574 |
85.16 |
186.98 |
103 |
67.05 |
85.64 |
108 |
| DG |
Manufacture of chemicals |
57.18 |
91.87 |
668 |
352.68 |
650.90 |
24 |
107.37 |
165.07 |
42 |
| DH |
Manufacture of rubber |
31.70 |
21.67 |
842 |
238.42 |
692.42 |
34 |
40.46 |
36.94 |
60 |
| DI |
Manufacture of non-metallic minerals |
36.81 |
45.36 |
499 |
99.05 |
168.10 |
31 |
53.70 |
54.86 |
32 |
| DJ |
Manufacture of basic metals and fabricated metal products |
34.59 |
46.42 |
2246 |
78.14 |
121.04 |
121 |
62.01 |
95.46 |
139 |
| DK |
Manufacture of machinery and equipment NEC |
37.83 |
54.10 |
1356 |
64.18 |
64.86 |
63 |
55.13 |
39.74 |
65 |
| DL |
Manufacture of electrical and optical equipment |
35.85 |
46.40 |
1457 |
83.75 |
184.14 |
56 |
67.73 |
80.52 |
94 |
| DM |
Manufacture of transport equipment |
35.39 |
21.61 |
661 |
183.67 |
713.50 |
31 |
48.89 |
60.11 |
58 |
| DN |
Manufacturing NEC |
31.63 |
37.66 |
943 |
125.70 |
536.08 |
88 |
55.03 |
61.81 |
54 |
| F |
Construction |
40.97 |
75.18 |
4733 |
80.50 |
166.11 |
849 |
69.85 |
81.57 |
327 |
| 50 |
Sale, maintenance and repair of motor vehicles |
33.41 |
76.12 |
2730 |
59.13 |
122.18 |
361 |
59.46 |
85.73 |
175 |
| 51 |
Wholesale trade |
44.13 |
124.65 |
6637 |
82.68 |
196.67 |
783 |
81.61 |
161.30 |
520 |
| 52 |
Retail trade |
19.98 |
39.21 |
6544 |
37.35 |
81.20 |
1286 |
46.54 |
112.55 |
376 |
| H |
Hotels and restaurants |
15.67 |
23.53 |
2784 |
41.03 |
255.98 |
550 |
36.88 |
126.96 |
301 |
| 60, 61, 6 |
Transport and storage |
50.72 |
215.71 |
2565 |
111.79 |
316.19 |
338 |
89.69 |
165.74 |
243 |
| 64 |
Post and telecommunications |
54.37 |
141.65 |
305 |
148.77 |
557.99 |
49 |
66.90 |
55.72 |
48 |
| 70 |
Real estate |
74.23 |
216.53 |
1381 |
164.89 |
335.49 |
178 |
102.40 |
253.24 |
113 |
| 71 |
Renting of machinery and equipment |
67.06 |
151.58 |
547 |
154.36 |
582.91 |
83 |
168.48 |
440.49 |
63 |
| 72 |
Computing and related activities |
51.85 |
69.81 |
1460 |
111.40 |
321.93 |
242 |
113.49 |
182.75 |
141 |
| 73, 74 |
R&D and other business services |
43.00 |
113.02 |
6748 |
116.07 |
356.38 |
949 |
68.15 |
150.46 |
868 |
| Total |
|
69.11 |
2072.63 |
52210 |
83.56 |
270.91 |
6400 |
71.81 |
177.77 |
4047 |
Source: ARD and BSD authors' calculations
Table B8: Labour productivity levels, 2007, by sector and HGF status (£000s, 2005 prices)
|
Industry |
Non HGF Mean |
Non HGF Std. Dev. |
Non HGF N |
HGF<10emp Mean |
HGF<10emp Std. Dev. |
HGF<10emp N |
HGF>10emp Mean |
HGF>10emp Std. Dev. |
HGF>10emp N |
| C, E |
Mining and quarrying, Electricity, gas and water supply |
253.91 |
710.89 |
261 |
426.37 |
660.19 |
21 |
352.98 |
635.70 |
40 |
| DA |
Manufacture of food, beverages and tobacco |
43.42 |
61.16 |
1061 |
30.42 |
30.43 |
77 |
50.43 |
61.03 |
111 |
| DB, DC |
Manufacture of textile and leather products |
42.04 |
219.43 |
912 |
29.89 |
26.73 |
49 |
34.91 |
29.73 |
45 |
| DD |
Manufacture of wood products |
40.98 |
52.62 |
402 |
35.85 |
26.81 |
34 |
47.97 |
54.12 |
24 |
| DE |
Manufacture of pulp, paper and printing |
45.95 |
75.14 |
1574 |
51.37 |
66.65 |
103 |
43.69 |
29.68 |
108 |
| DG |
Manufacture of chemicals |
68.45 |
156.72 |
668 |
64.93 |
63.15 |
24 |
68.05 |
61.17 |
42 |
| DH |
Manufacture of rubber |
40.82 |
55.82 |
842 |
43.86 |
32.85 |
34 |
38.14 |
25.80 |
60 |
| DI |
Manufacture of non-metallic minerals |
51.13 |
164.08 |
499 |
61.47 |
70.27 |
31 |
42.94 |
27.42 |
32 |
| DJ |
Manufacture of basic metals and fabricated metal products |
45.90 |
119.23 |
2246 |
47.08 |
52.76 |
121 |
49.53 |
36.06 |
139 |
| DK |
Manufacture of machinery and equipment NEC |
50.07 |
119.96 |
1356 |
104.86 |
438.58 |
63 |
117.96 |
577.29 |
65 |
| DL |
Manufacture of electrical and optical equipment |
46.83 |
79.99 |
1457 |
74.51 |
158.57 |
56 |
52.84 |
41.22 |
94 |
| DM |
Manufacture of transport equipment |
47.06 |
70.74 |
661 |
52.65 |
53.62 |
31 |
37.28 |
23.27 |
58 |
| DN |
Manufacturing NEC |
37.85 |
55.39 |
943 |
54.34 |
101.33 |
88 |
47.69 |
43.53 |
54 |
| F |
Construction |
62.15 |
155.17 |
4733 |
72.51 |
236.25 |
849 |
66.94 |
184.53 |
327 |
|
Non HGF Mean |
Non HGF Std. Dev. |
Non HGF N |
HGF<10emp Mean |
HGF<10emp Std. Dev. |
HGF<10emp N |
HGF>10emp Mean |
HGF>10emp Std. Dev. |
HGF>10emp N |
| 50 Sale, maintenance and repair of motor vehicles |
40.29 |
88.35 |
2730 |
44.78 |
116.50 |
361 |
44.24 |
48.08 |
175 |
| 51 Wholesale trade |
59.96 |
178.46 |
6637 |
51.03 |
95.30 |
783 |
71.63 |
148.39 |
520 |
| 52 Retail trade |
26.81 |
93.58 |
6544 |
29.95 |
108.00 |
1286 |
32.94 |
75.83 |
376 |
| H Hotels and restaurants |
21.15 |
67.70 |
2784 |
17.89 |
49.42 |
550 |
30.62 |
110.64 |
301 |
| 60, 61, 6 Transport and storage |
63.11 |
181.51 |
2565 |
49.67 |
84.15 |
338 |
76.39 |
169.63 |
243 |
| 64 Post and telecommunications |
93.49 |
325.12 |
305 |
93.50 |
260.37 |
49 |
124.03 |
466.74 |
48 |
| 70 Real estate |
108.16 |
319.85 |
1381 |
157.87 |
388.97 |
178 |
67.59 |
108.02 |
113 |
| 71 Renting of machinery and equipment |
84.73 |
188.12 |
547 |
71.60 |
116.58 |
83 |
72.35 |
62.12 |
63 |
| 72 Computing and related activities |
71.49 |
198.56 |
1460 |
70.07 |
174.15 |
242 |
99.83 |
176.65 |
141 |
| 73, 74 R&D and other business services |
64.03 |
195.31 |
6748 |
74.13 |
237.27 |
949 |
54.07 |
138.37 |
868 |
| Total |
52.93 |
163.86 |
49316 |
55.61 |
177.45 |
6400 |
60.33 |
166.29 |
4047 |
Source: ARD and BSD authors' calculations
B.2: Parametric analysis of HGFs and productivity
Implicitly, we consider HGFs to be 'good' for the economy because these firms are assumed to be more productive than the average firm. It therefore seems reasonable to explore the extent to which this is in fact the case. Moreover, we are also interested in whether firms that enter and exit the economy follow the standard Schumpeterian theory of improving productivity through innovation and new firm birth, or whether there is a clear cost to novelty and learning that takes time to improve the aggregate economic position. Whilst a more sophisticated econometric analysis would be possible with the full ARD/BSD panel, here we utilise the data constructed for the decomposition to conduct a simple analysis of the associations in order to inform our interpretation of our decomposition findings. Thus, the regression below takes a very simple cross sectional form whereby:
LnLP2003 = α0 + β₁ in Emp2003 + β₂HGF1998-2002 + β₃HGF2003-2007 + β₄HGF_multi + δind + ε
LnLP represents the log of gross value added per person in 2003 (2007), InEmp captures the log of employment (to control for size) and three terms designed to capture various effects of HGF status. Firstly we include an incident of high growth in the first period of analysis (1998-2002). Secondly, we include a post performance measure of HGF status (2003-2007) and finally we control for a firm experiencing a repeat incidence of HGF, so HGF in both periods. We control also for 2 digit industry variation with the inclusion of dummies. From this specification it is clear that we wish to allow for performance to be affected by a period of high growth or to allow HGF to follow from a strong productive performance. We consider this firstly for labour productivity in 2003 and then for labour productivity in 2007 (similarly allowing employment to vary accordingly). The findings are reported in Table B9 below.
Table B9: Cross sectional regression results: Labour productivity (real GVA/employee)
|
LP03 |
LP07 |
| In(employment) |
0.018*** |
0.043*** |
|
(0.004) |
(0.005) |
| HGF incidence 1998-2002 |
-0.010 |
0.046*** |
|
(0.014) |
(0.016) |
| HGF incidence 2003-2007 |
0.413*** |
0.052* |
|
(0.0318) |
(0.0277) |
| More than one HGF incidence |
-0.095* |
-0.092* |
|
(0.052) |
(0.049) |
| Two digit sector dummies |
Y |
Y |
| N |
23,419 |
22,150 |
| R-Squared |
0.144 |
0.112 |
Notes: robust standard errors in parenthesis' *** indicates significance at the 1% level of confidence, **5% and *10%.
It is clear that the overall explanatory power of the regression is poor, but this is to be expected given the limited scope of the specification. Moreover we are concerned about issues such as simultaneity, but these regressions do offer some indication of associations. Size is positively associated with labour productivity and we note that effect for a high growth incidence in the current period is stronger for 2003 than for 2007, but is significant to at least the 10% level in both. The effect for 2003 is stronger, which is indicative of reverse causality (i.e. a strong productivity performance leading to higher growth). The coefficient associated with an earlier incidence of HGF status is insignificant in 2003 but evident in 2007 (both more significant and larger as well as positive). This might suggest a dip in performance immediately following a growth spurt, although this is only weakly evident. Finally, we note that having an incidence of high growth in both periods is negative, although weakly significant. This is again supportive of the fact that high growth may lead to lower productivity performance in the short term.
The regression above explores the relationship between HGF and productivity. Work elsewhere has considered the determinants of HGF (where labour productivity is a determinant of HGF status) and it appears as though the direction of causality is not clearly unidirectional. We do find however that the average firm that experiences HGF incidence is more productive and there appears also to be a lag to this productivity advantage.
B.3 Non-parametric analysis: Productivity distributions across the ARD
Regression analysis considers the average effect. Here we focus on using all moments of the distribution using non-parametric methods. In this section, we explore the productivity distributions across subsets of the ARD. We compare the productivities of HGFs with non-HGFs and also continuing firms with those firms that exit and enter. We are able to visualise the differences in the distributions by comparing the figures below, however a formal non-parametric test is available to test whether the differences are statistically significant and whether one distribution dominates over the other (Stochastic Dominance). We report these below also.
If we consider the distribution of productivity across all moments of the labour productivity measure, we see that at the start of the period, prior to high growth incidence, the labour productivity of HGFs is substantially greater than non-HGFs throughout the distribution (Figure 4.1). However, if we go on to consider the distributions at the end of the period (2002), following the HGF incidence, we note very little if any difference in the distributions. In part of course this is driven by definitional similarities between the variables - growth is determined by employment growth and labour productivity is measured as the natural log of value added per employee. We report the results only for firms with more than 10 employees (because of concerns over the meaningfulness of micro firm employment growth).
Figure B1: Cumulative distribution of logged labour productivity 1998: HGFs and non HGFs
This chart displays two cumulative distribution functions, one for 'lp_nonhgf' (dashed line) and one for 'lp_hgf' (solid line), plotted against 'lp98' on the x-axis. Both lines show an S-shape, starting near 0 and rising to 1. The 'lp_hgf' curve generally lies to the right of 'lp_nonhgf', indicating higher productivity for HGFs in 1998.
Notes: 10 or more employees, ARD and BSD, authors' calculations
Figure B2: Cumulative distribution of logged labour productivity 2002: HGFs and non HGFs
This chart displays two cumulative distribution functions, one for 'lp_nonhgf2' (dashed line) and one for 'lp_hgf2' (solid line), plotted against 'lp02' on the x-axis. Both lines show an S-shape, starting near 0 and rising to 1. The two curves are very close, indicating minimal difference in productivity distributions for HGFs and non-HGFs in 2002.
Notes: 10 or more employees, ARD and BSD, authors' calculations
The figures above provide a visual representation of how the distributions differ across the two subsets of firms. A formal test for differences between distributions is available. Table B10 presents the results for the Kolmogorov-Smirnov test for the equality in distributions. The final P value indicates that we can reject the null hypothesis of equality in the distribution functions for HGFs and non HGFs.
Table B10: Kolmogorov-Smirnov Test for equality in distributions of labour productivity
| LP98 |
D |
P-value |
Corrected |
| Non HGF |
0.272 |
0.000 |
|
| HGF |
-0.002 |
0.971 |
|
| Combined KS: |
0.272 |
0.000 |
0.000 |
| LP02 |
|
|
|
| Non HGF |
0.055 |
|
|
| HGF |
0.000 |
0.999 |
|
| Combined KS: |
0.055 |
0.000 |
0.000 |
In Figure B3 and B4 we go on to consider the distributions across the different dynamic categories of firms. Figure B3 concentrates on logged labour productivity distributions for 1998 for continuing firms and exiting firms.
Figure B3: Labour productivity 1998: continuers versus exits
This chart shows two cumulative distribution functions, 'lp_contin' (solid line) and 'lp_exit' (dashed line), plotted against 'lp98' on the x-axis. The 'lp_contin' curve lies to the right of 'lp_exit', indicating that continuing firms had higher labour productivity than exiting firms in 1998.
It can be seen from Figure B3 that the cumulative productivity distribution of logged labour productivity in 1998 for continuing firms is to the right of those that exit before 2002. This is in line with expectations since we would expect firms that exit the industry to be of lower quality than those that are able to remain. This figure represents all firms in the ARD. We could look by sector (manufacturing, other production and services). Based on the same subset of continuing firms (over the period 1998-2002) we are able to look at the labour productivity distribution of those that remained (as above) and those that entered the ARD during the period under consideration.
In order to do so, we need to consider the labour productivity of these firms in 2002 (since the entrants were not available in 1998) and compare the distributions of productivity for 2002. In this way, Figure B4 is not directly comparable to B3. Looking at Figure B4 we can observe a different pattern to that above, in that we see at the lower end of the cumulative distribution, continuing firms dominate; i.e. the productivity distribution of continuing firms is to the right of the entrants. However, we note that somewhere around 0.6 in the cumulative distribution (in the top 40/50% of firms), the two curve switch and entrants become the more dominant. That is, entrants at the higher end of the productivity distribution dominate continuing firms. This too is not an unexpected finding since we would expect entering firms to have a higher productivity on average, which might be dampened by the need for new firms to learn through participating in the market.
Figure B4: Cumulative distribution of logged labour productivity, Continuing firms versus entrants
This chart displays two cumulative distribution functions, 'lp_contin2' (solid line) and 'lp_entry' (dashed line), plotted against 'lp02' on the x-axis. At lower productivity levels, 'lp_contin2' is to the right of 'lp_entry'. Around a cumulative distribution of 0.6, the curves cross, with 'lp_entry' shifting to the right of 'lp_contin2' at higher productivity levels.
Table B11: Kolmogorov-Smirnov Test for equality in distributions of labour productivity
| LP98 |
D |
P-value |
Corrected |
| Continuing firms |
0.003 |
0.949 |
|
| Exiting firms |
-0.071 |
0.000 |
|
| Combined KS: |
0.071 |
0.000 |
0.000 |
| LP02 |
|
|
|
| Continuing firms |
0.033 |
|
|
| Entering firms |
-0.441 |
0.000 |
|
| Combined KS: |
0.441 |
0.000 |
0.000 |
Source: Based on ARD data for 1998 and 2002, authors' calculations
All firms are included in the analysis above, however Figure B5 focuses on those that have 10 or more employees. We note that the same trends are observable, but if anything with respect to entry, it is the case that the switch takes place further up the distribution spread - around 70%, indicating that a smaller proportion of the new entrants have productivity levels higher than continuing firms, compared to when all firms are included in the analysis.
Figure B5: labour productivity 1998 and 2002, over 10 employees only.
(a) Labour productivity 1998: continuers versus exits
This chart shows two cumulative distribution functions, 'lp_contin' (solid line) and 'lp_exit' (dashed line), plotted against 'lp98' on the x-axis. The 'lp_contin' curve generally lies to the right of 'lp_exit', indicating higher labour productivity for continuing firms compared to exiting firms in 1998, for firms with over 10 employees.
(b) Labour productivity 2002: continuers versus entry
This chart displays two cumulative distribution functions, 'lp_contin2' (solid line) and 'lp_entry' (dashed line), plotted against 'lp02' on the x-axis. Similar to Figure B4, at lower productivity levels, 'lp_contin2' is to the right of 'lp_entry'. The curves cross around a cumulative distribution of 0.7, with 'lp_entry' shifting to the right of 'lp_contin2' at higher productivity levels.
In the latter half of the period (2003-2007) we are able to consider the role of lagged entry on the distribution of productivity by separately identifying firms that were new entrants in the earlier period (1998-2002). This is presented in Figure B6. It is interesting to note that for this latter period, the dominance of continuing firms over that of exiting firms is not as clear cut from the graphical representation. Indeed, at the upper end of the distribution, it appears as though exiting firms lie to the right of the incumbent firms. In Figure B7 we see a similar trend in relation to entrants and labour productivity distribution for 2007, with a switch in dominance broadly apparent around 50%.
Figure B6: Labour productivity 2003: continuers versus exits
This chart displays two cumulative distribution functions, 'lp_contin' (solid line) and 'lp_exit' (dashed line), plotted against 'lp03' on the x-axis. The curves are very close throughout most of the distribution, crossing at higher productivity levels, suggesting less clear dominance between continuing and exiting firms in 2003.
Figure B7: Labour productivity 2007: continuers versus entry
This chart displays two cumulative distribution functions, 'lp_contin2' (solid line) and 'lp_entry' (dashed line), plotted against 'lp07' on the x-axis. The curves are very close, crossing around a cumulative distribution of 0.5, indicating a mixed picture of productivity dominance between continuing and entering firms in 2007.
Table B12: Kolmogorov-Smirnov Test for equality in distributions of labour productivity
| LP03 |
D |
P-value |
Corrected |
| Continuers |
0.038 |
0.004 |
|
| Exits |
-0.012 |
0.598 |
|
| Combined KS: |
0.038 |
0.007 |
0.000 |
| LP07 |
|
|
|
| Continuers |
0.047 |
0.000 |
|
| Entrants |
-0.041 |
0.000 |
|
| Combined KS: |
0.047 |
0.000 |
0.000 |
With a restricted HGF definition (excluding small firms from the HGF definition) we see that that labour productivity prior to HGF incidence reveals the HGFs to be more productive, with this gap widening as we move up the productivity distribution. Whilst there appears to be clear dominance in the latter measure of labour productivity (Figure B9), following the high growth period, the distance between HGF and non-HGFs is small and relatively uniform over the distribution.
Figure B8: LP03: HGF versus non-HGF
This chart displays two cumulative distribution functions, 'lp_nonhgf' (dashed line) and 'lp_hgf' (solid line), plotted against 'lp03' on the x-axis. The 'lp_hgf' curve generally lies to the right of 'lp_nonhgf', indicating higher productivity for HGFs in 2003.
Figure B9: Cumulative distribution of logged labour productivity 2007, HGFs and Non HGFs
This chart displays two cumulative distribution functions, 'lp_nonhgf2' (dashed line) and 'lp_hgf2' (solid line), plotted against 'lp07' on the x-axis. The two curves are very close, indicating minimal difference in productivity distributions between HGFs and non-HGFs in 2007.
Table B13: Kolmogorov-Smirnov Test for equality in the logged labour productivity distribution function between HGFs and non HGFs, 2003 and 2007.
| LP03 |
D |
P-value |
Corrected |
| Non HGF |
0.188 |
0.000 |
|
| HGF |
-0.001 |
0.995 |
|
| Combined KS: |
0.188 |
0.000 |
0.000 |
| LP07 |
|
|
|
| Non HGF |
0.060 |
|
|
| HGF |
0.000 |
1.000 |
|
| Combined KS: |
0.060 |
0.000 |
0.000 |
Table B13 also leads to the rejection of the null. The differences observed in the charts are supported by the statistical test.
In this subsection we have presented the distributions of the measure of labour productivity for firms that enter, exit and continue within the dataset and also those that might be classified as high growth firms. In contrast to regression analysis that looks at the mean position, by using all the moments in the labour productivity distributions we observe the following: We see that in general, entrants are more productive than continuing firms at the upper end of the distribution but we find some evidence that for the bottom half of the distribution at least, continuing firms are more productive. Our consideration of exiting firms presents a more mixed picture over time, since the clear dominance of incumbents in the earlier period (1998-2002) is not so obvious in the latter part of the period of analysis (2003-2007). When we consider the productivity distribution of those that are classified as HGF (only including those with 10+ employees).
From this we can infer that HGFs appear to have a higher productivity than non-HGFs, not simply at the mean, as would be demonstrated in regression analysis (See section4.2 for parametric evidence) but throughout their productivity distributions but that this is apparent before the HGF incidence. This appears to be consistent over time.
The results presented here do not allow for differences across sectors. Thus, there is the potential for HGFs to be concentrated in more productive sectors and therefore, they may not always lie to the right of the non-HGF frequency distributions in the way they do at the aggregate. Sample size limitations prevent too much disaggregation, but this does suggest caution in placing too much emphasis on these findings of superior performance to HGFs, and this is supported by the weaker post-growth findings in both periods. Nonetheless, the findings are indicative of HGFs being more productive at the aggregate and for entrants to be less productive at the lower end of the distribution.
B.4 Labour productivity growth
The dynamic decomposition offers a useful way of describing the contributions that different groups of firms make to changes in labour productivity but table B14 illustrates the magnitudes of labour productivity growth over the period (separately for 1998-02 and 2003-07 and the full period 1998-2007). This is the change we aim to explain through the decomposition. We note that the average annual labour productivity growth for the early period is around 1.6%, whereas this increases to around 4.4% by the latter half of the period (2003-2007). We see considerable sectoral variation in productivity growth and it is clear from Table B14 that there are a number of sector-specific stories underlying the trends in labour productivity growth.
Table B14: Labour productivity levels and annual growth, 1998-2002, 2003-2007 by sector
| Industry |
wavg_lp_02 |
wavg_lp_98 |
avg annual lpgr98-02 |
wavg_lp_07 |
wavg_lp_03 |
avg annual lpgr03-07 |
| Mining and quarrying, Electricity, gas and water supply |
228.3 |
207.59 |
0.024 |
233.8 |
214.5 |
0.022 |
| Manufacture of food, beverages and tobacco |
57.3 |
40.78 |
0.085 |
53.9 |
48.0 |
0.029 |
| Manufacture of textile and leather products |
23.3 |
19.67 |
0.042 |
37.4 |
32.4 |
0.036 |
| Manufacture of wood products |
32.7 |
30.28 |
0.020 |
39.1 |
32.9 |
0.043 |
| Manufacture of pulp, paper and printing |
47.7 |
47.59 |
0.001 |
51.1 |
50.1 |
0.005 |
| Manufacture of chemicals |
83.1 |
83.27 |
-0.001 |
91.3 |
70.9 |
0.063 |
| Manufacture of rubber |
36.0 |
33.95 |
0.015 |
44.0 |
34.8 |
0.059 |
| Manufacture of non-metallic minerals |
42.6 |
35.34 |
0.047 |
56.9 |
40.8 |
0.083 |
| Manufacture of basic metals and fabricated metal products |
36.7 |
33.55 |
0.023 |
48.0 |
36.3 |
0.070 |
| Manufacture of machinery and equipment NEC |
37.6 |
68.81 |
-0.151 |
56.2 |
39.2 |
0.090 |
| Manufacture of electrical and optical equipment |
52.7 |
33.46 |
0.113 |
52.6 |
45.8 |
0.034 |
| Manufacture of transport equipment |
41.7 |
43.64 |
-0.011 |
67.4 |
43.8 |
0.108 |
| Manufacturing NEC |
30.5 |
29.17 |
0.011 |
39.9 |
31.3 |
0.061 |
| Construction |
49.2 |
50.54 |
-0.007 |
58.5 |
51.3 |
0.033 |
| Sale, maintenance and repair of motor vehicles |
64.9 |
39.64 |
0.123 |
56.6 |
56.8 |
-0.001 |
| Wholesale trade |
45.5 |
44.22 |
0.007 |
56.4 |
42.5 |
0.071 |
| Retail trade |
18.9 |
18.33 |
0.008 |
20.5 |
17.6 |
0.037 |
| Hotels and restaurants |
17.4 |
19.09 |
-0.023 |
21.7 |
17.7 |
0.050 |
| Transport and storage |
46.2 |
46.24 |
0.000 |
55.9 |
50.5 |
0.026 |
| Post and telecommunications |
80.6 |
70.35 |
0.034 |
78.3 |
47.9 |
0.123 |
| Real estate |
68.5 |
76.46 |
-0.027 |
64.0 |
51.4 |
0.055 |
| Renting of machinery and equipment |
104.5 |
79.05 |
0.070 |
81.7 |
71.0 |
0.035 |
| Computing and related activities |
78.8 |
75.82 |
0.010 |
82.5 |
72.3 |
0.033 |
| R&D and other business services |
33.9 |
30.79 |
0.024 |
40.8 |
34.4 |
0.042 |
| Total |
42.5 |
39.85 |
0.016 |
48.7 |
40.8 |
0.044 |
Source: ARD and BSD, authors' calculations
Appendix C: Static decompositions 1998-2007, detailed sector-level estimates
Table C1: Static Olley and Pakes decompositions 1998-2007 for manufacturing sectors (bottom-up aggregation), firms with ten or more employees
| Sectors |
Average Productivity (weighted) |
Average Productivity (unweighted) |
Allocative Efficiency |
N |
| 1998-2000 |
|
|
|
|
| Total Economy |
3.215 |
2.978 |
0.237 |
78027 |
| Manufacturing |
3.574 |
3.388 |
0.186 |
28533 |
| Manufacture of food, beverages and tobacco (DA) |
3.474 |
3.2 |
0.274 |
2799 |
| Manufacture of textiles and textile products (DB) |
2.791 |
2.706 |
0.085 |
2157 |
| Manufacture of leather products (DC) |
2.878 |
2.7 |
0.179 |
252 |
| Manufacture of wood products (DD) |
3.234 |
3.18 |
0.054 |
720 |
| Manufacture of pulp, paper and printing (DE) |
3.663 |
3.53 |
0.133 |
3530 |
| Manufacture of coke, refined petroleum products and nuclear fuel (DF) |
4.339 |
4.225 |
0.114 |
93 |
| Manufacture of chemicals (DG) |
4.016 |
3.767 |
0.248 |
1811 |
| Manufacture of rubber and plastics (DH) |
3.407 |
3.273 |
0.134 |
1847 |
| Manufacture of non-metallic minerals (DI) |
3.392 |
3.298 |
0.094 |
1219 |
| Manufacture of basic metals and fabricated metal products (DJ) |
3.348 |
3.258 |
0.089 |
4493 |
| Manufacture of machinery and equipment NEC (DK) |
3.302 |
3.281 |
0.021 |
2989 |
| Manufacture of electrical and optical equipment (DL) |
3.351 |
3.171 |
0.18 |
3325 |
| Manufacture of transport equipment (DM) |
3.626 |
3.388 |
0.237 |
1589 |
| Manufacturing NEC (DN) |
3.232 |
3.159 |
0.073 |
1709 |
| 2001-2003 |
|
|
|
|
| Total Economy |
3.214 |
3.028 |
0.186 |
82299 |
| Manufacturing |
3.527 |
3.388 |
0.139 |
27664 |
| Manufacture of food, beverages and tobacco (DA) |
3.547 |
3.293 |
0.253 |
2734 |
| Manufacture of textiles and textile products (DB) |
2.938 |
2.859 |
0.079 |
1865 |
| Manufacture of leather products (DC) |
2.89 |
2.872 |
0.018 |
205 |
| Manufacture of wood products (DD) |
3.349 |
3.286 |
0.063 |
705 |
| Manufacture of pulp, paper and printing (DE) |
3.748 |
3.57 |
0.178 |
3357 |
| Manufacture of coke, refined petroleum products and nuclear fuel (DF) |
3.363 |
4.083 |
-0.719 |
76 |
| Manufacture of chemicals (DG) |
4.101 |
3.808 |
0.293 |
1681 |
| Manufacture of rubber and plastics (DH) |
3.408 |
3.296 |
0.113 |
1792 |
| Manufacture of non-metallic minerals (DI) |
3.576 |
3.344 |
0.232 |
1166 |
| Manufacture of basic metals and fabricated metal products (DJ) |
3.421 |
3.346 |
0.076 |
4533 |
| Manufacture of machinery and equipment NEC (DK) |
3.431 |
3.353 |
0.078 |
2894 |
| Manufacture of electrical and optical equipment (DL) |
3.383 |
3.285 |
0.098 |
3191 |
| Manufacture of transport equipment (DM) |
3.516 |
3.408 |
0.108 |
1618 |
| Manufacturing NEC (DN) |
3.252 |
3.227 |
0.026 |
1847 |
| 2004-2007 |
|
|
|
|
| Total Economy |
3.314 |
3.153 |
0.161 |
94345 |
| Manufacturing |
3.682 |
3.512 |
0.17 |
31341 |
| Manufacture of food, beverages and tobacco (DA) |
3.596 |
3.367 |
0.229 |
3090 |
| Manufacture of textiles and textile products (DB) |
3.189 |
3.082 |
0.106 |
2036 |
| Manufacture of leather products (DC) |
3.174 |
3.145 |
0.029 |
218 |
| Manufacture of wood products (DD) |
3.435 |
3.391 |
0.044 |
894 |
| Manufacture of pulp, paper and printing (DE) |
3.759 |
3.633 |
0.126 |
3654 |
| Manufacture of coke, refined petroleum products and nuclear fuel (DF) |
5.117 |
4.38 |
0.737 |
90 |
| Manufacture of chemicals (DG) |
4.064 |
3.808 |
0.255 |
1936 |
| Manufacture of rubber and plastics (DH) |
3.487 |
3.405 |
0.083 |
2063 |
| Manufacture of non-metallic minerals (DI) |
3.734 |
3.423 |
0.311 |
1289 |
| Manufacture of basic metals and fabricated metal products (DJ) |
3.59 |
3.5 |
0.09 |
5082 |
| Manufacture of machinery and equipment NEC (DK) |
3.646 |
3.555 |
0.091 |
3329 |
| Manufacture of electrical and optical equipment (DL) |
3.655 |
3.509 |
0.146 |
3631 |
| Manufacture of transport equipment (DM) |
3.793 |
3.569 |
0.223 |
1905 |
| Manufacturing NEC (DN) |
3.408 |
3.321 |
0.087 |
2124 |
Source: ARD, authors' calculations (firms with ten or more employees; employment weights; bottom-up aggregation).
Table C2: Static Olley and Pakes decompositions 1998-2007 for service sectors (bottom-up aggregation), firms with ten or more employees
| Sectors |
Average Productivity (weighted) |
Average Productivity (unweighted) |
Allocative Efficiency |
N |
| 1998-2000 |
|
|
|
|
| Total Economy |
3.215 |
2.978 |
0.237 |
78027 |
| Services |
3.026 |
2.744 |
0.282 |
43691 |
| sale maintenance and repair of motor vehicles, retail sale of fuel |
3.229 |
3.08 |
0.149 |
3904 |
| wholesale and commission trade except motor vehicles |
3.343 |
3.3 |
0.043 |
10187 |
| retail trade except of motor vehicles |
2.759 |
2.229 |
0.53 |
6696 |
| hotels and restaurants |
2.675 |
2.176 |
0.499 |
4352 |
| land transport |
3.384 |
3.245 |
0.138 |
1930 |
| water transport |
3.854 |
3.577 |
0.277 |
173 |
| air transport |
4.158 |
3.978 |
0.181 |
168 |
| other supporting transport activities |
3.545 |
3.447 |
0.098 |
1777 |
| post and telecommunications |
3.799 |
3.398 |
0.401 |
405 |
| real estate |
3.442 |
3.486 |
-0.044 |
1402 |
| renting of machinery and equipment |
3.719 |
3.628 |
0.091 |
820 |
| computing and related activities |
4.068 |
3.728 |
0.341 |
1387 |
| R&D |
3.439 |
3.384 |
0.056 |
298 |
| other business services |
2.754 |
2.734 |
0.02 |
10192 |
Footnotes
| Sectors |
Average Productivity (weighted) |
Average Productivity (unweighted) |
Allocative Efficiency |
N |
| 2001-2003 |
|
|
|
|
| Total Economy |
3.214 |
3.028 |
0.186 |
82299 |
| Services |
3.055 |
2.856 |
0.2 |
48109 |
| sale maintenance and repair of motor vehicles, retail sale of fuel |
3.315 |
3.227 |
0.088 |
4089 |
| wholesale and commission trade except motor vehicles |
3.35 |
3.368 |
-0.017 |
10526 |
| retail trade except of motor vehicles |
2.748 |
2.413 |
0.335 |
7251 |
| hotels and restaurants |
2.65 |
2.285 |
0.365 |
5182 |
| land transport |
3.328 |
3.342 |
-0.014 |
2263 |
| water transport |
4.099 |
3.862 |
0.237 |
183 |
| air transport |
4.088 |
4.111 |
-0.024 |
148 |
| other supporting transport activities |
3.51 |
3.486 |
0.024 |
1998 |
| post and telecommunications |
3.743 |
3.319 |
0.424 |
594 |
| real estate |
3.434 |
3.444 |
-0.01 |
1627 |
| renting of machinery and equipment |
3.829 |
3.719 |
0.111 |
944 |
| computing and related activities |
4.026 |
3.733 |
0.293 |
1619 |
| R&D |
3.522 |
3.46 |
0.062 |
304 |
| other business services |
2.888 |
2.836 |
0.052 |
11381 |
| 2004-2007 |
|
|
|
|
| Total Economy |
3.314 |
3.153 |
0.161 |
94345 |
| Services |
3.167 |
3.001 |
0.167 |
56005 |
| sale maintenance and repair of motor vehicles, retail sale of fuel |
3.485 |
3.325 |
0.16 |
4317 |
| wholesale and commission trade except motor vehicles |
3.542 |
3.576 |
-0.035 |
13234 |
| retail trade except of motor vehicles |
2.806 |
2.573 |
0.233 |
8333 |
| hotels and restaurants |
2.73 |
2.371 |
0.359 |
5068 |
| land transport |
3.347 |
3.424 |
-0.076 |
2338 |
| water transport |
4.249 |
3.978 |
0.271 |
243 |
| air transport |
4.275 |
4.256 |
0.018 |
172 |
| other supporting transport activities |
3.795 |
3.627 |
0.168 |
2416 |
| post and telecommunications |
3.825 |
3.51 |
0.316 |
733 |
| real estate |
3.455 |
3.488 |
-0.034 |
2130 |
| renting of machinery and equipment |
3.796 |
3.809 |
-0.013 |
1128 |
| computing and related activities |
4.204 |
3.919 |
0.285 |
2135 |
| R&D |
4.031 |
3.63 |
0.401 |
438 |
| other business services |
3.035 |
2.973 |
0.062 |
13320 |
Source: ARD, authors' calculations (firms with ten or more employees; employment weights; bottom-up aggregation).
Table C3: Static Olley and Pakes decompositions 1998-2007 for other production sectors (bottom-up aggregation), firms with ten or more employees
| Sectors |
Average Productivity (weighted) |
Average Productivity (unweighted) |
Allocative Efficiency |
N |
| 1998-2000 |
|
|
|
|
| Total Economy |
3.215 |
2.978 |
0.237 |
78027 |
| Other Production |
3.968 |
3.918 |
0.05 |
5803 |
| Mining and Quarrying |
4.631 |
4.332 |
0.299 |
1462 |
| Electricity, gas and Water supply |
4.899 |
4.973 |
-0.074 |
307 |
| Construction |
3.565 |
3.431 |
0.134 |
42431 |
| 2001-2003 |
|
|
|
|
| Total Economy |
3.214 |
3.028 |
0.186 |
82299 |
| Other Production |
3.952 |
3.739 |
0.212 |
6526 |
| Mining and Quarrying |
4.696 |
4.403 |
0.293 |
1330 |
| Electricity, gas and Water supply |
5.008 |
4.67 |
0.338 |
370 |
| Construction |
3.656 |
3.478 |
0.178 |
51329 |
| 2004-2007 |
|
|
|
|
| Total Economy |
3.314 |
3.153 |
0.161 |
94345 |
| Other Production |
4.001 |
3.951 |
0.05 |
6999 |
| Mining and Quarrying |
4.582 |
4.444 |
0.138 |
1536 |
| Electricity, gas and Water supply |
4.773 |
4.952 |
-0.179 |
435 |
| Construction |
3.704 |
3.603 |
0.1 |
70802 |
Source: ARD, authors' calculations (firms with ten or more employees; employment weights; bottom-up aggregation).
Table C4: Static Olley and Pakes decompositions 1998-2007 for manufacturing sectors (top-down aggregation), firms with ten or more employees
| Sectors |
Average Productivity (weighted) |
Average Productivity (unweighted) |
Allocative Efficiency |
N |
| 1998-2000 |
|
|
|
|
| Total Economy |
3.215 |
3.149 |
0.066 |
78027 |
| Manufacturing |
3.466 |
3.266 |
0.200 |
28533 |
| Manufacture of food, beverages and tobacco (DA) |
3.474 |
3.220 |
0.255 |
2799 |
| Manufacture of textiles and textile products (DB) |
2.794 |
2.736 |
0.058 |
2157 |
| Manufacture of leather products (DC) |
2.874 |
2.695 |
0.179 |
252 |
| Manufacture of wood products (DD) |
3.239 |
3.183 |
0.057 |
720 |
| Manufacture of pulp, paper and printing (DE) |
3.663 |
3.483 |
0.180 |
3530 |
| Manufacture of coke, refined petroleum products and nuclear fuel (DF) |
4.297 |
4.201 |
0.095 |
93 |
| Manufacture of chemicals (DG) |
4.016 |
3.785 |
0.231 |
1811 |
| Manufacture of rubber and plastics (DH) |
3.407 |
3.281 |
0.126 |
1847 |
| Manufacture of non-metallic minerals (DI) |
3.398 |
3.320 |
0.078 |
1219 |
| Manufacture of basic metals and fabricated metal products (DJ) |
3.348 |
3.244 |
0.103 |
4493 |
| Manufacture of machinery and equipment NEC (DK) |
3.302 |
3.287 |
0.015 |
2989 |
| Manufacture of electrical and optical equipment (DL) |
3.353 |
3.162 |
0.190 |
3325 |
| Manufacture of transport equipment (DM) |
3.629 |
3.390 |
0.239 |
1589 |
| Manufacturing NEC (DN) |
3.231 |
3.138 |
0.094 |
1709 |
| 2001-2003 |
|
|
|
|
| Total Economy |
3.214 |
3.221 |
-0.007 |
82299 |
| Manufacturing |
3.529 |
3.343 |
0.186 |
27664 |
| Manufacture of food, beverages and tobacco (DA) |
3.549 |
3.313 |
0.236 |
2734 |
| Manufacture of textiles and textile products (DB) |
2.950 |
2.863 |
0.087 |
1865 |
| Manufacture of leather products (DC) |
2.916 |
2.884 |
0.033 |
205 |
| Manufacture of wood products (DD) |
3.348 |
3.285 |
0.063 |
705 |
| Manufacture of pulp, paper and printing (DE) |
3.751 |
3.517 |
0.233 |
3357 |
| Manufacture of coke, refined petroleum products and nuclear fuel (DF) |
3.349 |
4.080 |
-0.731 |
76 |
| Manufacture of chemicals (DG) |
4.099 |
3.842 |
0.257 |
1681 |
| Manufacture of rubber and plastics (DH) |
3.408 |
3.300 |
0.108 |
1792 |
| Manufacture of non-metallic minerals (DI) |
3.579 |
3.352 |
0.227 |
1166 |
| Manufacture of basic metals and fabricated metal products (DJ) |
3.424 |
3.334 |
0.090 |
4533 |
| Manufacture of machinery and equipment NEC (DK) |
3.434 |
3.355 |
0.079 |
2894 |
| Manufacture of electrical and optical equipment (DL) |
3.386 |
3.285 |
0.101 |
3191 |
| Manufacture of transport equipment (DM) |
3.516 |
3.397 |
0.119 |
1618 |
| Manufacturing NEC (DN) |
3.254 |
3.235 |
0.019 |
1847 |
| 2004-2007 |
|
|
|
|
| Manufacturing |
3.682 |
3.471 |
0.211 |
31341 |
| Manufacture of food, beverages and tobacco (DA) |
3.594 |
3.383 |
0.212 |
3090 |
| Manufacture of textiles and textile products (DB) |
3.19 |
3.074 |
0.116 |
2036 |
| Manufacture of leather products (DC) |
3.185 |
3.148 |
0.037 |
218 |
| Manufacture of wood products (DD) |
3.436 |
3.393 |
0.043 |
894 |
| Manufacture of pulp, paper and printing (DE) |
3.756 |
3.543 |
0.212 |
3654 |
| Manufacture of coke, refined petroleum products and nuclear fuel (DF) |
5.115 |
4.382 |
0.734 |
90 |
| Manufacture of chemicals (DG) |
4.052 |
3.821 |
0.231 |
1936 |
| Manufacture of rubber and plastics (DH) |
3.49 |
3.406 |
0.084 |
2063 |
| Manufacture of non-metallic minerals (DI) |
3.731 |
3.436 |
0.295 |
1289 |
| Manufacture of basic metals and fabricated metal products (DJ) |
3.593 |
3.481 |
0.112 |
5082 |
| Manufacture of machinery and equipment NEC (DK) |
3.648 |
3.563 |
0.085 |
3329 |
| Manufacture of electrical and optical equipment (DL) |
3.657 |
3.512 |
0.145 |
3631 |
| Manufacture of transport equipment (DM) |
3.787 |
3.549 |
0.239 |
1905 |
| Manufacturing NEC (DN) |
3.408 |
3.336 |
0.073 |
2124 |
Source: ARD, authors' calculations (firms with ten or more employees; employment weights; top-down aggregation).
Table C5: Static Olley and Pakes decompositions 1998-2007 for service sectors (top-down aggregation), firms with ten or more employees
| Sectors |
Average Productivity (weighted) |
Average Productivity (unweighted) |
Allocative Efficiency |
N |
| 1998-2000 |
|
|
|
|
| Total Economy |
3.215 |
3.149 |
0.066 |
78027 |
| Services |
3.026 |
3.015 |
0.010 |
43691 |
| sale maintenance and repair of motor vehicles, retail sale of fuel |
3.228 |
3.044 |
0.184 |
3904 |
| wholesale and commission trade except motor vehicles |
3.342 |
3.296 |
0.046 |
10187 |
| retail trade except of motor vehicles |
2.762 |
2.377 |
0.385 |
6696 |
| hotels and restaurants |
2.675 |
2.244 |
0.431 |
4352 |
| land transport |
3.383 |
3.216 |
0.167 |
1930 |
| water transport |
3.843 |
3.589 |
0.254 |
173 |
| air transport |
4.162 |
3.974 |
0.187 |
168 |
| other supporting transport activities |
3.553 |
3.447 |
0.105 |
1777 |
| post and telecommunications |
3.910 |
3.367 |
0.543 |
405 |
| real estate |
3.445 |
3.547 |
-0.101 |
1402 |
| renting of machinery and equipment |
3.726 |
3.659 |
0.068 |
820 |
| computing and related activities |
4.068 |
3.784 |
0.284 |
1387 |
| R&D |
3.459 |
3.388 |
0.072 |
298 |
| other business services |
2.752 |
3.079 |
-0.327 |
10192 |
| 2001-2003 |
|
|
|
|
| Total Economy |
3.214 |
3.221 |
-0.007 |
82299 |
| Services |
3.056 |
3.100 |
-0.044 |
48109 |
| sale maintenance and repair of motor vehicles, retail sale of fuel |
3.313 |
3.202 |
0.111 |
4089 |
| wholesale and commission trade except motor vehicles |
3.350 |
3.369 |
-0.018 |
10526 |
| retail trade except of motor vehicles |
2.749 |
2.611 |
0.139 |
7251 |
| hotels and restaurants |
2.649 |
2.337 |
0.312 |
5182 |
| land transport |
3.331 |
3.284 |
0.047 |
2263 |
| water transport |
4.099 |
3.863 |
0.236 |
183 |
| air transport |
4.097 |
4.106 |
-0.009 |
148 |
| other supporting transport activities |
3.513 |
3.474 |
0.039 |
1998 |
| post and telecommunications |
3.824 |
3.382 |
0.443 |
594 |
| real estate |
3.437 |
3.503 |
-0.066 |
1627 |
| renting of machinery and equipment |
3.829 |
3.729 |
0.100 |
944 |
| computing and related activities |
4.023 |
3.752 |
0.271 |
1619 |
| R&D |
3.505 |
3.461 |
0.044 |
304 |
| other business services |
2.888 |
3.118 |
-0.230 |
11381 |
| 2004-2007 |
|
|
|
|
| Total Economy |
3.316 |
3.368 |
-0.053 |
94345 |
| Services |
3.169 |
3.268 |
-0.099 |
56005 |
| sale maintenance and repair of motor vehicles, retail sale of fuel |
3.486 |
3.282 |
0.204 |
4317 |
| wholesale and commission trade except motor vehicles |
3.544 |
3.578 |
-0.034 |
13234 |
| retail trade except of motor vehicles |
2.811 |
2.769 |
0.041 |
8333 |
| hotels and restaurants |
2.729 |
2.434 |
0.295 |
5068 |
| land transport |
3.348 |
3.337 |
0.011 |
2338 |
| water transport |
4.225 |
3.962 |
0.263 |
243 |
| air transport |
4.276 |
4.261 |
0.014 |
172 |
| other supporting transport activities |
3.791 |
3.612 |
0.179 |
2416 |
| post and telecommunications |
3.825 |
3.699 |
0.126 |
733 |
| real estate |
3.450 |
3.573 |
-0.123 |
2130 |
| renting of machinery and equipment |
3.795 |
3.823 |
-0.027 |
1128 |
| computing and related activities |
4.203 |
3.942 |
0.261 |
2135 |
| R&D |
4.027 |
3.635 |
0.392 |
438 |
| other business services |
3.038 |
3.239 |
-0.201 |
13320 |
Source: ARD, authors' calculations (firms with ten or more employees; employment weights; top-down aggregation).
Table C6: Static Olley and Pakes decompositions 1998-2007 for other production sectors (top-down aggregation), firms with ten or more employees
| Sectors |
Average Productivity (weighted) |
Average Productivity (unweighted) |
Allocative Efficiency |
N |
| 1998-2000 |
|
|
|
|
| Total Economy |
3.215 |
3.149 |
0.066 |
78027 |
| Other Production |
4.023 |
3.586 |
0.437 |
5803 |
| Mining and Quarrying |
4.627 |
4.334 |
0.293 |
664 |
| Electricity, gas and Water supply |
4.905 |
4.968 |
-0.063 |
200 |
| Construction |
3.564 |
3.429 |
0.134 |
4939 |
| 2001-2003 |
|
|
|
|
| Total Economy |
3.214 |
3.221 |
-0.007 |
82299 |
| Other Production |
3.952 |
3.598 |
0.354 |
6526 |
| Mining and Quarrying |
4.694 |
4.403 |
0.291 |
640 |
| Electricity, gas and Water supply |
5.006 |
4.658 |
0.348 |
189 |
| Construction |
3.657 |
3.472 |
0.185 |
5697 |
| 2004-2007 |
|
|
|
|
| Total Economy |
3.316 |
3.368 |
-0.053 |
94345 |
| Other Production |
4.000 |
3.713 |
0.286 |
6999 |
| Mining and Quarrying |
4.583 |
4.441 |
0.142 |
681 |
| Electricity, gas and Water supply |
4.835 |
4.830 |
0.004 |
203 |
| Construction |
3.705 |
3.593 |
0.112 |
6115 |
Source: ARD, authors' calculations (firms with ten or more employees; employment weights; top-down aggregation).
Appendix D: Dynamic decompositions, 1998-2007, detailed sector-level estimates
Table D1: Melitz and Polanec decomposition 1998-2007, employment weighted
| Industry |
Surviving Firms (As) |
Surviving Firms (Acove) |
Entering Firms |
Exiting Firms |
ΔΠ |
| Mining and Quarrying, Electricity, gas and water supply |
-0.02 |
-0.08 |
0.01 |
-0.09 |
-0.18 |
| Manufacture of food, beverages and tobacco |
0.01 |
-0.16 |
-0.01 |
0.12 |
-0.03 |
| Manufacture of textile and leather products |
0.20 |
0.22 |
0.00 |
0.05 |
0.46 |
| Manufacture of wood products |
-0.07 |
0.27 |
-0.01 |
-0.01 |
0.19 |
| Manufacture of pulp, paper and printing |
-0.04 |
0.13 |
-0.01 |
0.03 |
0.12 |
| Manufacture of chemicals |
-0.07 |
0.15 |
0.00 |
-0.01 |
0.07 |
| Manufacture of rubber |
0.07 |
0.10 |
0.00 |
0.03 |
0.20 |
| Manufacture of non-metallic minerals |
-0.01 |
0.45 |
0.00 |
-0.02 |
0.41 |
| Manufacture of basic metals and fabricated metal products |
0.08 |
0.14 |
0.00 |
0.03 |
0.25 |
| Manufacture of machinery and equipment NEC |
0.13 |
0.26 |
0.00 |
0.02 |
0.41 |
| Manufacture of electrical and optical equipment |
0.27 |
0.24 |
0.00 |
-0.02 |
0.49 |
| Manufacture of transport equipment |
0.19 |
0.35 |
-0.02 |
0.01 |
0.53 |
| Manufacturing NEC |
0.03 |
0.14 |
0.01 |
0.02 |
0.19 |
| Construction |
-0.22 |
0.32 |
0.00 |
0.09 |
0.19 |
| Sale, maintenance and repair of motor vehicles |
0.06 |
0.21 |
-0.01 |
0.05 |
0.32 |
| Wholesale trade |
-0.02 |
0.40 |
0.00 |
-0.01 |
0.36 |
| Retail trade |
-0.02 |
0.12 |
0.00 |
0.03 |
0.13 |
| Hotels and restaurants |
0.11 |
-0.05 |
-0.02 |
-0.01 |
0.02 |
| Transport and storage |
-0.01 |
0.07 |
0.00 |
0.04 |
0.11 |
| Post and telecommunication |
0.19 |
0.22 |
0.01 |
-0.04 |
0.38 |
| Real estate |
-0.12 |
0.20 |
-0.07 |
0.06 |
0.08 |
| Renting of machinery and equipment |
0.06 |
0.15 |
0.00 |
0.00 |
0.20 |
| Computing and related activities |
-0.13 |
0.42 |
-0.04 |
0.06 |
0.30 |
| R&D and other business services |
0.04 |
0.25 |
-0.02 |
0.09 |
0.36 |
| TOTAL ECONOMY |
0.01 |
0.14 |
-0.01 |
0.02 |
0.16 |
Table D2: Melitz and Polanec decomposition 1998-2002, employment weighted
| Industry |
Surviving Firms (Δίπ) |
Surviving Firms (Acove) |
Entering Firms |
Exiting Firms |
ΔΠ |
| Mining and Quarrying, Electricity, gas and water supply |
0.16 |
-0.18 |
0.00 |
0.00 |
-0.02 |
| Manufacture of food, beverages and tobacco |
-0.06 |
0.12 |
-0.01 |
0.03 |
0.08 |
| Manufacture of textile and leather products |
0.04 |
0.07 |
0.00 |
0.02 |
0.12 |
| Manufacture of wood products |
-0.01 |
0.15 |
0.00 |
-0.01 |
0.12 |
| Manufacture of pulp, paper and printing |
-0.06 |
0.06 |
0.00 |
0.01 |
0.01 |
| Manufacture of chemicals |
0.00 |
0.04 |
-0.01 |
0.01 |
0.03 |
| Manufacture of rubber |
-0.03 |
0.02 |
0.00 |
0.02 |
0.01 |
| Manufacture of non-metallic minerals |
-0.05 |
0.17 |
0.00 |
0.00 |
0.11 |
| Manufacture of basic metals and fabricated metal products |
0.03 |
0.10 |
0.00 |
0.01 |
0.13 |
| Manufacture of machinery and equipment NEC |
-0.06 |
-0.01 |
0.00 |
0.02 |
-0.05 |
| Manufacture of electrical and optical equipment |
0.10 |
0.03 |
0.00 |
0.01 |
0.14 |
| Manufacture of transport equipment |
-0.04 |
-0.05 |
0.03 |
-0.01 |
-0.08 |
| Manufacturing NEC |
-0.02 |
0.00 |
0.00 |
0.00 |
-0.02 |
| Construction |
-0.25 |
0.19 |
-0.01 |
0.10 |
0.03 |
| Sale, maintenance and repair of motor vehicles |
-0.02 |
0.12 |
0.00 |
-0.01 |
0.10 |
| Wholesale trade |
-0.12 |
0.23 |
0.00 |
0.00 |
0.10 |
| Retail trade |
-0.11 |
0.05 |
0.00 |
0.02 |
-0.04 |
| Hotels and restaurants |
-0.03 |
-0.05 |
-0.01 |
-0.02 |
-0.11 |
| Transport and storage |
-0.03 |
0.01 |
0.00 |
0.01 |
-0.01 |
| Post and telecommunication |
0.06 |
0.09 |
-0.03 |
0.02 |
0.14 |
| Real estate |
-0.14 |
0.08 |
-0.15 |
0.06 |
-0.15 |
| Renting of machinery and equipment |
0.01 |
0.25 |
0.00 |
-0.01 |
0.25 |
| Computing and related activities |
-0.14 |
0.26 |
-0.01 |
0.00 |
0.11 |
| R&D and other business services |
-0.05 |
0.17 |
0.00 |
0.05 |
0.18 |
| TOTAL ECONOMY |
-0.07 |
0.07 |
0.00 |
0.02 |
0.01 |
Table D3: Melitz and Polanec decomposition 2003-2007, employment weighted
| Industry |
Surviving Firms (Δίπ) |
Surviving Firms (Acove) |
Entering Firms |
Exiting Firms |
ΔΠ |
| Mining and Quarrying, Electricity, gas and water supply |
-0.14 |
-0.08 |
0.00 |
0.11 |
-0.11 |
| Manufacture of food, beverages and tobacco |
0.04 |
-0.02 |
0.00 |
0.00 |
0.03 |
| Manufacture of textile and leather products |
0.06 |
0.13 |
0.00 |
0.02 |
0.20 |
| Manufacture of wood products |
-0.02 |
0.12 |
0.00 |
0.00 |
0.10 |
| Manufacture of pulp, paper and printing |
-0.05 |
0.02 |
0.00 |
-0.02 |
-0.04 |
| Manufacture of chemicals |
-0.11 |
0.15 |
0.03 |
0.02 |
0.06 |
| Manufacture of rubber |
0.06 |
0.08 |
0.00 |
0.01 |
0.15 |
| Manufacture of non-metallic minerals |
0.01 |
0.13 |
0.00 |
-0.05 |
0.10 |
| Manufacture of basic metals and fabricated metal products |
0.03 |
0.14 |
0.00 |
0.00 |
0.18 |
| Manufacture of machinery and equipment NEC |
0.10 |
0.06 |
0.00 |
0.00 |
0.17 |
| Manufacture of electrical and optical equipment |
0.12 |
0.10 |
0.01 |
0.00 |
0.23 |
| Manufacture of transport equipment |
0.10 |
0.19 |
0.00 |
0.00 |
0.28 |
| Manufacturing NEC |
-0.01 |
0.21 |
0.00 |
0.00 |
0.19 |
| Construction |
-0.02 |
0.04 |
0.00 |
0.00 |
0.02 |
| Sale, maintenance and repair of motor vehicles |
0.04 |
0.04 |
0.00 |
-0.01 |
0.07 |
| Wholesale trade |
0.12 |
0.05 |
0.00 |
0.01 |
0.19 |
| Retail trade |
0.00 |
0.13 |
0.00 |
0.01 |
0.15 |
| Hotels and restaurants |
-0.07 |
0.21 |
0.00 |
0.00 |
0.14 |
| Transport and storage |
0.00 |
0.20 |
0.00 |
0.00 |
0.20 |
| Post and telecommunication |
0.12 |
0.21 |
0.00 |
0.02 |
0.36 |
| Real estate |
-0.04 |
0.12 |
0.00 |
0.01 |
0.08 |
| Renting of machinery and equipment |
0.04 |
0.03 |
0.00 |
-0.03 |
0.04 |
| Computing and related activities |
0.02 |
0.12 |
-0.01 |
0.01 |
0.14 |
| R&D and other business services |
0.05 |
0.11 |
-0.01 |
-0.01 |
0.14 |
| TOTAL ECONOMY |
0.03 |
0.10 |
0.00 |
0.00 |
0.12 |
Table D4: Melitz and Polanec Decomposition with entry and exit above and below average labour productivity, 1998-2007
| Industry |
Surviving Firms (Above avg) |
Surviving Firms (Below avg) |
Entering Firms (Above avg) |
Entering Firms (Below avg) |
Exiting Firms (Above avg) |
Exiting Firms (Below avg) |
Total Change |
| Mining and Quarrying, Electricity, gas and water supply |
-0.02 |
-0.08 |
0.019 |
-0.008 |
-0.147 |
0.061 |
-0.18 |
| Manufacture of food, beverages and tobacco |
0.01 |
-0.16 |
0.006 |
-0.014 |
-0.028 |
0.152 |
-0.03 |
| Manufacture of textile and leather products |
0.20 |
0.22 |
0.008 |
-0.010 |
-0.023 |
0.069 |
0.46 |
| Manufacture of wood products |
-0.07 |
0.27 |
0.004 |
-0.009 |
-0.036 |
0.030 |
0.19 |
| Manufacture of pulp, paper and printing |
-0.04 |
0.13 |
0.005 |
-0.011 |
-0.048 |
0.081 |
0.12 |
| Manufacture of chemicals |
-0.07 |
0.15 |
0.019 |
-0.019 |
-0.049 |
0.040 |
0.07 |
| Manufacture of rubber |
0.07 |
0.10 |
0.007 |
-0.007 |
-0.035 |
0.066 |
0.20 |
| Manufacture of non-metallic minerals |
-0.01 |
0.45 |
0.008 |
-0.012 |
-0.066 |
0.045 |
0.41 |
| Manufacture of basic metals and fabricated metal products |
0.08 |
0.14 |
0.007 |
-0.008 |
-0.025 |
0.050 |
0.25 |
| Manufacture of machinery and equipment NEC |
0.13 |
0.26 |
0.007 |
-0.005 |
-0.023 |
0.046 |
0.41 |
| Manufacture of electrical and optical equipment |
0.27 |
0.24 |
0.012 |
-0.009 |
-0.070 |
0.048 |
0.49 |
| Manufacture of transport equipment |
0.19 |
0.35 |
0.007 |
-0.026 |
-0.019 |
0.033 |
0.53 |
| Manufacturing NEC |
0.03 |
0.14 |
0.020 |
-0.010 |
-0.024 |
0.041 |
0.19 |
| Construction |
-0.22 |
0.32 |
0.013 |
-0.015 |
-0.063 |
0.158 |
0.19 |
| Sale, maintenance and repair of motor vehicles |
0.06 |
0.21 |
0.008 |
-0.013 |
-0.040 |
0.095 |
0.32 |
| Wholesale trade |
-0.02 |
0.40 |
0.011 |
-0.015 |
-0.060 |
0.050 |
0.36 |
| Retail trade |
-0.02 |
0.12 |
0.003 |
-0.006 |
-0.016 |
0.044 |
0.13 |
| Hotels and restaurants |
0.11 |
-0.05 |
0.012 |
-0.030 |
-0.045 |
0.031 |
0.02 |
| Transport and storage |
-0.01 |
0.07 |
0.013 |
-0.009 |
-0.015 |
0.055 |
0.11 |
| Post and telecommunication |
0.19 |
0.22 |
0.009 |
-0.004 |
-0.055 |
0.011 |
0.38 |
| Real estate |
-0.12 |
0.20 |
0.024 |
-0.090 |
-0.052 |
0.113 |
0.08 |
| Renting of machinery and equipment |
0.06 |
0.15 |
0.012 |
-0.016 |
-0.060 |
0.060 |
0.20 |
| Computing and related activities |
-0.13 |
0.42 |
0.011 |
-0.055 |
-0.059 |
0.114 |
0.30 |
| R&D and other business services |
0.04 |
0.25 |
0.028 |
-0.050 |
-0.083 |
0.173 |
0.36 |
| TOTAL ECONOMY |
0.01 |
0.14 |
0.015 |
-0.023 |
-0.059 |
0.077 |
0.16 |
Table D5: Melitz and Polanec Decomposition with entry and exit above and below average labour productivity, 1998-2002
| Industry |
Surviving Firms (Δίπς) |
Surviving Firms (Acove) |
Entering Firms (Above avg) |
Entering Firms (Below avg) |
Exiting Firms (Above avg) |
Exiting Firms (Below avg) |
Total Change (Π) |
| Mining and Quarrying, Electricity, gas and water supply |
0.16 |
-0.18 |
0.012 |
-0.014 |
-0.019 |
0.019 |
-0.02 |
| Manufacture of food, beverages and tobacco |
-0.06 |
0.12 |
0.001 |
-0.009 |
-0.008 |
0.037 |
0.08 |
| Manufacture of textile and leather products |
0.04 |
0.07 |
0.006 |
-0.005 |
-0.007 |
0.026 |
0.12 |
| Manufacture of wood products |
-0.01 |
0.15 |
0.001 |
-0.005 |
-0.018 |
0.008 |
0.12 |
| Manufacture of pulp, paper and printing |
-0.06 |
0.06 |
0.002 |
-0.004 |
-0.029 |
0.040 |
0.01 |
| Manufacture of chemicals |
0.00 |
0.04 |
0.002 |
-0.012 |
-0.009 |
0.017 |
0.03 |
| Manufacture of rubber |
-0.03 |
0.02 |
0.005 |
-0.005 |
-0.018 |
0.036 |
0.01 |
| Manufacture of non-metallic minerals |
-0.05 |
0.17 |
0.002 |
-0.005 |
-0.016 |
0.013 |
0.11 |
| Manufacture of basic metals and fabricated metal products |
0.03 |
0.10 |
0.003 |
-0.007 |
-0.013 |
0.022 |
0.13 |
| Manufacture of machinery and equipment NEC |
-0.06 |
-0.01 |
0.002 |
-0.004 |
-0.006 |
0.023 |
-0.05 |
| Manufacture of electrical and optical equipment |
0.10 |
0.03 |
0.005 |
-0.007 |
-0.008 |
0.022 |
0.14 |
| Manufacture of transport equipment |
-0.04 |
-0.05 |
0.030 |
-0.003 |
-0.029 |
0.017 |
-0.08 |
| Manufacturing NEC |
-0.02 |
0.00 |
0.004 |
-0.004 |
-0.012 |
0.013 |
-0.02 |
| Construction |
-0.25 |
0.19 |
0.006 |
-0.016 |
-0.015 |
0.110 |
0.03 |
| Sale, maintenance and repair of motor vehicles |
-0.02 |
0.12 |
0.005 |
-0.007 |
-0.023 |
0.018 |
0.10 |
| Wholesale trade |
-0.12 |
0.23 |
0.005 |
-0.007 |
-0.027 |
0.023 |
0.10 |
| Retail trade |
-0.11 |
0.05 |
0.001 |
-0.002 |
-0.005 |
0.020 |
-0.04 |
| Hotels and restaurants |
-0.03 |
-0.05 |
0.003 |
-0.010 |
-0.033 |
0.016 |
-0.11 |
| Transport and storage |
-0.03 |
0.01 |
0.004 |
-0.004 |
-0.002 |
0.011 |
-0.01 |
| Post and telecommunication |
0.06 |
0.09 |
0.002 |
-0.028 |
-0.004 |
0.020 |
0.14 |
| Real estate |
-0.14 |
0.08 |
0.012 |
-0.160 |
-0.018 |
0.077 |
-0.15 |
| Renting of machinery and equipment |
0.01 |
0.25 |
0.004 |
-0.007 |
-0.029 |
0.016 |
0.25 |
| Computing and related activities |
-0.14 |
0.26 |
0.011 |
-0.024 |
-0.047 |
0.047 |
0.11 |
| R&D and other business services |
-0.05 |
0.17 |
0.027 |
-0.025 |
-0.029 |
0.083 |
0.18 |
| TOTAL ECONOMY |
-0.07 |
0.07 |
0.010 |
-0.012 |
-0.020 |
0.037 |
0.01 |
Table D6: Melitz and Polanec Decomposition with entry and exit above and below average labour productivity, 2003-2007
| Industry |
Acovc |
Above avg |
Below avg |
Above avg |
Below avg |
ΔΠ |
| Mining and Quarrying, Electricity, gas and water supply |
-0.14 |
-0.08 |
0.006 |
-0.005 |
-0.013 |
0.123 |
| Manufacture of food, beverages and tobacco |
0.04 |
-0.02 |
0.005 |
-0.006 |
-0.038 |
0.040 |
| Manufacture of textile and leather products |
0.06 |
0.13 |
0.002 |
-0.002 |
-0.003 |
0.020 |
| Manufacture of wood products |
-0.02 |
0.12 |
0.001 |
-0.002 |
-0.003 |
0.006 |
| Manufacture of pulp, paper and printing |
-0.05 |
0.02 |
0.001 |
-0.005 |
-0.024 |
0.009 |
| Manufacture of chemicals |
-0.11 |
0.15 |
0.002 |
-0.002 |
-0.014 |
0.033 |
| Manufacture of rubber |
0.06 |
0.08 |
0.000 |
-0.001 |
-0.007 |
0.020 |
| Manufacture of non-metallic minerals |
0.01 |
0.13 |
0.001 |
-0.003 |
-0.052 |
0.005 |
| Manufacture of basic metals and fabricated metal products |
0.03 |
0.14 |
0.001 |
-0.003 |
-0.007 |
0.007 |
| Manufacture of machinery and equipment NEC |
0.10 |
0.06 |
0.003 |
-0.003 |
-0.028 |
0.028 |
| Manufacture of electrical and optical equipment |
0.12 |
0.10 |
0.007 |
-0.001 |
-0.022 |
0.024 |
| Manufacture of transport equipment |
0.10 |
0.19 |
0.000 |
-0.002 |
-0.006 |
0.005 |
| Manufacturing NEC |
-0.01 |
0.21 |
0.006 |
-0.004 |
-0.003 |
0.004 |
| Construction |
-0.02 |
0.04 |
0.005 |
-0.004 |
-0.017 |
0.018 |
| Sale, maintenance and repair of motor vehicles |
0.04 |
0.04 |
0.002 |
-0.004 |
-0.022 |
0.016 |
| Wholesale trade |
0.12 |
0.05 |
0.003 |
-0.005 |
-0.016 |
0.031 |
| Retail trade |
0.00 |
0.13 |
0.001 |
-0.002 |
-0.004 |
0.016 |
| Hotels and restaurants |
-0.07 |
0.21 |
0.007 |
-0.011 |
-0.008 |
0.013 |
| Transport and storage |
0.00 |
0.20 |
0.002 |
-0.002 |
-0.015 |
0.013 |
| Post and telecommunication |
0.12 |
0.21 |
0.003 |
-0.001 |
-0.026 |
0.047 |
| Real estate |
-0.04 |
0.12 |
0.007 |
-0.011 |
-0.022 |
0.032 |
| Renting of machinery and equipment |
0.04 |
0.03 |
0.001 |
-0.002 |
-0.044 |
0.010 |
| Computing and related activities |
0.02 |
0.12 |
0.003 |
-0.009 |
-0.008 |
0.015 |
| R&D and other business services |
0.05 |
0.11 |
0.007 |
-0.017 |
-0.052 |
0.042 |
| TOTAL ECONOMY |
0.03 |
0.10 |
0.004 |
-0.008 |
-0.028 |
0.026 |
Table D7: FHK Decomposition by sector, 1998-2002 (employment weights)
| Industry |
within |
between |
cross |
entry |
exit |
CH Ip98-02 |
| Mining and quarrying, Electricity, gas and water supply |
0.12 |
-0.01 |
-0.14 |
0.00 |
0.00 |
-0.02 |
| Manufacture of food, beverages and tobacco |
0.16 |
0.05 |
-0.16 |
-0.01 |
-0.03 |
0.08 |
| Manufacture of textile and leather products |
0.11 |
0.11 |
-0.11 |
0.00 |
-0.02 |
0.12 |
| Manufacture of wood products |
0.13 |
0.08 |
-0.09 |
0.00 |
0.01 |
0.12 |
| Manufacture of pulp, paper and printing |
0.02 |
0.28 |
-0.29 |
0.00 |
-0.01 |
0.01 |
| Manufacture of chemicals |
0.10 |
0.05 |
-0.12 |
-0.01 |
-0.01 |
0.03 |
| Manufacture of rubber |
-0.01 |
0.06 |
-0.06 |
0.00 |
-0.02 |
0.01 |
| Manufacture of non-metallic minerals |
0.18 |
0.11 |
-0.18 |
0.00 |
0.00 |
0.11 |
| Manufacture of basic metals and fabricated metal products |
0.14 |
0.11 |
-0.12 |
0.00 |
-0.01 |
0.13 |
| Manufacture of machinery and equipment NEC |
-0.01 |
-0.07 |
0.02 |
0.00 |
-0.01 |
-0.05 |
| Manufacture of electrical and optical equipment |
0.09 |
0.12 |
-0.08 |
0.00 |
-0.01 |
0.14 |
| Manufacture of transport equipment |
-0.29 |
0.25 |
-0.05 |
0.02 |
0.01 |
-0.08 |
| Manufacturing NEC |
0.06 |
0.08 |
-0.17 |
0.00 |
0.00 |
-0.02 |
| Construction |
-0.03 |
0.26 |
-0.27 |
-0.01 |
-0.08 |
0.03 |
| Sale, maintenance and repair of motor vehicles |
0.13 |
-0.02 |
-0.01 |
0.00 |
0.00 |
0.10 |
| Wholesale trade |
0.08 |
0.16 |
-0.13 |
0.00 |
0.00 |
0.10 |
| Retail trade |
-0.07 |
0.11 |
-0.09 |
0.00 |
-0.01 |
-0.04 |
| Hotels and restaurants |
0.08 |
0.05 |
-0.21 |
-0.01 |
0.02 |
-0.11 |
| Transport and storage |
0.09 |
0.08 |
-0.20 |
0.00 |
-0.01 |
-0.01 |
| Post and telecommunications |
0.11 |
0.13 |
-0.09 |
-0.02 |
-0.02 |
0.14 |
| Real estate |
0.03 |
0.17 |
-0.25 |
-0.15 |
-0.05 |
-0.15 |
| Renting of machinery and equipment |
0.29 |
0.22 |
-0.25 |
0.00 |
0.01 |
0.25 |
| Computing and related activities |
0.08 |
0.05 |
-0.01 |
-0.01 |
0.00 |
0.11 |
| R&D and other business services |
0.28 |
0.19 |
-0.35 |
0.01 |
-0.05 |
0.18 |
| TOTAL ECONOMY |
0.07 |
0.10 |
-0.17 |
0.00 |
-0.02 |
0.01 |
Source: ARD & BSD, authors' calculations
Table D8: FHK Decomposition by sector, 2003-2007 (employment weights)
| Industry |
within |
between |
cross |
entry |
exit |
CH Ip03-07 |
| Mining and quarrying, Electricity, gas and water supply |
-0.21 |
0.18 |
-0.16 |
0.00 |
-0.09 |
-0.11 |
| Manufacture of food, beverages and tobacco |
0.11 |
-0.04 |
-0.04 |
0.00 |
0.00 |
0.03 |
| Manufacture of textile and leather products |
0.25 |
0.12 |
-0.19 |
0.00 |
-0.02 |
0.20 |
| Manufacture of wood products |
0.07 |
0.08 |
-0.05 |
0.00 |
0.00 |
0.10 |
| Manufacture of pulp, paper and printing |
-0.02 |
0.04 |
-0.05 |
0.00 |
0.01 |
-0.04 |
| Manufacture of chemicals |
0.03 |
0.08 |
-0.07 |
0.00 |
-0.02 |
0.06 |
| Manufacture of rubber |
0.16 |
0.06 |
-0.08 |
0.00 |
-0.01 |
0.15 |
| Manufacture of non-metallic minerals |
0.08 |
0.10 |
-0.03 |
0.00 |
0.04 |
0.10 |
| Manufacture of basic metals and fabricated metal products |
0.18 |
0.07 |
-0.07 |
0.00 |
0.00 |
0.18 |
| Manufacture of machinery and equipment NEC |
0.16 |
0.05 |
-0.04 |
0.00 |
0.00 |
0.17 |
| Manufacture of electrical and optical equipment |
0.20 |
0.08 |
-0.07 |
0.01 |
0.00 |
0.23 |
| Manufacture of transport equipment |
0.26 |
0.05 |
-0.04 |
0.00 |
0.00 |
0.28 |
| Manufacturing NEC |
0.13 |
0.13 |
-0.06 |
0.00 |
0.00 |
0.19 |
| Construction |
0.05 |
0.11 |
-0.15 |
0.00 |
0.00 |
0.02 |
| Sale, maintenance and repair of motor vehicles |
0.13 |
0.07 |
-0.12 |
0.00 |
0.01 |
0.07 |
| Wholesale trade |
0.20 |
0.07 |
-0.09 |
0.00 |
-0.01 |
0.19 |
| Retail trade |
0.08 |
0.19 |
-0.13 |
0.00 |
-0.01 |
0.15 |
| Hotels and restaurants |
0.15 |
0.12 |
-0.14 |
0.00 |
0.00 |
0.14 |
| Transport and storage |
0.18 |
0.08 |
-0.06 |
0.00 |
0.00 |
0.20 |
| Post and telecommunications |
0.26 |
0.02 |
0.06 |
0.00 |
-0.02 |
0.36 |
| Real estate |
0.03 |
0.12 |
-0.08 |
0.00 |
-0.01 |
0.08 |
| Renting of machinery and equipment |
0.07 |
0.07 |
-0.07 |
0.00 |
0.03 |
0.04 |
| Computing and related activities |
0.13 |
0.06 |
-0.05 |
0.00 |
-0.01 |
0.14 |
| R&D and other business services |
0.24 |
0.21 |
-0.30 |
-0.01 |
0.01 |
0.14 |
| TOTAL ECONOMY |
0.15 |
0.11 |
-0.13 |
0.00 |
0.00 |
0.12 |
Source: ARD & BSD, authors' calculations
Table D9: FHK Decomposition by sector, 1998-2007 (employment weights)
| Industry |
within |
between |
cross |
entry |
exit |
CH Ip98-07 |
| Mining and quarrying, Electricity, gas and water supply |
0.04 |
-0.05 |
-0.11 |
0.00 |
0.07 |
-0.18 |
| Manufacture of food, beverages and tobacco |
0.12 |
-0.13 |
-0.11 |
-0.01 |
-0.09 |
-0.03 |
| Manufacture of textile and leather products |
0.49 |
0.22 |
-0.30 |
0.02 |
-0.04 |
0.46 |
| Manufacture of wood products |
0.15 |
0.25 |
-0.21 |
0.00 |
0.01 |
0.19 |
| Manufacture of pulp, paper and printing |
0.08 |
0.28 |
-0.26 |
0.00 |
-0.02 |
0.12 |
| Manufacture of chemicals |
0.07 |
0.06 |
-0.06 |
0.00 |
0.01 |
0.07 |
| Manufacture of rubber |
0.17 |
0.11 |
-0.11 |
0.01 |
-0.03 |
0.20 |
| Manufacture of non-metallic minerals |
0.21 |
0.22 |
0.00 |
0.01 |
0.02 |
0.41 |
| Manufacture of basic metals and fabricated metal products |
0.22 |
0.11 |
-0.11 |
0.01 |
-0.02 |
0.25 |
| Manufacture of machinery and equipment NEC |
0.31 |
0.15 |
-0.08 |
0.01 |
-0.02 |
0.41 |
| Manufacture of electrical and optical equipment |
0.43 |
0.16 |
-0.10 |
0.02 |
0.02 |
0.49 |
| Manufacture of transport equipment |
0.37 |
0.23 |
-0.12 |
0.02 |
-0.01 |
0.53 |
| Manufacturing NEC |
0.17 |
0.08 |
-0.09 |
0.02 |
-0.01 |
0.19 |
| Construction |
0.05 |
0.30 |
-0.24 |
0.01 |
-0.06 |
0.19 |
| Sale, maintenance and repair of motor vehicles |
0.22 |
0.01 |
0.03 |
0.01 |
-0.04 |
0.32 |
| Wholesale trade |
0.32 |
0.20 |
-0.16 |
0.01 |
0.01 |
0.36 |
| Retail trade |
0.02 |
0.16 |
-0.08 |
0.00 |
-0.02 |
0.13 |
| Hotels and restaurants |
0.11 |
0.05 |
-0.11 |
-0.02 |
0.01 |
0.02 |
| Transport and storage |
0.16 |
0.14 |
-0.24 |
0.01 |
-0.04 |
0.11 |
| Post and telecommunications |
0.27 |
0.12 |
0.02 |
0.01 |
0.04 |
0.38 |
| Real estate |
0.12 |
0.11 |
-0.16 |
-0.04 |
-0.05 |
0.08 |
| Renting of machinery and equipment |
0.19 |
0.24 |
-0.22 |
0.00 |
0.00 |
0.20 |
| Computing and related activities |
0.18 |
0.12 |
-0.03 |
-0.01 |
-0.04 |
0.30 |
| R&D and other business services |
0.38 |
0.43 |
-0.53 |
0.01 |
-0.07 |
0.36 |
| TOTAL ECONOMY |
0.20 |
0.15 |
-0.20 |
0.00 |
-0.01 |
0.16 |
Source: ARD & BSD, authors' calculations
Appendix E: GVA and Employment Shares of Sectors over time:
This appendix contains the market shares of each sector included in the decompositions, over time. These are effectively the sum of firm level weights used in the Static Olley and Pakes decomposition and reveal each sector's importance to the total economy (subject to the usual exclusions when using the ARD). The tables, when compared, highlight the divergence between employment and value added, so for example, mining and energy industries have high capital intensity and therefore their GVA share is substantially larger than their employment share. By way of contrast, this position is reversed when considering some service sectors, such as retail, that are quite labour intensive. Market shares do change over time, though rarely dramatically. We note a decline in the majority of manufacturing sectors, particularly the traditional manufacturing sectors such as textiles. Note also the increase in high-tech services such as software, in terms of both employment and value added share.
Table E1: Sector shares of GVA (%) over time:
| Industry |
Description |
1998 |
1999 |
2000 |
2001 |
2002 |
2003 |
2004 |
2005 |
2006 |
2007 |
| 1014 |
Mining and Quarrying |
8.77 |
7.62 |
9.05 |
7.92 |
6.54 |
4.68 |
3.75 |
4.09 |
4.30 |
4.82 |
| 15.1 |
Production, processing and preserving of meat and meat products |
0.77 |
0.61 |
0.77 |
0.67 |
0.71 |
0.61 |
0.58 |
0.50 |
0.47 |
0.44 |
| 15.2-15.7, 16.0 |
Manufacture of fish, fruit, vegetables, dairy products & tobacco |
1.64 |
1.32 |
1.16 |
1.25 |
1.31 |
1.24 |
1.25 |
1.11 |
0.99 |
1.25 |
| 15.8 |
Manufacture of other foods |
1.48 |
1.25 |
1.62 |
1.48 |
1.55 |
1.44 |
1.32 |
1.30 |
1.20 |
1.54 |
| 15.9 |
Manufacture of beverages |
1.06 |
0.93 |
1.04 |
0.99 |
0.89 |
0.91 |
1.00 |
0.82 |
0.95 |
0.90 |
| 17.1-17.3 |
Textile preparation, weaving and finishing |
0.27 |
0.18 |
0.15 |
0.15 |
0.13 |
0.14 |
0.11 |
0.10 |
0.08 |
0.10 |
| 17.4 |
Manufacture of made up textiles |
0.10 |
0.10 |
0.08 |
0.11 |
0.07 |
0.09 |
0.11 |
0.09 |
0.08 |
0.08 |
| 17.5 |
Manufacture of other textiles |
0.16 |
0.17 |
0.16 |
0.14 |
0.12 |
0.12 |
0.11 |
0.11 |
0.12 |
0.12 |
| 17.6-17.7 |
Manufacture of knitted/crocheted fabrics and articles |
0.13 |
0.12 |
0.07 |
0.06 |
0.06 |
0.03 |
0.05 |
0.03 |
0.02 |
0.02 |
| 18 |
Manufacture of leather and other clothing |
0.26 |
0.25 |
0.17 |
0.18 |
0.13 |
0.20 |
0.13 |
0.12 |
0.10 |
0.08 |
| 19 |
Leather products |
0.11 |
0.10 |
0.06 |
0.06 |
0.06 |
0.05 |
0.04 |
0.04 |
0.04 |
0.03 |
| 20 |
Sawing, milling and manufacture of wood products |
0.27 |
0.26 |
0.21 |
0.20 |
0.26 |
0.24 |
0.27 |
0.27 |
0.25 |
0.26 |
| 21 |
Manufacture of paper products |
0.85 |
0.78 |
0.69 |
0.77 |
0.72 |
0.55 |
0.57 |
0.51 |
0.40 |
0.48 |
| 22.1 |
Publishing |
2.08 |
1.81 |
2.01 |
1.87 |
1.86 |
1.81 |
2.21 |
1.76 |
1.83 |
1.68 |
| 22.2 |
Printing |
0.83 |
0.74 |
0.63 |
0.65 |
0.65 |
0.69 |
0.64 |
0.58 |
0.53 |
0.53 |
| 22.3 |
Reproduction of recorded material |
0.13 |
0.13 |
0.15 |
0.06 |
0.05 |
0.05 |
0.07 |
0.03 |
0.03 |
0.03 |
| 23 |
Manufacture of coke, refined petroleum products and nuclear fuel |
0.91 |
1.31 |
0.39 |
0.27 |
0.25 |
2.79 |
1.27 |
1.18 |
1.49 |
1.04 |
| 24.1 |
Manufacture of basic chemicals |
0.98 |
1.10 |
1.26 |
1.23 |
1.43 |
1.35 |
1.40 |
0.79 |
0.89 |
1.09 |
| 24.2-24.5 and 24.7 |
Manufacture of paints, pesticides, pharmaceuticals and man-made fibres |
2.78 |
2.96 |
2.73 |
3.07 |
3.12 |
2.36 |
2.55 |
1.85 |
2.28 |
0.91 |
| 24.6 |
Manufacture of other chemical products |
0.66 |
0.42 |
0.43 |
0.53 |
0.48 |
0.46 |
0.52 |
0.37 |
0.36 |
0.28 |
| 25.1 |
Manufacture of rubber products |
0.48 |
0.36 |
0.31 |
0.20 |
0.21 |
0.21 |
0.20 |
0.22 |
0.20 |
0.18 |
| 25.2 |
Manufacture of plastic products |
1.18 |
1.03 |
0.91 |
0.97 |
0.89 |
0.90 |
0.85 |
0.74 |
0.85 |
0.74 |
| 26.1 |
Manufacture of glass and glass products |
0.25 |
0.26 |
0.23 |
0.26 |
0.20 |
0.22 |
0.26 |
0.23 |
0.18 |
0.20 |
| 26.2-26.5 |
Manufacture of ceramic goods, bricks and cement |
0.51 |
0.43 |
0.36 |
0.41 |
0.43 |
0.43 |
0.37 |
0.36 |
0.42 |
0.29 |
| 26.6 |
Manufacture of products of concrete, plaster and cement |
0.34 |
0.32 |
0.27 |
0.39 |
0.31 |
0.32 |
0.45 |
0.15 |
0.47 |
0.18 |
| 26.7-26.8 |
Manufacture of stone products and other non-metallic mineral products |
0.13 |
0.09 |
0.09 |
0.08 |
0.07 |
0.06 |
0.08 |
0.05 |
0.07 |
0.07 |
| 27.1-27.3 |
Manufacture of basic iron and steel and ferro-alloys including tubes and non-ECSC ferro alloys |
0.23 |
0.22 |
0.21 |
0.12 |
0.19 |
0.16 |
0.17 |
0.13 |
0.20 |
0.20 |
| 27.4 |
Manufacture of basic precious metals and other non ferrous metals |
0.27 |
0.33 |
0.29 |
0.31 |
0.24 |
0.23 |
0.23 |
0.22 |
0.24 |
0.26 |
| 27.5 |
Casting of metals |
0.23 |
0.19 |
0.18 |
0.17 |
0.13 |
0.12 |
0.11 |
0.11 |
0.10 |
0.08 |
| 28.1 |
Manufacture of structural metal products |
0.27 |
0.39 |
0.28 |
0.28 |
0.30 |
0.31 |
0.25 |
0.26 |
0.27 |
0.32 |
| 28.2-28.3 |
Manufacture of tanks and containers of metals and steam generators except central heating equipment |
0.21 |
0.21 |
0.18 |
0.17 |
0.15 |
0.18 |
0.11 |
0.17 |
0.22 |
0.17 |
| 28.4 |
Forging pressing stamping and roll forming of metal |
0.18 |
0.17 |
0.14 |
0.11 |
0.12 |
0.11 |
0.11 |
0.11 |
0.09 |
0.10 |
| 28.5 |
Treatment and coating of metals; general mechanical engineering |
0.26 |
0.23 |
0.20 |
0.23 |
0.21 |
0.19 |
0.20 |
0.21 |
0.22 |
0.21 |
| 28.6 |
Manufacture of cutlery, tools and general hardware |
0.15 |
0.14 |
0.15 |
0.25 |
0.28 |
0.12 |
0.10 |
0.11 |
0.11 |
0.09 |
| 28.7 |
Manufacture of other fabricated metal products |
0.35 |
0.30 |
0.31 |
0.30 |
0.28 |
0.31 |
0.33 |
0.29 |
0.24 |
0.25 |
| 29 |
Manufacture of machinery and equipment not elsewhere specified |
0.24 |
0.19 |
0.20 |
0.21 |
0.19 |
0.28 |
0.30 |
0.17 |
0.19 |
0.13 |
| 29.1 |
Manufacture of machinery for the production and use of mechanical power except aircraft, vehicle and cycle engines |
0.59 |
0.50 |
0.53 |
0.54 |
0.48 |
0.49 |
0.54 |
0.53 |
0.45 |
0.40 |
| 29.2 |
Manufacture of other general purpose machinery |
0.57 |
0.56 |
0.53 |
0.56 |
0.46 |
0.51 |
0.51 |
0.41 |
0.47 |
0.46 |
| 29.3-29.4 and 29.6 |
Manufacture of agriculture machine tools & weapons and ammunition |
0.45 |
0.30 |
0.41 |
0.32 |
0.34 |
0.35 |
0.33 |
0.38 |
0.46 |
0.38 |
| 29.5 |
Manufacture of other special purpose machinery |
0.40 |
0.28 |
0.23 |
0.35 |
0.27 |
0.40 |
0.27 |
0.30 |
0.31 |
0.33 |
| 30 |
Manufacture of office machinery and computers |
0.43 |
0.45 |
0.32 |
0.34 |
0.11 |
0.60 |
0.25 |
0.20 |
0.26 |
0.17 |
| 31 |
Manufacture of electric motors, electricity distribution apparatus and insulated wire and cables |
0.89 |
0.77 |
0.93 |
0.79 |
0.67 |
0.78 |
0.70 |
0.66 |
0.89 |
0.76 |
| 32.1 |
Manufacture of electronic valves and tubes and other electronic components |
0.35 |
0.32 |
0.54 |
0.22 |
0.19 |
0.17 |
0.20 |
0.18 |
0.17 |
0.23 |
| 32.2-32.3 |
Manufacture of TV and radio equipment |
1.13 |
1.05 |
1.11 |
0.34 |
0.48 |
0.50 |
0.40 |
0.24 |
0.39 |
0.44 |
| 33.1 |
Manufacture of medical and surgical equipment |
0.14 |
0.16 |
0.19 |
0.26 |
0.20 |
0.17 |
0.18 |
0.27 |
0.20 |
0.19 |
| 33.2 |
Manufacture of instruments and appliances for measuring |
0.54 |
0.37 |
0.56 |
0.65 |
0.68 |
0.72 |
0.62 |
0.59 |
0.45 |
0.47 |
| 33.3-33.5 |
Manufacture of industrial and optical equipment, watches and clocks |
0.18 |
0.15 |
0.18 |
0.17 |
0.14 |
0.13 |
0.11 |
0.13 |
0.11 |
0.15 |
| 34.1-34.2 |
Manufacture of motor vehicles and bodies for motor vehicles |
2.23 |
1.73 |
1.20 |
1.59 |
1.62 |
1.53 |
1.68 |
1.83 |
1.60 |
2.12 |
| 34.3 |
Manufacture of parts and accessories for motor vehicles and their engines |
0.76 |
0.66 |
0.61 |
0.62 |
0.61 |
0.68 |
0.65 |
0.57 |
0.51 |
0.49 |
| 35 |
Manufacture of transport equipment (not motor vehicles) |
1.16 |
2.43 |
1.89 |
1.31 |
1.14 |
1.09 |
1.02 |
1.06 |
1.14 |
1.89 |
| 36.1 |
Manufacture of furniture |
0.49 |
0.54 |
0.58 |
0.53 |
0.54 |
0.48 |
0.45 |
0.44 |
0.41 |
0.49 |
| 36.2-36.5 |
Manufacture of jewellery, musical instruments, sports goods, toys and games |
0.11 |
0.07 |
0.08 |
0.09 |
0.10 |
0.10 |
0.09 |
0.11 |
0.07 |
0.08 |
| 36.6 |
Miscellaneous manufacturing NEC |
0.12 |
0.10 |
0.09 |
0.07 |
0.08 |
0.07 |
0.08 |
0.08 |
0.10 |
0.08 |
| 37 |
Recycling |
0.04 |
0.04 |
0.04 |
0.07 |
0.07 |
0.09 |
0.18 |
0.13 |
0.14 |
0.17 |
| 40 and 41 |
Gas, Electricity and water |
6.34 |
6.24 |
5.32 |
3.35 |
2.98 |
2.64 |
3.28 |
3.97 |
3.49 |
3.68 |
| 45.1 |
Site preparation |
0.13 |
0.09 |
0.07 |
0.10 |
0.07 |
0.08 |
0.07 |
0.10 |
0.10 |
0.09 |
| 45.2 |
Building of complete constructions or parts thereof; civil engineering |
3.48 |
3.17 |
3.08 |
3.39 |
3.78 |
3.74 |
3.26 |
3.49 |
3.00 |
3.17 |
| 45.3 |
Building installation |
0.69 |
1.11 |
0.85 |
0.86 |
0.79 |
0.80 |
0.82 |
0.92 |
0.89 |
0.84 |
| 45.4 |
Building completion |
0.23 |
0.24 |
0.32 |
0.34 |
0.28 |
0.32 |
0.28 |
0.30 |
0.25 |
0.27 |
| 45.5 |
Renting of construction or demolition equipment with operator |
0.08 |
0.09 |
0.07 |
0.09 |
0.06 |
0.09 |
0.07 |
0.08 |
0.06 |
0.06 |
| 50.1 |
Sales of motor vehicles |
1.67 |
1.77 |
1.62 |
2.11 |
2.25 |
2.80 |
2.47 |
1.86 |
2.05 |
2.18 |
| 50.2 |
Maintenance and repair of motor vehicles |
0.17 |
0.19 |
0.18 |
0.20 |
0.22 |
0.21 |
0.26 |
0.26 |
0.22 |
0.28 |
| 50.3 |
Sale of motor vehicle parts and accessories |
0.38 |
0.35 |
0.21 |
0.20 |
0.21 |
0.33 |
0.35 |
0.31 |
0.33 |
0.38 |
| 50.4 |
Sale, maintenance and repair of motorcycles and related parts and accessories |
0.02 |
0.02 |
0.02 |
0.02 |
0.03 |
0.03 |
0.03 |
0.01 |
0.01 |
0.02 |
| 50.5 |
Retail sale of automotive fuel |
0.43 |
0.04 |
0.26 |
0.06 |
0.17 |
0.18 |
0.18 |
0.02 |
0.34 |
0.48 |
| 51.1 |
Wholesale on a fee or contract basis |
0.12 |
0.16 |
0.24 |
0.36 |
0.23 |
0.27 |
0.28 |
0.33 |
0.38 |
0.34 |
| 51.2 |
Wholesale of agricultural raw materials and live animals |
0.07 |
0.10 |
0.05 |
0.04 |
0.04 |
0.07 |
0.07 |
0.05 |
0.08 |
0.12 |
| 51.3 |
Wholesale of food beverages and tobacco |
0.84 |
0.99 |
0.51 |
0.85 |
1.08 |
0.94 |
1.13 |
0.82 |
1.10 |
0.76 |
| 51.4 |
Wholesale of household goods |
1.26 |
1.58 |
1.47 |
1.35 |
1.53 |
1.75 |
1.59 |
1.66 |
1.81 |
2.06 |
| 51.5 |
Wholesale of machinery and equipment |
1.27 |
1.59 |
1.01 |
1.28 |
1.47 |
1.50 |
1.57 |
2.02 |
1.42 |
1.85 |
| 51.6 |
Wholesale of machinery, equipment and supplies |
1.78 |
2.08 |
1.44 |
1.74 |
1.35 |
1.38 |
1.46 |
1.77 |
1.95 |
1.49 |
| 51.7 |
Other wholesale |
0.37 |
0.27 |
0.31 |
0.30 |
0.22 |
0.25 |
0.25 |
0.54 |
0.38 |
0.30 |
| 52.1 |
Retail sale in non-specialist stores |
5.02 |
4.78 |
5.05 |
4.97 |
5.74 |
4.27 |
5.49 |
5.69 |
2.86 |
4.47 |
| 52.2 |
Retail sale of food, beverages and tobacco in specialised stores |
0.13 |
0.18 |
0.14 |
0.14 |
0.25 |
0.17 |
0.14 |
0.15 |
0.08 |
0.11 |
| 52.3 |
Retail sale of pharmaceutical and medical goods, cosmetic and toilet articles |
0.19 |
0.21 |
0.20 |
0.21 |
0.25 |
0.27 |
0.38 |
0.41 |
0.51 |
0.50 |
| 52.4 |
Other retail sale of new goods in specialised stores |
2.41 |
3.25 |
3.41 |
3.70 |
4.10 |
3.89 |
4.06 |
4.18 |
4.51 |
4.09 |
| 52.5 |
Retail sale of second-hand goods in stores |
0.03 |
0.02 |
0.02 |
0.02 |
0.03 |
0.03 |
0.03 |
0.02 |
0.02 |
0.01 |
| 52.6 |
Retail sale not in stores |
0.48 |
0.36 |
0.36 |
0.30 |
0.35 |
0.30 |
0.34 |
0.22 |
0.42 |
0.49 |
| 52.7 |
Repair of personal and household goods |
0.06 |
0.02 |
0.05 |
0.04 |
0.03 |
0.02 |
0.03 |
0.03 |
0.03 |
0.02 |
| 55.1 |
Hotels |
0.95 |
0.81 |
0.93 |
0.83 |
0.79 |
0.90 |
0.72 |
0.67 |
0.87 |
0.87 |
| 55.2 |
Camping sites and other provision of short-stay accommodation |
0.21 |
0.11 |
0.12 |
0.14 |
0.18 |
0.23 |
0.21 |
0.23 |
0.23 |
0.15 |
| 55.3 |
Restaurants |
0.36 |
0.36 |
0.55 |
0.96 |
1.05 |
0.73 |
1.08 |
0.76 |
0.67 |
1.15 |
| 55.4 |
Bars |
1.59 |
1.44 |
1.33 |
1.13 |
1.40 |
1.19 |
1.19 |
1.30 |
1.37 |
1.01 |
| 55.5 |
Canteens and catering |
0.45 |
0.56 |
0.37 |
0.48 |
0.78 |
0.80 |
0.64 |
0.87 |
0.77 |
0.66 |
| 60.1 and 60.3 |
Transport via railways |
0.66 |
0.64 |
0.69 |
0.78 |
1.00 |
0.70 |
0.65 |
0.75 |
0.76 |
0.73 |
| 60.2 |
Other inland transport |
2.48 |
2.08 |
2.42 |
2.27 |
2.30 |
2.22 |
1.82 |
1.73 |
2.05 |
2.01 |
| 61 |
Sea transport |
0.45 |
0.36 |
0.35 |
0.44 |
0.36 |
0.37 |
0.38 |
0.48 |
0.31 |
0.36 |
| 62 |
Air transport |
1.52 |
1.80 |
2.20 |
1.70 |
1.92 |
2.04 |
1.96 |
1.77 |
1.79 |
1.60 |
| 63.1 |
Cargo handling and storage |
0.18 |
0.37 |
0.41 |
0.47 |
0.58 |
0.54 |
0.63 |
0.77 |
0.77 |
0.75 |
| 63.2 |
Other supporting transport activities |
1.19 |
1.66 |
1.34 |
1.48 |
1.63 |
1.61 |
2.15 |
2.11 |
3.30 |
2.97 |
| 63.3 |
Activities of travel agencies and tour operators; tourist assistance activities not elsewhere classified |
0.52 |
0.58 |
0.48 |
0.65 |
0.61 |
0.55 |
0.74 |
0.71 |
0.47 |
0.44 |
| 63.4 |
Activities of other transport agencies |
0.29 |
0.44 |
0.48 |
0.38 |
0.30 |
0.28 |
0.33 |
0.37 |
0.51 |
0.53 |
| 64.1 |
Postal and courier services |
0.30 |
0.28 |
1.86 |
2.26 |
0.46 |
2.20 |
2.13 |
2.14 |
2.20 |
1.95 |
| 64.2 |
Telecommunications |
5.01 |
4.75 |
4.92 |
5.71 |
6.14 |
4.58 |
4.92 |
5.75 |
5.62 |
5.75 |
| 70.1 |
Real Estate Activities |
0.11 |
0.32 |
0.70 |
0.26 |
0.28 |
0.15 |
0.25 |
0.09 |
0.15 |
0.10 |
| 70.2 |
Letting of own property |
1.21 |
1.11 |
1.07 |
1.15 |
1.06 |
1.24 |
1.25 |
1.05 |
1.27 |
1.29 |
| 70.3 |
Real estate activities on a fee or contract basis |
0.45 |
0.51 |
0.49 |
0.59 |
0.71 |
0.78 |
0.82 |
0.90 |
1.11 |
1.27 |
| 71.1 |
Renting of automobiles. |
0.45 |
0.68 |
0.55 |
0.95 |
0.67 |
0.64 |
0.51 |
0.50 |
0.51 |
0.63 |
| 71.2 and 71.4 |
Renting of other transport equipment and machinery |
0.42 |
0.40 |
0.46 |
0.50 |
0.45 |
0.52 |
0.43 |
0.44 |
0.42 |
0.37 |
| 71.3 |
Renting of other machinery and equipment |
0.39 |
0.43 |
0.49 |
0.49 |
0.51 |
0.39 |
0.51 |
0.54 |
0.70 |
0.66 |
| 72.1, 72.3, 72.4, 72.5 |
Data processing, hardware consultancy and maintenance and repair of office, accounting and computing machinery |
0.87 |
0.88 |
1.11 |
1.06 |
1.19 |
0.90 |
1.14 |
1.23 |
1.19 |
0.48 |
| 72.2 |
Software consultancy and supply |
1.50 |
1.72 |
1.48 |
1.75 |
2.06 |
3.15 |
3.47 |
2.57 |
2.54 |
2.66 |
| 72.6 |
Other computer related activities |
0.07 |
0.14 |
0.14 |
0.15 |
0.21 |
0.17 |
0.18 |
0.20 |
0.22 |
0.31 |
| 73 |
Research and Development |
0.47 |
0.46 |
0.60 |
0.74 |
0.90 |
0.51 |
0.87 |
1.21 |
0.74 |
0.74 |
| 74.1 |
Legal, accounting, book-keeping and auditing activities |
3.22 |
3.97 |
4.05 |
5.11 |
4.51 |
5.14 |
4.97 |
5.22 |
6.42 |
6.38 |
| 74.2 |
Architectural and engineering activities |
1.61 |
1.48 |
1.64 |
1.53 |
1.88 |
1.83 |
1.83 |
2.27 |
2.28 |
2.16 |
| 74.3 |
Technical testing analysis |
0.20 |
0.13 |
0.13 |
0.11 |
0.14 |
0.23 |
0.16 |
0.30 |
0.24 |
0.23 |
| 74.4 |
Advertising |
0.63 |
0.64 |
0.59 |
0.51 |
0.50 |
0.46 |
0.48 |
0.46 |
0.55 |
0.63 |
| 74.5 |
Labour recruitment and provision of personnel |
2.01 |
2.25 |
2.42 |
2.28 |
2.75 |
2.94 |
2.79 |
3.05 |
2.74 |
2.27 |
| 74.6 |
Investigation and security activities |
0.79 |
1.14 |
0.99 |
0.82 |
1.28 |
1.39 |
1.23 |
1.39 |
1.07 |
1.11 |
| 74.7 |
Industrial cleaning |
3.36 |
3.13 |
2.96 |
2.85 |
2.72 |
2.74 |
3.03 |
2.56 |
2.59 |
2.15 |
| 74.8 |
Miscellaneous business activities not elsewhere classified |
1.36 |
1.08 |
1.06 |
1.09 |
0.95 |
1.25 |
1.16 |
1.49 |
1.21 |
1.22 |
| TOTAL |
Number of enterprises |
44724 |
45572 |
45267 |
47883 |
45762 |
45115 |
43744 |
42573 |
34808 |
38115 |
Source: ARD, authors' calculations; *40 and 41 combined to ensure sample sizes comfortably meet disclosure checks
Table E2: Sector shares of employment (%) over time:
| Industry |
Description |
1998 |
1999 |
2000 |
2001 |
2002 |
2003 |
2004 |
2005 |
2006 |
2007 |
| 1014 |
Mining and Quarrying |
0.92 |
0.79 |
0.70 |
0.66 |
0.62 |
0.63 |
0.51 |
0.42 |
0.61 |
0.60 |
| 15.1 |
Production, processing and preserving of meat and meat products |
1.11 |
0.87 |
1.12 |
0.95 |
0.93 |
0.81 |
0.82 |
0.74 |
0.81 |
0.74 |
| 15.2-15.7, 16.0 |
Manufacture of fish, fruit, vegetables, dairy products & tobacco |
1.26 |
1.13 |
1.00 |
1.00 |
0.97 |
0.96 |
0.93 |
0.85 |
0.90 |
0.94 |
| 15.8 |
Manufacture of other foods |
1.73 |
1.43 |
1.53 |
1.42 |
1.40 |
1.21 |
1.09 |
1.05 |
1.03 |
1.35 |
| 15.9 |
Manufacture of beverages |
0.55 |
0.54 |
0.46 |
0.47 |
0.41 |
0.42 |
0.43 |
0.38 |
0.43 |
0.39 |
| 17.1-17.3 |
Textile preparation, weaving and finishing |
0.50 |
0.32 |
0.27 |
0.25 |
0.22 |
0.22 |
0.17 |
0.16 |
0.13 |
0.14 |
| 17.4 |
Manufacture of made up textiles |
0.20 |
0.20 |
0.15 |
0.19 |
0.12 |
0.14 |
0.15 |
0.13 |
0.12 |
0.12 |
| 17.5 |
Manufacture of other textiles |
0.23 |
0.24 |
0.23 |
0.23 |
0.17 |
0.15 |
0.14 |
0.12 |
0.15 |
0.15 |
| 17.6-17.7 |
Manufacture of knitted/crocheted fabrics and articles |
0.30 |
0.24 |
0.18 |
0.15 |
0.13 |
0.08 |
0.09 |
0.08 |
0.05 |
0.06 |
| 18 |
Manufacture of leather and other clothing |
0.64 |
0.70 |
0.44 |
0.37 |
0.26 |
0.25 |
0.17 |
0.15 |
0.14 |
0.12 |
| 19 |
Leather products |
0.22 |
0.18 |
0.14 |
0.12 |
0.10 |
0.07 |
0.06 |
0.05 |
0.05 |
0.05 |
| 20 |
Sawing, milling and manufacture of wood products |
0.37 |
0.33 |
0.26 |
0.26 |
0.29 |
0.30 |
0.33 |
0.30 |
0.32 |
0.30 |
| 21 |
Manufacture of paper products |
0.84 |
0.79 |
0.61 |
0.65 |
0.58 |
0.52 |
0.57 |
0.45 |
0.51 |
0.54 |
| 22.1 |
Publishing |
1.44 |
1.22 |
1.45 |
1.35 |
1.27 |
1.14 |
1.44 |
1.24 |
1.47 |
1.40 |
| 22.2 |
Printing |
0.80 |
0.70 |
0.63 |
0.65 |
0.62 |
0.65 |
0.59 |
0.54 |
0.54 |
0.54 |
| 22.3 |
Reproduction of recorded material |
0.07 |
0.07 |
0.07 |
0.06 |
0.05 |
0.04 |
0.04 |
0.03 |
0.04 |
0.02 |
| 23 |
Manufacture of coke, refined petroleum products and nuclear fuel |
0.41 |
0.38 |
0.33 |
0.29 |
0.25 |
0.35 |
0.33 |
0.15 |
0.15 |
0.13 |
| 24.1 |
Manufacture of basic chemicals |
0.52 |
0.67 |
0.76 |
0.69 |
0.64 |
0.65 |
0.63 |
0.52 |
0.56 |
0.53 |
| 24.2-24.5 and 24.7 |
Manufacture of paints, pesticides, pharmaceuticals and man-made fibres |
1.62 |
1.61 |
1.47 |
1.37 |
1.37 |
1.32 |
1.19 |
1.04 |
1.13 |
0.87 |
| 24.6 |
Manufacture of other chemical products |
0.36 |
0.28 |
0.27 |
0.33 |
0.30 |
0.30 |
0.30 |
0.25 |
0.24 |
0.19 |
| 25.1 |
Manufacture of rubber products |
0.51 |
0.38 |
0.40 |
0.23 |
0.24 |
0.21 |
0.21 |
0.20 |
0.20 |
0.18 |
| 25.2 |
Manufacture of plastic products |
1.35 |
1.18 |
1.09 |
1.06 |
1.02 |
1.04 |
0.98 |
0.88 |
0.94 |
0.84 |
| 26.1 |
Manufacture of glass and glass products |
0.34 |
0.27 |
0.22 |
0.28 |
0.21 |
0.20 |
0.19 |
0.19 |
0.18 |
0.18 |
| 26.2-26.5 |
Manufacture of ceramic goods, bricks and cement |
0.61 |
0.54 |
0.42 |
0.46 |
0.43 |
0.41 |
0.37 |
0.35 |
0.41 |
0.29 |
| 26.6 |
Manufacture of products of concrete, plaster and cement |
0.27 |
0.25 |
0.22 |
0.25 |
0.20 |
0.24 |
0.25 |
0.13 |
0.26 |
0.15 |
| 26.7-26.8 |
Manufacture of stone products and other non-metallic mineral products |
0.15 |
0.11 |
0.10 |
0.09 |
0.08 |
0.06 |
0.07 |
0.05 |
0.07 |
0.07 |
| 27.1-27.3 |
Manufacture of basic iron and steel and ferro-alloys including tubes and non-ECSC ferro alloys |
0.32 |
0.25 |
0.26 |
0.14 |
0.18 |
0.20 |
0.14 |
0.15 |
0.17 |
0.15 |
| 27.4 |
Manufacture of basic precious metals and other non ferrous metals |
0.27 |
0.31 |
0.24 |
0.23 |
0.19 |
0.21 |
0.16 |
0.15 |
0.15 |
0.15 |
| 27.5 |
Casting of metals |
0.32 |
0.26 |
0.22 |
0.24 |
0.17 |
0.17 |
0.15 |
0.14 |
0.13 |
0.11 |
| 28.1 |
Manufacture of structural metal products |
0.31 |
0.42 |
0.38 |
0.32 |
0.28 |
0.28 |
0.29 |
0.28 |
0.27 |
0.29 |
| 28.2-28.3 |
Manufacture of tanks and containers of metals and steam generators except central heating equipment |
0.22 |
0.24 |
0.19 |
0.20 |
0.14 |
0.15 |
0.11 |
0.14 |
0.17 |
0.14 |
| 28.4 |
Forging pressing stamping and roll forming of metal |
0.23 |
0.24 |
0.21 |
0.18 |
0.15 |
0.13 |
0.15 |
0.15 |
0.13 |
0.12 |
| 28.5 |
Treatment and coating of metals; general mechanical engineering |
0.32 |
0.30 |
0.26 |
0.27 |
0.25 |
0.24 |
0.23 |
0.23 |
0.22 |
0.22 |
| 28.6 |
Manufacture of cutlery, tools and general hardware |
0.22 |
0.20 |
0.20 |
0.17 |
0.17 |
0.15 |
0.13 |
0.13 |
0.14 |
0.12 |
| 28.7 |
Manufacture of other fabricated metal products |
0.40 |
0.36 |
0.34 |
0.32 |
0.29 |
0.32 |
0.31 |
0.30 |
0.27 |
0.29 |
| 29 |
Manufacture of machinery and equipment not elsewhere specified |
0.34 |
0.30 |
0.31 |
0.30 |
0.23 |
0.32 |
0.31 |
0.26 |
0.24 |
0.21 |
| 29.1 |
Manufacture of machinery for the production and use of mechanical power except aircraft, vehicle and cycle engines |
0.72 |
0.61 |
0.65 |
0.61 |
0.49 |
0.51 |
0.49 |
0.46 |
0.41 |
0.35 |
| 29.2 |
Manufacture of other general purpose machinery |
0.76 |
0.70 |
0.67 |
0.67 |
0.52 |
0.58 |
0.52 |
0.45 |
0.49 |
0.47 |
| 29.3-29.4 and 29.6 |
Manufacture of agriculture machine tools & weapons and ammunition |
0.54 |
0.48 |
0.43 |
0.38 |
0.35 |
0.33 |
0.30 |
0.32 |
0.35 |
0.30 |
| 29.5 |
Manufacture of other special purpose machinery |
0.46 |
0.38 |
0.29 |
0.38 |
0.30 |
0.31 |
0.25 |
0.26 |
0.27 |
0.26 |
| 30 |
Manufacture of office machinery and computers |
0.52 |
0.49 |
0.40 |
0.44 |
0.33 |
0.25 |
0.22 |
0.19 |
0.24 |
0.19 |
| 31 |
Manufacture of electric motors, electricity distribution apparatus and insulated wire and cables |
1.52 |
1.27 |
1.24 |
1.05 |
0.92 |
1.04 |
0.82 |
0.82 |
0.80 |
0.78 |
| 32.1 |
Manufacture of electronic valves and tubes and other electronic components |
0.44 |
0.33 |
0.35 |
0.29 |
0.22 |
0.23 |
0.23 |
0.21 |
0.20 |
0.23 |
| 32.2-32.3 |
Manufacture of TV and radio equipment |
0.84 |
0.78 |
0.78 |
0.87 |
0.69 |
0.53 |
0.33 |
0.23 |
0.22 |
0.24 |
| 33.1 |
Manufacture of medical and surgical equipment |
0.15 |
0.15 |
0.16 |
0.18 |
0.15 |
0.17 |
0.16 |
0.18 |
0.18 |
0.16 |
| 33.2 |
Manufacture of instruments and appliances for measuring |
0.67 |
0.50 |
0.53 |
0.58 |
0.51 |
0.49 |
0.43 |
0.34 |
0.32 |
0.35 |
| 33.3-33.5 |
Manufacture of industrial and optical equipment, watches and clocks |
0.25 |
0.20 |
0.20 |
0.21 |
0.15 |
0.15 |
0.13 |
0.12 |
0.13 |
0.13 |
| 34.1-34.2 |
Manufacture of motor vehicles and bodies for motor vehicles |
1.87 |
1.58 |
1.43 |
1.42 |
1.29 |
1.31 |
1.10 |
1.14 |
1.22 |
1.07 |
| 34.3 |
Manufacture of parts and accessories for motor vehicles and their engines |
0.85 |
0.79 |
0.77 |
0.74 |
0.70 |
0.79 |
0.69 |
0.63 |
0.61 |
0.59 |
| 35 |
Manufacture of transport equipment (not motor vehicles) |
1.01 |
1.43 |
1.48 |
1.07 |
1.11 |
1.01 |
0.98 |
1.00 |
1.17 |
1.33 |
| 36.1 |
Manufacture of furniture |
0.68 |
0.75 |
0.81 |
0.77 |
0.73 |
0.68 |
0.66 |
0.59 |
0.57 |
0.68 |
| 36.2-36.5 |
Manufacture of jewellery, musical instruments, sports goods, toys and games |
0.15 |
0.11 |
0.11 |
0.12 |
0.12 |
0.11 |
0.11 |
0.11 |
0.10 |
0.10 |
| 36.6 |
Miscellaneous manufacturing NEC |
0.15 |
0.12 |
0.12 |
0.10 |
0.09 |
0.10 |
0.10 |
0.09 |
0.11 |
0.08 |
| 37 |
Recycling |
0.05 |
0.05 |
0.04 |
0.06 |
0.05 |
0.06 |
0.07 |
0.08 |
0.07 |
0.08 |
| 40 and 41* |
Gas, Electricity and water |
1.51 |
1.35 |
1.47 |
0.73 |
0.57 |
0.60 |
0.59 |
1.02 |
1.17 |
1.20 |
| 45.1 |
Site preparation |
0.10 |
0.07 |
0.09 |
0.08 |
0.06 |
0.08 |
0.07 |
0.06 |
0.07 |
0.08 |
| 45.2 |
Building of complete constructions or parts thereof; civil engineering |
2.87 |
2.57 |
2.52 |
2.46 |
2.73 |
2.51 |
2.40 |
2.36 |
2.27 |
2.23 |
| 45.3 |
Building installation |
0.63 |
0.98 |
0.85 |
0.82 |
0.78 |
0.83 |
0.83 |
0.86 |
0.93 |
0.89 |
| 45.4 |
Building completion |
0.24 |
0.26 |
0.31 |
0.36 |
0.35 |
0.43 |
0.40 |
0.37 |
0.32 |
0.34 |
| 45.5 |
Renting of construction or demolition equipment with operator |
0.06 |
0.07 |
0.07 |
0.09 |
0.06 |
0.06 |
0.05 |
0.07 |
0.05 |
0.05 |
| 50.1 |
Sales of motor vehicles |
1.38 |
1.34 |
1.52 |
1.44 |
1.40 |
1.61 |
1.64 |
1.78 |
1.57 |
1.53 |
| 50.2 |
Maintenance and repair of motor vehicles |
0.25 |
0.23 |
0.29 |
0.30 |
0.31 |
0.32 |
0.37 |
0.38 |
0.32 |
0.39 |
| 50.3 |
Sale of motor vehicle parts and accessories |
0.48 |
0.49 |
0.36 |
0.39 |
0.27 |
0.40 |
0.39 |
0.41 |
0.44 |
0.51 |
| 50.4 |
Sale, maintenance and repair of motorcycles and related parts and accessories |
0.02 |
0.02 |
0.03 |
0.02 |
0.02 |
0.02 |
0.02 |
0.02 |
0.02 |
0.02 |
| 50.5 |
Retail sale of automotive fuel |
0.27 |
0.07 |
0.12 |
0.09 |
0.28 |
0.23 |
0.16 |
0.10 |
0.18 |
0.22 |
| 51.1 |
Wholesale on a fee or contract basis |
0.13 |
0.17 |
0.19 |
0.20 |
0.21 |
0.23 |
0.18 |
0.28 |
0.32 |
0.32 |
| 51.2 |
Wholesale of agricultural raw materials and live animals |
0.11 |
0.11 |
0.09 |
0.07 |
0.10 |
0.09 |
0.09 |
0.08 |
0.12 |
0.12 |
| 51.3 |
Wholesale of food beverages and tobacco |
1.42 |
1.17 |
1.07 |
1.26 |
1.14 |
1.24 |
1.29 |
1.02 |
1.19 |
1.03 |
| 51.4 |
Wholesale of household goods |
1.26 |
1.46 |
1.34 |
1.45 |
1.33 |
1.48 |
1.52 |
1.36 |
1.50 |
1.62 |
| 51.5 |
Wholesale of machinery and equipment |
1.28 |
1.28 |
1.31 |
1.30 |
1.35 |
1.48 |
1.49 |
1.41 |
1.39 |
1.31 |
| 51.6 |
Wholesale of machinery, equipment and supplies |
1.44 |
1.55 |
1.28 |
1.38 |
1.19 |
1.35 |
1.36 |
1.38 |
1.45 |
1.29 |
| 51.7 |
Other wholesale |
0.38 |
0.29 |
0.30 |
0.28 |
0.26 |
0.30 |
0.29 |
0.28 |
0.30 |
0.29 |
| 52.1 |
Retail sale in non-specialist stores |
11.43 |
10.30 |
11.37 |
12.08 |
13.30 |
9.50 |
13.35 |
13.78 |
8.09 |
11.49 |
| 52.2 |
Retail sale of food, beverages and tobacco in specialised stores |
0.47 |
0.77 |
0.50 |
0.65 |
0.79 |
0.64 |
0.37 |
0.54 |
0.49 |
0.48 |
| 52.3 |
Retail sale of pharmaceutical and medical goods, cosmetic and toilet articles |
0.49 |
0.53 |
0.52 |
0.56 |
0.62 |
0.75 |
0.79 |
0.77 |
0.86 |
0.99 |
| 52.4 |
Other retail sale of new goods in specialised stores |
5.52 |
6.91 |
7.00 |
6.80 |
7.98 |
7.90 |
8.07 |
8.36 |
8.99 |
8.97 |
| 52.5 |
Retail sale of second-hand goods in stores |
0.04 |
0.08 |
0.04 |
0.05 |
0.05 |
0.06 |
0.06 |
0.04 |
0.07 |
0.06 |
| 52.6 |
Retail sale not in stores |
0.57 |
0.60 |
0.73 |
0.41 |
0.56 |
0.32 |
0.45 |
0.37 |
0.46 |
0.41 |
| 52.7 |
Repair of personal and household goods |
0.09 |
0.03 |
0.08 |
0.09 |
0.07 |
0.10 |
0.05 |
0.04 |
0.05 |
0.02 |
| 55.1 |
Hotels |
1.47 |
1.28 |
1.42 |
1.43 |
1.62 |
1.81 |
1.48 |
1.40 |
1.80 |
1.50 |
| 55.2 |
Camping sites and other provision of short-stay accommodation |
0.47 |
0.21 |
0.23 |
0.39 |
0.32 |
0.41 |
0.40 |
0.34 |
0.48 |
0.29 |
| 55.3 |
Restaurants |
0.96 |
1.12 |
1.61 |
2.50 |
2.66 |
2.08 |
2.92 |
2.07 |
1.97 |
3.13 |
| 55.4 |
Bars |
3.70 |
2.78 |
2.97 |
2.52 |
2.50 |
2.03 |
1.76 |
2.10 |
2.52 |
2.02 |
| 55.5 |
Canteens and catering |
1.53 |
2.05 |
1.40 |
1.62 |
2.31 |
2.35 |
1.78 |
2.44 |
2.51 |
2.22 |
| 60.1 and 60.3 |
Transport via railways |
0.60 |
0.58 |
0.51 |
0.49 |
0.47 |
0.55 |
0.64 |
0.66 |
0.66 |
0.67 |
| 60.2 |
Other inland transport |
3.02 |
2.70 |
3.24 |
3.12 |
3.18 |
3.25 |
2.60 |
2.68 |
3.18 |
2.84 |
| 61 |
Sea transport |
0.21 |
0.16 |
0.14 |
0.14 |
0.14 |
0.14 |
0.13 |
0.14 |
0.12 |
0.12 |
| 62 |
Air transport |
1.15 |
1.09 |
1.03 |
1.07 |
1.20 |
1.07 |
0.98 |
0.95 |
0.99 |
0.93 |
| 63.1 |
Cargo handling and storage |
0.22 |
0.49 |
0.51 |
0.65 |
0.72 |
0.63 |
0.68 |
0.86 |
0.97 |
0.92 |
| 63.2 |
Other supporting transport activities |
0.56 |
0.66 |
0.65 |
0.72 |
0.82 |
0.80 |
0.95 |
0.93 |
1.41 |
1.48 |
| 63.3 |
Activities of travel agencies and tour operators; tourist assistance activities not elsewhere classified |
0.55 |
0.79 |
0.71 |
0.90 |
0.78 |
0.64 |
0.68 |
0.62 |
0.71 |
0.58 |
| 63.4 |
Activities of other transport agencies |
0.28 |
0.36 |
0.40 |
0.38 |
0.40 |
0.41 |
0.31 |
0.37 |
0.45 |
0.32 |
| 64.1 |
Postal and courier services |
0.46 |
3.53 |
3.38 |
3.40 |
0.50 |
3.58 |
3.18 |
3.13 |
3.50 |
3.12 |
| 64.2 |
Telecommunications |
2.45 |
2.14 |
2.41 |
2.61 |
2.48 |
2.28 |
1.91 |
2.04 |
2.25 |
2.23 |
| 70.1 |
Real Estate Activities |
0.14 |
0.11 |
0.08 |
0.11 |
0.09 |
0.09 |
0.12 |
0.09 |
0.10 |
0.08 |
| 70.2 |
Letting of own property |
0.61 |
0.66 |
0.74 |
0.78 |
0.75 |
0.82 |
0.88 |
0.86 |
1.12 |
1.04 |
| 70.3 |
Real estate activities on a fee or contract basis |
0.56 |
0.52 |
0.56 |
0.56 |
0.76 |
0.88 |
0.90 |
0.92 |
1.18 |
1.22 |
| 71.1 |
Renting of automobiles. |
0.17 |
0.18 |
0.18 |
0.18 |
0.16 |
0.20 |
0.19 |
0.20 |
0.19 |
0.22 |
| 71.2 and 71.4 |
Renting of other transport equipment and machinery |
0.30 |
0.31 |
0.44 |
0.33 |
0.30 |
0.35 |
0.35 |
0.30 |
0.34 |
0.26 |
| 71.3 |
Renting of other machinery and equipment |
0.24 |
0.25 |
0.36 |
0.33 |
0.38 |
0.31 |
0.35 |
0.37 |
0.46 |
0.44 |
| 72.1, 72.3, 72.4, 72.5 |
Data processing, hardware consultancy and maintenance and repair of office, accounting and computing machinery |
0.51 |
0.56 |
0.64 |
0.64 |
0.73 |
0.61 |
0.66 |
0.64 |
0.70 |
0.35 |
| 72.2 |
Software consultancy and supply |
0.77 |
0.90 |
0.85 |
1.07 |
1.16 |
1.73 |
1.67 |
1.21 |
1.47 |
1.28 |
| 72.6 |
Other computer related activities |
0.06 |
0.10 |
0.11 |
0.11 |
0.12 |
0.12 |
0.11 |
0.10 |
0.11 |
0.15 |
| 73 |
Research and Development |
0.52 |
0.57 |
0.66 |
0.81 |
0.89 |
0.65 |
0.83 |
0.84 |
0.86 |
0.81 |
| 74.1 |
Legal, accounting, book-keeping and auditing activities |
2.36 |
2.77 |
2.80 |
3.12 |
3.17 |
3.69 |
3.42 |
3.62 |
3.81 |
3.80 |
| 74.2 |
Architectural and engineering activities |
1.26 |
1.06 |
1.09 |
1.17 |
1.17 |
1.23 |
1.19 |
1.28 |
1.35 |
1.38 |
| 74.3 |
Technical testing analysis |
0.21 |
0.17 |
0.16 |
0.17 |
0.15 |
0.18 |
0.12 |
0.18 |
0.24 |
0.21 |
| 74.4 |
Advertising |
0.44 |
0.43 |
0.51 |
0.51 |
0.41 |
0.40 |
0.39 |
0.35 |
0.42 |
0.36 |
| 74.5 |
Labour recruitment and provision of personnel |
4.35 |
4.39 |
4.16 |
3.87 |
5.26 |
5.55 |
5.10 |
6.11 |
5.87 |
5.60 |
| 74.6 |
Investigation and security activities |
0.79 |
1.14 |
0.99 |
0.82 |
1.28 |
1.39 |
1.23 |
1.39 |
1.07 |
1.11 |
| 74.7 |
Industrial cleaning |
3.36 |
3.13 |
2.96 |
2.85 |
2.72 |
2.74 |
3.03 |
2.56 |
2.59 |
2.15 |
| 74.8 |
Miscellaneous business activities not elsewhere classified |
1.36 |
1.08 |
1.06 |
1.09 |
0.95 |
1.25 |
1.16 |
1.49 |
1.21 |
1.22 |
| TOTAL |
Number of enterprises |
44724 |
45572 |
45267 |
47883 |
45762 |
45115 |
43744 |
42573 |
34808 |
38115 |
Source: ARD, authors' calculations; *41 and 42 combined to ensure sample sizes meet disclosure checks




