Executive summary
Nesta has previously published an in-depth look at the out-of-home (OOH) sector,
which looked at how eating out contributes to our diets, using data about
consumers from 2021. We have now conducted new analysis on Worldpanel by
Numerator 2024 out-of-home data to create an updated picture of the calories
purchased each day from food and non-alcoholic drinks in Great Britain (GB). We
analysed average calorie purchases across different population groups to build a
picture of what people are buying from the OOH sector.
Key findings
- Food and drink from the OOH sector accounted for around 15% of the
average person's daily energy purchased, based on our analysis of in-home
and out-of-home purchased calories data. The average OOH calories
purchased per person per day in 2024 was 390.
- One in five people purchased more than 490 calories a day from OOH; the
average amount purchased in that top 20% of OOH customers was nearly
900 calories a day, around 500 more per person per day than the average
adult.
- People in the lowest social grade occupation and unemployed (Grade E)
purchased, on average, around a third more calories per person per day
from OOH than higher and intermediate professional occupations social
grades (Grade AB).
- Over 20% of all OOH calories purchased per person per day came from
supermarkets and convenience stores. The largest share of total OOH calories
came from food-to-go, including meal deals, purchased from supermarkets
and cafes/bakeries.
- London and the South of England saw the lowest amount of calories
purchased in OOH per day in 2024. The Midlands and the North of England
purchased the greatest number of calories per person per day.
The OOH sector is a major part of the UK's food environment but to date has faced
less regulatory focus than other parts of the food environment, such as supermarkets.
Mandatory regulation is needed to improve the health of the products and meals
on offer, but must be supported by robust data to monitor and enforce progress. This
would help to level the playing field between OOH and retail, and also between
different parts of the OOH sector.
There is a range of routes available to improving health, from menu placements to
reformulating products and reducing portion sizes. Even small changes to the
number of calories purchased from the OOH sector could lead to important
improvements in obesity levels and health at the population level.
Background
The out-of-home sector is a dynamic and multifaceted sector, made up of larger
chain restaurants, independent cafes, local takeaways, supermarket meal deals
and much more in between. It includes food and drink bought to be eaten on the
go, or in places such as restaurants, cafes and pubs. Compared to the retail sector,
where 11 retailers represent over 90% of calories purchased, the OOH sector is much
more diverse, with many smaller players.
The sector is well used by the population and trips to OOH outlets go beyond an
occasional treat. The 2023 National Diet and Nutrition Survey (NDNS) reported that
the majority of the population purchased food and drink from the OOH on at least a
weekly basis. The NDNS survey found that almost three-quarters of participants had
purchased food or drink from the OOH sector in the last seven days, with most
making purchases one to two times a week.
The OOH sector is a major part of the UK's food environment but to date has faced
less regulatory focus than other parts of the food environment, such as supermarkets.
Obesity rates in the UK have doubled since the early 90s, but Nesta's analysis shows
that small sustained changes to the food environment can tackle rising obesity
levels. A daily reduction of 216 calories could halve obesity rates. With OOH meals
regularly exceeding 1,200 calories, even minor changes to recipes and portion sizes
could add up to big changes for health.
Polling suggests that almost half of UK adults want to lose weight and almost
three-quarters support Government action on obesity. Achieving this weight loss can
be challenging, and is made more difficult by the higher availability of less healthy
food options in the environments where people live, work and spend time. In
addition, not all communities experience the same food environments; areas of
greater deprivation typically have a higher number of unhealthy OOH outlets than
others. Government statistics from the wider determinants of health profile show that
in 2024 the number of fast-food outlets per 100,000 people in areas of higher
deprivation is double that in more affluent areas.
The calories we consume from OOH contribute a small, but significant, proportion of
our total energy intake. Our latest analysis shows that around 15% of the calories
purchased came from OOH, based on our previous analysis of in-home and
out-of-home data. Nesta has previously published an in-depth look at the OOH
sector, which looked at how eating out contributes to our diets, using data about
consumers from 2021. The report includes a detailed breakdown of the shape of the
OOH market, reporting that the fast food and takeaway industry was the most
dominant part of this market at £21.37 billion in 2022. For more information about the
sector and the key contributors to diet in 2021, please see the full report.
The out-of-home policy context
To date, the OOH sector has faced less regulation than retailers and hasn't come
under the same spotlight when it comes to policy action to address healthier diets.
Action to improve health in the OOH sector has been mostly voluntary, largely
focused on comparatively small parts of the sector, and relatively ineffective.
Regulation has been aimed at larger companies, excluding the many SME
businesses who make up the sector. With smaller, independent outlets making up
around 65% of consumer spend in OOH, SMEs are important to consider within policy
mechanisms aimed at improving health across the OOH sector.
Large OOH businesses have been subject to some mandatory action to give
customers more information about the food and dishes they are choosing. Since
2022, large OOH businesses have been legally required to provide calorie
information on menus. However, evaluations of the policy show there has been no
impact on the amount of calories purchased from OOH.
In 2018, Public Health England (PHE) launched a voluntary calorie reduction
programme. The OOH sector was challenged to reduce calories in main meals and
side dishes by 20%, and in children's meals by 10% by 2024. This could be achieved
by reformulating recipes, reducing portion sizes and encouraging customers to
purchase lower calorie options. The Office for Health Improvement and Disparities'
progress review, published in 2024, shows that limited progress was made across the
sector. In fact, there were small increases in the number of calories in main meals,
starters, side dishes and sandwiches. There was little progress in reducing calories in
children's meals.
A lack of reliable and transparent data has made it challenging to understand the
true picture of the food and drink on offer from OOH, and to implement mandatory
policies to improve its healthiness. In June 2025, the government announced its
intention to bring in the Healthy Food Standard as part of the 10 Year Health Plan.
This policy will require all applicable large businesses to report on their sales and work
towards a standard for healthier sales. Mandatory data reporting will be a
foundational step towards improving health in the OOH sector.
Although the OOH sector has not been the government's priority focus for change,
it's now more important than ever that the sector – known for its innovation and
adaptability – turns its focus to health. With over 80% of our daily calories coming
from supermarkets, it's right that policy measures have focused on retailers.
However, as the government moves ahead with further policies aimed at improving
the healthiness of shopping baskets, it's important to level the playing field between
retail and OOH.
Key findings from our OOH analysis
We have conducted new analysis on the Worldpanel by Numerator Out-of-Home
Purchase Panel for 1 January to 31 December 2024 and 1 April to 26 December 2021
to establish an updated picture of the state of the sector and the calories
consumers are purchasing.
The data contains survey panels of food and non-alcohol drink purchases in Great
Britain, with a total sample of 5,800 individuals aged 18+ used in our analysis. We've
used the data to estimate average adult purchasing of calories per person, per day
for out-of-home food. All analysis and interpretation have been conducted
independently. Worldpanel by Numerator has not independently verified the
findings, or endorsed the views in this report. For more information about how we
conducted the analysis, see the technical appendix.
We have further categorised OOH intake to analyse differences across:
- Types of OOH outlets – for example cafes, restaurants, takeaways
- Geographic areas
- Age
- Social grade groups.
1. Key finding: OOH purchasing reached an average of nearly 400 calories per person per day, and nearly 900 calories for people using OOH the most.
Number of calories purchased from the OOH sector
Our analysis found that on average 390 calories were purchased per person per day
from OOH in 2024. This suggests that, on average, calories purchased from OOH
made up around 15% of overall calories purchased for adults across Great Britain
(based on our analysis of calories from retail ), although that varies across the
population.
England saw the highest number of calories purchased per person per day, followed
by Wales, then Scotland.
| Nation |
Calories per person, per day |
| England |
390 |
| Scotland |
330 |
| Wales |
370 |
Based on our previous analysis, there was an average increase of around 10% in
calories purchased from 2021 to 2024, amounting to around 35 extra calories per
person per day.
Calculating average calories purchased can be approached in different ways and
influenced by the design of the study, for example, the sample size and whether
dietary recollection or store sales data are used. This can mean there is variation
across different studies as to the contribution of calories from different sectors. A
recent study from Food Standards Scotland reported that OOH foods account for
20% of total calories for adults in Scotland.
Top OOH consumers
The top 20% of adults, in terms of calories purchased from the OOH sector,
purchased an average of 895 calories a day – over 500 more calories per person per
day than the average; the equivalent of the energy content of a main meal.
Among the top users of OOH, we did not find any significant differences either
between consumers, such as age or social grade, or the types of OOH outlets that
calories are purchased from. In our analysis, people who use OOH outlets the most
tend to purchase their calories from a similar mix of outlets as average OOH users.
Therefore, it's important that any policies addressing the OOH food environment are
designed to reach all types of groups within the population, and all types of OOH
outlets, to maximise impact.
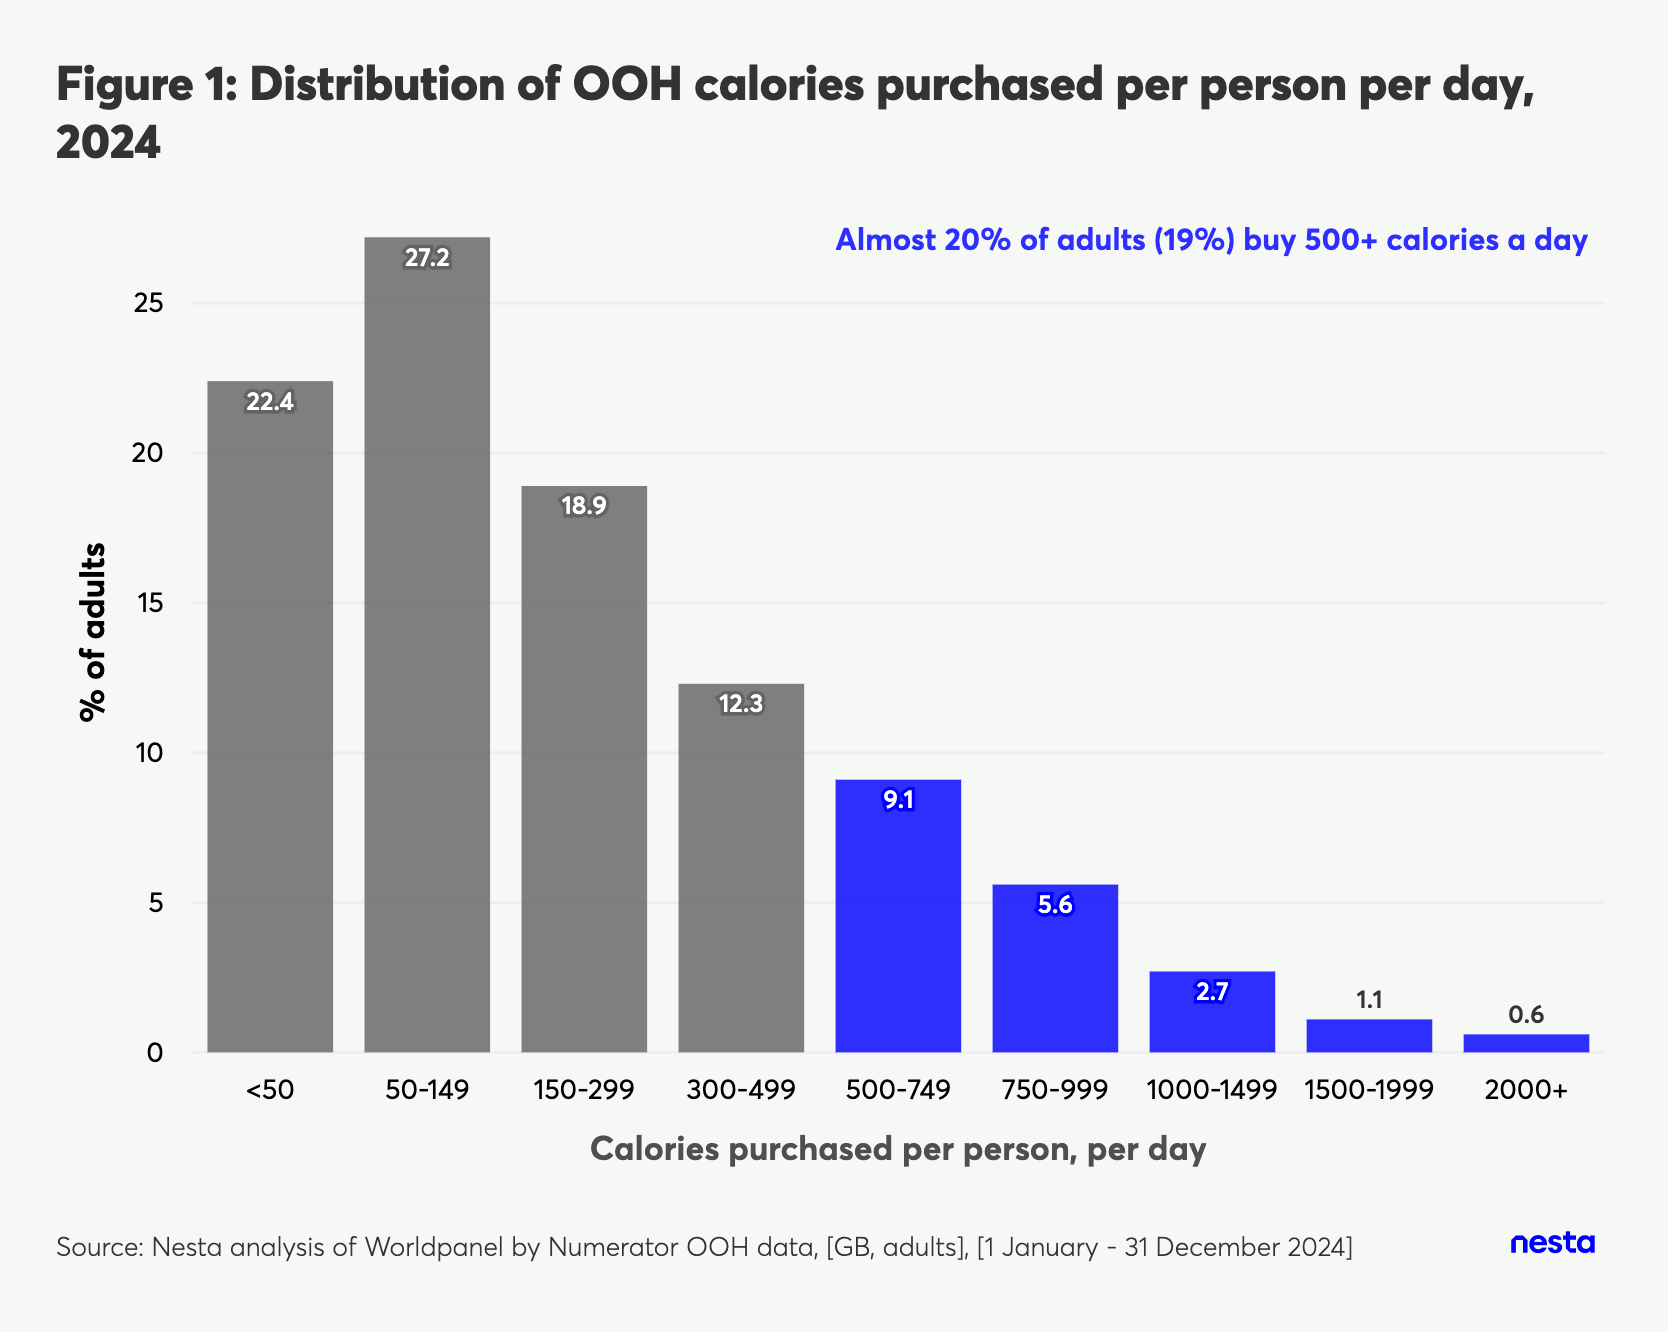 Figure 1: Distribution of average calories purchased per person per day
2. Key finding: OOH purchasing is a mixed picture, with over a fifth of calories purchased from supermarkets and convenience stores.
Calories were purchased from a range of outlets across the OOH sector, reflecting
the sector's diversity. Any OOH policy needs to address all cuisine and category
types.
The largest share of OOH calories were purchased from food-to-go from
supermarkets and from cafes/bakeries, totalling 170 calories per person per day. Our
analysis found that 100 calories, over 20% of OOH calories purchased per person per
day, came from supermarkets and convenience stores. These are typically meal
deals and foods intended to be eaten on the go. Any policy designed for OOH
needs to apply to these types of to-go purchases from retail too.
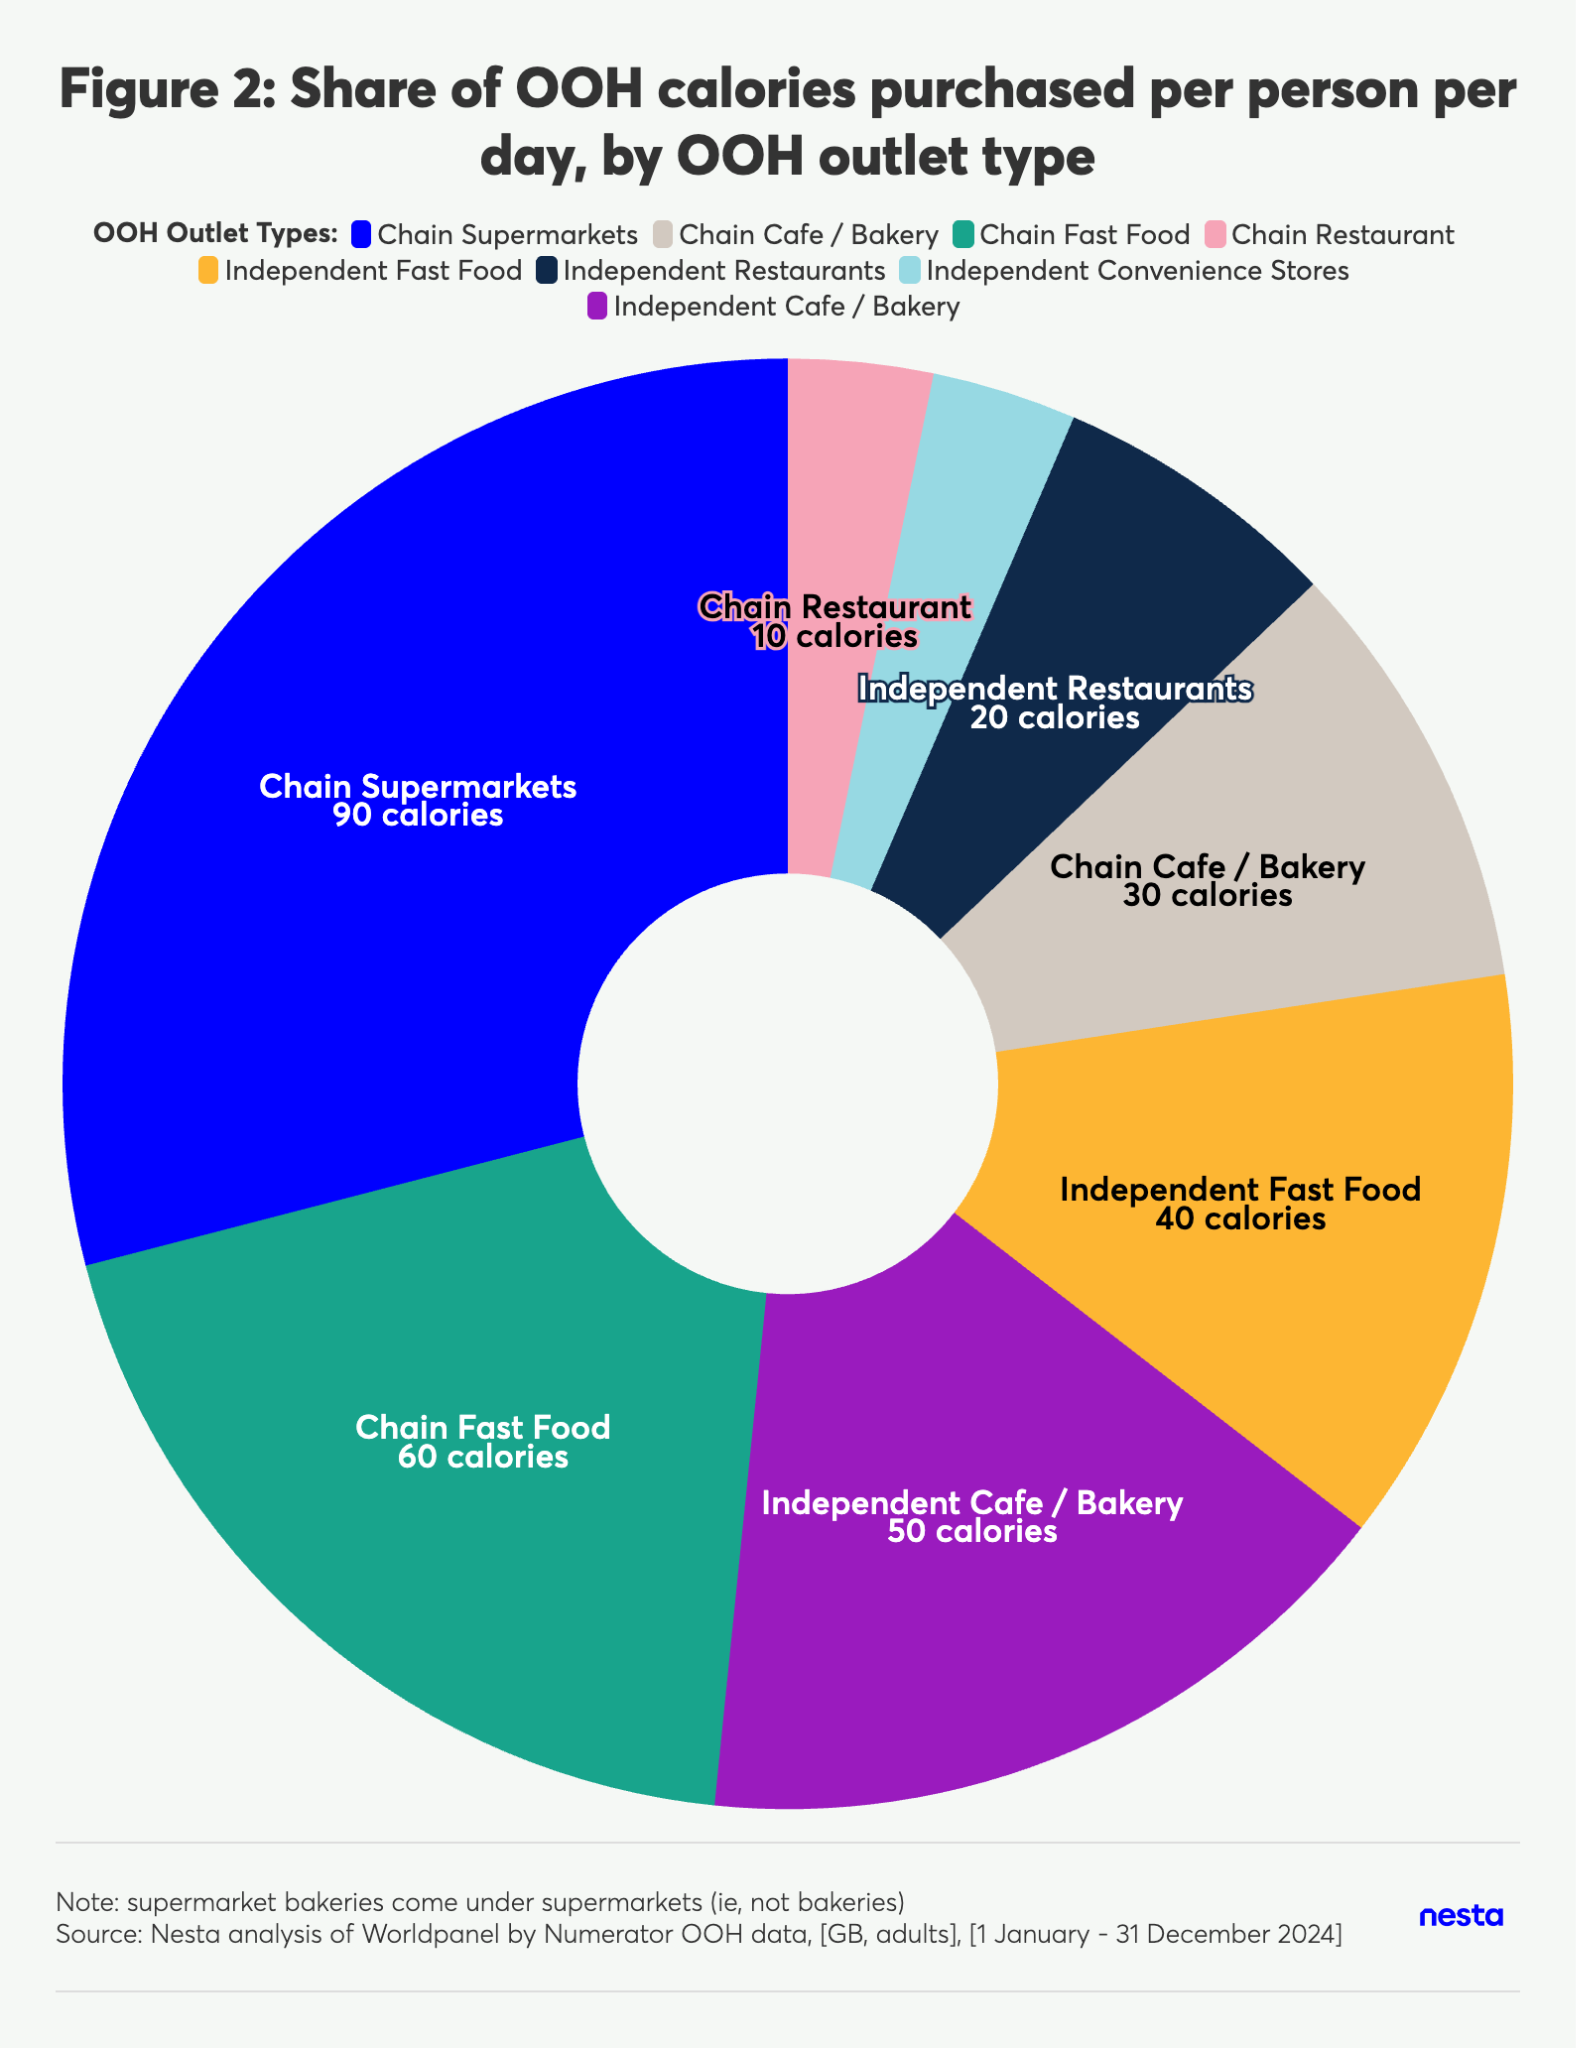 Figure 2: Calories purchased per person per day, by OOH outlets
*Rounded to the nearest ten
It is important to note that the data looking at calories purchased per person per
day across OOH outlets is scaled using the full GB population. Because the average
includes the full population, it counts those who don't shop in a type of OOH outlet
as contributing 0 calories.
Spend in OOH compared to retail
Our analysis found that on average, people spent £3.60 per person per day on food
and drink from OOH in 2024, compared to around £6.30 on food and drink to be
consumed at home. This is an increase from an average of £2.70 spent per person
per day on OOH in 2021.
Although the amount spent on calories from the retail sector is around 75% higher
than from OOH, calorie purchasing from the OOH sector is growing. It's right that the
retail sector is the immediate focus for policymakers, but regulation to improve the
OOH food environment will increasingly be needed, as calorie purchasing from OOH
grows.
Purchasing from large businesses vs smaller outlets
On average, 230 calories were purchased per person per day from large OOH
businesses, making up over half of the 390 calories purchased from the OOH sector
each day. Large businesses are defined as those with more than 250 employees and
would be captured under the government's proposed Healthy Food Standard.
However, almost half the calories purchased from the OOH sector each day come
from Small and Medium Enterprises (SMEs). These businesses would be exempt from
incoming Healthy Food Standard regulation, so further policy measures are needed
to address SMEs in the OOH sector too.
Delivery apps
Our analysis looked at delivery app usage to understand how this contributes to
overall calorie purchasing from OOH. On average, the number of calories
purchased via delivery apps contributed less than 10% of overall calories from OOH.
From the data we looked at, the amount of calories purchased via delivery apps
has decreased slightly, from 38 calories purchased per person per day in 2021 to 31
calories in 2024.
Based on our analysis, delivery app usage does not appear to be driving an
increase in OOH calorie purchasing in the data we explored. However, with the
delivery apps market growing, it was projected to reach over £14 billion in 2025, and
with the increasing use of technology and AI to reach consumers, food delivery
apps are a dynamic feature of the food environment and should be included in any
future regulations.
3. Key finding: People in the lowest social grade by occupation purchase over 30% more calories per person, per day than higher-grade professions
Socio-economic differences were split into five categories (A to E) based on the
self-reported occupation and employment status of the Household Reference
Person. Social grade classification is a way of grouping people that is based on their
social and economic situation. Grade AB corresponds to higher and intermediate
professional occupations, and Grade E corresponds to unemployed and
lowest-grade occupations.
There was a mixed picture of calories purchased from OOH in 2024 by different
social grades. People in the lowest grade occupation and unemployed (Grade E)
purchased on average around 33% more calories per person per day from OOH
than those in higher and intermediate professional occupations, with a difference of
around 115 calories.
This difference was predominantly driven by the number of trips. Individuals from
Grade AB visit the OOH sector on average three times per week, whilst individuals
from Grade E visit on average four times.
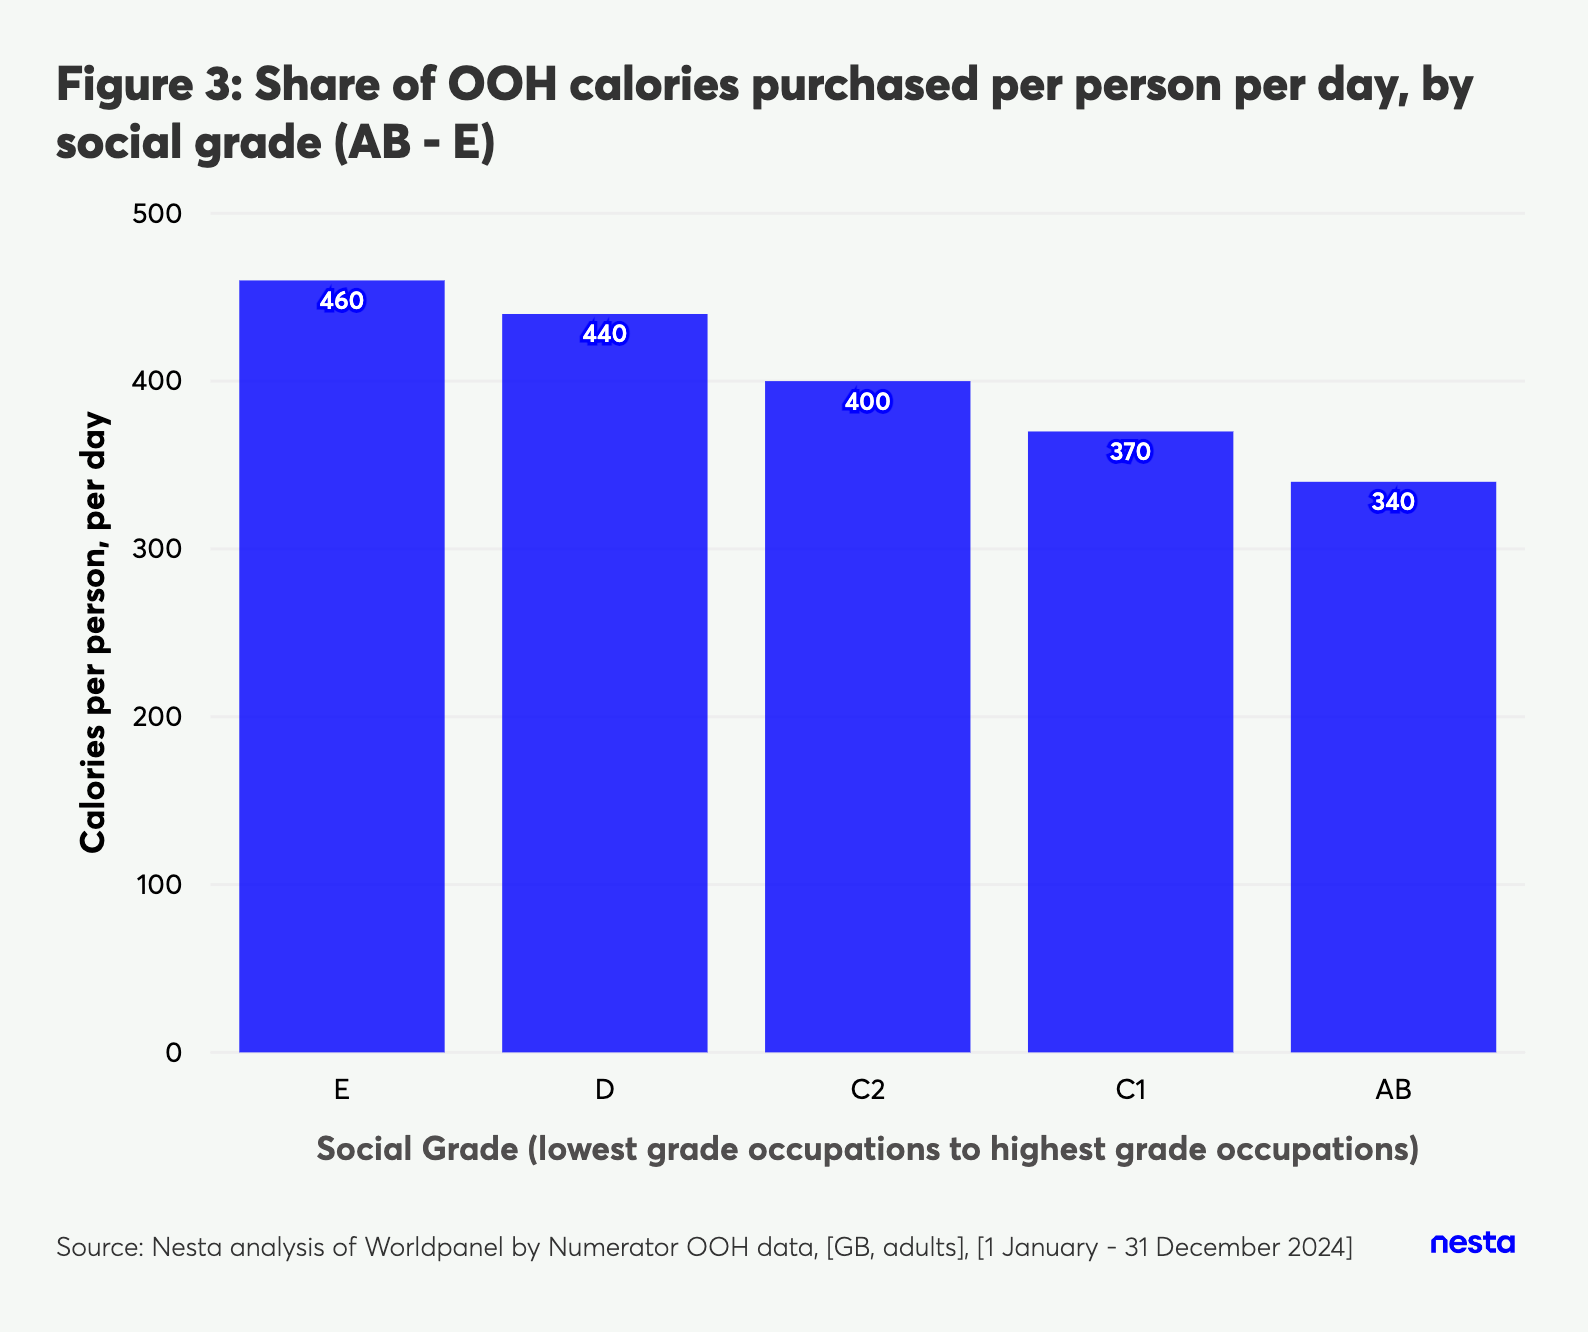 Figure 3: Calories purchased per person per day, by social grade classification
There is typically a greater number of OOH outlets in more disadvantaged areas,
making it harder for consumers to choose healthier options. Food Foundation
analysis reports that 31% of places to buy food are fast-food outlets in the most
deprived fifth of areas, compared to 22% of places to buy food in the least deprived
fifth of areas.
4. Key finding: People in London and the South purchase fewer calories from OOH per person, per day than other regions
In general, London and the South saw the lowest calories purchased from OOH per
day in 2024. The Midlands and the North of England saw the greatest number of
calories purchased.
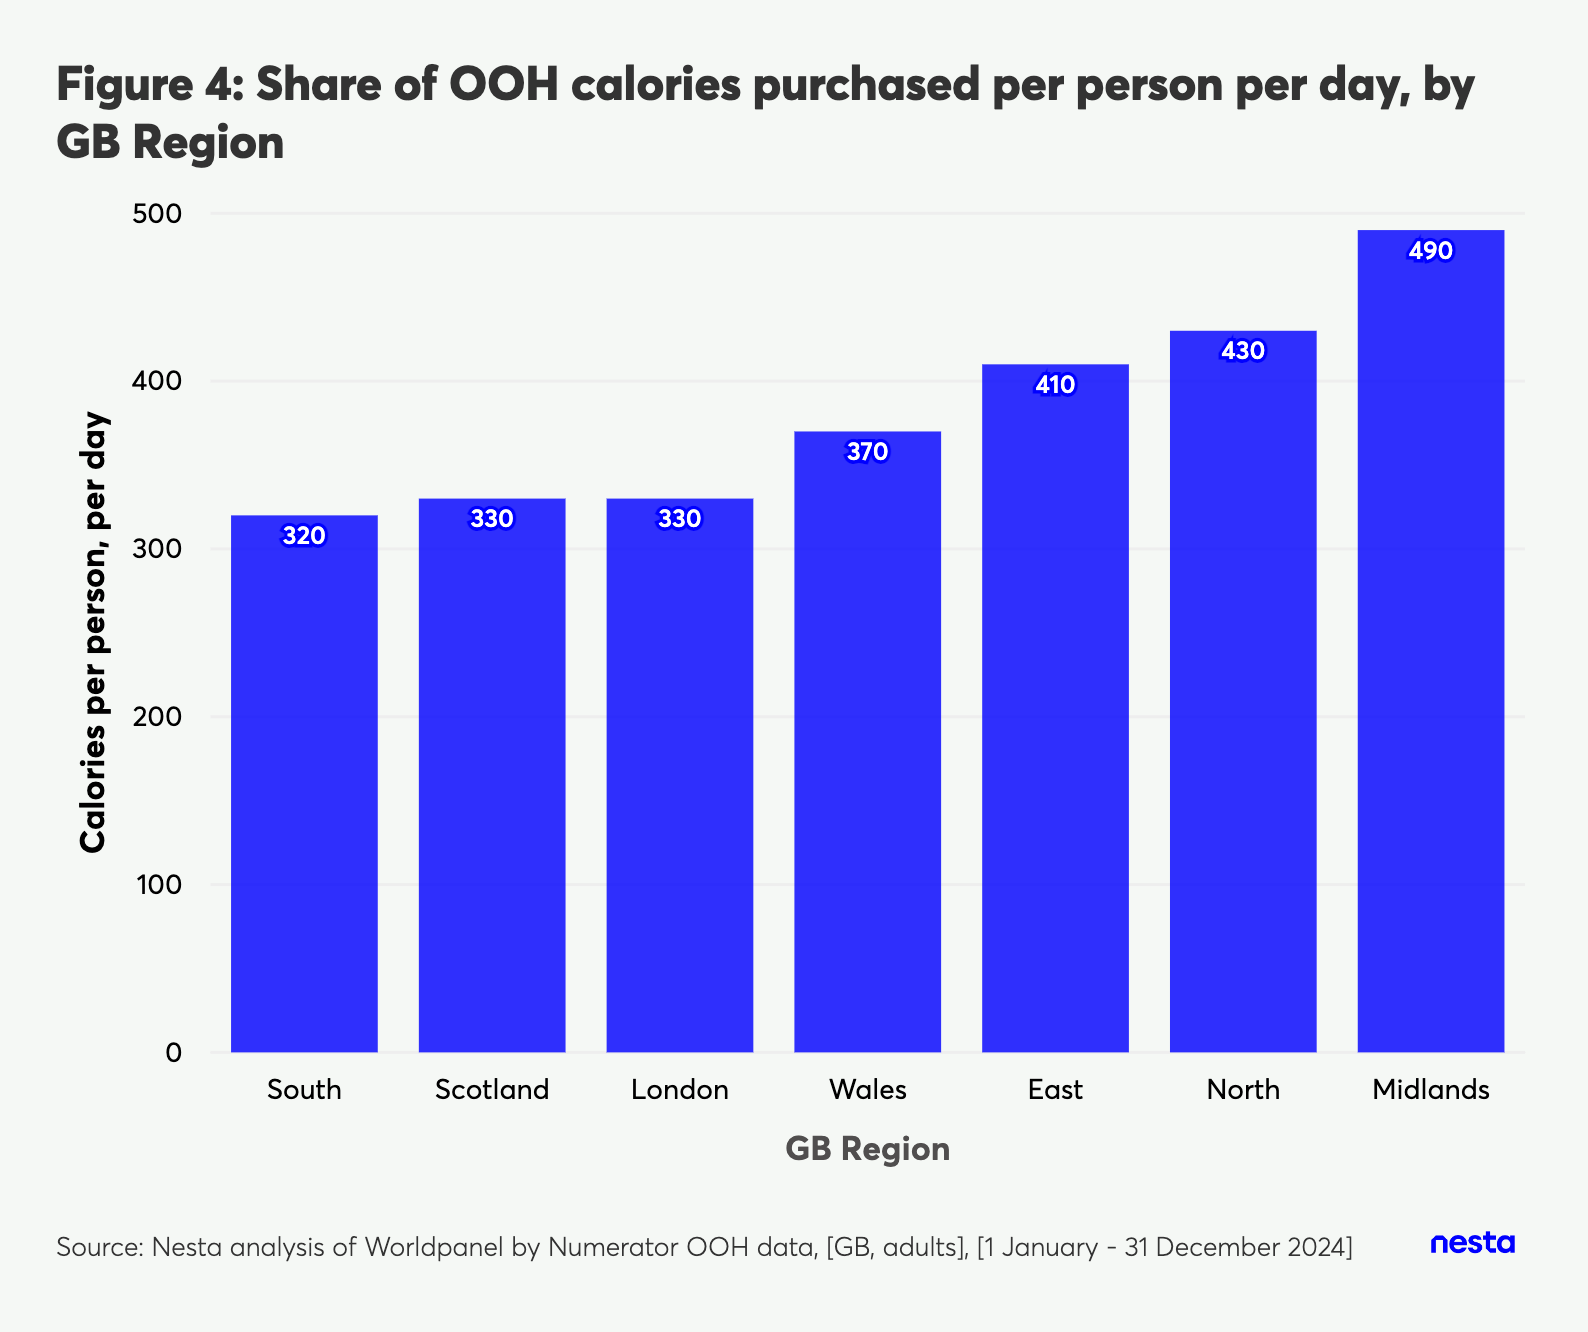 Figure 4: Calories purchased per person per day, by GB region
* Fewer than 500 panel members in Wales and Scotland within our analysed extract;
therefore, there is a higher degree of uncertainty in these results due to the smaller sample
size.
Inequalities in healthy life outcomes are closely linked to areas of deprivation. There
is a difference of around 20 years in healthy life expectancy (the average number of
years a person can expect to live with good health) between adults living in the
most and least deprived areas. The food environment, the types of OOH on offer
and the frequency of visits all contribute to the wider health picture for different
regions.
Number of trips across regions per person, per day
Our analysis shows that calories per person per day were highest for OOH users in the
Midlands. On average, individuals in the Midlands visited OOH outlets more often, at
6 times per week.
5. Key finding: Younger people purchase more OOH calories than older age groups per person, per day
Younger adults (18-24 year olds) purchased more calories from OOH on average per
person per day in 2024 than older groups, though this is based on a small sample
size. This may be driven by a trend for younger groups to make more trips to OOH
outlets than older groups. Our analysis found 18-24 year olds made on average
around 5 trips per week to OOH, compared to around 3 trips a week for the over 65
age group. However, the number of calories purchased did not increase in a linear
way across age groups, with very similar amounts of calories purchased in all age
groups from 35 years upwards.
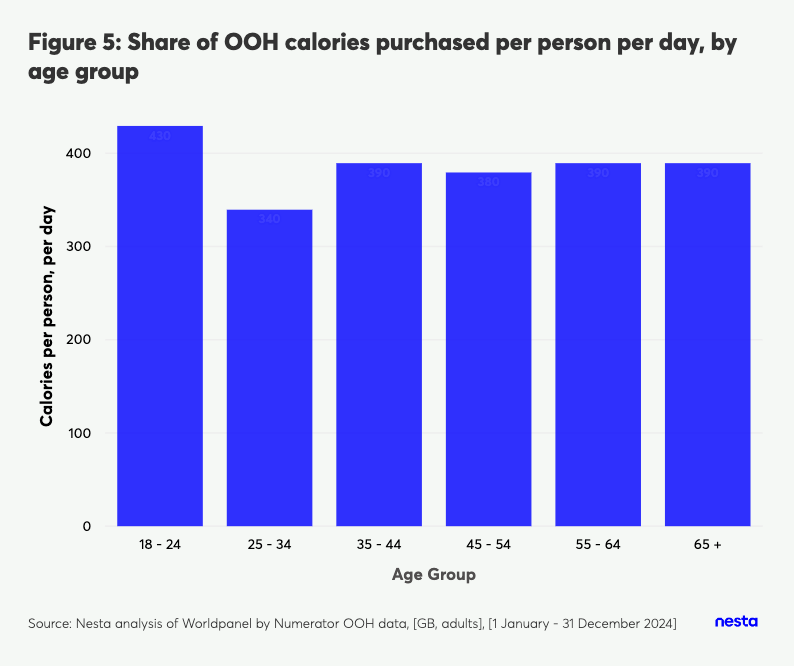 Figure 5: Calories purchased per person per day, by age group
* There were fewer than 200 panel members in the 18-24-year-old group of our analysed
extract, giving a higher degree of uncertainty in these results, due to a smaller sample size.
Conclusion
Our analysis found that calories purchased from the OOH sector contribute around
15% of overall calories purchased per person, per day. The amount of calories
purchased from OOH is not evenly spread and, for one in five people, the OOH
sector contributes nearly 500 calories a day. Improvements to the healthiness of
products and meals on offer from OOH could therefore lead to significant
improvements in population health.
The out-of-home sector is flexible and able to change recipes and launch new
products in response to supply chain dynamics, ingredient costs, wider market shifts,
and customer preferences. These practices demonstrate that the sector can also
make shifts to improve the healthiness of the food and drinks it sells.
Nesta's evidence shows that reducing overall calorie intake by 216 calories a day
could be enough to halve obesity rates. A range of options are available to the
OOH sector to contribute towards this target, without reducing the enjoyment
people get from the sector. The British Nutrition Foundation report on interventions for
the UK food environment suggests a range of measures which could be put in place
for the OOH sector. These include changing the order of menu items, reformulating
meals and reducing portion sizes. Portion sizes are typically larger in the OOH sector
and meals often contain an excessive amount of calories per meal. Nesta research
from 2024 estimates that at least 60% of meals sold in the out-of-home sector exceed
the recommended number of calories per meal.
With over 80% of our daily calories coming from supermarkets, it's right that policy
measures have so far focused on retailers. Any regulations proposed for the OOH
sector must be mandatory, to ensure a level playing field across the wider food
sector and within the OOH sector. Before new regulations are brought in, it is
essential to have a better understanding of how such a diverse sector, with many
small businesses, can be regulated and how those regulations could be enforced.
Our findings provide useful signals, but more robust and consistent data is needed to
truly understand the contribution of the OOH sector to diets.
Mandatory regulation is needed to level the playing field within the sector and with
retail. As part of the Healthy Food Standard, the government should look to
introduce mandatory OOH health targets for large businesses, in line with targets
which will be rolled out for retailers. Improving the healthiness of the OOH sector will
be an important step along the journey to improving the health of the population. By
ensuring all applicable large food businesses are captured by upcoming regulation,
the government can ensure every major player in the food system is contributing to
a healthier nation.
Technical appendix
Our analysis of the Out of Home sector uses disaggregated, unweighted data from
Worldpanel by Numerator's Out-of-Home Purchase Panel for 1 January to 31
December 2024 and 1 April to 26 December 2021, acquired for our analytical
requirements. The dataset comprises food and drink purchases in Great Britain (GB)
made out-of-home (OOH), including from restaurants, cafes, fast food businesses,
pubs, bakeries, workplace canteens and vending machines, recorded by an
individual-level panel consisting of individuals in Great Britain aged 13 and over. For
each purchase, the date, business, product, spend, quantity, volume, any
promotion, and whether it was eaten in, taken away, or delivered are recorded. The
dataset is supplemented with respondent demographic information, a store
taxonomy, product metadata, and nutrition information from web-scraped menus
and, for barcoded products, from packaging. Our analysis used two panel years,
processed via identical pipelines: 2024 (1st January to 31st December; around 5,800
panellists recorded OOH purchases in our analysed extract) and 2021 (subset of 1st
April to 26th December avoiding the lockdown period; around 5,400 recording
purchases in our analysed extract). Some data processing and summary-level figures
were supported with data from Worldpanel by Numerator's Take-Home Purchase
Panel GB for 1 January to 31 December 2024.
All analysis and conclusions presented in this technical appendix and report are the
independent work of Nesta. They should not be attributed to, or interpreted as
representing the views of Worldpanel by Numerator.
Due to the nature of the sector, detailed nutrition information is not systematically
available for all OOH purchases. To enable Nesta to calculate OOH purchasing
metrics (for example, calories purchased per person per day) at the population
level, and split by demographic strata, we sought additional product-level nutrition
information from several additional sources as part of our internal data preparation.
Nesta's data preparation steps are listed below.
Purchase records
Notable steps included removing zero-quantity records and
normalising spend and volume per unit purchased. Transactions were
grouped into purchasing ‘trips' using Worldpanel's trip identifiers.
Stores and channels
We assign each business to a chain and to Nesta's own
two-level channel classification comprising a broad ‘outlet type' (eg, fast
food, cafe, pubs and bars, etc) and an additional level 'distinguishing chains
from independents' (eg, chain or independent fast food) using Worldpanel's
store taxonomy, together with Nesta's manual store mapping, to align with
our purposes. For published channel breakdowns, we further group these
channels into broader Nesta-defined groups and exclude institutional or
incidental channels (eg, vending machines, workplace canteens, education
and hospital settings) from the breakdown; purchases from excluded
channels remain in the dataset and in headline figures. We separately identify
the major grocery retailers by matching chain names against the eleven
largest GB grocers, excluding their in-store cafes.
Products
Nesta manually reviewed and selected a product category from
those assigned to each product based on what was most appropriate for our
analysis, drawing from market, sector and meal types. Products are classified
as food or drink using Worldpanel's ‘meal category'; items without one
(around 2.5% of 2024 purchased calories, mostly composite meals) are
treated as food.
Nutrition sources
We hierarchically associate nutrition information with each
product from five sources, in priority order.
- A direct match to the nutrition information in our take-home product
dataset where the two services share a product code (~19% of
product codes in the 2024 data; for these matches a serving
corresponds to one purchased unit). Technical information on our data
preparation of the Take Home panel's nutritional information can be
found here.
- Barcode-level nutrition supplied by Worldpanel.
- Nutrition values manually researched by Nesta-commissioned labellers
in 2026 for ~1,800 product and chain pairs, targeting the highest-selling
products of large chain businesses not already covered by the other
sources.
- ~1,200 product and chain pairs manually labelled in an earlier
Nesta-commissioned exercise.
- Worldpanel's web-scraped menu data. Where sources disagree on a
value, we take the value most sources agree on, deciding ties via the
priority order above, and recording the eventual source.
Calorie data preparation
Energy density, serving size and calories per serving
are arithmetically linked (kcal per serving = kcal per 100g * serving size / 100),
so we derive any unavailable one of the three from the other two, and audit
reported values that are inconsistent with one another. We applied a method
of using weighted medians (by units sold), within increasingly broad product
and chain groupings to derive additional calorie values. Calories per serving
are never imputed directly, and other nutrients are never imputed. Overall,
99.7% of purchases end up with a calorie value. Around 45% of purchased
calories in 2024 (50% in 2021) rely at least partly on imputed values, with the
remainder taken directly from the five sources or derived arithmetically from
them. Purchases without a calorie value are excluded from calorie statistics.
Reference nutrient profiles
We create a single point of reference nutrient
profile for each product within each chain across the analysis period: where
reported (barcode) nutrition varies over the year, we take the intra-product
weighted median, mirroring the approach used for the Take Home data. This
approach is specific to our analytical requirements.
Demographics
Individual demographics are reconciled and cleaned
(implausible zero heights and weights are discarded, and BMI is recomputed
from height and weight); region codes are mapped to regions and nations;
and household-level attributes (for example, social grade and household
income) are attached to each individual via their household.
To ensure our analysis is representative of the GB population, we apply the supplied
survey weights that align and scale the sample to the target population and correct
for known panel behavioural biases, giving representative population-level estimates
of purchase characteristics and quantities. Finally, our analyses focus on the adult
population only, meaning we restrict the eventual dataset to only contain purchases
from panellists aged 18 and over.
Per-person figures are calculated by dividing these population-level totals by the
corresponding ONS mid-year GB population estimate for those aged 18 to 79 to
align with the survey target population, and the number of days the panel covers
(366 days for 2024; 270 days for the April to December 2021 window, where a day
counts if at least one purchase was recorded by panel participants in our analysed
extract).
We use annual demographic weights for panellists present throughout the year to
size demographic groups when breaking population-level figures down by group, so
that each group's total is divided by that group's share of the population and the
group figures average back to the overall figure exactly. For distribution (histogram)
statistics, each panellist is likewise weighted by their annual demographic weight, so
that bins reflect the share of the population each panellist represents.
All published statistics are computed directly from the weighted purchase-level data
described above, as population totals, shares of those totals, or the per-person
figures defined here, unless otherwise noted.
Endnotes
- We used Worldpanel by Numerator's Take-Home Purchase Panel GB for 1 January
to 31 December 2024 to estimate the average number of calories purchased
from food and drinks to eat at home by adults in 2024. The technical appendix of
Nesta's report The healthy food standard: Updated evidence on the impact of
health targets for supermarkets describes the methodology used (page 36). We
combined the take-home figure with Worldpanel by Numerator's Out-of-Home
Service GB for 1 January to 31 December 2024 estimates for daily calories
purchased on food and non-alcoholic drinks to eat out of home by adults in GB.
The estimates for the take-home and out-of-home data combined give an
estimate of around 2,600 kcal/day purchased by GB adults in 2024.
- We define large OOH businesses as those with 250 or more employees, as
classified in the existing UK menu calorie labelling legislation. Large businesses
were identified in our dataset by conducting online searches into named
organisations to verify the number of employees.
58 Victoria Embankment
London EC4Y 0DS
+44 (0)20 7438 2500
[email protected]
X @nesta_uk
@nestauk.bsky.social
f nesta.uk
in Nesta
nesta_uk
www.nesta.org.uk