






Unveiling how food purchasing patterns are linked to our calorie intake in Great Britain.
The takeaways, cafes, restaurants and bakeries in our neighbourhoods and high streets are hugely important parts of our communities and our local economies. They are the places we go for a quick bite on the go and the places we meet friends and enjoy special occasions with family.
In the UK, around two-thirds of adults live with excess weight or obesity which is a major contributor to ill-health and premature death. The places where we buy food that’s already prepared or cooked likely play a significant role in this obesity crisis. To reduce obesity levels and help more people live healthy lives for longer, we need to increase the accessibility, availability and affordability of healthy food in our takeaways and shops.
We analysed demographic and purchasing data from more than 5,000 people across Great Britain from the out-of-home subset of the Kantar Worldpanel fast-moving consumer goods panel to capture purchases from this sector between April and December 2021. We augmented nutritional data through the use of four sources of calorie information combined with data science methods.
To our knowledge, this is the first attempt of its kind to systematically and comprehensively link sales to nutritional data and this report provides the most accurate picture to date of purchasing patterns and how they contribute to Great Britain’s calorie intake. In doing so it uncovers numerous novel insights.
2025 update
Since publication of our ‘How eating out contributes to our diets’ report in 2024, Nesta has continued work to refine our understanding of the nutritional content of OOH purchases in the UK, including through our calorie sampling report, work on developing health targets for large out of home businesses and ongoing work on how we can improve the data available for SMEs in the UK.
As part of this work, we have manually labelled the nutritional values of products that make up 95% of sales of a sample of biggest large businesses. Based on this labelling, we have revised our initial estimate of the total calories purchased per person in the UK from the out-of-home sector up by 15%, to ~340kcal, but believe our key conclusions remain unchanged. We are working towards a fuller update of remaining analyses, which will draw on 2024 data, to be published in due course.
Our findings
- The sector contributes on average 300 calories per person per day to our diets – 1,027 kcal per trip on average while the recommended amount of calories per meal is 600.
- The number of calories purchased out of the home daily is distributed very unevenly across the population.
- The majority of the population (~60%) uses the sector at least once a week; a small proportion of the population (11%) uses it, on average, at least once a day.
- Fast food and food to go from supermarkets make up over half the total number of calories purchased in this space.
- Two-thirds of meals purchased exceed the recommended intake for a meal (600 calories); about 20% of meals are over half the recommended daily intake (for fast food meals specifically this figure is 30%).
- Sandwiches are the single item which contribute the most calories purchased but other items such as pizza, burgers and fish are more likely to be driving our increasing obesity prevalence.
- Non-alcoholic drinks (alcoholic drinks were not included in this analysis) contribute 12% of all calories purchased in the OOH sector. Coffee comprises 4% of the total calories purchased.
- On average, people living with excess weight purchase more calories from fast food.
- Approximately 25% of the calories we purchased from fast food in 2021 were ordered digitally.
- Large portion sizes mean that density-based healthiness metrics are not, in isolation, an appropriate measure of healthiness for OOH.

What this means
In demonstrating the scale of the contribution these food outlets make to our diets we strengthen the case for the importance of regulation. Our report highlights areas which likely contribute large quantities of excess calories to our diets but are currently subject to minimal or no regulation.
This report makes the case that it should likely be possible to make small relative reductions in calorie content without reducing the joy we take from food. By targeting the sorts of food we are buying regularly, such small relative reductions would likely lead to large absolute reductions in calories purchased at a population level.
Nesta is looking in more detail at this sector in the coming months and we will explore and, building on our retailer targets work, report on what approaches could be taken to use targets to most effectively increase the healthiness of food products prepared and purchased outside of the home.
Watch our webinar on the research findings
Watch our webinar on the research findings
We are Nesta. The UK's innovation agency for social good.
We design, test and scale solutions to society's biggest problems. Our three missions are to give every child a fair start, help people live healthy lives and create a sustainable future where the economy works for both people and the planet.
For over 20 years, we have worked to support, encourage and inspire innovation.
We work in three roles: as an innovation partner working with frontline organisations to design and test new solutions, as a venture builder supporting new and early stage businesses and as a system shaper creating the conditions for innovation. Harnessing the rigour of science and the creativity of design, we work relentlessly to change millions of lives for the better.
Find out more at nesta.org.uk
If you'd like this publication in an alternative format such as Braille or large print please contact us at: [email protected]
Authors Elena Mariani, Anish Chacko, Izzy Stewart, Max Hadley, Cath Sleeman, Lauren Bowes Byatt, John Barber and Hugo Harper
- Executive summary
- Introduction
- Data and approach
- Key findings
- Key finding 1: the OOH sector contributes on average about 300 calories per person per day to our diets.
- Key finding 2: the number of calories purchased daily from OOH is distributed very unevenly across the population. There is no obvious trend of who purchases very high amounts of calories or from where they purchase them.
- Key finding 3: most of the population uses the OOH sector at least once a week; a small proportion of the population uses OOH, on average, at least once a day.
- Key finding 4: fast food and food to go from supermarkets make up over half the total number of calories purchased in the OOH space.
- Key finding 5: most meals exceed recommended intakes for an eating occasion; about 20% of meals are over half the recommended daily intake.
- Key finding 6: sandwiches are the single item which contribute the most calories purchased but other items such as pizza, burgers and fish are more likely to be driving our increasing obesity prevalence.
- Key finding 7: coffee-based drinks are the single item that contributes the most to OOH calories among all (non-alcoholic) drinks.
- Key finding 8: on average, people living with excess weight purchase more calories from fast food.
- Key finding 9: approximately 25% of the calories we purchased from fast food in 2021 were ordered digitally.
- Key finding 10: large portion sizes mean that density-based healthiness metrics are not, in isolation, an appropriate measure of healthiness for OOH.
- Concluding remarks: what this might mean for policy in OOH
Executive summary
Obesity is a significant driver of poor health and increases the risk of many physical and mental health conditions. Obesity prevalence could be halved if each person living with excess weight reduced their calorie intake by only 8.5% or 216 calories per day (based on data for England). Improvements in the food environment are likely to offer the most equitable, sustainable and feasible way of reducing the number of people living with excess weight (which is around two-thirds of all adults across England, Scotland and Wales). Importantly, the changes required are small and can be achieved without reducing the joy we take from food.
The out-of-home (OOH) sector is an important part of our food environment: we know that most of the population interacts with OOH food regularly yet our understanding of the contribution it makes to our diets is limited. Regulation of this sector is also limited. We have used data science techniques to provide the most accurate and systematic view to date on the contribution the OOH sector makes to our diets.
The OOH sector is made up of food and drink that is prepared or cooked away from the home and includes restaurants, fast food outlets and coffee shops as well as food to go bought from supermarkets and other venues.
This report demonstrates 10 key findings:
- The OOH sector contributes, on average, 300 calories per person per day to our diets.
- The number of calories purchased daily from OOH is distributed very unevenly across the population.
- Most of the population uses the OOH sector at least once a week; a small proportion of the population uses OOH, on average, at least once a day.
- Fast food and food to go from supermarkets make up over half the total number of calories purchased in the OOH space.
- Most meals exceed recommended intakes for an eating occasion; about 20% of meals are over half the recommended daily intake.
- Sandwiches are the single item that contribute the most calories purchased but other items, such as pizza, burgers and fish, are more likely to be driving our increasing obesity prevalence.
- Coffee-based drinks are the single item that contributes the most to OOH calories among all (non-alcoholic) drinks.
- On average, people living with excess weight purchase more calories from fast food.
- Approximately 25% of the calories we purchased from fast food in 2021 were ordered digitally.
- Large portion sizes mean that density-based healthiness metrics are not, in isolation, an appropriate measure of healthiness for OOH.
In showing the scale of the contribution of the OOH sector to our diets we strengthen the case for the importance of regulation in this space. We highlight that areas which likely contribute large quantities of excess calories to our diets are currently subject to minimal or no regulation. In demonstrating the sales-weighted calorie content of many commonly purchased items and meals we make the case that it should be possible to make small relative reductions in calorie content without reducing the joy we take from food. Such reductions would likely lead to large absolute reductions in calories purchased at population level.
Introduction
What is 'out of home'? The out-of-home (OOH) sector is made up of food and drink that is prepared or cooked away from the home (so, it is not defined by where it is consumed), and includes restaurants, fast food outlets and coffee shops. It even includes food to go purchased from supermarkets, vending machines and canteens in workplaces or hospitals and schools. In this report we reveal the contribution of the OOH sector to our diets. Compared to the retail sector where 11 retailers represent over 90% of calories purchased, the OOH sector is a lot more diverse with many smaller players. Figure 1 shows the categorisation of the OOH environments included in our work.
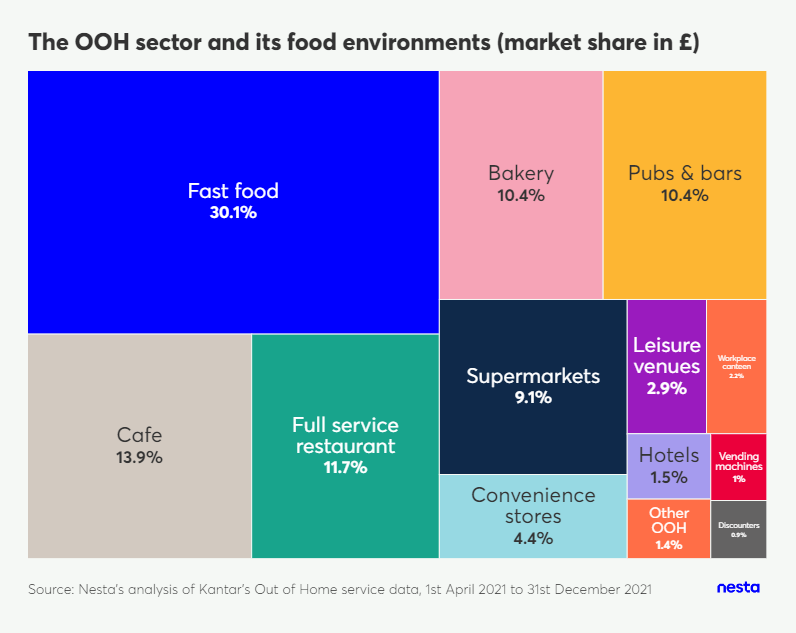
Figure 1. The OOH sector and all its food environments
Great Britain's OOH food and drink sector is well established and makes substantial contributions to the UK economy, in spite of having been hit during the COVID-19 pandemic. The total OOH food and drink market in Great Britain had a value of £43.8 billion in 2021 and grew by 23.1% compared to 2020. It is now inching towards pre-pandemic levels of £52.9 billion in 2019. The fast food and takeaway industry is the most dominant part of this market at £21.37 billion in 2022.
Why is OOH important? As a population, we are consuming too many additional calories, leading to high rates of excess weight: 64% of adults in England are living with overweight or obesity. The annual cost of adult obesity to UK society is estimated at around £98 billion, including at least £19.2 billion of costs to the NHS. Yet to halve obesity requires only small changes to diets: a person living with excess weight needs to reduce their calorie intake by only 8.5% or 216 calories per day (this figure is for England. For Scotland this number is 230 kcal). This is a relatively modest shift, yet we know that existing policies are not going to meet the scale of this challenge.
Eating out is a significant aspect in our interaction with the food environment and has been increasingly common over the last decade, at least. National Diets and Nutrition Survey data from 2008-2012 shows that a quarter of UK adults ate out once a week or more often. More recent data collected by the Food Standards Agency from 2016 showed this figure was 43%. We demonstrate that these figures are likely to be underestimates.
What is the policy/ regulatory landscape? Despite the regularity with which the population interacts with the OOH sector, regulation of dietary health to date has been focused on comparatively small parts of the OOH sector or has been voluntary and consequently relatively ineffective. * Calorie labelling rules are the only mandatory regulation in this space but apply to England alone and cover only about 545 businesses. * Voluntary schemes such as the Sugar (2016) and Calorie (2020) Reduction programmes (part of the Childhood Obesity Plan) in England have so far shown limited impact. * Scottish Government has signalled intent in the OOH space, such as through the Eating Out Eating Well Framework (part of the Diet and Healthy Weight Strategy, 2018), but to date the focus has been on voluntary measures or consultation on proposed mandatory policies. * Welsh Government also announced an intent to improve food environments, including OOH in the 2019 Healthy Weight Healthy Wales programme. Having consulted in 2022, actual change is still to be seen.
Data and approach
This report provides the most accurate picture to date of purchasing patterns in the OOH sector and how they contribute to Great Britain's calorie intake. In doing so it uncovers numerous novel insights.
Our core dataset is Kantar's OOH data for 1st April 2021 to 31st December 2021. This contains food and non-alcoholic drink sales data for a sample of 7,500 individuals aged 13+ in Great Britain. This particular analysis focused on a subset of these panellists, approximately 5,800, who were recording purchasing on a continuous basis for the lifetime of the project analysis period and met project eligibility criteria. Because it records sales, food that is consumed out of home but is not purchased (such as hospital and school meals) is not included. The dataset is a comprehensive, self-reported record of the food and drink people buy (excluding alcohol) but does not record nutritional data. We have augmented nutritional data through the use of four sources of calorie information - these include two additional datasets from Kantar, product data provided by NIQ Brandbank 2023 and the University of Cambridge's MenuTracker (Q1-4 of 2021), combined with data science methods such as fuzzy matching (see technical appendix). This achieved calorie information for a total of 95% of products and weight information for a total 93% of products. Calorie and weight information for the remaining products has been inferred by taking median values for the food and drink categories they belong to. In our final data we have complete values of calories and weight for all products purchased. We have used other analytical techniques to measure product bundles purchased and segment the users of the OOH sector according to the way they engage with it: more details can be found in the technical appendix.
All analysis and interpretation was conducted independently of Kantar. Kantar cannot independently verify the findings, nor can it endorse the views or findings of this report. Where data is sourced as Kantar, some elements have been augmented by data from additional sources.
We acknowledge that imputing missing values for such a large number of products (90% for calorie and 77% for weight information) increases the risk that there may be large margins of error around our figures. We have used a statistical technique called bootstrapping to understand the robustness of our main findings.
Of note, our data is for 2021, a year that saw several COVID-19 restrictions that negatively impacted the OOH sector. The size of the sector shrank in 2021 to £44 billion compared to £53 billion in 2019. Recent evidence from the Institute for Fiscal Studies suggests that while OOH purchases reduced substantially in the first half of 2021, they recovered by the end of the year. We calculated daily calorie estimates for each quarter of 2021 and observed that, in the first quarter of 2021, they were much lower than the rest of the year. This is in line with relaxation of COVID-19 restrictions, which began in April 2021 when hospitality venues were allowed to fully reopen. For this reason, in this report we restrict our reporting period to the April to December 2021 months only.
Our data generalises to OOH users, which means that those who do not engage with the OOH sector at all are not included. However, given the Food Standards Agency estimated that approximately 4% of the population never eats out, this does not affect the interpretation of our findings.
For detailed information regarding the sample size please see the technical appendix. For reporting of individual level purchases we use a sample size of 5,196 OOH users in Great Britain (4,559 of whom are resident in England, 236 in Wales and 401 in Scotland). Further for individual level analysis (see technical appendix), we have excluded respondents under 18 years of age. Due to small sample sizes we do not report individual level statistics broken down by nation. When reporting market statistics we rely on a sample of purchases from 5,392 individuals (4,732 individuals in England, 246 in Wales and 414 in Scotland). Market statistics figures are presented as Great Britain except for where we present the three nations separately to demonstrate important, valid differences. The validity of these comparisons is enabled through statistical weighting.
Key findings
Key finding 1: the OOH sector contributes on average about 300 calories per person per day to our diets.
Overall, we estimate that, on average, adult users of the OOH sector in Great Britain buy at least 296 calories per day per person (kcal/day/pp) in food and non-alcoholic drinks from the OOH sector. This figure is based on largely estimated calorie data and we calculate that a likely margin of error relating to our method of imputation is around 3% above and below this value within the range of 287 and 305 kcal/day/person. (Please see the technical appendix for a discussion of additional considerations relating to uncertainty such as sample selection criteria.)
It is difficult to make comparisons with published statistics due to differences in reporting periods and definition of what OOH consumption and purchasing entails. Nevertheless, our estimates are on a larger scale than is suggested by existing published information.
The National Diets and Nutrition Survey (NDNS) is a self-reported survey that reports consumption. From published NDNS 2020 data we calculate that adults in the UK consumed approximately 160 kcal/day/pp from the OOH sector. We calculate this figure by considering that adult individuals reported that 9% of all eating occasions involved the OOH sector (including food to go from supermarkets, takeaways and alcohol) and that, on average, an adult's overall intake is estimated around 1,780 kcal/day in this data. This calculation is likely an underestimate because it assumes that the energy content of eating occasions of out-of home and home-cooked food is the same, which is unlikely. After adjusting for under-reporting (based on the scale of under-reporting estimated by the Doubly Labelled Water NDNS study), the calculated figure was 211 kcal/day/pp. In seeking to draw a comparison we have used high-level assumptions (see technical appendix) to infer that our estimate for calories purchased would translate to 242 kcal/day/pp consumed, which is 15% higher than the adjusted NDNS value. Comparison is more challenging given 2020 included periods of lockdown and several weeks of the Eat Out to Help Out Scheme that encouraged eating out of home. Nonetheless, our figures are significantly higher than NDNS estimates and the difference is unlikely to be explained by changes in reference years alone but rather point to issues of under-reporting being more severe than previously thought.
Living Costs and Food Survey (LCFS) is a self-reported survey that reports purchases and estimated that in 2018-2019 the UK population purchased approximately 216 kcal/day/pp from OOH sources (excluding alcohol). However, there are several definitional differences that make this figure not directly comparable to that which we calculated from Kantar data. The most important difference is that LCFS considers takeaway food as part of household purchases instead of eating out so are not directly comparable.
Impact point: the contribution of the OOH sector to diets may be larger than official statistics suggest but comparison is challenging. The contribution is significant in the context of the required 216 kcal/day/pp needed to halve obesity. The contribution of the OOH sector to diets strengthens the case for the role that interventions in this sector could have in improving our diets and reducing obesity prevalence.
Key finding 2: the number of calories purchased daily from OOH is distributed very unevenly across the population. There is no obvious trend of who purchases very high amounts of calories or from where they purchase them.
The distribution of daily kcal purchased from food and non-alcoholic drinks in OOH settings is very uneven with about 40% of the population purchasing less than 50 kcal/day and about 15% purchasing more than 500 kcal/day. The median value of daily kcal purchased is 85, compared to an average (mean) of 296.
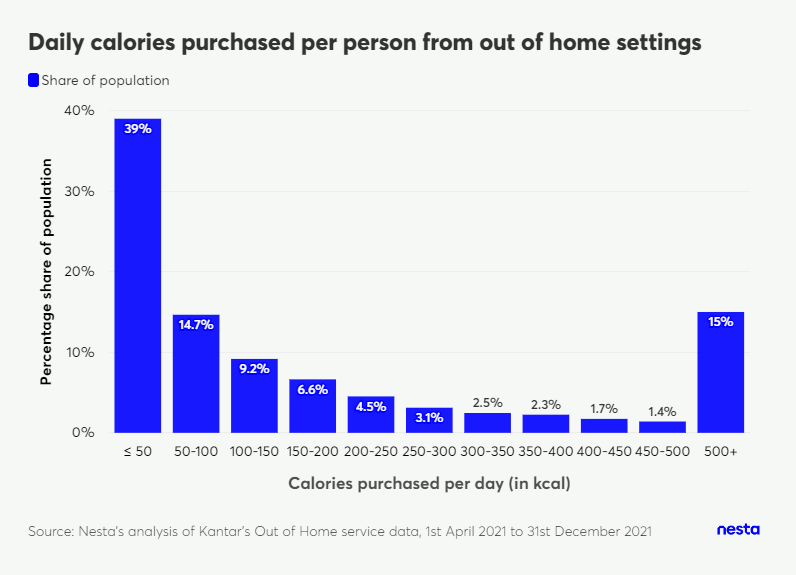
Figure 2. Daily kcal purchased per person on food and non-alcoholic drinks from OOH settings
We investigated where in the OOH sector the subgroup that purchases more than 500 kcal/day buys most of their calories. Unsurprisingly, a majority of this group (64%) make more than one trip per day. No single source of purchasing dominated the calorie purchases of this group (just over a third came from fast food and 18% from food-to-go items with the rest of their purchases accounted for by smaller shares over several types of settings). Although we found that certain socio-demographic groups were overrepresented in this population (they were more likely to be young, male and living in London), there was no single socio-demographic group dominating it.
Impact point: the fact that the distribution of daily calories is so uneven across the population raises the question of whether overall OOH calories consumed could be significantly reduced by targeting a small proportion of the population. However, this is unlikely to be feasible given there is no unique source of purchasing which dominates the purchasing behaviours of this group. This finding therefore supports the need for a population-wide approach to OOH intervention.
Key finding 3: most of the population uses the OOH sector at least once a week; a small proportion of the population uses OOH, on average, at least once a day.
The frequency of visits to OOH settings was very unevenly distributed. Approximately 60% of OOH users are using OOH at least once a week and, of those, 20% (11% of the total) use OOH at least once a day. Of course, ‘eating out' in this context includes grabbing a drink from a coffee chain or a sandwich from a supermarket.
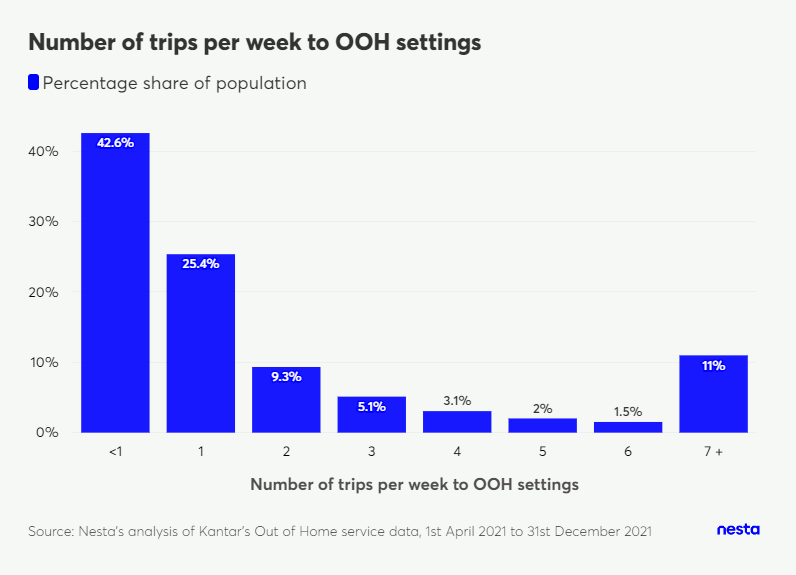
Figure 3. Frequency of trips per week to OOH setting for OOH users
Impact point: the fact that a majority of the population interacts with OOH each week lends weight to the potential impact of policy interventions. The uneven distribution of engagement with the OOH sector points to the fact that there is a subgroup of the population that relies heavily on this sector for their nutrition and intervening in this space may have a greater impact on this specific section of the population.
Key finding 4: fast food and food to go from supermarkets make up over half the total number of calories purchased in the OOH space.
Fast food (from independent businesses and chains) combined with food to go from supermarkets contribute the majority (52%) of the calories purchased from OOH in Great Britain. Full service restaurants and pubs make up a comparatively smaller proportion (13%).
At an individual level major supermarkets account for approximately 52 kcal per person per day (18% of total calories purchased). The fast food sector as a whole (chain and independent restaurants) accounts for approximately 101 kcal/pp/day (34% of total OOH calories purchased).
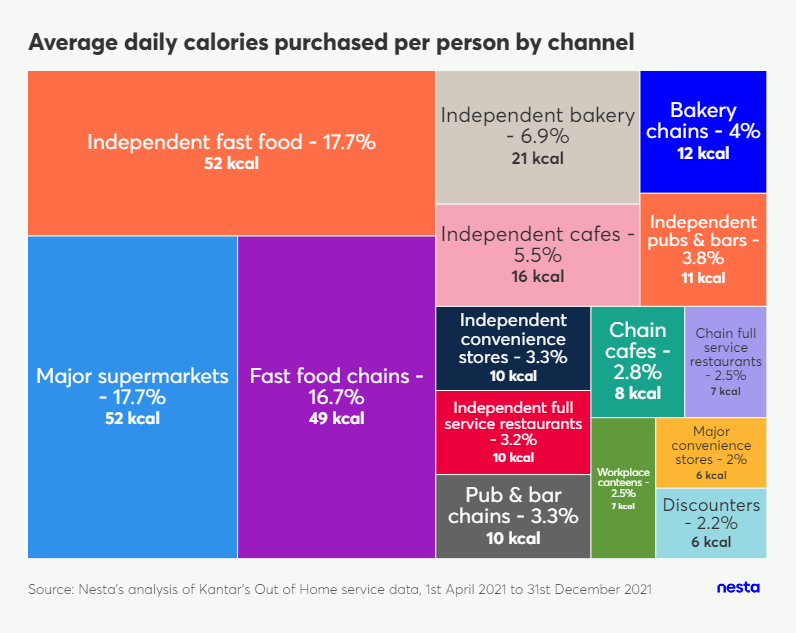
Figure 4. Share of calories purchased from each channel and corresponding daily average calories per person
Provision of nutritional information at the point of purchase is the only population-wide intervention in the OOH sector. It comes in the form of mandatory calorie labelling on menus for large businesses (more than 250 employees) in England and food labelling of packaged food and drinks, which applies throughout the UK.
To identify large businesses in our data we consider all chain establishments across several channels (fast food, full service restaurants, cafes). We estimate that these account for 30% of calories sold in England.
Channels that predominantly sell packaged food are supermarkets and other high street retailers such as chemists. We calculate that approximately 26% of calories purchased in the OOH sector come from these channels and so are likely to have food labelling information. We therefore estimate that 45% of OOH calories sold in England have no mandatory regulation restrictions (in the form of either calorie labelling) applied to them.
Impact point: while the OOH sector is indeed made up of many different businesses, our findings suggest that focusing regulation on only two sectors (fast food and supermarket food to go) would have an impact on over half our calorie purchasing as a nation from OOH.
To note, food to go sold in major supermarkets was not included in modelling and recommendations within our targeting health of the nation report. Nesta is currently working to understand what specific approaches could be taken to target the OOH sector and will consider food to go from retailers as part of that work, which will be published in due course.
Key finding 5: most meals exceed recommended intakes for an eating occasion; about 20% of meals are over half the recommended daily intake.
We have used a data science technique called association rule mining to understand the meals (as opposed to items, for which see later) we consume by considering what items are bought together. While others have examined the calorie content of listed restaurant chain meals and meal deals sold by retailers, we are the first (to our knowledge), to explore the actual combined purchases of a customer. In addition, by combining sales and nutritional data we present sales-weighted figures, which take into account the popularity of products.
Public Health England's ‘One You' guidance suggests that to avoid excess energy intake and maintain body weight, the energy intake through main meals (such as lunch and dinner) should be less than 600 kcals and the intake through snacks should be less than 400 kcals. We found that 60% of meals exceeded the recommended intake for a meal (600 kcal) and these make up over 80% of all calories sold.
Defining whether a meal is 'excessive' requires the context of what individuals eat during the rest of the day, or indeed the week (as well as other parameters such as physical activity and BMI), as one large meal might be followed by other smaller ones and so the total number of calories consumed over a period of time might be within healthy parameters. This is one of the aims of an ongoing Nesta project to understand the food we purchase as a nation across retail and out of home, which we will publish soon. However, while it is hard to know whether a meal containing 750 calories is unhealthy without knowing the rest of someone's diet, it is likely that a meal as large as 1,300 calories is excessive as this is over half the recommended daily intake. We found that ~20% of meals exceed 1,300 kcal and they made up 45% of calories sold in the sector: 60% of these high-calorie meals are sold in the fast food sector.
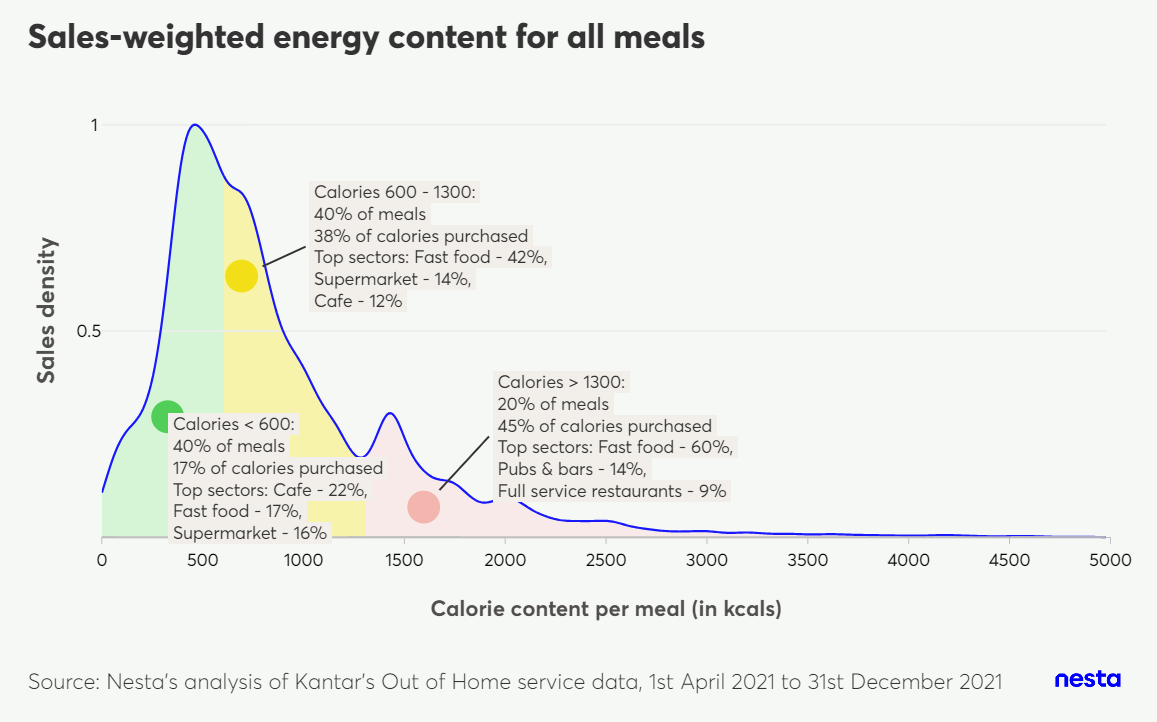
Figure 5. Distribution of sales-weighted energy content for all meals
When considering the channels that contribute the most to calories purchased overall, we find that meals purchased in fast food outlets have higher than average calorie content. Common meal purchases from fast food outlets have an average calorie content of 1,121 kcal with 32% of meals exceeding 1,300 kcal.
Table 1. Fast food meals contributing the most to kcal
| Eating occasion | Kcal as % of all kcal sold in fast food | Sales-weighted average kcal |
|---|---|---|
| Burger with a side and a soft drink | meal | 8.4% |
| Fish and chips | meal | 7.9% |
| Pizza with chips | meal | 4.7% |
| Burger, chicken nuggets, with a side and a soft drink | meal | 4.3% |
| Breakfast roll, coffee with a side | meal | 3.5% |
Source: Nesta's analysis of Kantar's Out of Home service data, 1st April 2021 to 31st December 2021
Common meal purchases from supermarkets, which are often subject to promotions, such as meal deals, have an average calorie content of 730 kcal.
Table 2. Supermarket meals contributing the most to kcal
| Eating occasion | Kcal as % of all kcal sold in supermarkets | Sales weighted average kcal |
|---|---|---|
| Soft drink and sandwich | meal | 7.0% |
| Crisps, soft drink and sandwich | meal | 6.6% |
| Crisps, fruit juice and sandwich | meal | 5.1% |
Source: Nesta's analysis of Kantar's Out of Home service data, 1st April 2021 to 31st December 2021
Impact point: in the context of a requisite 216 kcal reduction to halve obesity it is likely possible to make a meaningful 'absolute' reduction in calories purchased in OOH meals through small 'relative' reductions in portion size. These would not make a meaningful difference to the size of the meal and the joy taken from it (e.g. reducing a meal containing 3,000 kcal to 2,700 kcal is a significant reduction in absolute calories, while the meal remains enjoyable and filling).
Second, 'meal deals' and 'dine in for 2' promotions currently fall outside of current regulation of volume and price promotions. This finding should vindicate considerations by the Scottish Government, and intent announced by the Welsh Government, to include meal deals in forthcoming regulatory legislation.
Key finding 6: sandwiches are the single item which contribute the most calories purchased but other items such as pizza, burgers and fish are more likely to be driving our increasing obesity prevalence.
Food items, as opposed to drinks, contribute approximately 88% of all calories purchased in the OOH sector (excluding alcoholic beverages). Sandwiches and wraps contribute the largest share of calories among all food items (11%, 33 kcal/day/pp). The large contribution of sandwiches and wraps to calories purchased is due to these items being sold in large quantities rather than having a high median energy content.
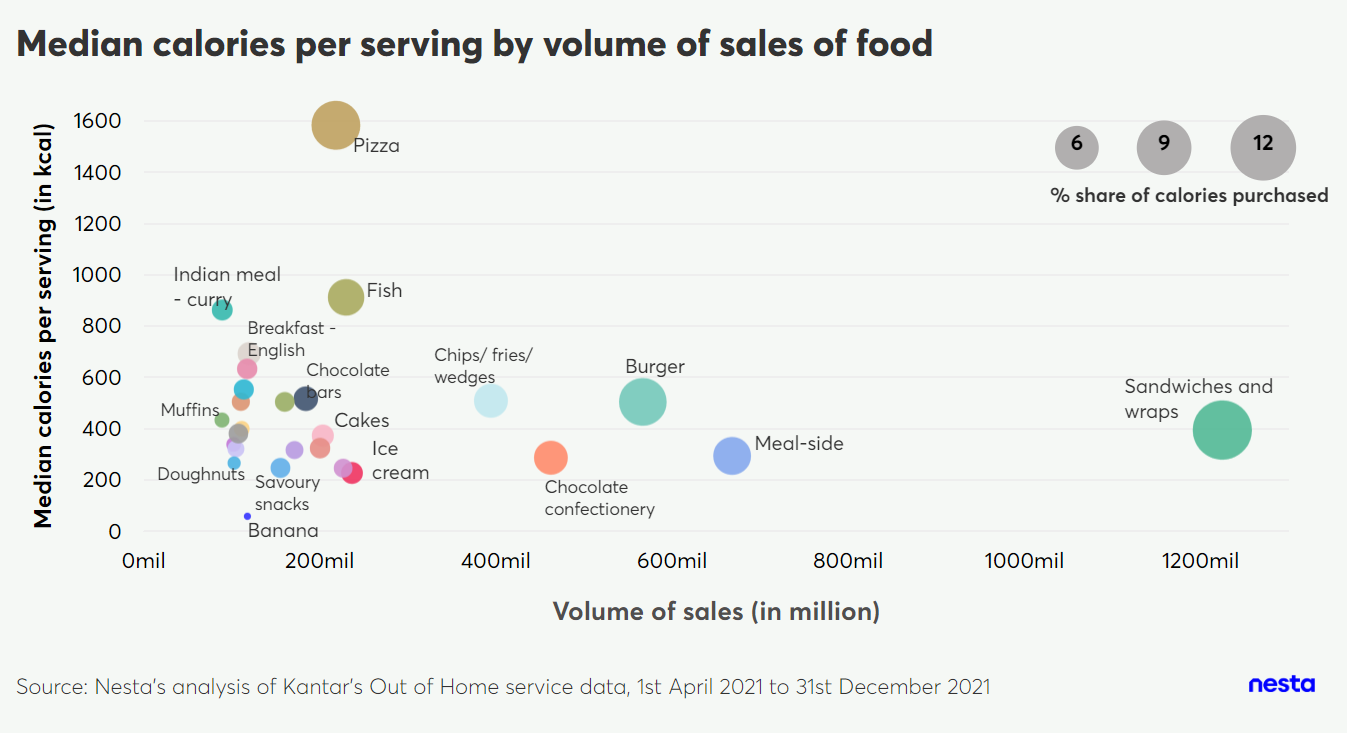
Figure 6. Bubble plot of median calories per serving of food items against sales volume
The range of calorie content of items is often broad. Looking at sales-weighted distributions (below) shows us that while this is true for sandwiches, the majority purchased are <600 kcal. Whereas for commonly sold items such as burger, fish and pizza, the proportion of sales well over 600 kcal is much higher.
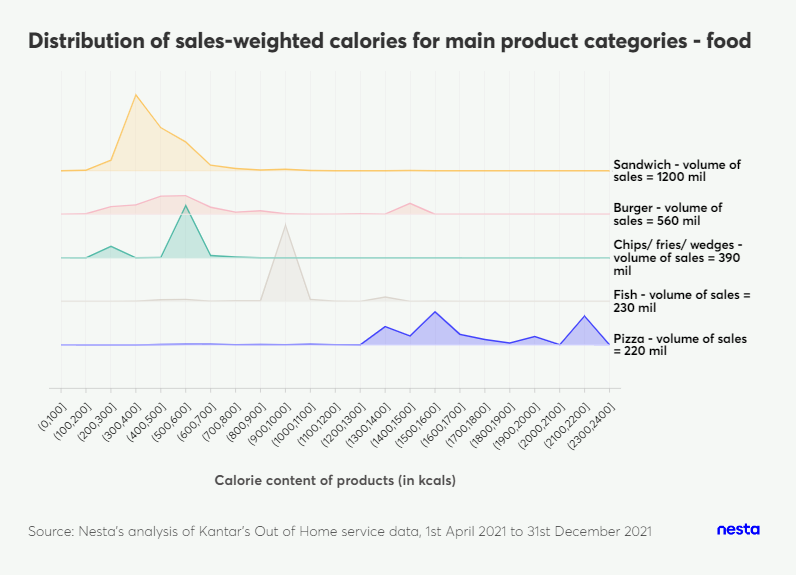
Figure 7. Distribution of sales-weighted calories per product of food categories that contribute the most to total calories purchased
Impact point: given the calorie content for many pizzas, burgers and fish (and other items) are significantly higher than recommended meal sizes it seems reasonable (even without understanding the rest of an individual's diet) to assume, firstly, that they are contributing a large number of excess calories to our diets and, secondly, that it would be possible to reduce item portion size by small amounts without changing the pleasure we derive from food. In so doing, small relative reductions in portion size could lead to a large absolute reduction in our calorie intake at population level.
While sandwiches contribute the most calories to our diets, it is less clear that they contribute a large amount of excess calories without understanding the rest of people's diets. It is certainly true that any approach that systematically reduced the calorie content of sandwiches could lead to very significant reductions in population level calorie intake (by virtue of the large sales volume) but that would only be the case if such reductions didn't lead to reduced satiety, which could lead to compensatory consumption of additional items.
Key finding 7: coffee-based drinks are the single item that contributes the most to OOH calories among all (non-alcoholic) drinks.
Non-alcoholic drinks contribute 12% of all calories purchased in the OOH sector (~36 kcal/day/pp). Coffee dominates the drinks category, comprising 4% of total calories. It is followed by fizzy soft drinks. Despite several reformulation efforts to reduce sugar and calories, these contribute 2.4% of all OOH calories. Within coffee purchases, there is large variation in their calories, with 10% of coffee drinks containing over 700 kcal.
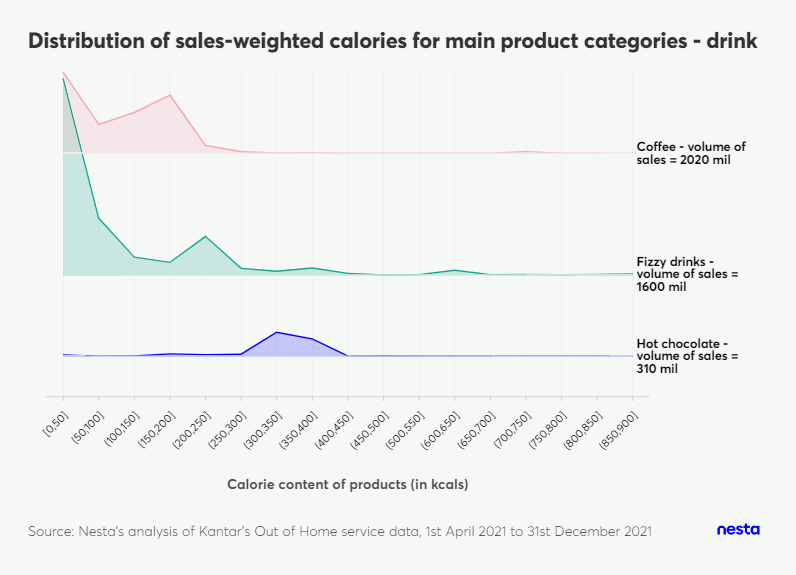
Figure 8. Distribution of sales-weighted calories per product of drink categories that contribute the most to total calories purchased

Figure 9. Bubble plot of median calories per serving of drink items against sales volume
Impact point: drinks with the highest median calories per serving (such as those with large proportions of milk, such as hot chocolate) and those that are most frequently purchased (coffee) both fall outside of the current Soft Drinks Industry Levy regulation as this applies to pre-packaged drinks but excludes milk-based drinks. Making small relative reductions in the calories of each could lead to large absolute overall calorie reductions at the population level.
Key finding 8: on average, people living with excess weight purchase more calories from fast food.
In our analysis we focused on identifying how buying fast food and food to go from major retail settings varies across a range of individual and household demographic characteristics. Profiling users of the OOH sector has been made possible with a data science technique called clustering.
Previous research has found that factors associated with higher frequency of eating out and relying more on the OOH sector for their calorie intake are being younger, having children, being in a physically active occupation and having higher BMI. There is also evidence that lower incomes and higher levels of deprivation are associated with increased consumption and exposure to fast food. We observe similar patterns in our data although not all associations reach statistical significance: statistically significant factors associated with purchasing more OOH calories are being of a younger age, living in London and living in more deprived neighbourhoods.
The share of calories purchased from fast food settings was higher among those living with excess weight, while the share of calories from major supermarkets was higher among those living with a healthy weight.
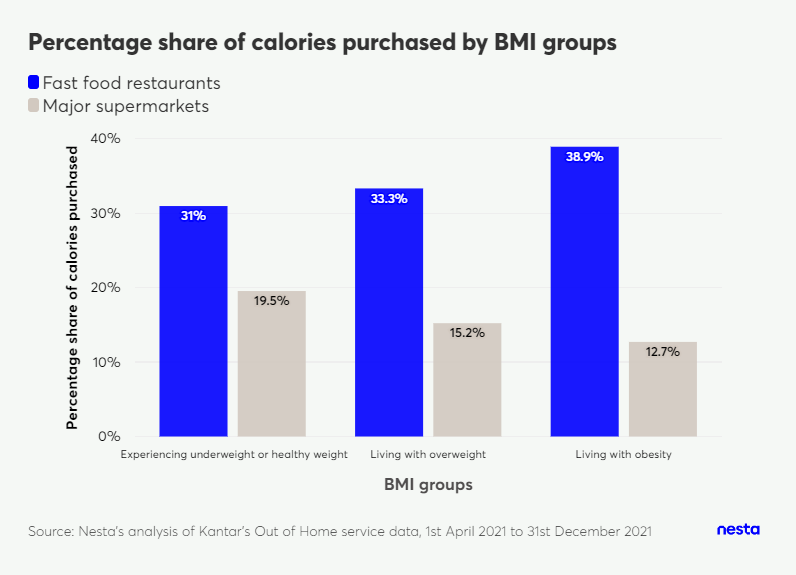
Figure 10. Share of calories purchased from fast food and major supermarkets by BMI group
Our segmentation analysis builds on these findings and reveals a group of younger people (approximately 13% of the population) whose only interaction with the OOH sector is purchasing food to go from retailers. In the appendix we report more information on how the segments were calculated.
Impact point: targeting intervention towards the fast food sector would likely impact people living with excess weight to a greater extent than interventions in major supermarkets.
Key finding 9: approximately 25% of the calories we purchased from fast food in 2021 were ordered digitally.
The fast food sector makes a large contribution to our diets (40.3% of total OOH calories). Within this sector, approximately 85% of calories purchased were in the form of takeaways (as opposed to being consumed on the premises of the restaurant where food preparation takes place) and about 42% of calories were purchased through a remote ordering method such as the internet or phone.
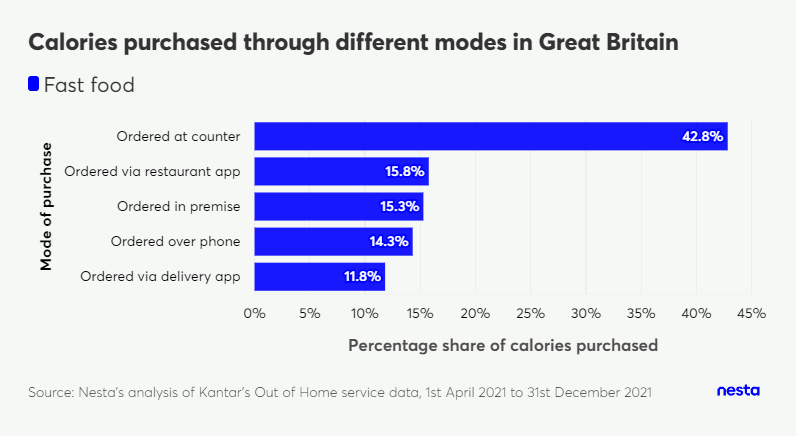
Figure 11. Share of fast food calories purchased by purchase mode in Great Britain
Restaurant-owned apps account for a slightly larger share of calories (16% of all calories purchased in the fast food sector) than the three major delivery apps (12%).
Given the recent trend in delivery app growth (there was an almost three-fold growth between 2020 and 2021) it is possible that this ranking might have changed, but the findings show that restaurant-owned apps play a significant role alongside the three major apps. Over 60% of sales through restaurant-owned apps are from three large fast food chains.
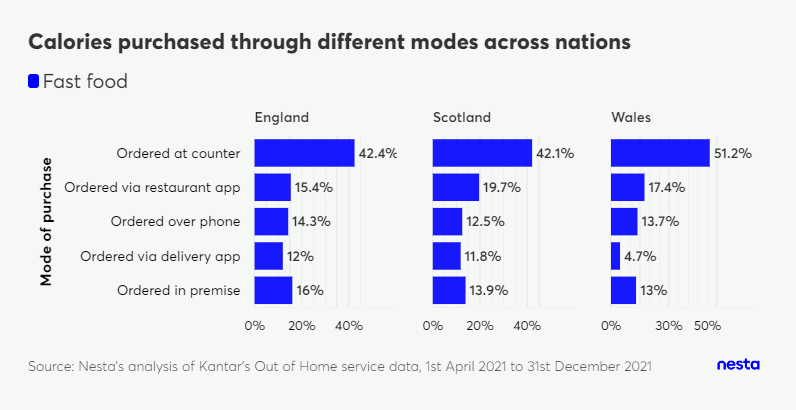
Figure 12. Share of fast food calories purchased by purchase mode for each nation
Figure 12 shows that delivery apps account for a smaller proportion of calories purchased in Wales than in England and Scotland with the three major delivery apps accounting for only around 5% of calories compared to around 12% in England and Scotland (in 2021).
Impact point: this is a space which may change rapidly in terms of overall scale and balance between restaurant-owned and independent delivery apps. Action by or regulation of the three major delivery apps could make a meaningful contribution to population calorie consumption. However, to have the greatest impact, action would need to include restaurant-owned apps.
Key finding 10: large portion sizes mean that density-based healthiness metrics are not, in isolation, an appropriate measure of healthiness for OOH.
Nutrient density-based metrics are commonly used to judge the healthiness of foods by government and businesses (this is the case for existing UK HFSS (high fat sugar salt) regulations). Indeed, we have endorsed their use in setting health targets for major retailers. The models rely mostly on nutrient and calorie density (the nutrients or calories per 100g) but they do not take into account the total quantity of a nutrient contained within the product. Separately a threshold of 400 kcal/100g is often used in scientific settings to determine if a food item is of high energy density. This section examines whether density-based metrics could be used to judge reliably the healthiness of food bought in the OOH sector.
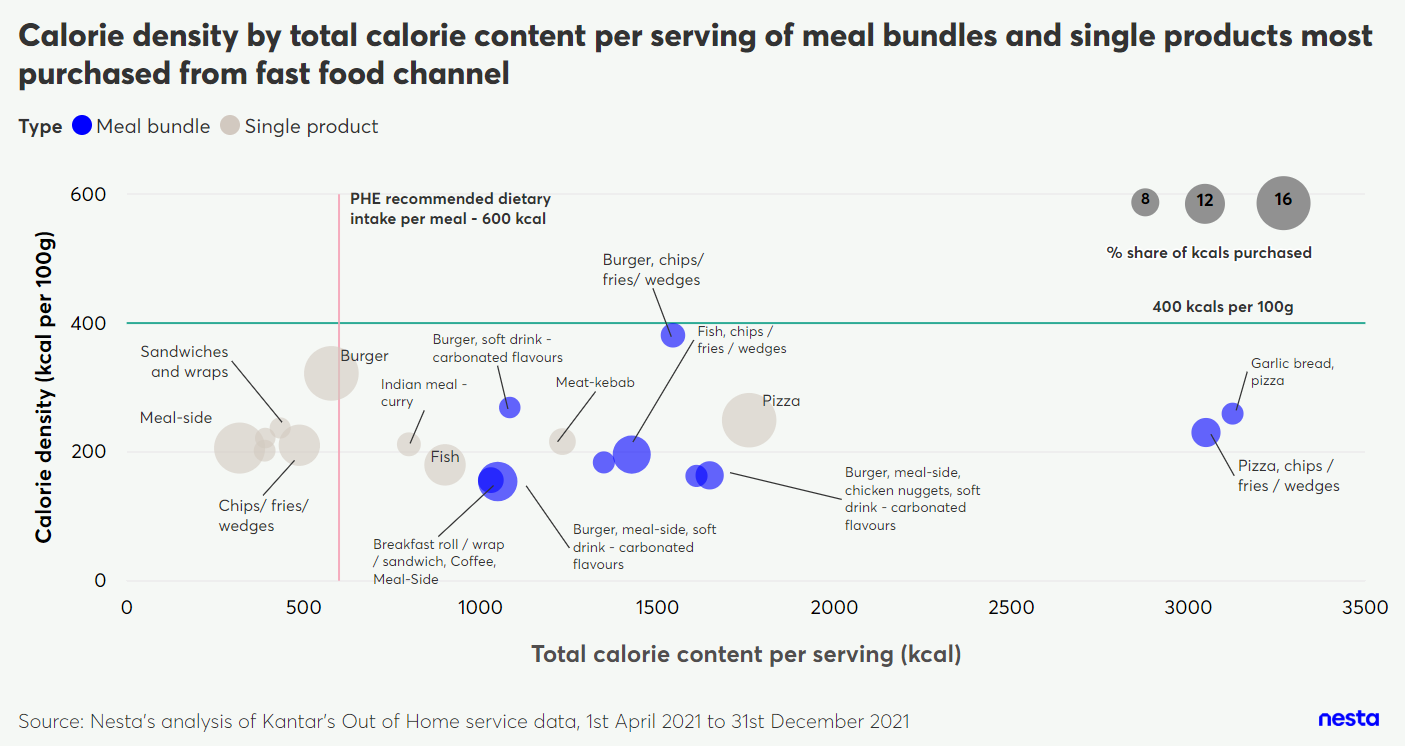
Figure 13. Bubble plot for calorie content and calorie density per meal for meals that contribute the largest amount of calories purchased
Our rich dataset has allowed us to calculate the calorie density of OOH meals. As the figure shows, while almost all meals were higher than the recommended number of calories per meal, almost all fell below a calorie density threshold of 400 kcal/100g. This shows that most meals simultaneously have 'excessive' total energy content and not 'high' energy density.
Impact point: this finding suggests that nutrient density-based measures in isolation are not enough to assess the healthiness of OOH meals and that portion size should be included in such an assessment. It may also be loosely inferred that portion size may be a more expedient policy approach than reformulation to increase the 'healthiness' of food in OOH.
Concluding remarks: what this might mean for policy in OOH
This report provides the most accurate and detailed view to date of the contribution the OOH sector makes to our diets. This contribution to population-level calorie consumption is significant in the context of a required reduction of 216 calories consumed per day for those living with excess weight to achieve a halving of the prevalence of obesity.
This sector is often perceived as one that is difficult to regulate or to intervene in by virtue of its heterogeneous and fragmented nature. While our findings support the need for action across the sector as a whole, they also highlight where such intervention could be most impactful at population level. This might be by focusing on fast food chain and independent sectors (which are quite frequently used and often contribute large numbers of excess calories to diets) or on food to go from retailers (where excess calorie contributions are likely less per trip but where the sheer volume of interactions is likely contributing a lot of excess calories to diets at population level). It is likely to be possible to make small reductions in the calorie content of items and meals, such as through portion size reduction, so that food would remain equally enjoyable but our population-level calorie consumption would reduce significantly.
In considering the possible future policy landscape for OOH there are examples of existing policies that could be expanded: for instance, the Soft Drinks Industry Levy could include some high calorie products commonly sold in OOH or mandatory calorie labelling could be expanded to additional venues. There is also legislation proposed by the Welsh Government to include meal deals in forthcoming regulatory legislation for retailers. While these would no doubt have some impact, this report draws attention to the fact that some sectors which likely contribute large quantities of excess calories to our diets remain subject to no or very light touch regulation.
We will explore and report on what approaches could be taken to use targets to most effectively increase the healthiness of sales in the OOH sector in a forthcoming publication.
This report suggests that change in the food we consume from OOH is possible in such a way that will not reduce the joy we take from it. This is the first of several publications on OOH you will see from us. We seek to partner with other organisations, such as industry, to understand and show that change is possible. If this is of interest we would love to hear from you!
58 Victoria Embankment London EC4Y 0DS +44 (0)20 7438 2500 [email protected] X@nesta_uk f nesta.uk www.nesta.org.uk ISBN: 978-1-916699-25-0
Nesta is a registered charity in England and Wales with company number 7706036 and charity number 1144091. Registered as a charity in Scotland number SC042833. Registered office: 58 Victoria Embankment, London EC4Y 0DS.


