Acknowledgements
This report was written by Nesta. The research team was led by Jonathan Bone with support from Codrina Cretu, Matt Stokes, Peter Baeck and Tom Symons. The authors would like to thank the many interviewees and roundtable participants who provided their input about what is most important to starting, sustaining and growing DSI initiatives and who helped shape the selection of indicators. We would also like to thank all those who responded to our surveys, and to Speedtest by Ookla for providing data on broadband and mobile internet speeds. Thanks also to our consortium partners, Nesta colleagues and others who provided valuable feedback and support throughout the framework development process, particularly Joel Klinger and Kostas Stathoulopoulos at Nesta, Massimo Menichinelli at Fab Lab Barcelona and Nicola Morelli at Aalborg University. Finally, thanks to the European Union's Horizon 2020 programme for its generous funding of the project.
Consortium partners
- nesta
- betterplace lab
- waag technology & society
- MAKE
- FAB LAB BARCELONA
- Barcelona Activa
- Fundacja ePaństwo
Funded by
Data partner
About DSI4EU
Building on five years of work led by Nesta in collaboration with DG CONNECT, the Horizon 2020-funded DSI4EU project is supporting digital social innovation in Europe to grow and scale through a combination of research, policy and practical support.
digitalsocial.eu
@DSI4EU
[email protected]
© European Union, 2019. This work is licensed under a Creative Commons AttributionNonCommercial-ShareAlike 4.0 International License.
DSISCALE, operating under the DSI4EU brand, is funded by the European Commission Directorate General for Communications Networks, Content & Technology, Net Futures, Administration and Finance, under Grant Agreement No. 780473.
The information, documentation and figures in this deliverable are written by the DSISCALE project consortium under EC grant agreement 780473 and do not necessarily reflect the views of the European Commission. The European Commission is not liable for any use that may be made of the information contained herein.
1. Executive summary
This executive summary provides a brief overview of the steps we took to compile the European Digital Social Innovation Index (EDSII).
1.1 Introduction
The European Digital Social Innovation Index (EDSII) contains composite indicators measuring how well the ecosystems of 60 cities in Europe support digital social innovation (DSI) — "a type of social and collaborative innovation in which innovators, users and communities collaborate using digital technologies to co-create knowledge and solutions for a wide range of social needs and at a scale and speed that was unimaginable before the rise of the Internet."
The aims of the index are five-fold:
1) Identify success factors for the creation, growth and sustainability of DSI.
2) Help policymakers understand how they can better support DSI, drawing upon successful examples from other places.
3) Incentivise the development and implementation of supportive policies.
4) Inform practitioners about where in Europe has the best conditions for supporting DSI, which may be influence where practitioners decide to set up or grow their initiatives.
5) Raise awareness about, and interest in, DSI among people, communities and organisations not currently involved in the field.
The index includes 60 cities in total: 26 of the capital cities in the EU28 (Valletta and Luxembourg City were excluded due to unavailability of data) and an additional 34 non-capital cities chosen based on population size, known DSI activity, score on other indexes related to innovation, availability of data, and to ensure good representation across all of Europe.
1.2 Methodology
Below the steps used in the construction of the index. We have adhered to the 'ideal sequence' of steps detailed in the JRC/OECD Handbook on constructing composite indicators to guide our process, and these are illustrated (Figure 1) and described briefly below.
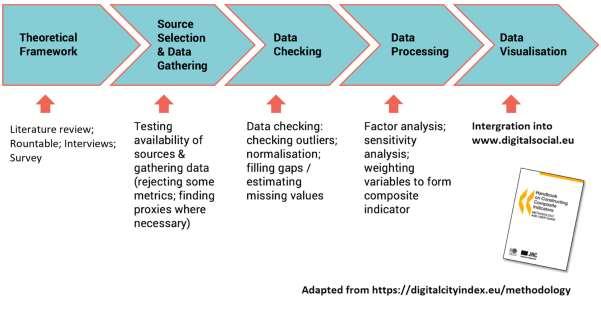
Adapted from https://digitalcityindex.eu/methodology
1.2.1 Theoretical Framework
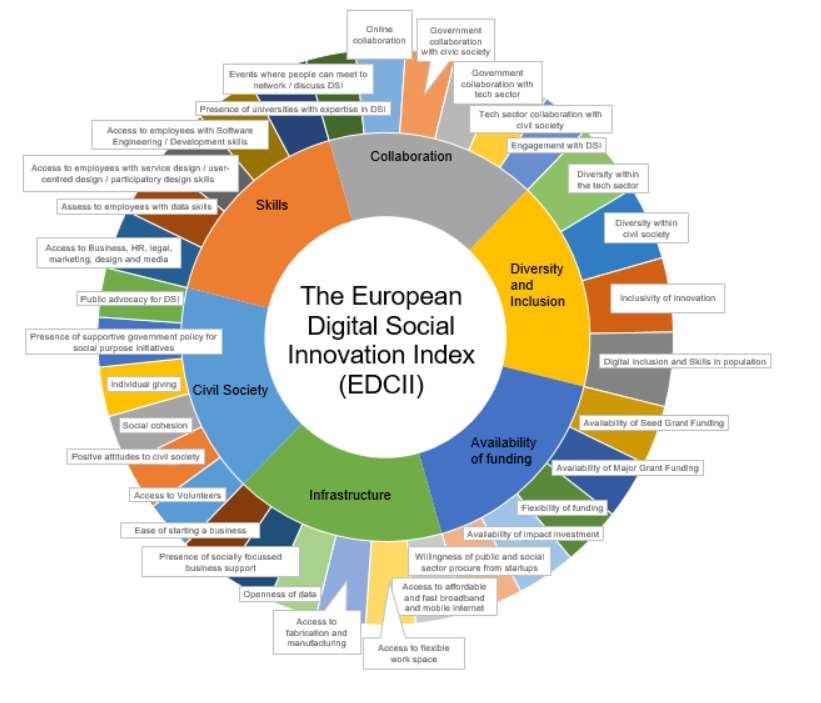
The theoretical framework for the EDSII was built based on 11 semi-structured interviews and a roundtable event with experts from across Europe, combined with a review of existing academic literature, policy reports, and other related indexes. This research was distilled to give us a clear definition and understanding of the phenomenon we are measuring, 'capacity to support DSI', and used to identify 32 indicators for inclusion in the index and to structure these indicators into six dimensions or 'themes' (Figure 2).
From our research it was that clear that some indicators and themes are more important in measuring capacity to support DSI than others. To reflect this, indicators and themes were given different weights which were used in the later aggregation stage. Weightings were chosen based on a survey of 114 DSI experts, alongside internal workshops.
1.2.2 Source selection & data gathering
A wide variety of data sources were used in the index, including publicly available data (e.g. from the EU and other public organisations) and commercial data, as well as primary data collected through web scraping, API queries and a survey of 143 researchers, practitioners, policymakers and other people interested in DSI. Data was denominated accordingly (e.g. by city population, working age population or purchasing power) in order to make comparisons across different sized cities meaningful.
1.2.3 Data checking
- Treatment of outliers: Outliers were identified as values which are more than 1.5 times the interquartile range (IQR) above the upper quartile or below the lower quartile. Upper-end outliers were transformed to have the same value as the largest non-outlier in that variable and lower-end outliers were transformed to have the same value as the smallest non-outlier.
- Normalisation: A Min-Max normalisation was used to scale variables to be within an identical [0.1, 0.9] range.
- Imputation of missing values: After the initial data gathering exercise, 4% of the data that was needed was missing. These gaps were scattered across multiple indicators and cities. In order to work with a complete dataset, missing data were replaced with estimates calculated using multiple regression. In order to take into account uncertainty about the missing data, five predictions were made and a mean of these five values replaced the missing value.
1.2.4 Data Processing
- Multivariate Analysis: Principal Components Analysis was used to explore the underlying structure of the data, particularly how different variables change in relation to each other and how they are associated. We also used a cluster analysis to give us some insight into which cities scores similarly across themes. In addition, we analysed the correlation between themes, and between themes and the overall index score by calculating Pearson correlation coefficients.
- Weighting and Aggregation: Indicators were aggregated using a weighted arithmetic mean to create theme scores. Theme scores were then aggregated using a weighted geometric mean to produce the overall index score. Using geometric aggregation meant that compensability is lower for theme scores with low value, so a city with a low score for one theme will need a much higher score on the others to improve its score. We believe that this reflects reality as our research suggested that all themes included in the Index are necessary to supporting DSI. Indicators and themes were weighted using weightings chosen in the earlier theoretical framework stage.
- Robustness and Sensitivity Analysis: The robustness and sensitivity analysis checked the effect of several methodological decisions made throughout the index development process on the ranking of cities (e.g. indicator selection and weighting, treatment of outliers, imputation of missing data and aggregation method).
- Index validation: As a means of validating the index we compared cities' scores with the number of DSI organisations located in each city that have entered their information onto the DSI4EU platform. We find a weak to moderate positive correlation.
1.2.5 Data visualisation
A visualisation was developed using Tableau data visualisation software and embedded into the digitalsocial.eu website. The data visualisation allows viewers to compare city scores and rankings for the overall index as well as for the individual themes. It also presents examples of strategies, policies and initiatives from across Europe which may help support DSI.
1.3 Challenges and limitations
We explore some of the reasons why EDSII scores do not correlate with DSI activity more strongly, including how favourable conditions for DSI do not necessarily lead to high levels of DSI if there is not a particular need for it (e.g. in places where there are social challenges are less major and/or urgent), potential issues around the choice of indicators, data quality and how indicators are weighed and aggregated. We also explore some of the challenges in producing an index measuring the capacity to support a project across a very broad range of technologies, organisation types, social challenges and stages of development.
1. Introduction
DSI4EU is an EU-funded project which aims to support policy makers, funders and practitioners to grow and scale digital social innovation (DSI) in Europe and to harness the power of people and technology to tackle some of Europe's biggest social and environmental challenges.
A key part of DSI4EU is to better understand the systemic and macro-level conditions which support the creation, growth and sustainability of DSI initiatives, and to analyse geographically how different parts of the European Union are positioned to support DSI initiatives. Much of this builds upon research carried out by the preceding DSI4EU project, which explored the challenges to growth for DSI at both the macro (system) and micro (project) levels. Building upon this, DSI4EU aims to use this analysis and understanding to influence and help policymakers (and other stakeholders) to proactively build ecosystems which are conducive to the growth of DSI.
The central activity within this area of work is the development of the experimental European Digital Social Innovation Index (EDSII), which aims to measure and compare the capacity of cities to support DSI. The aims of the index are explored below (Section 1.3).
Ultimately, our aim is to situate the Index within the wider framework of DS14EU's activities, including direct policy engagement with cities, the European Commission and national governments, practical support and peer learning for DSI practitioners and other stakeholders, creation of accessible research on the current DSI landscape and the future of DSI, and building a stronger network of DSI in Europe.
1.1 Background
Previous studies of DSI have tended to focus on measuring activity - the volume, geographical spread and characteristics of the DSI initiatives taking place around Europe. This has provided valuable insight and helped researchers, policymakers and other stakeholders to better understand and engage with the field. Nevertheless, there has been less research looking at the enabling and hindering factors behind this activity, exploring what helps or hinders DSI initiatives' creation and growth.
There are currently no comprehensive assessments, tools or methods for assessing the capacity of local, regional or national innovation ecosystems to support DSI initiatives.
A note on terminology
DSI is not the only term used to refer to the use of digital technology to address social challenges. 'Civic tech', 'tech for good' and 'social tech' are also used widely across Europe, and among many communities are much more widely recognised. For this reason, we have used these terms somewhat interchangeably in the development of the index and when speaking to people in the field. However, in the context of this report, we only use the term DSI.
1.3 Aims of the index
The purpose of the EDSII is to provide an open-source tool to measure and compare the capacity of cities to support DSI. This will support DSI projects and other stakeholders in the field in five ways:
1. Identify success factors for the creation, growth and sustainability of DSI. The Index has been produced by combining indicators for several key factors that are important to starting, sustaining and growing DSI projects. By identifying what these key factors are and disseminating our insights through the Index, we will enable a better understanding of the success factors for developing DSI ecosystems and raise awareness on how to spread and promote these conditions between funders, policymakers and other stakeholders.
2. Help policymakers understand how they can better support DSI, drawing upon successful examples from other places. The EDSII provides an overall score, allowing ecosystems in Europe to be ranked based on their capacity to support DSI at the city level. Alongside the overall score, a second output of the index is scores for how well ecosystems perform on different dimensions of the index. These dimensions, or themes, group several indicators, which together measure a particular aspect of an ecosystem's capacity to support DSI, for example, funding or skills. Using these themes, policy makers can use the index as a diagnostic tool to understand where their city is falling behind and thus what areas future policies should target for improvement. The Index is accompanied by the "Ideas Bank", a collection of case studies of supportive strategies, policies and initiatives from across Europe to enable sharing of best practice and replication/adaptation of successful experiences.
3. Incentivise the development and implementation of supportive policies. The scores allotted to ecosystems act as a competitive incentive for policymakers to implement supportive policies which aim to better support DSI within politicians and policy makers cities, regions or countries.
4. Inform practitioners about where in Europe has the best conditions for supporting DSI, which may influence where practitioners decide to set up or grow their initiatives. DSI initiatives are often set up in reaction to a particular local need. However, where there is some flexibility on where a DSI initiative could be located, or, more likely, where an existing initiative is looking to expand. The Index will provide practitioners with useful insight into where might be amenable for projects to locate or grow with maximum chances of success. Furthermore, the scores on individual themes will support practitioners to make informed decisions based on what is most relevant to their project's characteristics and needs.
5. Raise awareness about, and interest in, DSI among people, communities and organisations not currently involved in the field. By providing an accessible benchmark for how cities rank in their ability to support DSI, we hope the Index will spark wider conversations and interest - for example within the startup sector, governments and funding institutions.
1.4 What are composite indexes and why are they useful?
Composite indexes attempt to measure complex social or economic phenomena by combining several individual indicators which, individually, would not adequately describe the phenomenon in question. The individual indicators that make up the composite index are selected, combined and weighted based on an underlying model of the structure of the phenomenon that is being measured.
The EDSII adds to a growing list of composite indexes which aim to explore how different geographic regions compare against a wide range of complex issues with more or less relevance to the field of DSI, including:
None yet exists which is looking at DSI specifically, and our index aims to fill this gap.
1.4.1 The strengths of composite indexes
Composite indexes are useful in two particular cases: either when a single indicator could not conceivably measure the phenomenon due to its complexity and abstract nature; or when a single indicator is conceivable but would be too difficult or costly to measure.
While in theory we could scrutinise each indicator within a composite index individually (and indeed this is sometimes useful), combining them makes it much easier to interpret information without losing sight of, or access to, the underlying information.
Indexes are particularly powerful tools for policymaking when they are captured over multiple years, allowing trends to be identified. These trends can help draw policymakers' attention to particular issues or help them evaluate the impact of specific interventions. Country or city rankings based on index scores are especially good at attracting media attention, facilitating public discussion, promoting accountability and harnessing competitive spirits to motivate policymakers into action.,
1.4.2 The weaknesses of composite indexes
Composite indexes, like all models, are by necessary simplified versions of reality. And while it is this simplification that makes them useful, it means that in some sense they will always have their errors and misrepresentations. Like all models, composite indexes are created through a combination of science and art, and their construction necessarily entails numerous decisions (such as the choice and weighting of indicators) which are more or less subjective. Such decisions are not always clear cut and are almost always subject to debate. Getting these decisions wrong, or having to ignore indicators that are too difficult to measure, can result in simplistic or inappropriate policy messages.
Even if constructed as accurately as possible, problems may arise if policy conclusions drawn from composite indexes are (consciously or unconsciously) erroneous. The complexity of composite indexes means misrepresentation is an ever-present risk. For this reason, it is important that those producing indexes are transparent about the processes, methodologies, decisions and experts used in constructing them, and about what their limitations are. Composite indexes should not become "black boxes" whose users are blind to the decisions and processes behind the final numbers. And policymakers should not make any policy-decisions based on a single index (or model more generally).
1.5 Geographical coverage
65 European cities were carefully selected through consultations with our partners and a process of internal deliberation. These cities were selected based on population size, known DSI activity, score on other indexes related to innovation, availability of data and to ensure good representation across all of Europe and especially in traditionally underrepresented areas such as Eastern
and Central Europe. Five cities were later removed because of lack of good data: Valletta (Malta), Essen (Germany), Luxembourg City (Luxembourg), Naples (Italy) and Brno (Czech Republic). The remaining 60 cities included in the index are listed in table 1.
The EDSII focuses on ranking cities, rather than countries, for several reasons:
- This is in keeping with the principle of subsidiarity in policymaking, “the principle that social and political issues should be dealt with at the most immediate (or local) level that is consistent with their resolution”;
- DSI is particularly active at city level, due both to the challenges faced by cities (ranging from transport and air pollution to provision of healthcare, housing and education), and the density of people, assets, infrastructure, knowledge and skills which allows for collaborative technologies to thrive;
- Cities are increasingly becoming a hotbed for innovative policymaking and strategies (both in digital and non-digital policy);
- In many countries, although not all, cities have significant power over the policy decisions which affect people's day-to-day lives the most and effective ways of engaging with citizens.
Table 1. Cities chosen to be featured in the EDSII
| City |
Country |
City |
Country |
City |
Country |
City |
Country |
City |
Country |
| Vienna |
Austria |
Marseille |
France |
Leipzig |
Germany |
Rotterdam |
Netherlands |
Barcelona |
Spain |
| Brussels |
Belgium |
Nice |
France |
Munich |
Germany |
The Hague |
Netherlands |
Bilbao |
Spain |
| Ghent |
Belgium |
Paris |
France |
Stuttgart |
Germany |
Utrecht |
Netherlands |
Madrid |
Spain |
| Sofia |
Bulgaria |
Toulouse |
France |
Athens |
Greece |
Krakow |
Poland |
Gothenburg |
Sweden |
| Zagreb |
Croatia |
Berlin |
Germany |
Budapest |
Hungary |
Warsaw |
Poland |
Malmo |
Sweden |
| Nicosia |
Cyprus |
Cologne |
Germany |
Milan |
Italy |
Lisbon |
Portugal |
Stockholm |
Sweden |
| Prague |
Czechia |
Dortmund |
Germany |
Rome |
Italy |
Porto |
Portugal |
Belfast |
United Kingdom |
| Aarhus |
Denmark |
Dresden |
Germany |
Turin |
Italy |
Dublin |
Ireland |
Birmingham |
United Kingdom |
| Copenhagen |
Denmark |
Düsseldorf |
Germany |
Riga |
Latvia |
Bucharest |
Romania |
Bristol |
United Kingdom |
| Tallinn |
Estonia |
Frankfurt |
Germany |
Vilnius |
Lithuania |
Cluj-Napoca |
Romania |
Edinburgh |
United Kingdom |
| Helsinki |
Finland |
Hamburg |
Germany |
Amsterdam |
Netherlands |
Bratislava |
Slovakia |
London |
United Kingdom |
| Lyon |
France |
Karlsruhe |
Germany |
Eindhoven |
Netherlands |
Ljubljana |
Slovenia |
Manchester |
United Kingdom |
2. Methodology
The methodology followed when building the EDSII is based on that used for the European Digital City Index, which itself is adapted from the "ideal sequence" of steps detailed in the JRC/OECD Handbook on constructing composite indicators (Figure 1). In following this methodology and carefully documenting each stage of the process we have ensured the index is as robust and transparent as possible.
It is important to note that while Figure 1, and this document in general, presents this as a linear process in reality it was an iterative process where we were frequently required to revisit earlier steps.
2.1 Developing the theoretical framework
Throughout the development of the framework, we aimed to be as inclusive, transparent and open as possible, in keeping with the values of DSI and to create an Index which is not just useful but also accepted and welcomed as legitimate by different stakeholders in the DSI community.
2.1.1 Defining the concept
As discussed above, the index compares the capacity of cities to support DSI initiatives. Although DSI continues to evolve as a field, for this index we continue to use the definition first outlined in our first study on digital social innovation, published in 2015:
"A type of social and collaborative innovation in which innovators, users and communities collaborate using digital technologies to co-create knowledge and solutions for a wide range of social needs and at a scale and speed that was unimaginable before the rise of the Internet."
When we refer to the 'capacity to support', we are looking beyond top-down government level policy levers, considering ecosystem capacity in the broadest sense of the word. For this, we will analyse the DSI ecosystem as a whole including political, economic, social, cultural and technological factors affecting a city.
2.1.2 Themes and indicators
Indicators were selected through a literature review (see Appendix 1 for a selected literature review) and consultation with experts and stakeholders in DSI through 11 semi-structured interviews and a roundtable event.
An initial set of 69 possible indicators was narrowed down in an internal workshop at Nesta to 32 indicators to be included in the Index. Longlisted indicators were excluded from the shortlist because of either duplication (they were a subcategory of another indicator or were closely related to another indicator) or irrelevance (there was no strong link to DSI). These 32 indicators were then grouped by the research team into six themes (initially indicators were grouped into seven themes but one theme 'Support Systems' was later merged with the infrastructure and skills theme), grouped alongside other related indicators. The six themes are:
- Skills
- Infrastructure
- Funding
- Diversity and Inclusion
- Collaboration
- Civil Society
Below we describe and discuss the justification for the inclusion of the 32 indicators we have chosen. We discuss the indicators under the subheadings of the seven themes.
2.1.2.1 Skills
Anecdotal evidence suggests a wide range of both technical and non-technical skills are needed for DSI initiatives to thrive. Drawing upon literature exploring related fields like entrepreneurship, social impact and social innovation, we can distinguish a number of soft skills (e.g. communications, administration) and hard skills (e.g. programming, data skills) which are commonly used as a measurement of human capital, powering ecosystems and helping them to grow. Other literature highlights the importance of knowledge and skills as a requirement for grassroots innovation as well as a measurement of successful outcomes.
| Skills |
|
| Access to business, HR, legal, marketing, design and media support |
Growing DSI initiatives need access to people with a wide range of skill sets including HR, Legal, Marketing, Design, media and other business support professionals. |
| Access to employees with data skills |
Data is often at the core of DSI initiatives products and services. Therefore, having access to people with skills in collecting, manipulating, analysing and interpreting data is crucial. |
| Access to employees with service design skills |
DSI initiatives are able to meet their full potential when the product or service they offer is designed around the specific needs of their users and beneficiaries, which in turn requires people with service design skills. |
| Access to employees with software engineering/ development skills |
DSI initiatives are typically based around a mobile or web app which require software development skills to create. |
| Presence of universities with expertise in DSI |
Alongside doing research and teaching courses related to DSI, universities often hold events, provide equipment and workspace and collaborate with DSI initiatives. |
2.1.2.2 Civil society
Most DSI originates within civil society in its broadest sense, ranging from large charities to informal community groups. Through our review of literature and interviews, we found that an active, trusted and developed civil society is important in encouraging the creation of DSI and in encouraging citizen engagement in DSI. A culture of donating money and volunteering is important to supporting DSI initiatives and is indicative of public engagement in social causes more generally.
| Civil Society |
|
| Access to volunteers |
DSI initiatives often rely on the support of volunteers. Alongside this, a culture of volunteering indicates an active civil society and public engagement in social causes. |
| Positive attitudes to civil society |
As DSI tends to be bottom-up and citizen-driven, positive attitudes towards civil society would be expected to in turn generate trust in, enthusiasm for and active involvement in DSI initiatives from citizens. |
| Social cohesion |
A cohesive society is essential for communities to come together to discuss and solve common problems, which in turn is important for DSI initiatives to grow and deliver impact. |
| Individual giving |
Donations from individuals can help fund DSI initiatives but perhaps more importantly they indicate an active engagement in civil society by the public. |
| Public advocacy for DSI |
Public advocacy from politicians and other public figures can raise awareness about DSI, encourage people to innovate and get involved in DSI, drive funding towards DSI, promote the adoption of supportive policies and attract other stakeholders such as funders and researchers. |
| Presence of supportive government policy for social purpose initiatives |
Governments can help DSI initiatives to thrive through supportive policies such as defining legal forms which make it easier to set up and run social initiatives, providing tax relief for social initiatives and investors, and offering grants, loans and investment to social initiatives. |
2.1.2.3 Collaboration
Given the open and multidisciplinary nature of DSI, collaboration (both online and offline) is a key success factor. DSI works best when a diverse group of people with different expertise (such as technology, social challenges and provision of public services) work together.
We know that explicitly outward-looking technologies which are powered by, and drive, collaboration are at the heart of DSI. As the DSI ecosystem remains relatively fragmented, it can be difficult for practitioners to identify, learn from and collaborate with similar projects. Collaboration and sharing of knowledge and best practice between policymakers, practitioners, investors and other stakeholders is key to enabling peer learning and supporting the sustainable growth of DSI (and something which we aim to facilitate through DSI4EU).
| Collaboration |
|
| Events where people can meet to network and discuss DSI |
Events relevant to DSI are important for those interested and involved in the field (and related fields) to share knowledge, network and collaborate. |
| Online collaboration |
As DSI is technology-based and open, online collaboration is common, including for software development on platforms such as GitHub. |
| Government collaboration with civil society |
These three sectors are at the heart of DSI, and collaboration between all three – both bilaterally and as a group – is imperative for DSI to grow and scale its impact. |
| Government collaboration with tech sector |
|
| Civil society collaboration with tech sector |
|
| Engagement with DSI |
An active community of people talking about DSI can help foster informal sharing of knowledge, collaboration, and uptake by potential users. |
2.1.2.4 Funding
Unsurprisingly, experts consistently said that the availability of funding is important for DSI initiatives at all stages of development. Grant funding in particular was highlighted as being crucial to starting and sustaining initiatives. Beyond grant funding, DSI initiatives which have potential to create financial as well as social returns may also look to raise larger amounts of money by selling equity in their business. With this in mind several interviewees suggested the importance of an active impact investment scene.
Further to this, entrepreneurship literature has highlighted the huge benefits associated with procurement from large organisations, helping startups scale up their operations and conveying validation to potential future customers. A large number of DSI initiatives work in fields where the public and social sector holds a monopoly, such as in healthcare, education and employment support. It is for this reason why we have included an indicator measuring the 'Willingness of public and social sector procure from startups'.
| Funding |
|
| Availability of seed grant funding |
Access to relatively small amount of grant funding is needed get early stage initiatives off the ground. Here we are talking about grants of less than €200,000. |
| Availability of major grant funding |
Access to larger grants is needed to fund established DSI initiatives to scale their project and impact. Here we are talking about grants of more than €200,000. |
| Flexibility / ability of grant funding to support DSI |
Flexible funding allows agile product and service development and enables smaller organisations, citizen groups and collaborative projects to access funding. |
| Availability of impact investment |
Impact investors can, in return for equity or debt, provide the investment needed to enable DSI initiatives to grow, but also often provide mentoring and guidance helping DSI initiatives to build a sustainable business model. |
| Willingness of public and social sector to procure from startups |
Accessing procurement and commissioning is often the only way in which DSI initiatives are able to deliver at scale. In turn, DSI has the potential to enable public services to be delivered more efficiently and to involve citizens as co-creators rather than just users of services. |
2.1.2.5 Infrastructure
DSI initiatives' creation, growth and sustainability is enabled by good infrastructure: digital (such as broadband and mobile internet and provision of open data), physical (such as workspaces, accelerators, makerspaces, fablabs) and process-related (such as those involved in setting up a business). While data is not often treated as infrastructure, as the Open Data Institute points out, 'Data is as important as our road, railway and energy networks and should be treated as such'. And in order to maximise data use and value, we need not only data assets but also the organisations that operate and maintain them, and guides describing how to use and manage the data.
| Infrastructure |
|
| Access to affordable and fast broadband and mobile internet |
DSI initiatives are typically based around a mobile or web app and therefore access to affordable and fast broadband and mobile internet is essential to potential developers and users. |
| Access to flexible workspace |
DSI initiatives often rely on shared and flexible office space as a place to work, hold meetings and network, especially in early days. Alongside this, flexible workspaces facilitate the exchange of ideas and collaboration between people with different skills and from different sectors. |
| Access to fabrication and manufacturing facilities |
DSI includes hardware as well as software-based initiatives (particularly open hardware). For this reason, it is important that spaces are available where users and producers can access fabrication equipment such as 3D printers, laser cutters and milling stations allowing them to prototype, manufacture and co-create innovations. Examples of such spaces include makerspaces, Fab Labs, hackerspaces and DIY Biolabs. |
| Presence of socially focussed business support |
Support includes that offered by accelerators, incubators and other initiatives (mentoring, workshops, training programmes etc.) |
| Openness of data |
The accessibility and quality of open data (i.e. data which anyone is free to access, use, modify, and share) is important to the DSI community: it can be used to help develop new products and services; and opening up government data increases transparency which is generally considered positive. |
| Ease of starting a business |
While the most grassroots DSI initiatives may not have legal structures, it is almost always important if initiatives want to scale their impact and access funding. DSI will be more able to grow if it is easy, trusted and cheap to set up a business. |
2.1.2.6 Diversity and inclusion
Diverse and inclusive communities, environments and sectors (of different genders, sexes, ethnicities, sexual orientations, abilities, ages etc.) lead to better, more sustainable DSI initiatives. A myriad of studies has shown that more diverse and inclusive companies and sectors are more innovative.[^39] This is likely because more diverse groups encompass and bring with them a wider range of interests, experiences, backgrounds and ideas. Diversity is particularly important in the field of DSI where minority groups are more likely to have lived experience of the social challenges which DSI tries to tackle.
Furthermore, digital inclusion and digital skills among the population are important for DSI to grow because for DSI to deliver impact equitably it must be open and accessible to everyone, regardless of age, ethnicity, ability, gender, income or location. Indeed, emerging research from the civic technology community suggests that without digital inclusion, digital technologies can replicate or even exacerbate existing patterns of inequality and discrimination.[^40]
| Diversity and Inclusion |
|
| Diversity within the tech sector |
Greater diversity within these sectors suggests more progressive practices and a more inclusive culture. This has been shown to promote innovation but is also important because minority groups are more likely to have lived experience of the social challenges which DSI tries to tackle. |
| Diversity within civil society |
|
| Inclusiveness of innovation |
DSI is more likely to grow in an environment where all segments of society are able and encouraged to innovate. Places can promote inclusive innovation through policies and initiatives e.g. targeted grants, entrepreneurship education and extra-curricular outreach for young people. |
| Digital inclusion and skills in population |
Societies must be skilled in and have access to digital technology if everyone is to benefit from DSI initiatives, particularly vulnerable groups who often have most to gain from DSI. A digitally-skilled population is also likely to be more innovative. |
2.1.3 Weighting indicators and themes
The index takes a "nested" structure. Within this structure, each indicator has a score; these scores were combined to give a score for each theme; these theme scores were then combined to give a score for the index as a whole.
While some indexes weight individual indicators as equally important for the overall index score, it was clear from the literature review and interviews that some themes and indicators are more important than others. We therefore decided to assign indicators different weights when combined into the overall index score.
In order to determine how indicators and themes should be weighted, we conducted a survey in which 114 DSI practitioners, public sector employees, researchers, intermediaries, funders and policymakers were asked to rank the themes and indicators in order of their importance to supporting DSI. We used the median ranks given to themes and indicators to inform their relative weightings.
When ranking indicators, survey respondents were only told what the indicators would be measuring (e.g. “Public advocacy for DSI"), not how exactly they would be measured (e.g. "Number of articles which mentioned a DSI related keyword over the last 12 months at the country level"). This means that the weights given by respondents did not take into account the quality of the data sources to be used in the index.
In response to this, weightings were revised after source selection and data collection. We weighted down indicators for which we had concerns about the data's relevance to the indicator, analytical soundness, geographical coverage or age. Downweighting an indicator involved giving that indicator the same weight as that of the next highest weighted indicator in the same theme. Where the indicator already had the lowest weighting in that theme, we decreased its weight by the average difference between indicator's weightings in the theme.
The final weightings used to aggregate indicators into themes and themes into the final ranking can be found in tables 2 to 7.
2.2 Source selection and data gathering
2.2.1 Data sources
Data sources for each indicator were chosen based on four criteria:
- their relevance to the indicator;
- analytical soundness;
- geographical coverage;
- their relationship to other indicators being considered.
A wide variety of data sources were considered during this stage including publicly available data (e.g. from the EU and other public organisations) and commercial data, as well as primary data collected through web scraping and API queries. In some cases, data sources were other indexes identified through the literature review. Also, for some of the 32 indicators, we combined multiple variables. This means that the index is made up of a total of 49 variables.
Occasionally we were unable to find either a direct measure or a proxy measure for an indicator that was identified as being important during the theoretical framework development. In order to collect data for these indicators we conducted a survey of 143 researchers, practitioners, policymakers, support organisations, funders or people otherwise interested in DSI from around Europe. In Tables 2-7 below, indicators using data from this survey are marked 'primary research' in the data source column.
It is important to note that the relevance of data sources to indicators is, to some extent, subjective and so the pros and cons of different data sources was discussed among the research team before final choices were made. Where indicators are dependent on, or affected by, size-related factors or the cost of goods or services in a particular country, they were scaled by a factor (e.g. working population or purchasing power parity) to compensate for this.
Below we present information on the variables used for each indicator:
Table 2. Civil society (weighing = 20%)
| Indicator name |
Indicator description |
Indicator weight |
Measure used |
Year |
Data source |
Geographic granularity |
Geographic coverage |
Comments |
| Access to Volunteers |
DSI initiatives often rely on the support of volunteers. Alongside this, a culture of volunteering indicates an active civil society and public engagement in social causes. |
18.18% |
Percentage of population (16 years +) that participate in formal volunteering activities. |
2015 |
European Community Household Panel (ECHP) |
Country |
Countries of all cities included in the index are covered. |
Data is also available at a more granular regional (NUTS 1) level with approval from Eurostat. However, we were unable to get approval to use this data in time for publication of the index. |
| Positive attitudes to civil society |
As DSI tends to be bottom-up and citizen-driven, positive attitudes towards civil society would be expected to in turn generate trust in, enthusiasm for and active involvement in DSI initiatives from citizens. |
18.18% |
Percentage of survey respondents that reported to agree or strongly agree that they share the values or interests of NGOs in their region and trust them to act in the right way to influence political decision making |
2014 |
Flash Eurobarometer 373 |
Varies (NUTS1/ NUTS2 / NUTS3) |
Missing data for Croatia (Zagreb). |
Civil Society is broader than just NGOs and includes other types of organisations not referred to in the question, ranging from large charities to informal community groups. Also, sharing the values or interests of NGOs and trusting them to act in the right way to influence political decision making is not exactly the same as having a more general positive attitude towards them and their work. However, on balance this is a good proxy measure. |
| Social cohesion |
Social cohesion is defined as the willingness of members of a society to cooperate with each other in order to survive and prosper. A cohesive society is essential for communities to come together to discuss and solve common problems, which in turn is important for DSI initiatives to grow and deliver impact. |
18.18% |
Quality of support network measured by percentage answering 'yes' to survey question asking, "if you were in trouble, do you have relatives or friends you can count on to help you whenever you need them, or not?" |
2014 |
OECD Regional Wellbeing Index |
NUTS1 |
Data missing for: Romania (Bucharest, Cluj-Napoca), Cyprus (Nicosia), Latvia (Riga), Bulgaria (Sofia), Lithuania (Vilnius), Croatia (Zagreb). |
Several factors are involved in creating a cohesive society. To take into account these various factors, we combined variables of 4 factors commonly associated with social cohesion: quality of support network, identity, civic engagement and trust in people. |
|
|
|
Identity measured by percentage of respondents that answered 'Fairly attached', 'Very attached' to question asking how attached they feel to their city. |
2017 |
Eurobarometer 83.3 |
NUTS1 |
Regions of all cities included in the index are covered. |
|
|
|
|
Civic engagement measured by voter turnout at last national election. |
2014 |
OECD Regional Wellbeing Index |
NUTS1 |
Data missing for: Romania, Cyprus, Bulgaria, and Croatia. |
|
| Individual giving |
Donations from individuals can help fund DSI initiatives but perhaps more importantly they indicate an active engagement in civil society by the public. |
9.09% |
Score from indicator on donating money to charity. This indicator was based on responses to the survey question: "Did you donate money to charity last 12 months (yes / no)" |
2016 |
CAF - World Giving Index |
Country |
Countries of all cities included in the index are covered. |
We considered combining this data with data on donation-based crowdfunding, however, we were unable to find robust data for crowdfunding with good geographical coverage. |
| Public advocacy for DSI (e.g from political / leading figures) |
Public advocacy from politicians and other public figures can raise awareness about DSI, encourage people to innovate and get involved in DSI, drive funding towards DSI, promote the adoption of other supportive policies and attract other stakeholders such as funders and researchers. |
|
Response to survey question asking the extent to which respondents agree or disagree that DSI and related fields (i.e. civic tech, gov tech etc.) are regularly spoken about by politicians, public figures and in the media. |
2019 |
Primary research |
Country |
Missing data for Denmark (Aarhus, Copenhagen), Slovakia (Bratislava), Czech Republic (Prague), Finland (Helsinki), Slovenia (Ljubljana), Estonia (Tallinn), Latvia (Riga), Austria (Vienna) and Lithuania (Vilnius). |
City-level data would have been preferable but due to the relatively small number of survey respondents, this was not possible. Only data from countries which had at least 3 survey responses were included. This means that unfortunately country coverage was not particularly good for this variable. Furthermore, the threshold of 3 responses for inclusion is quite low. This means that for some countries the averages calculated for this variable were generated from a relatively small number of data points. |
medium-sized city might have one or two fablabs, but we would not necessarily expect a city with five times the population to have five times as many fablabs. For this reason, we did not standardise these variables by city population, as we did for some other variables. It is hard to distinguish for which variables this would be the case but decided that it was more likely to be true for those for which absolute numbers are small. We therefore decided not to standardise count variables for which the maximum count number is less than 25 - still somewhat arbitrary, but in our opinion the most sensible option.
| Indicator name |
Indicator description |
Indicator weight |
Measure used |
Year |
Data source |
Geographic granularity |
Geographic coverage |
Comments |
| Presence of supportive government policy for social purpose initiatives |
Governments can help DSI initiatives to thrive through supportive policies such as defining legal forms which make it easier to setup and run social initiatives, providing tax relief for social initiatives and investors, and offering grants, loans and investment to social initiatives. |
18.18% |
Response to survey question asking the extent to which respondents agree or disagree that government policies are supportive of social purpose initiatives, social innovation and social enterprise through policies such as specific legal forms, tax relief and fiscal incentives or financing mechanisms. |
2019 |
Primary research |
Country |
See above. |
See above. |
3. Collaboration
| Indicator name |
Indicator description |
Indicator weight |
Measure used |
Year |
Data source |
Geographic granularity |
Geographic coverage |
Comments |
| Events where people can meet to network / discuss DSI |
Events relevant to DSI are important for those interested and involved in the field (and related fields) to share knowledge, network and collaborate. |
5.26% |
Number of events with focus on DSI on meetups.com and eventbrite.com (per capita). |
2018 |
Meetup API / Eventbrite API |
City |
All cities in index covered in theory though for some cities we were unable to identify any DSI events. |
DSI events were identified based on whether they contained any of a list of DSI related keywords in their titles (see Appendix 2 for list of keywords). We combined data from more than one events platform to try and control for the fact that penetration of a single platform is unlikely to be uniform across Europe. However, even with two platforms included this may still create bias in the data. For example, Facebook is a popular platform for organising events, especially in Eastern Europe, however we were unable to get access to the Facebook API. As mentioned above the choice of keywords may also have created bias. Data from meetups.com includes all events over the last three months within the 'Tech' category. Data from Eventbrite includes only upcoming events but includes events from the following categories: 'Business & Professional', 'Community & Culture', 'Science & Technology',' Charity & Causes' and 'Government & Politics'. |
| Online collaboration |
As DSI is technology-based and open, online collaboration is common, including for software development on platforms such as GitHub. While online collaboration is not necessarily place-based, the use of collaborative platforms in a location may indicate a culture of collaboration. |
10.52% |
Number of GitHub users with projects containing DSI related keywords in their descriptions based in city (per capita). |
2018 |
GitHub API |
City |
All cities in index covered in theory though for some cities we were unable to identify any GitHub users. |
Although GitHub is by far the largest host of source code in the world, other platforms for collaborative coding are available. Usage of GitHub rather than these other platforms may vary across Europe creating bias in this data. Alongside this, one again, the choice of keywords may create further bias (see Appendix 2 for list of keywords). Users are not required to share their location, so this data only represents a sample of the total number of users in each city. |
| Indicator name |
Indicator description |
Indicator weight |
Measure used |
Year |
Data source |
Geographic granularity |
Geographic coverage |
Comments |
| Tech sector collaboration with civil society |
DSI works best when those with in depth knowledge of social issues are able to collaborate with people with technical expertise. |
21.05% |
Response to survey question asking the extent to which respondents agree or disagree that civil society organisations (charities, NGOs and volunteer based organisations) and the tech sector work collaboratively on DSI, for example through funding, collaborative projects, subsidised service provision and events. |
2019 |
Primary research |
Country |
Missing data for Denmark (Aarhus, Copenhagen), Slovakia (Bratislava), Czech Republic (Prague), Finland (Helsinki), Slovenia (Ljubljana), Estonia (Tallinn), Latvia (Riga), Austria (Vienna) and Lithuania (Vilnius). |
As above, city-level data would have been preferable but due to the relatively small number of survey respondents, this was not possible. Only data from countries which had at least 3 survey responses were included. This means that unfortunately country coverage was not particularly good for this variable. Furthermore, the threshold of 3 responses for inclusion is quite low. This means that for some countries the averages calculated for this variable were generated from a relatively small number of data points. |
| Government collaboration with civil society |
Local and National governments are a fundamental stakeholder in the DSI ecosystem, carrying out three main roles: enabler (through policy, funding and support), customer (through contracts and procurement) and partner (through strategic deployment of DSI tools, products and services). |
21.05% |
Aggregated score given by panel of experts to question: "Are major civil society organizations (CSOs) routinely consulted by policymakers on policies relevant to their members?" 0 = No, 1 = To some degree, 3 = Yes. |
2018 |
V-Dem |
Country |
Countries of all cities included in the index are covered. |
While this does not encompass all forms of government-civil society collaboration, we believe it is a useful proxy. Data which focussed on local-government collaboration with civil society would have been preferable, but to our knowledge this data does not exist. |
| Government collaboration with tech sector |
DSI works best when those with in depth knowledge of social issues are able to collaborate with people with technical expertise. |
21.05% |
Proportion of GDP spent on Government R&D for ICT |
2014 |
European Commission (PREDICT) |
Country |
Countries of all cities included in the index are covered. |
Data which focussed on ICT R&D expenditure at the local level and/or from local governments themselves, would have been preferable but to our knowledge this data does not exist. |
| Indicator name |
Indicator description |
Indicator weight |
Measure used |
Year |
Data source |
Geographic granularity |
Geographic coverage |
Comments |
|
Score for Online Service Component of e-government development index |
|
|
2018 |
UNE-Government Survey |
Country |
Countries of all cities included in the index are covered. |
Combining this with data which focussed on city-level e-government would have been preferable, but to our knowledge this data does not exist. |
|
Response to survey question asking the extent to which respondents agree or disagree that local and national government support, work with and procure from the technology sector (particularly start-ups and SMEs) to collaboratively improve public services and address governmental priority areas. |
|
|
2019 |
Primary research |
Country |
Missing data for Denmark (Aarhus, Copenhagen), Slovakia (Bratislava), Czech Republic (Prague), Finland (Helsinki), Slovenia (Ljubljana), Estonia (Tallinn), Latvia (Riga), Austria (Vienna) and Lithuania (Vilnius). |
As above city-level data would have been preferable but due to the relatively small number of survey respondents, this was not possible. Only data from countries which had at least 3 survey responses were included. This means that unfortunately country coverage was not particularly good for this variable. Furthermore, the threshold of 3 responses for inclusion is quite low. This means for some countries the averages calculated for this variable were generated from a relatively small number of data points. |
The 3 variables were combined to create one indicator by first normalizing all variables to be within the same 0.1 to 0.9 scale and then calculating the mean of the 3 variables.
| Indicator name |
Indicator description |
Indicator weight |
Measure used |
Year |
Data source |
Geographic granularity |
Geographic coverage |
Comments |
| Engagement with DSI |
An active community of people talking about DSI can help foster informal sharing of knowledge, collaboration, and uptake by potential users. |
21.05% |
Number of tweets which include DSI related hashtags / keywords from users located in each city (per estimated number of users in city) |
2018 |
Twitter API |
City |
All cities in index covered in theory though for some cities we were unable to identify any DSI related tweets. |
While Twitter is used throughout Europe, its penetration may vary between countries. For this reason, we initially intended on combining Twitter data with data from Facebook, but at the time of data collection the Facebook API was not accessible. The number of users in a city was estimated by multiplying the city population by the proportion of that country's population that use Twitter. |
4. Skills
| Indicator name |
Indicator description |
Indicator weight |
Measure used |
Year |
Data source |
Geographic granularity |
Geographic coverage |
Comments |
| Access to Business, HR, legal, marketing, design and media support |
Growing DSI initiatives need access to staff with a wide range of skill sets including HR, Legal, Marketing, Design, media and other business support professionals. |
20% |
Number of employees working in advertising and market research activities (per active population [age 15-64]). |
2016 |
Eurostat |
Country |
Countries of all cities included in the index are covered. |
Data is also available at a more granular regional (NUTS 1) level with approval from Eurostat. However, we were unable to get approval to use this data in time for publication of the index. |
|
|
|
Number of employees working in legal and accounting activities; activities of head offices; management consultancy activities (per active population [age 15 - 64]). |
2016 |
Eurostat |
Country |
Countries of all cities included in the index are covered. |
Data is also available at a more granular regional (NUTS 1) level with approval from Eurostat. However, we were unable to get approval to use this data in time for publication of the index. |
|
|
|
Number of employees working in financial and insurance activities (per active population [age 15 - 64]). |
2016 |
Eurostat |
Country |
Countries of all cities included in the index are covered. |
Data is also available at a more granular regional (NUTS 1) level with approval from Eurostat. However, we were unable to get approval to use this data in time for publication of the index. |
|
|
|
Number of employees working in administrative and support service activities (per active population [age 15-64]). |
2016 |
Eurostat |
Country |
Countries of all cities included in the index are covered. |
Data is also available at a more granular regional (NUTS 1) level with approval from Eurostat. However, we were unable to get approval to use this data in time for publication of the index. |
| Indicator name |
Indicator description |
Indicator weight |
Measure used |
Year |
Data source |
Geographic granularity |
Geographic coverage |
Comments |
| Access to employees with data skills |
Data is often at the core of DSI initiatives products and services. Therefore, having access to staff with skills in collecting, manipulating, analysing and interpreting data is crucial. |
20% |
Number of users on data science stack exchange forum from city (per active population [age 15 - 64]) |
2018 |
Stack exchange API |
City |
All cities in index are covered. |
This is a proxy for number of data science employees as not all forum users will be employed as data scientists. It does however give an indication of the number of people with data science skills because as far as we know the use of Stack Exchange by data scientists is widespread and fairly uniform across Europe. |
| Access to employees with service design skills |
DSI initiatives are able to meet their full potential when the product or service they offer is designed around the specific needs of their users and beneficiaries. Employing staff with service design skills can help initiatives achieve this. |
20% |
Number of service design higher education programmes, practitioners and researchers located in city (per active population [age 16-64]) |
2018 |
servicedesignmap.com |
City |
All cities in index covered in theory, though for some cities the map did not contain any service design entities. |
We are not able to determine how comprehensive the map is or whether some parts of Europe are better covered than others. |
| Access to employees with Software Engineering/ Development skills |
DSI initiatives are typically based around a mobile or web app which require software Engineering/ development skills to create. |
20% |
Number of users on the Stackoverflow (for programmers) forum from city (per active population [age 16-64]). |
2018 |
Stack exchange API |
City |
All cities in index are covered. |
This is a proxy for the number of employees with programming skills as not all forum users are necessarily employed. It does however give an indication of the number of people with programming skills because as far as we know the use of Stack Overflow by programmers is widespread and uniform across Europe. |
| Indicator name |
Indicator description |
Indicator weight |
Measure used |
Year |
Data source |
Geographic granularity |
Geographic coverage |
Comments |
| Presence of universities with expertise in DSI |
Alongside doing research and teaching courses related to DSI, universities often hold events, provide equipment and workspace and collaborate with DSI initiatives. |
20% |
Number of universities with academics publishing papers with titles or abstracts including DSI related keywords |
2018 |
Microsoft academic graph API |
City |
All cities in index covered in theory though we were unable to find any universities with expertise in DSI for some cities. |
Microsoft academic graph API was queried for papers including DSI related keywords in their title or abstract (see Appendix 2 for list of keywords). This returned information on these papers including authors and their authors institutional affiliations. We then used the Unirank webpage to put together a list of research institutes in each city. We then used a fuzzy match algorithm to combine these data sets and calculate the number of DSI related papers coming from institutions in each city of interest. |
5. Infrastructure
| Indicator name |
Indicator description |
Indicator weight |
Measure used |
Year |
Data source |
Geographic granularity |
Geographic coverage |
Comments |
| Access to fast broadband and mobile internet |
DSI initiatives are typically based around a mobile or web app and therefore access to affordable and fast broadband and mobile internet is essential to potential developers and users. |
22.22% |
Average mobile download speed (over 9 month period) |
2019 |
Speedtest by Ookla |
City |
All cities in index covered. |
To aggregate the different data points used for this indicator, firstly the average mobile upload speed, download speed and latency (over a 9 month period) were normalised to be on the same scale and then combined by calculating the mean of these three variables for each city. This step was then repeated for broadband data. Finally, the aggregate for mobile was combined with the aggregate for broadband by calculating the mean of these two variables for each city. |
|
|
|
Average mobile upload speed (over 9 month period) |
2019 |
Speedtest by Ookla |
City |
All cities in index covered. |
|
|
|
|
Average mobile latency (over 9 month period) |
2019 |
Speedtest by Ookla |
City |
All cities in index covered. |
|
|
|
|
Average broadband download speed (over 9 month period) |
2019 |
Speedtest by Ookla |
City |
All cities in index covered. |
|
|
|
|
Average broadband upload speed (over 9 month period) |
2019 |
Speedtest by Ookla |
City |
All cities in index covered. |
|
|
|
|
Average broadband latency (over 9 month period) |
2019 |
Speedtest by Ookla |
City |
All cities in index covered. |
|
| Access to flexible workspace |
DSI initiatives often rely on shared and flexible office space as a place to work, hold meetings and network. Alongside this, flexible workspaces facilitate the exchange of ideas and collaboration between people with different skills and from different sectors. |
22.22% |
Number of co-working spaces (per capita). |
2018 |
coworker.com |
City |
All cities in index covered. |
It is possible that the coworker.com platform is more popular in some parts of Europe than others which may cause bias in the number of coworking spaces reported for each city. |
| Indicator name |
Indicator description |
Indicator weight |
Measure used |
Year |
Data source |
Geographic granularity |
Geographic coverage |
Comments |
| Openness of data |
The accessibility and quality of open data (i.e. data which anyone is free to access, use, modify, and share) is important to the DSI community both because it can be used to help develop new products and services but also because the opening up of government data increases transparency which is generally seen to be a positive step for DSI. |
22.22% |
Score from the Global Open Data index, an index measuring how governments are publishing and using open data for accountability, innovation and social impact. The index is made up of themes covering readiness, implementation and emerging impact. |
2016 |
Global Open Data Index |
Country |
Missing data for Estonia (Tallinn). |
Depending on who you talk to they will emphasise different aspects of what is important when it comes to open data. For example, while some will emphasise the quantity of data sources that are open and how often these are updated, others will see usability as being the most important thing. With this in mind, we decided to combine two different open data indexes which measure openness of data in different ways. |
|
|
|
Score from Open Data Barometer, an index measuring the openness of government data in the following categories: Budget, Spending, Procurement, Election results, Company register, Land ownership, National maps, Administrative Boundaries, Locations, National statistics, Draft legislation, National law, Air quality and Water quality |
2016/ 2017 |
Open Data barometer |
Country |
Missing data for Slovenia (Ljubljana), Lithuania (Vilnius), Romania (Bucharest, Cluj-Napoca) and Cyprus (Nicosia). |
|
| Indicator name |
Indicator description |
Indicator weight |
Measure used |
Year |
Data source |
Geographic granularity |
Geographic coverage |
Comments |
| Access to fabrication and manufacturing facilities |
DSI includes hardware as well as software-based initiatives (particularly open hardware). For this reason, it is important that spaces are available where users and producers can access fabrication equipment such as 3D printers, laser cutters and milling stations allowing them to prototype, manufacture and co-create innovations. Examples of such spaces include makerspaces, Fab Labs, hackerspaces and DIY Biolabs. |
11.11% |
Number of Fablabs, DIYBio labs and Hackerspaces. |
2018 |
diybio.org / fablabs.io / hackerspaces.org |
City |
All cities in the Index covered in theory though we were unable to find any Fablabs, DIYBio labs or Hackerspaces in some cities. |
Data was obtained using the makerlabs Python library. |
| Presence of socially focussed business support |
Accelerators and Incubators offer support to new ventures. The exact support offered varies, but may include workspace, training, networking opportunities, mentoring, funding or access to technical equipment. A growing number of accelerators and incubators have a focus on supporting socially focussed ventures. |
16.67% |
Number of socially focussed accelerators and incubators. |
2018 |
F6S / Crunchbase / Impactspace |
City |
All cities in index covered in theory though for some cities we were unable to identify any socially focussed incubators or accelerators. |
Socially focussed incubators and accelerators were identified on f6s by filtering by the 'market' tags: social innovation, social entrepreneur and social enterprise, and on Crunchbase by filtering for the 'categories' tags: social impact, impact investing, and social enterprise. |
| Ease of starting a business |
While the most grassroots DSI initiatives may not have legal structures, it is almost always important if initiatives want to scale their impact and access funding. DSI will be more able to grow if it is easy, trusted and cheap to set up a business. |
11.11% |
Score from Starting a business sub - dimension of the Ease of doing business index. |
2019 |
The World Bank - Ease of doing business index |
Country |
Countries of all cities included in the index are covered. |
This variable measures the number of procedures, time, cost and paid-in minimum capital requirement for a small- to medium-size limited liability company to start up and formally operate in each economy’s largest business city. |
6. Funding
| Indicator name |
Indicator description |
Indicator weight |
Measure used |
Year |
Data source |
Geographic granularity |
Geographic coverage |
Comments |
| Availability of Seed Grant Funding |
Access to relatively small amount of grant funding is needed get early stage initiatives off the ground. Here we are talking about grants of less than €200,000. |
16.67% |
Response to survey question asking the extent to which respondents agree or disagree that it is relatively easy for a promising DSI initiative to access grant funding in the first years of operation (anywhere up to around €200,000). |
2019 |
Primary research |
Country |
Missing data for Denmark (Aarhus, Copenhagen), Slovakia, Czech Republic (Prague), Finland (Helsinki, Slovenia (Ljubljana), Estonia (Tallinn), Latvia (Riga), Austria (Vienna) and Lithuania (Vilnius). |
As above, city-level data would have been preferable but due to the relatively small number of survey respondents, this was not possible. Only data from countries which had at least 3 survey responses were included. This means that unfortunately country coverage was not particularly good for this variable. Furthermore, the threshold of 3 responses for inclusion is quite low. This means for some countries the averages calculated for this variable were generated from a relatively small number of data points. The €200,000 cut-off used is relatively arbitrary. A potential issue with this is that this amount of money will go significantly further in some cities than others. |
| Indicator name |
Indicator description |
Indicator weight |
Measure used |
Year |
Data source |
Geographic granularity |
Geographic coverage |
Comments |
| Availability of Major Grant Funding |
Access to larger grants is needed to fund established DSI initiatives to scale their project and impact. Here we are talking about grants of more than €200,000. |
8.33% |
Percentage of total EU structural funds going to ICT projects |
2018 |
European Commission Structural & Investment Funds Data |
Country |
Data is missing for Denmark (Aarhus, Copenhagen), Netherlands and Belgium (Brussels). |
Decisions about the allocation of structural funds to individual projects are taken within member states. The percentage of total EU structural funds going to ICT projects may thus give an indication of a region's dedication to supporting ICT projects through grants. While ICT as a theme is broader than DSI, the majority of the ICT project stories presented on the European Commission website as being funded by structural funds appear to fit under our definition of DSI. The €200,000 cut-off used is relatively arbitrary. A potential issue with this is that this amount of money will go significantly further in some cities than others. |
| Flexibility of funding |
Flexible funding allows agile product and service development. Given the bottom-up and collaborative nature of DSI, it is also important for small organisations, citizen groups and collaborative projects to access funding, rather than just large organisations. |
25% |
Response to survey question asking the extent to which respondents agree or disagree that funding available through grants, loans, equity and other mechanisms tends to be open and accessible to small organisations and collaborative projects and allows for flexible product and service design. |
2019 |
Primary research |
Country |
Missing data for Denmark (Aarhus, Copenhagen), Slovakia (Bratislava), Czech Republic (Prague), Finland (Helsinki), Slovenia (Ljubljana), Estonia (Tallinn), Latvia (Riga), Austria (Vienna) and Lithuania (Vilnius). |
As above, city-level data would have been preferable but due to the relatively small number of survey respondents, this was not possible. Only data from countries which had at least 3 survey responses were included. This means that unfortunately country coverage was not particularly good for this variable. Furthermore, the threshold of 3 responses for inclusion is quite low. This means for some countries the averages calculated for this variable were generated from a relatively small number of data points. |
| Indicator name |
Indicator description |
Indicator weight |
Measure used |
Year |
Data source |
Geographic granularity |
Geographic coverage |
Comments |
| Availability of Impact Investment |
Impact investors can, in return for equity or debt, provide the investment needed to enable DSI initiatives to grow their project and impact. Alongside the funding offered, impact investors will often also provide mentoring and guidance helping DSI initiatives to build a sustainable business model. Impact investors include institutions (e.g. venture capitalists, foundations and corporations) as well as individuals (e.g. business angels). |
25% |
Number of organisations working in the impact investment sector (per capita; includes impact funds, angels networks, banks and corporates that make impact investments, investment fund managers and other capital channels & intermediaries) |
2018 |
Impact Space / Crunchbase / F6S |
City |
All cities in the Index covered in theory but we were unable to find any DSI related grants going to organisations in some cities. |
Impact investors were identified on f6s by filtering by the 'market' tags: social innovation, social entrepreneur and social enterprise, and on Crunchbase by filtering for the 'categories' tags: social impact, impact investing, and social enterprise. |
| Willingness of public and social sector procure from SMEs |
Accessing procurement and commissioning is often the only way in which DSI initiatives are able to deliver at scale (particularly in fields where the public sector holds a monopoly, such as in healthcare, education and employment support). In turn, DSI has the potential to enable public services to be delivered more efficiently and to involve citizens as co-creators rather than just users of services. |
25% |
Proportion of money spent by local or regional authority contractors that is going to SMEs |
2017 |
European commission Electronic Daily (TED) |
City |
All cities in index covered in theory but we were unable to find any DSI related grants going to organisations in some cities. |
This data source is likely to exclude a large number of contracts that are made as part of smaller projects which fall below the minimum value threshold which necessitate publication throughout the EU. Furthermore, governments - and departments of governments - vary significantly in their adherence to best practice and laws on open procurement. |
7. Diversity and Inclusion
| Indicator name |
Indicator description |
Indicator weight |
Measure used |
Year |
Data source |
Geographic granularity |
Geographic coverage |
Comments |
| Diversity within the tech sector |
Diversity and inclusion of different genders, sexes, ethnicities, sexual orientations, abilities are important for innovation, as they bring a wider range of interests, experiences, backgrounds and ideas. Greater diversity in the tech world suggests more progressive practices and a more inclusive culture. Diversity and inclusion is particularly important for DSI as minority groups are often more likely to have lived experience of social challenges which DSI tries to tackle. |
22.22% |
Percentage of founders of tech firms that are female. |
2018 |
CrunchBase |
City |
All cities in index are covered. |
We acknowledge that gender diversity and education level (used as proxy for socioeconomic status) are not the only important forms of diversity to consider. However, to our knowledge data on other forms of diversity (such as age, religion, race and ethnicity, sexual orientation and disability) in the tech sector are not available at the level needed for this index. |
|
|
|
Percentage of founders of tech firms that do not hold a degree minus percentage of regions population that do not hold a degree (tertiary education). |
2018 |
CrunchBase |
City |
All cities in index are covered. |
Here we use education level as a proxy for socioeconomic status. A potential challenge with this measure is that it relies on founders reporting their educational attainment. This means that percentages not holding degree reported here are likely to be considerably smaller than the true number. |
These two measures were combined to create one indicator by first normalizing both variables to be within the same 0.1 to 0.9 scale and then calculating the mean of the two variables.
| Indicator Name |
Score Value |
Year |
Source |
Type |
Countries/Cities Covered |
Comments |
| Diversity within civil society |
22.22% |
2017 |
V-Dem |
Country |
Countries of all cities included in the index are covered. |
As mentioned previously gender diversity is not the only important form of diversity to consider. However, to our knowledge data on other forms of diversity (such as age, religion, race and ethnicity, sexual orientation and disability) in the civil society sector are not available at the level needed for this index. |
| Aggregated score given by panel of experts to question: "Are women prevented from participating in civil society organizations (CSOs)? 0: Almost always. 1: Frequently. 2: About half the time. 3: Rarely. 4: Almost never" |
|
|
|
|
|
|
| Response to survey question asking the extent to which respondents agree or disagree that its civil society sector is diverse and inclusive in terms of gender, age, ethnicity, sexual orientation and ability. |
|
2019 |
Primary research |
Country |
Missing data for Denmark (Aarhus, Copenhagen), Slovakia, Czech Republic (Prague), Finland (Helsinki, Slovenia (Ljubljana), Estonia (Tallinn), Latvia (Riga), Austria (Vienna) and Lithuania (Vilnius). |
As above city-level data would have been preferable but due to the relatively small number of survey respondents, this was not possible. Only data from countries which had at least 3 survey responses were included. This means that unfortunately country coverage was not particularly good for this variable. Furthermore, the threshold of 3 responses for inclusion is quite low. This means for some countries the averages calculated for this variable were generated from a relatively small number of data points. |
| Inclusivity of innovation |
22.22% |
2012 |
Flash Eurobarometer 354 |
Varies (NUTS1 / NUTS2 / NUTS3) |
All but Zagreb's region covered. |
Entrepreneurship education is just one way that governments and other funders can promote inclusive innovation, however, we believe that it is a good indicator that it is something that is being taken seriously in a region. We tried to find additional data on the presence of targeted grants however, to our knowledge this does not exist in aggregate. Unfortunately, the data used for this indicator is relatively old (2012) so it may not capture more recent changes to regions' entrepreneurial education strategies. |
| Digital inclusion |
33.34% |
2018 |
DESI |
Country |
Countries of all cities included in the index are covered. |
The basic skills and usage sub-dimension captures information about whether the population are able to use the internet and uses it on a regular basis and whether they possess at least a basic level of digital skills in at least one of four Digital Competence domains: information, communication, content-creation or problem-solving. This, we think, is a good measure of the amount of the population that have the potential to benefit from (or even develop) DSI projects. |
| Score for basic skills and usage Sub dimension of human capital dimension of DESI index |
|
|
|
|
|
|
These two measures were combined to create one indicator by first normalizing both variables to be within the same 0.1 to 0.9 scale and then calculating the mean of the two variables.
2.3 Data checking
2.3.1 Treatment of outliers
Index building is based on a benchmarking principle where baseline values considerably influence a city or country's index score as well as its rank. The presence of outliers may result in an inappropriate benchmark and must therefore be dealt with before the index can be constructed.
Outliers were identified as values which are more than 1.5 times the interquartile range (IQR) above the upper quartile or below the lower quartile. Large outliers were transformed to have the same value as the highest existing value in that variable which falls within the thresholds outlined above. Small outliers were transformed to have the same value as the lowest existing value in that variable which falls within the thresholds outlined above. Twenty-nine out of the 49 variables used in the index contained at least one outlier.
2.3.2 Normalisation
Indicators will have different measurement units and scales of magnitude. Data must therefore be normalised so that different indicators are on the same scale before they can be aggregated into the composite index. We used a simple min-max normalisation method with which we which we transformed variables to within an identical [0.1, 0.9] range using the equation below.
Equation 1. Min-max Normalisation [0.1, 0.9]
(0.9-0.1)(xi,j-min(xj))
Zi,j = --------------------
      ((max(xj)-min(xj))+0.1
where z_i,j is the normalised value for city i and variable j?
x_i,j is the original value for city i and variable j
max(x_j) is the maximum value for variable j
min(x_j) is the minimum value for variable j
2.3.3 Imputation of Missing Data
In order for the Index to fairly compare cities on a like for like basis, we require a complete data set with the same data points for every region. However, the geographical coverage of economic and demographic datasets is often incomplete. Although the number of overall missing values was generally low (4%), of the 32 indicators included, 9 indicators (28%) had missing data for at least one of the 60 cities.
Where possible, our first approach was to try and find another data source which is more complete. When this was not possible, we used multiple regression to assign (or 'impute') estimates to missing values. In order to perform imputation, predicted values were calculated using the iterative imputer function in the fancyimpute Python library. Where data was missing for a particular variable, predicted values were computed using the other indicators in the same dataset as explanatory terms. In order to take into account uncertainty about the missing data, five predictions were made and a mean of these five values replaced the missing value.
In the later sensitivity analysis stage, we tested the effect of regression imputation by recreating the index, replacing missing data with the mean of the other variables in that theme obtained for that city, as was used in the European Digital City Index (i.e. 'theme mean imputation').
2.4 Data processing
2.4.1 Factor analysis
We assessed the overall structure of the data collected and processed using Principal Components Analysis (PCA) . PCA helps reveal how different indicators change in relation to each other and how they are associated. This can help us decide whether the way we have grouped indicators into 'Themes' makes sense from a statistical point of view. We chose to describe the data using 7 principle components, because after 7 there is a large decrease in the amount of explained variance that each extra component adds (figure 3).
Figure 3. Variance explained by each principal component
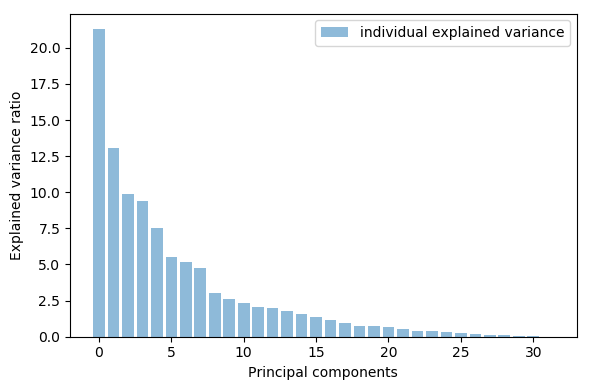
These 7 components together explain 72% of the variance in the data. Only component loadings of more than 0.15 (or less than 0.15) were considered high enough to be taken into consideration when interpreting the results of this analysis. When indicators have high loadings within the same component, this indicates that those indicators are correlated.
We found some, but relatively low, similarity between the themes laid out in the theoretical framework stage and the statistical components calculated by the PCA (see Appendix 3 for PCA loadings). Component one of the PCA contains four out of six of the indicators in the 'Civil Society' theme suggesting that these indicators vary together and thus, make sense to be grouped under the same theme. However, the indicators 'Public advocacy for DSI (e.g from political / leading figures)' and ‘Presence of supportive government policy for social purpose initiatives', which are also in the Civil Society theme carry a low loading weight in component one. Public advocacy for DSI appears to instead be correlated with indicators related to funding. This is perhaps unsurprising as more funding is likely to be available in cities in which there is public advocacy for DSI and civil society more generally (and vice versa). While it may have made sense statistically to move the Public advocacy for DSI indicator into the Funding theme, conceptually it was thought to fit better under the civil society theme.
2.4.2 Aggregation method
The next stage involved combining individual indicators into a composite index score. We decided to first combine indicators within the same theme to give theme scores and then to aggregate these theme scores to produce an overall index score by which cities could be ranked. The benefits of this are two-fold. Firstly, it means that themes that contain more variables were not automatically more influential to the final index score than those with fewer variables. Secondly, alongside the overall index scores we can present theme scores for each city. This makes it easier for users to understand a given city's score, in turn increasing its utility as a diagnostic tool.
During the framework development stage, we initially decided that themes and indicators should be aggregated in a non-compensatable fashion, meaning that a low score for one indicator or theme cannot be completely offset by a high score in another. In later discussions we decided that due to uncertainty around the reliability of individual indicators, it would be more sensible to allow compensability between individual indicators but not between themes.
In order to have compensability between indicators but not between themes, we aggregated indicators into themes using an arithmetic mean (commonly referred to as just a 'mean'; equation 2) and then aggregated themes into the final index score using a geometric mean (equation 3). Table 8 shows the overall city scores and rankings after weighting and aggregation.
Equation 2. Weighted arithmetic mean aggregation of indicators into theme scores
     J
    ∑  w_j z_i,j
    j=1
TS_i,k = ---------
     J
    ∑  w_j
    j=1
where TS_i,k is the aggregated theme score for city i and theme k
w_j is the weight given to variable j=1,...,J
z_i,j is the normalised value for city i and variable j=1,...,J
Equation 3. Weighted geometric mean aggregation of theme scores into overall index score
      K
     ( Π TS_i,k^w_k ) ^ (1 / ∑ w_k)
      k=1
IS_i =
where IS_i is the aggregated Index score for city or country i
w_k is the weight given to theme k=1,..., K
TS_i,k is the aggregated theme score for city or country i and theme k =1,...,K
In the sensitivity analysis stage, we tested the effect of this aggregation method by recreating the index using all four combinations of arithmetic and geometric means to aggregate themes and indicators.
| Rank |
City |
Score |
Ranking |
City |
Score |
| 1 |
London |
0.777139 |
31 |
Ljubljana |
0.428818 |
| 2 |
Amsterdam |
0.69528 |
32 |
Lisbon |
0.421566 |
| 3 |
Copenhagen |
0.690727 |
33 |
Warsaw |
0.41667 |
| 4 |
Stockholm |
0.670986 |
34 |
Riga |
0.413653 |
| 5 |
Paris |
0.644413 |
35 |
Nice |
0.409271 |
| 6 |
Madrid |
0.626422 |
36 |
Cologne |
0.405652 |
| 7 |
Brussels |
0.612147 |
37 |
Prague |
0.405016 |
| 8 |
Utrecht |
0.603621 |
38 |
Karlsruhe |
0.400701 |
| 9 |
Barcelona |
0.590179 |
39 |
Bilbao |
0.396394 |
| 10 |
Edinburgh |
0.57726 |
40 |
Dresden |
0.389127 |
| 11 |
Helsinki |
0.565405 |
41 |
Stuttgart |
0.386717 |
| 12 |
Rotterdam |
0.557633 |
42 |
Hamburg |
0.37892 |
| 13 |
Bristol |
0.544807 |
43 |
Porto |
0.369996 |
| 14 |
Eindhoven |
0.542584 |
44 |
Leipzig |
0.369008 |
| 15 |
The Hague |
0.541183 |
45 |
Dusseldorf |
0.367805 |
| 16 |
Malmo |
0.540493 |
46 |
Vilnius |
0.363161 |
| 17 |
Berlin |
0.538464 |
47 |
Nicosia |
0.362666 |
| 18 |
Dublin |
0.524754 |
48 |
Bratislava |
0.358211 |
| 19 |
Manchester |
0.513389 |
49 |
Dortmund |
0.3578 |
| 20 |
Vienna |
0.511969 |
50 |
Tallinn |
0.340155 |
| 21 |
Gothenburg |
0.510701 |
51 |
Budapest |
0.325167 |
| 22 |
Ghent |
0.481605 |
52 |
Krakow |
0.323216 |
| 23 |
Aarhus |
0.476707 |
53 |
Rome |
0.301632 |
| 24 |
Birmingham |
0.476147 |
54 |
Milan |
0.292907 |
| 25 |
Munich |
0.466244 |
55 |
Bucharest |
0.260599 |
| 26 |
Lyon |
0.46523 |
56 |
Cluj-Napoca |
0.224868 |
| 27 |
Belfast |
0.457384 |
57 |
Turin |
0.219127 |
| 28 |
Toulouse |
0.441463 |
58 |
Sofia |
0.218005 |
| 29 |
Marseille |
0.436658 |
59 |
Athens |
0.20998 |
| 30 |
Frankfurt |
0.432685 |
60 |
Zagreb |
0.185228 |
2.4.3 Cluster analysis
Cluster analysis is a descriptive tool which can be used to group data based on similarities/dissimilarities between cases. We used cluster analysis to give us some insight into which cities scores similarly across themes.
We used a hierarchical classification because we did not know the number of clusters there should be a priori. There are several clustering algorithms that can be used to categorise data based on the distance between data points. For all methods, a small distance is equivalent to a strong similarity. We use 'ward' as the method since it minimises the variants of distances between the clusters.
Deciding on the optimum number of clusters is largely subjective, although looking at the plot of linkage distance can be a useful guide. In this case, there is a sudden jump in the level of similarity among the 60 cities at a linkage distance of 1.5, indicating that the cities are best represented by four clusters (figure 4).
We noted the following four clusters:
- Ljubljana, Vilnius, Budapest, Prague, Vienna, Riga, Dublin, Helsinki and Tallinn. Except for Dublin and Helsinki all these cities are situated in the Baltics or Central Europe. These cities take middle to bottom ranks in the index and generally excel in the skills theme but fall short in collaboration.
- Cluj-Napoca, Bucharest, Zagreb, Athens, Sofia, Turin, Rome and Milan. These cities are all situated in South and Eastern Europe. They all rank towards the bottom of the index. They typically score particularly low for diversity and inclusion but do relatively well for skills.
- Toulouse, Bilbao, Belfast, Karlsruhe, Leipzig, Dortmund, Dresden, Munich, Nice, Ghent, Düsseldorf, Frankfurt, Aarhus, Lisbon, Porto, Birmingham, Manchester, Berlin, Marseille, Lyon, Bristol, Edinburgh, Gothenburg, Warsaw, Krakow, Nicosia, Bratislava, Malmo, Hamburg, Cologne and Stuttgart. These cities are spread throughout the middle ranks of the index. They are spread throughout Europe geographically. They generally score relatively high on civil society, collaboration and diversity and inclusion, but fall behind on infrastructure and skills.
- Amsterdam, London, Utrecht, Eindhoven, Rotterdam, The Hague, Barcelona, Madrid, Paris, Brussels, Copenhagen and Stockholm. These cities are situated in Western Europe. They all sit within top 15 ranks in the index and generally score highly across all six themes.
Figure 4. Dendrogram showing the relationship between cities determined through cluster analysis
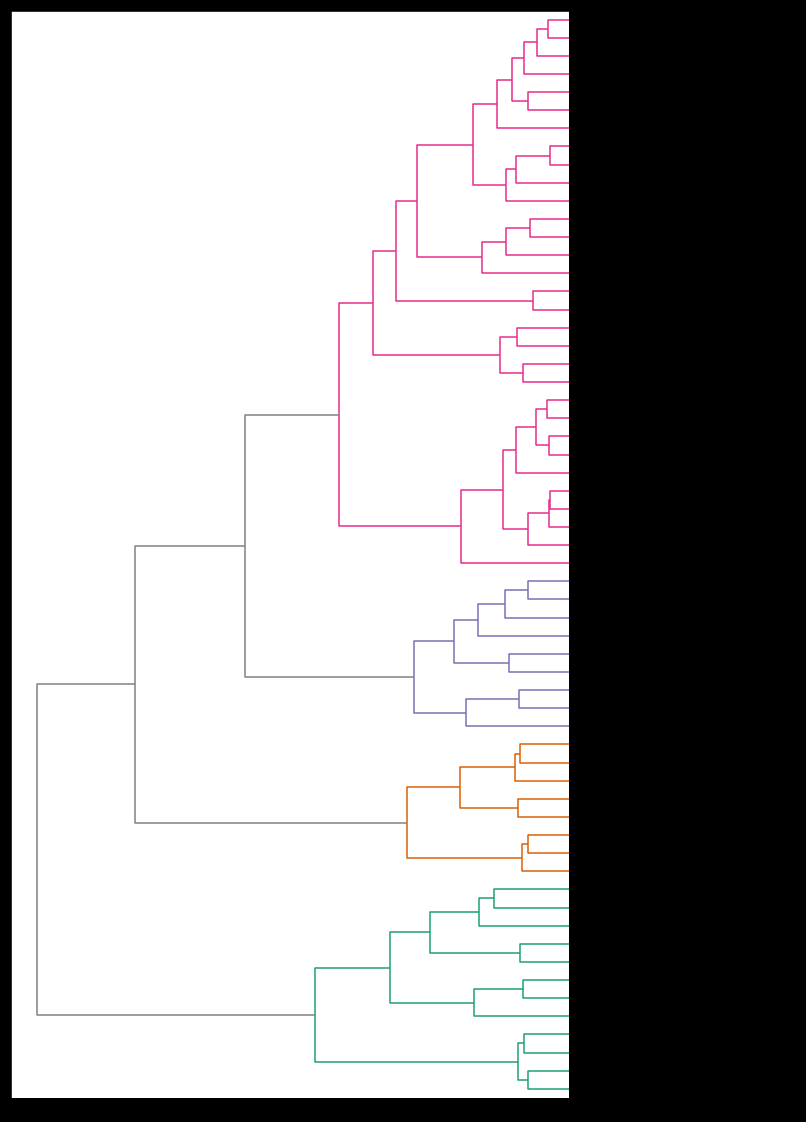
2.4.4 Theme correlations
In order to test the correlation between themes, we calculated theme by theme Pearson correlation coefficients. We find that there is a moderate positive correlation between several themes. The strongest positive correlations exist between the Collaboration and Civil Society themes and between the Civil Society and Funding themes (table 9). These correlations can be explained conceptually. For example, the collaboration theme contains indicators which relate to the collaboration between civil society and the tech sector and government; without a developed civil society such collaborations would not be possible. Further to this, civil society is more likely to become developed where there is funding available to support it and vice versa.
Although the themes all have a distinct focus, they all contain indicators that are clearly relevant to socially-focussed projects e.g. funding contains indicators related to grants and impact investing, and infrastructure contains indicators related to socially-focussed accelerators and incubators. It is perhaps unsurprising then that the Civil Society theme has a moderately strong positive correlation with four out of five of the other themes. Interestingly, the Skills theme has very little correlation with the other themes. This may be explained by the fact that this theme has little focus on skills normally associated with socially-focussed projects or civil society more generally. Diversity and Inclusion was also less heavily correlated with other themes.
|
Civil society |
Collaboration |
Diversity and Inclusion |
Funding |
Infrastructure |
Skills |
| Civil society |
1 |
|
|
|
|
|
| Collaboration |
0.51 |
1 |
|
|
|
|
| Diversity and Inclusion |
0.408 |
0.1 |
1 |
|
|
|
| Funding |
0.447 |
0.368 |
0.326 |
1 |
|
|
| Infrastructure |
0.405 |
0.571 |
0.132 |
0.628 |
1 |
|
| Skills |
0.099 |
-0.089 |
0.232 |
0.295 |
0.404 |
1 |
We also investigated the correlation between themes scores and the overall index scores cities received. These correlations will of course largely be the result of the weighting themes were given in the index, so we were looking for correlations that stand out even when taking weightings into account (Table 10).
Unsurprisingly, all theme scores have a moderately strong correlation with overall index score. However, for Skills, and Diversity and Inclusion this correlation is weak relative to the other themes. This is a result of these themes being less strongly correlated with the other themes. Civil Society and Infrastructure on the other hand are highly correlated with the overall index score and with the other themes.
Table 10. Theme correlations with overall index score
| Theme |
Civil Society |
Collaboration |
Diversity and Inclusion |
Funding |
Infrastructure |
Skills |
| Correlation with overall index |
0.724 |
0.631 |
0.5 |
0.756 |
0.809 |
0.51 |
| Weighting |
20 |
17.5 |
15 |
15 |
15 |
17.5 |
2.4.5 Index validation
As a means of validating the index we compared cities' scores with the number of DSI organisations located in each city that have entered their information onto the DSI4EU platform (figure 5). Although we would expect some positive correlation between these two variables, we would not expect them to correlate exactly as they are not measuring the same thing. The EDSII is trying to measure the conditions which support DSI whereas the DSI4EU map is mapping DSI activity itself. Having the right conditions in place for DSI does not necessarily translate into high DSI activity. This is case for many possible reasons: for example, DSI (like social innovation more broadly) is often reactive to social challenges (such as inequality or corruption), so cities with supportive conditions for DSI but fewer or less serious social challenges may have less DSI activity than cities where the conditions are not as supportive but where there are many social challenges which demand solutions. Another reason is that the Index measures systemic conditions but does not take into account specific DSI-focused policies and initiatives taken by government.
Figure 5. Comparison of EDSII scores and number of organisations on the DSI4EU platform for each city.
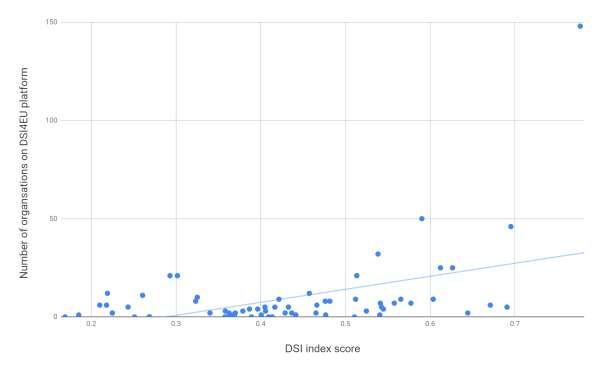
We found there to be a weak to moderate positive correlation (Pearson correlation coefficient, r = 0.45). This is perhaps less of a correlation than we would have expected, even bearing in mind the differences outlined above. We explore some of the possible reasons for this below.
Where it was thought that indicators would be affected by size-related factors, such as the population or purchasing power of the city or country, indicators were scaled to account for differences in these factors. As a final check whether the final score was affected by such factors, we tested whether there was a correlation between city population and the overall index score. We found that there was only a very small positive correlation (Pearson correlation coefficient, r = 0.19), suggesting that our scaling of indicators was effective.
3. Sensitivity analysis
To understand the impact of the methodology decisions made, we tested the effect of the following:
- Variable Selection - The effect of discarding a variable
- Outlier treatment - The effect of transforming outliers to the same value as the closest non-outlying value
- Imputation method - The effect of using multiple imputation rather than theme mean imputation to account for missing data
- Aggregation method - The effect of using geometric (variable) / geometric (theme) rather than arithmetic (variable) / geometric (theme) aggregation.
- Weight Selection - The effect of varying weightings of variables.
3.1 Indicator Selection
The aim of this analysis was to determine whether a single indicator had an excessively large impact on the overall ranking. To test this, we ran a Monte Carlo simulation that tested the effect of sequentially and randomly excluding indicators from the index. The results of this simulation are shown in figure 6. The wider the box and whisker, the more variable that city's rank is when indicators are removed.
In general, the top ranking and bottom ranking cities were the least sensitive to changes in the index composition with middle ranking cities being more sensitive (figure 6). London was particularly robust to changes in the indicator composition, ranking first in nearly all of the combinations tested. Helsinki, Tallinn and Dublin were particularly sensitive to which variables were included in the Index. Nevertheless, this analysis shows that the ranking is relatively stable, even to major changes in indicator composition.
Figure 6. Box and whisker diagram showing the impact of randomly removing
indicators on the rank. Box = interquartile range; whiskers = range.
3. Sensitivity Analysis
3.2 Treatment of outliers
It is often not possible to determine whether outliers are the result of a mistake
during data collection or just an indication of variance in the data. It is, therefore,
debatable whether outliers should be treated. We tested the effect of
transforming outliers to the same value as the closest non-outlying value by
recreating the index without treating outliers (see ‘Rank with outliers' of table 11).
London and Paris remained in first and second position when outliers were
untreated. Zagreb remained in last position and most of the bottom 10 positions
remained relatively unchanged. A few cities, however, ranked considerably worse
when outliers were not removed, such as Madrid, Barcelona, Brussels and
Helsinki. This indicated that these cities had some low outliers which when
treated improved their scores. Others did considerably better when outliers were
not treated e.g. Birmingham, Berlin and Vienna, suggesting that these cities had
high outliers that when treated decreased their scores. In general, however, while
there are several small changes throughout the ranking, most cities did not move
considerably.
Table 11. City; rankings when index re-made without treating outliers, without
imputing missing values, without weighting indicators, and with different
methods for aggregating data. Green cells represent higher rankings compared
to the final index, red cells represent lower rankings and yellow cells represent
equal rankings.
| City |
Index rank |
Rank with outliers |
Rank with theme mean imputation |
Rank with equal weightings |
Rank with geo-geo aggregation |
Rank with arith-arith aggregation |
Rank with geo-arith aggregation |
| London |
1 |
1 |
1 |
1 |
1 |
1 |
1 |
| Amsterdam |
2 |
2 |
2 |
2 |
4 |
2 |
2 |
| Copenhagen |
3 |
4 |
15 |
19 |
2 |
13 |
13 |
| Stockholm |
4 |
6 |
4 |
4 |
11 |
5 |
5 |
| Paris |
5 |
3 |
3 |
3 |
6 |
3 |
3 |
| Madrid |
6 |
12 |
9 |
7 |
8 |
8 |
8 |
| Brussels |
7 |
15 |
13 |
11 |
18 |
18 |
18 |
| Utrecht |
8 |
5 |
5 |
5 |
7 |
4 |
4 |
| Barcelona |
9 |
18 |
14 |
9 |
16 |
16 |
16 |
| Edinburgh |
10 |
9 |
12 |
12 |
10 |
12 |
12 |
| Helsinki |
11 |
26 |
26 |
25 |
3 |
26 |
26 |
| Rotterdam |
12 |
8 |
7 |
10 |
14 |
7 |
7 |
| Bristol |
13 |
11 |
8 |
6 |
20 |
6 |
6 |
| Eindhoven |
14 |
14 |
11 |
15 |
21 |
11 |
11 |
| The Hague |
15 |
13 |
10 |
14 |
17 |
9 |
9 |
| Malmo |
16 |
19 |
17 |
16 |
29 |
14 |
14 |
| Berlin |
17 |
7 |
6 |
8 |
13 |
10 |
10 |
| Dublin |
18 |
24 |
21 |
18 |
27 |
21 |
21 |
| Manchester |
19 |
17 |
16 |
13 |
25 |
15 |
15 |
| Vienna |
20 |
10 |
30 |
28 |
5 |
38 |
38 |
| Gothenburg |
21 |
20 |
18 |
17 |
28 |
17 |
17 |
| Ghent |
22 |
33 |
33 |
30 |
40 |
41 |
41 |
| Aarhus |
23 |
25 |
41 |
43 |
9 |
42 |
42 |
| Birmingham |
24 |
16 |
20 |
22 |
30 |
23 |
23 |
| Munich |
25 |
28 |
23 |
26 |
26 |
25 |
25 |
| Lyon |
26 |
21 |
25 |
23 |
23 |
27 |
27 |
| Belfast |
27 |
23 |
22 |
20 |
31 |
19 |
19 |
| Toulouse |
28 |
22 |
19 |
21 |
32 |
20 |
20 |
| Marseille |
29 |
27 |
24 |
24 |
34 |
22 |
22 |
| Frankfurt |
30 |
30 |
28 |
31 |
36 |
28 |
28 |
| Ljubljana |
31 |
42 |
55 |
54 |
15 |
53 |
53 |
| Lisbon |
32 |
43 |
40 |
38 |
48 |
40 |
40 |
| Warsaw |
33 |
45 |
43 |
45 |
38 |
45 |
45 |
| Riga |
34 |
41 |
53 |
52 |
22 |
51 |
51 |
| Nice |
35 |
29 |
27 |
27 |
33 |
29 |
29 |
| Cologne |
36 |
34 |
32 |
33 |
37 |
31 |
31 |
| Prague |
37 |
52 |
50 |
48 |
12 |
50 |
50 |
| Karlsruhe |
38 |
31 |
29 |
29 |
39 |
24 |
24 |
| Bilbao |
39 |
40 |
38 |
32 |
46 |
37 |
37 |
| Dresden |
40 |
32 |
31 |
36 |
45 |
33 |
33 |
| Stuttgart |
41 |
37 |
34 |
35 |
41 |
34 |
34 |
| Hamburg |
42 |
38 |
35 |
37 |
44 |
35 |
35 |
| Porto |
43 |
46 |
42 |
41 |
51 |
39 |
39 |
| Leipzig |
44 |
35 |
37 |
39 |
43 |
32 |
32 |
| Dusseldorf |
45 |
36 |
36 |
34 |
42 |
30 |
30 |
| Vilnius |
46 |
44 |
57 |
55 |
24 |
55 |
55 |
| Nicosia |
47 |
48 |
44 |
42 |
53 |
43 |
43 |
| Bratislava |
48 |
47 |
58 |
57 |
35 |
58 |
58 |
| Dortmund |
49 |
39 |
39 |
40 |
47 |
36 |
36 |
| Tallinn |
50 |
49 |
51 |
51 |
19 |
46 |
46 |
| Budapest |
51 |
50 |
45 |
44 |
50 |
44 |
44 |
| Krakow |
52 |
51 |
48 |
49 |
52 |
47 |
47 |
| Rome |
53 |
53 |
47 |
47 |
55 |
49 |
49 |
| Milan |
54 |
54 |
46 |
46 |
54 |
48 |
48 |
| Bucharest |
55 |
55 |
49 |
50 |
59 |
52 |
52 |
| Cluj-Napoca |
56 |
56 |
54 |
56 |
60 |
57 |
57 |
| Turin |
57 |
57 |
56 |
58 |
56 |
54 |
54 |
| Sofia |
58 |
59 |
59 |
59 |
49 |
59 |
59 |
| Athens |
59 |
58 |
52 |
53 |
57 |
56 |
56 |
| Zagreb |
60 |
60 |
60 |
60 |
58 |
60 |
60 |
3.3 Imputation method
We tested the effect of using multiple imputation on missing values rather than
using the simpler method of replacing missing data with the mean value of the
other indicators in the same theme for that city ('theme mean imputation'). The
imputation method used obviously has the largest effect on those cities with a lot
of missing data.
London and Paris remained in first and second position when theme mean
imputation was used and Zagreb remained in last position (see ‘Rank with theme
mean imputation' column of Table 11). Copenhagen, which was in third position,
moves to 15th position when theme mean imputation is used. Aarhus and
Helsinki also rank considerably worse when theme imputation is used (23rd to
40th position and 11th to 26th position, respectively). For most cities, however,
rankings only change slightly.
3.4 Aggregation method
We used an arithmetic mean to aggregate indicators and geometric mean to
aggregate themes. The use of geometric or arithmetic means to aggregate
indicators and themes each have their own benefits, so we tested the effect that
this decision had on rankings (Table 11). To do this we re-created the index using:
arithmetic means to aggregate both indicators and themes (see 'Rank with arith-
arith aggregation' column), geometric means to aggregate both indicators and
themes ('Rank with geo-geo aggregation'), and a geometric mean to aggregate
indicators and an arithmetic mean to aggregate themes (‘Rank with geo-arith
aggregation').
London remained in first position and most cities only experienced small changes
in ranking with different aggregation methods. With geometric aggregation,
compensability is lower for the composite indicator or themes with low values.
This means that when using a geometric aggregation, a city with a low score for
one indicator or theme will need a much higher score on the others to improve its
score. Therefore, cities with one or a few very low scores experienced the largest
effect of changing from arithmetic to geometric aggregation of indicators
Brussels, for example, moved from 8th to 18th position when geometric
aggregation was used.
Similarly, using arithmetic rather than geometric aggregation of themes will
improve the ranking of cities which fall behind on a particular theme. Generally,
this appears to have less of an effect than changing the indicator aggregation
method. However, some cities did experience considerably better rankings,
Karlsruhe for example moved from 38th to 24th position when arithmetic
aggregation of means was used.
3.5 Weight Selection
To measure how sensitive the rank is to the weighting selection we ran a Monte
Carlo simulation. In this simulation, single indicator and theme weights were
randomly selected from our possible values (specified in Table 2). The results of
this simulation are shown in figure 7. The wider the box & whisker, the more
variable that city's rank is when the weighting is changed.
In general, weighting changes have very little effect on the ranking. This is
because weightings in the index are generally not very extreme; all themes are
weighted either 15%, 17.5% or 20%.
London maintains its first position in all versions of the index tested. As with the
indicator selection, weight selection appears to have the largest impact on
middle-ranking cities. However, even with these cities' variation is relatively small.
We also tested the effect of equally weighing all indicators and themes (see
'Rank with equal weightings' column in table 11.) In general ranking changes were
minor, reflecting the relative subtlety of the weightings applied. London and
Amsterdam remained in first and second position when equal weighting was
applied, and Zagreb remained in last position.
Figure 7. Box and whisker diagram showing the impact of removing each variable
on the rank. Box = interquartile range; whiskers = range.
4. Data visualisation
A data visualisation was developed using Public Tableau software and embedded
into the digitalsocial.eu website. The interactive data visualisation allows viewers
to compare city scores and rankings for the overall index as well as for the
individual themes. It also presents examples of strategies, policies and initiatives
from across Europe which may help support DSI.
5. Challenges and limitations
"All models are wrong, but some are useful"
George Box, Statistician
As is the case with all indexes, and models more generally, the EDSII does not
perfectly describe cities' abilities to support DSI. We do, however, believe it will be
useful tool to help policymakers understand how they can better support DSI and
to incentivise the development and implementation of supportive policies. We
also think it can inform practitioners about where has the best conditions to
support DSI, helping them to decide where to set up or grow their initiatives.
Throughout the development of the index, several largely subjective decisions
were made with regards to indicator choice, data processing and aggregation
methods. While some indexes cloak such decisions in a veil of objectivity, we
wanted to be transparent about where these decisions were made and how they
might affect rankings. The sensitivity analysis we conducted shows that while
these decisions can have major effects on rankings, most of the general structure
of the ranking is relatively robust. The top ranking positions of London and
Amsterdam were also very robust to changes in the methodology.
While several cities do rank better or worse than we would have expected, in
general, the ranking of cities in the index is relatively unsurprising. However, we
did expect to see a stronger correlation between the index and levels of DSI
activity (as mapped through the DSI4EU project), as discussed above.
There are several possible reasons for why this might be the case. Indeed, it is
most likely a combination of (some of) these reasons.
- Favourable conditions for DSI don't necessarily lead to high levels of
DSI. As noted above, many DSI initiatives emerge as a response to
unfavourable social, political and economic contexts, in an attempt to
address social issues that have been overlooked by traditional institutions.
For example, a large number of digital democracy initiatives have emerged
in Eastern and Southern Europe addressing localised issues such as
corruption and lack of government transparency. Some of the cities which
are high-ranking in the index might simply be better places to live,
meaning that bottom-up DSI is less necessary; and some of the cities
which are low-ranking in the index might have conditions which lead
people to develop DSI despite a less favourable ecosystem.
Taking this hypothesis to its logical end, places with more (or more serious)
social challenges would be better "ecosystems" for DSI to grow. But, of
course, we would not want to include this as an indicator in the composite
index. Furthermore, country-specific contexts affect the nature of DSI in
different places. For example, DSI initiatives tackling corruption and
improving transparency and accountability are thriving in countries with
weaker state institutions - but we would not argue that policymakers
should weaken institutions to promote DSI. While this may at first seem
facetious, these geographical and contextual differences have posed a real
challenge in developing the framework, and one which we have not
managed to completely solve thus far.
* Local and national policy initiatives focused on supporting DSI may play
a greater role in supporting DSI initiatives than the wider ecosystemic
factors measured by the index. While there are some indicators related to
policy initiatives, such as the ease of doing business and socially-focused
support, the index does not take into account governmental attempts to
specifically support DSI and related fields. We are cataloguing some such
attempts through the Ideas Bank. The reason for the discrepancy between
the index and known activity may be because those specific policy
initiatives are far more important for the growth of DSI than ecosystemic
factors.
* Data quality, availability and accuracy. As we had predicted from the
beginning, we have faced several challenges regarding the quality,
availability and accuracy of data and have had to make difficult - and
ultimately subjective - decisions on data sources, including using proxy
indicators, outdated data or geographically broad data, or even omitting
indicators altogether. This is an unavoidable consequence of developing an
experimental index for a field which receives limited attention from
government and academia. It is possible that some of the trade-offs we
have made have influenced the scores.
* Decisions in the indicators and themes included in the theoretical
framework. We based our decisions for the indicators and themes on a
broad range of evidence: literature review, interviews and a survey. These
involved experts and the wider DSI community and were developed in
consultation with all the DSI4EU partners. It is nevertheless possible that
some of these decisions regarding indicator choices and weighting are not
as accurate or representative as we would like. While we are confident in
our research methods, we think it is important to note that such decisions
were far from being clear-cut.
* Incomplete mapping of DSI activity. We know that the DSI4EU database
is neither comprehensive nor truly representative: it is largely
crowdsourced; it is biased towards regions where DSI4EU partners have
knowledge, networks and linguistic access and to the social areas they
work in. Indeed, DSI is such a broad, active and fast-developing field that
we could not possibly map all activity accurately. It is possible, therefore,
that there is significant activity going on in some of the higher-ranking
cities which we are not aware of, and we intend to explore those places in
more depth over the coming months.
* The diversity of DSI as a field means a traditional index is simply not
sufficient to measure ecosystemic factors which support it. The breadth
of activity encompassed under the term DSI is vast: different actors
(researchers, user-innovators, entrepreneurs, charities, start-ups,
corporates); different social areas; reactive (e.g. an individual addressing a
specific problem for them or their community) or proactive (e.g. a startup
tackling an international development issue); localised or global; and much
more. Most indexes focus on much more clearly-defined fields. It may be
that the usual method of creating indexes cannot be applied to DSI as a
whole.
A number of additional challenges arose when discussing the index and potential
indicators with interviewees and roundtable participants. While we had
anticipated some of these, as we continued to develop the framework we
continued to come up against tricky questions. While this made it all the more
important for our index methodology to be as inclusive as possible, we are aware
that it is by no means definitive, and far from perfect. Largely, these challenges
have resulted from the huge breadth of the field of DSI, and we outline a few
specific challenges below.
- Stages of development. Several experts pointed out that the specific
needs of DSI initiatives differ considerably depending on their stage of
development. For example, availability of advice and mentoring on
running a social purpose initiative is likely to be much more important to
early stage DSI initiatives than scaling DSI initiatives, while public
procurement might be very important to an established initiative but of
little interest to new initiatives.
- Breadth of organisational types. For-profit organisations will have
different requirements to not-for-profit organisations, an example being
that they will be more likely to be interested in selling equity and less
reliant on grants.
- Breadth of social challenges. DSI is active in a vast range of social
challenges - healthcare, education, transport, housing, justice,
environment, democracy and migration to name only a few. Of course,
each of these challenges is itself vast. The enabling and hindering factors
for DSI initiatives varies enormously and it would be impossible to cater to
all of these within a composite index.
- Breadth of technologies. DSI encompasses a huge range of technologies,
so we have faced challenges with some infrastructural indicators. Open
data and digital fabrication tools, for example, are central to the success of
some DSI initiatives, but completely irrelevant for others. However, we have
decided to include them as indicators and allow the survey findings to
suggest how indicators like these should be weighted.
One possible way of addressing the four challenges above would be to effectively
produce multiple indexes, one for each different type of DSI initiative (i.e. based
on their stage of development, organisational type, social challenge they are
addressing and technology they are using), by using the same indicators for each
index but weighting them differently depending on characteristics of the DSI
initiative. This would be presented using an online user interface allowing
policymakers to pick and choose the different characteristics (e.g. sector,
organisation type or development stage) they were interested in seeing an index
and ranking for. While this approach was impossible within the scope of this
project, it should be considered if another iteration of the index is created in the
future. Furthermore, as the index is open-source and its methodology available to
all, specific sectors or fields could tailor it to their needs if they desired.
We welcome questions or feedback on any aspect of the Index at
[email protected]. Also please visit the DSI4EU website for more research and
data on digital social innovation in Europe.
6. Appendices
Appendix 1. Selected literature review
Table 12. Literature review
Appendix 2. Keywords used in analyses
'technology for good', 'tech for good', 'techforgood', 'tech4good', 'civic tech',
'civictech', 'civic technology', 'digital social innovation', 'non-profit tech', 'non-profit
technology', 'nonprofit tech', 'nonprofit technology', 'Digital democracy',
'Démocratie Numérique', 'democrazia 'digitale', 'digitale Demokratie', 'democracia
digital', 'digitalt demokrati', 'ψηφιακή δημοκρατία', 'digitale democratie', 'digitálna
demokracia', 'democrația digitală', 'Democracia virtual', 'digitalna demokracija',
'interneta demokrātija', 'skaitmenine demokratija', 'digitális demokrácia', 'digitální
demokracie', 'цифрова демокрация', 'digital demokrati', 'digitaalseks
demokraatiaks', 'demokrazija diġitali', 'cyfrowa demokracja', 'elektronička
demokracija', 'daonlathas digiteach', 'e-democracy', 'e-démocratie', 'democrazia
elettronica', 'e-Demokratie', 'democracia electrónica', 'Elektroninen demokratia',
'e-demokrati', 'Ηλεκτρονική δημοκρατία', 'e-democratie', 'e-demokracia', 'e-
democrația', 'e-democracia', 'e-demokracija', 'E-demokrātija', 'e-demokratija', 'e-
demokrácia', 'e-demokracie', 'е-демокрация', 'E-demokrati', 'e-demokraatia', 'e-
demokrazija', 'e-demokracja', 'E-demokracija', 'e-daonlathas', 'open data', 'Données
ouvertes', 'dati aperti', 'Offene Daten', 'Datos abiertos ', 'Avoin data', 'Åbn data',
'ανοιχτά δεδομένα', 'otvorené dáta', 'date deschise', 'dados abertos', 'odprti
podatki', 'atveriet datus', 'atviri duomenys', 'nyitott adatok', 'Otevřená data',
'отворени данни', 'Öppna data', 'Avaandmed', 'data miftuħa', 'otwarte dane',
'otvoreni podaci', 'sonraí oscailte', 'open hardware', 'Matériel ouvert', 'hardware
libero', 'offene Hardware', 'hardware libre', 'Avoin laitteisto', 'åben hardware',
'ανοιχτό υλικό', 'otvorený hardvér', 'Open Hardware', 'sursa deschisa', 'hardware
livre', 'odprta strojna oprema', 'atvērt aparatūru', 'atvira technine iranga', 'nyitott
hardver', 'otevřený hardware', 'отворен хардуер', 'Öppen hårdvara', 'avatud
riistvara', 'hardwer miftuħ', 'open hardware', 'otvoreni hardver', 'crua-earraí
oscailte', 'code source ouvert', 'fonte aperta', 'offene Quelle', 'código abierto ', 'Avoin
lähdekoodi', 'åben kildekode', 'Ανοικτός Κώδικας', 'sursă deschisă', 'código aberto',
'Odprta koda', 'Atvērtais pirmkods', 'atviras resursas', 'nyílt forráskód', 'отворен
код', 'Öppen källkod', 'Avatud lähtekood', 'sors miftuħ', 'otwarte źródło', 'Otvoreni
kod', 'Foinse oscailte', 'open government', 'gouvernement ouvert ',
'governoaperto', 'offene Regierung', 'gobierno abierto', 'avoin hallitus', 'åben
regering', 'ανοικτή κυβέρνηση', 'open overheid', 'otvorená vláda', 'guvern deschis',
'governo aberto', 'odprta vlada', 'atvērta valdība', 'atvira vyriausybė', 'nyitott
kormány', 'otevřená vláda', 'отворено', 'правителство', 'öppen regering', 'avatud
valitsus', 'gvern miftuħ', 'otwarty rząd', 'otvorena vlada', 'rialtas oscailte'.
Additional words used in Twitter analysis: tech for good, technology for good,
techforgood, #tech4good, civic tech, #civictech, Civic technology, digital social
innovation, #NGOtech, #ngotech, #nptech, #nonprofittech, Non-profit tech/
nonprofit tech, Non-profit technology/ nonprofit technology, #socialtech,
goodtech
Table 13. Keywords used in analyses with translations into English
| English |
Digital democracy |
e-democracy |
open data |
open hardware |
open source |
open government |
#Digitaldemocracy |
#edemocracy |
#opendata |
#openhardware |
#opensource |
#opengovernment |
| French |
Démocratie Numérique |
e-démocratie |
Données ouvertes |
Matériel ouvert |
code source ouvert |
gouvernement ouvert |
#DémocratieNumérique |
#edémocratie |
#Donnéesouvertes |
#Matérielouvert |
#codesourceouvert |
#gouvernementouvert |
| Italian |
democrazia digitale |
democrazia elettronica |
dati aperti |
hardware libero |
fonte aperta |
Governo aperto |
#democraziadigitale |
#democraziaelettronica |
#datiaperti |
#hardwarelibero |
#fonteaperta |
#governoaperto |
| German |
digitale Demokratie |
e-Demokratie |
Offene Daten |
offene Hardware |
offene Quelle |
offene Regierung |
#digitaleDemokratie |
#eDemokratie |
#OffeneDaten |
#offeneHardware |
#offeneQuelle |
#offeneRegierung |
| Spanish |
democracia digital |
democracia electrónica |
Datos abiertos |
hardware libre |
código abierto |
gobierno abierto |
#democraciadigital |
#democraciaelectrónica |
#Datosabiertos |
#hardwarelibre |
#códigoabierto |
#gobiernoabierto |
| Finnish |
digitaalidemokratia |
Elektroninen demokratia |
Avoin data |
Avoin laitteisto |
Avoin lähdekoodi |
avoin hallitus |
#digitaalidemokratia |
#Elektroninendemokratia |
#Avoindata |
#Avoinlaitteisto |
#Avoinlähdekoodi |
#avoinhallitus |
| Danish |
digitalt demokrati |
e-demokrati |
Åbn data |
åben hardware |
åben kildekode |
åben regering |
#digitaltdemokrati |
#edemokrati |
#Åbndata |
#åbenhardware |
#åbenkildekode |
#åbenregering |
| Greek |
ψηφιακή δημοκρατία |
Ηλεκτρονική δημοκρατία |
ανοιχτά δεδομένα |
ανοιχτό υλικό |
Ανοικτός Κώδικας |
ανοικτή κυβέρνηση |
#ψηφιακήδημοκρατία |
#Ηλεκτρονικήδημοκρατία |
#ανοιχτάδεδομένα |
#ανοιχτόυλικό |
#ΑνοικτόςΚώδικας |
#ανοικτήκυβέρνηση |
| Dutch |
digitale democratie |
e-democratie |
|
|
|
open overheid |
#digitaledemocratie |
#edemocratie |
|
|
|
#openoverheid |
| Slovak |
digitálna demokracia |
e-demokracia |
otvorené dáta |
otvorený hardvér |
|
otvorená vláda |
#digitálnademokracia |
#edemokracia |
#otvorenédáta |
#otvorenýhardvér |
|
#otvorenávláda |
| Romanian |
democrația digitală |
e-democrația |
date deschise |
Open Hardware/ sursa deschisa |
sursă deschisă |
guvern deschis |
#democrațiadigitală |
#edemocrația |
#datedeschise |
#OpenHardware/sursadeschisa |
#sursădeschisă |
#guverndeschis |
| Portuguese |
Democracia virtual |
e-democracia |
dados abertos |
hardware livre |
código aberto |
governo aberto |
#Democraciavirtual |
#edemocracia |
#dadosabertos |
#hardwarelivre |
#códigoabierto |
#governoaberto |
| Slovenian |
digitalna demokracija |
e-demokracija |
odprti podatki |
odprta strojna oprema |
Odprta koda |
odprta vlada |
#digitalnademokracija |
#edemokracija |
#odprtipodatki |
#odprtastrojnaoprema |
#Odprtakoda |
#odprtavlada |
| Latvian |
interneta demokrātija |
E-demokrātija |
atveriet datus |
atvērt aparatūru |
Atvērtais pirmkods |
atvērta valdība |
#internetademokrātija |
#Edemokrātija |
#atverietdatus |
#atvērtaparatūru |
#Atvērtaispirmskods |
#atvērtavaldība |
| Language |
Digital Democracy |
E-Democracy |
Open Data |
Open Hardware |
Open Source |
Open Government |
Tag: Digital Democracy |
Tag: E-Democracy |
Tag: Open Data |
Tag: Open Hardware |
Tag: Open Source |
Tag: Open Government |
| Lithuanian |
skaitmeninedemokr |
e-demokratija |
atviri duomenys |
atvira technine iranga |
atviras resursas |
atvira vyriausybė |
#skaitmeninedemokratija |
#edemokratija |
#atviriduomenys |
#atviratechnineiranga |
#atvirasresursas |
#atviravyriausybė |
| Hungarian |
digitális demokrácia |
Az e-demokrácia |
nyitott adatok |
nyitott hardver |
nyílt forráskód |
nyitott kormány |
#digitálisdemokrácia |
#Azedemokrácia |
#nyitottadatok |
#nyitotthardver |
#nyíltforráskód |
#nyitottkormány |
| Czech |
digitální demokracie |
e-demokracie |
Otevřená data |
otevřený hardware |
|
otevřená vláda |
#digitálnídemokracie |
#edemokracie |
#Otevřenádata |
#otevřenýhardware |
|
#otevřenávláda |
| Bulgarian |
цифрова демокрация |
е-демокрация |
отворени данни |
отворен хардуер |
отворен код |
отворено правителство |
#цифровадемокрация |
#едемокрация |
#отворениданни |
#отворенхардуер |
#отворенкод |
#отвореноправителство |
| Swedish |
digital demokrati |
E-demokrati |
Öppna data |
Öppen hårdvara |
Öppen källkod |
öppen regering |
#digitaldemokrati |
#Edemokrati |
#Öppnadata |
#Öppenhårdvara |
#Öppenkällkod |
#öppenregering |
| Estonian |
digitaalseks demokraatiaks |
E-demokraatia |
Avaandmed |
avatud riistvara |
Avatud lähtekood |
avatud valitsus |
#digitaalseksdemokr aatiaks |
#Edemokraatia |
#Avaandmed |
#avatudriistvara |
#Avatudlähtekood |
#avatudvalitsus |
| Maltese |
demokrazija diġitali |
e-demokrazija |
data miftuħa |
hardwer miftuħ |
sors miftuħ |
gvern miftuħ |
#demokrazijadiġitali |
#edemokrazija |
#datamiftuħa |
#hardwermiftuħ |
#sorsmiftuħ |
#gvernmiftuħ |
| Polish |
demokracjacyfrowa |
e-demokracja |
otwarte dane |
open hardware |
otwarte źródło |
otwarty rząd |
#demokracjacyfrowa |
#edemokracja |
#otwartedane |
#openhardware |
#otwarteźródło |
#otwartyrząd |
| Croatian |
elektronička demokracija |
E-demokracija |
otvoreni podaci |
otvoreni hardver |
Otvoreni kod |
otvorena vlada |
#elektroničkademokracija |
#Edemokracija |
#otvorenipodaci |
#otvorenihardver |
#Otvorenikod |
#otvorenavlada |
| Irish |
daonlathas digiteach |
e-daonlathas |
sonraí oscailte |
crua-earraí oscailte |
Foinse oscailte |
rialtas oscailte |
#daonlathasdigiteach |
#edaonlathas |
#sonraíoscailte |
#cruaearraíoscailte |
#Foinseoscailte |
#rialtasoscailte |
Appendix 3. PCA loadings
Table 14. Indicator loadings for each of the 7 principle components. Loadings of more than 0.15 are highlighted green and less than -0.15 are highlighted red.
| Principle component |
Access to Volunteers |
Positive attitudes to civil society |
Social cohesion |
Individual giving |
Public advocacy for DSI (e.g from political / leading figures) |
Presence of supportive government policy for social purpose initiatives |
Events where people can meet to network / discuss DSI |
Online collaboration |
Civil society collaboration with tech sector |
Government collaboration with civic society |
Government collaboration with tech sector |
Engagement with DSI |
Diversity within the tech sector |
Diversity within the civic sector |
Activity to make innovation more inclusive |
Digital inclusion |
Availability of Seed Grant Funding |
Availability of Major Grant Funding |
Flexibility of funding |
Availability of impact investment |
Willingness of public and social sector procure from startups |
Access to fast broadband and mobile internet |
Access to flexible workspace |
Access to fabrication and manufacturing facilities |
Openness of data |
Presence of socially focused business support |
Ease of starting a business |
Presence of research institutions with expertise in DSI |
Access to Business, HR, legal, marketing, design and media support |
Access to employees with data skills |
Access to employees with Software Engineering / Development skills |
Access to employees with service design skills |
| 0 |
0.32 |
0.21 |
0.19 |
0.33 |
0.10 |
0.09 |
0.18 |
0.15 |
0.04 |
0.25 |
0.27 |
0.14 |
-0.03 |
-0.03 |
-0.19 |
0.28 |
0.24 |
0.03 |
0.11 |
0.23 |
0.00 |
0.07 |
0.18 |
0.04 |
0.26 |
0.09 |
0.16 |
0.02 |
0.32 |
-0.04 |
0.03 |
-0.07 |
| 1 |
0.02 |
0.16 |
0.06 |
-0.04 |
-0.08 |
-0.18 |
0.09 |
-0.04 |
-0.31 |
-0.14 |
-0.19 |
0.12 |
0.26 |
-0.03 |
0.00 |
0.00 |
-0.02 |
0.12 |
0.17 |
0.17 |
-0.17 |
0.02 |
0.12 |
0.07 |
-0.09 |
0.20 |
0.20 |
0.17 |
-0.05 |
0.43 |
0.31 |
0.41 |
| 2 |
-0.07 |
0.03 |
-0.10 |
-0.14 |
0.31 |
-0.14 |
-0.05 |
-0.04 |
0.14 |
-0.23 |
0.06 |
-0.04 |
0.14 |
-0.30 |
0.06 |
-0.08 |
0.28 |
0.47 |
0.28 |
-0.01 |
-0.14 |
0.34 |
0.07 |
-0.07 |
-0.01 |
-0.12 |
0.15 |
-0.21 |
-0.03 |
-0.12 |
-0.08 |
-0.11 |
| 3 |
-0.20 |
-0.06 |
-0.29 |
-0.10 |
-0.01 |
0.16 |
0.11 |
0.22 |
0.37 |
-0.14 |
0.05 |
0.34 |
0.19 |
-0.05 |
-0.02 |
-0.23 |
0.10 |
-0.04 |
-0.18 |
0.19 |
0.01 |
0.00 |
0.05 |
0.30 |
0.09 |
0.30 |
0.00 |
0.31 |
0.02 |
0.01 |
-0.22 |
0.01 |
| 4 |
0.01 |
0.22 |
-0.15 |
0.05 |
-0.13 |
-0.19 |
0.34 |
0.27 |
0.07 |
0.02 |
-0.22 |
-0.21 |
-0.19 |
-0.28 |
-0.01 |
-0.24 |
-0.12 |
-0.08 |
-0.08 |
0.28 |
-0.10 |
-0.15 |
0.28 |
-0.21 |
-0.25 |
-0.04 |
-0.07 |
-0.21 |
0.15 |
-0.03 |
-0.11 |
-0.04 |
| 5 |
-0.02 |
0.06 |
0.08 |
0.08 |
-0.27 |
-0.48 |
-0.15 |
-0.05 |
-0.03 |
-0.01 |
-0.02 |
0.08 |
-0.24 |
-0.30 |
-0.33 |
-0.03 |
-0.16 |
0.16 |
0.15 |
-0.06 |
0.19 |
0.09 |
-0.23 |
0.31 |
0.01 |
0.19 |
-0.13 |
0.15 |
0.08 |
-0.11 |
-0.03 |
-0.12 |
| 6 |
0.02 |
-0.02 |
-0.18 |
0.00 |
-0.35 |
0.08 |
-0.10 |
-0.15 |
0.03 |
-0.15 |
-0.07 |
0.10 |
-0.06 |
0.00 |
-0.45 |
-0.06 |
0.19 |
-0.07 |
-0.21 |
-0.04 |
-0.28 |
0.03 |
-0.27 |
-0.19 |
0.13 |
-0.21 |
0.35 |
-0.17 |
0.19 |
0.10 |
-0.12 |
0.12 |
| 7 |
0.03 |
0.06 |
-0.24 |
0.11 |
0.32 |
0.20 |
-0.25 |
-0.12 |
0.04 |
0.06 |
-0.08 |
0.00 |
-0.11 |
-0.33 |
-0.17 |
0.09 |
0.23 |
-0.04 |
0.19 |
-0.10 |
0.23 |
-0.45 |
0.00 |
-0.01 |
-0.26 |
-0.05 |
-0.04 |
0.12 |
0.04 |
0.20 |
-0.11 |
0.19 |
| 8 |
-0.01 |
0.41 |
0.00 |
0.05 |
-0.07 |
0.03 |
-0.17 |
-0.44 |
0.02 |
0.05 |
-0.12 |
0.12 |
0.12 |
-0.06 |
0.28 |
-0.11 |
-0.15 |
-0.05 |
-0.14 |
0.06 |
0.34 |
0.00 |
0.10 |
-0.13 |
0.04 |
0.21 |
0.40 |
-0.07 |
0.04 |
-0.18 |
-0.12 |
-0.11 |





