About the Education Policy Institute
The Education Policy Institute is an independent, impartial, and evidence-based research institute that promotes high quality education outcomes, regardless of social background. We achieve this through data-led analysis, innovative research and high-profile events.
About UK 2040 Options
UK 2040 Options is a policy project led by Nesta that seeks to address the defining issues facing the country, from tax and economic growth to health and education. It draws on a range of experts to assess the policy landscape, explore some of the most fertile areas in more depth, test and interrogate ideas and bring fresh angles and insights to the choices that policymakers will need to confront, make and implement. options2040.co.uk
About Nesta
We are Nesta. The UK's innovation agency for social good. We design, test and scale new solutions to society's biggest problems, changing millions of lives for the better. nesta.org.uk
This report was produced in partnership with Nesta, as part of UK 2040 Options.
nesta
Introduction
This report highlights 11 key facts about education in England in 2023 that will underlie the challenges and policy responses in the decades ahead. It is part of Nesta's UK 2040 Options project, which is exploring policy options to improve outcomes for the children born today who will be reaching adulthood in the 2040s.
- Fact 1: England performs well against international comparators.
- Fact 2: Around 40 per cent of the disadvantage gap at age 16 is already evident by age 5
- Fact 3: Quality early years education and care leads to better outcomes but, for the average family, costs can amount to a quarter of their income
- Fact 4: Today's geographic attainment inequalities will become tomorrow's disparities in earnings and quality of life
- Fact 5: While the overall population is set to increase, the number of children in the UK will fall by 1.5 million by 2040
- Fact 6: Many more children are missing school, with one-in-five pupils now persistently absent and vulnerable children amongst the worst affected
- Fact 7: Rising demand and an unresponsive funding system has meant that the school system is struggling to support some of our most vulnerable children
- Fact 8: Spending on education is above the OECD average, but schools and colleges have faced a funding squeeze that now looks set to continue
- Fact 9: The government is recruiting fewer than two-thirds of the secondary teachers it needs, and a third of teachers leave within five years
- Fact 10: England is home to world class universities, but challenges remain around financial sustainability
- Fact 11: Closing the gap between skill supply and employer demand could increase national productivity by 5 per cent.
Many of the challenges will be familiar to those in the sector and beyond. The teacher recruitment and retention shortage and the pressures on school and college funding have been key features of the public debate around education in recent years. In addition, inequalities between disadvantaged pupils and their peers underpin many of the challenges we identify, from access to high quality early education and care, to regional disparities in school attainment outcomes and an inadequate system for pupils with special educational needs.
Although inequality was already rising, the Covid-19 pandemic has exacerbated these issues, with pupils from disadvantaged backgrounds falling further behind their peers and experiencing increased rates of persistent absence.
But there are also many opportunities awaiting the sector. For instance, the role of technology, including artificial intelligence, in supporting pupils or helping with teacher workload; whether there should be reforms to qualifications and curriculum to meet the skills gap facing this country; or whether we should be aspiring to a more integrated further and higher education system which might provide greater choice for young people.
Education can have a transformative effect on the life chances of young people, enabling them to fulfil their potential, have successful careers, and grasp opportunities. As well as having a positive impact on the individual, high quality education and wellbeing also promotes economic productivity and a cohesive society.
Understanding the challenges the system faces is crucial to achieving that aim.
Fact 1: England performs well against international comparators.
Pupils in England perform well across all the major international benchmarking assessments that measure performance in years 5, 9 and 11.
In the most recent Progress in International Reading Literacy Study (PIRLS) for year 5 pupils, England was placed fourth overall, behind only Russia, Hong Kong and Singapore. Comparisons with other countries were, however, complicated in this round by the pandemic which affected the point at which countries took the test.
England's overall performance was significantly above average in mathematics and science for pupils in both year 5 and year 9 in the latest Trends in International Mathematics and Science Study (TIMSS). However, England was behind the group of highest performing countries with signs of declines in science amongst older pupils.
Outcomes in mathematics for England's 15-year-olds showed a statistically significant increase in the 2018 round of PISA (the Programme for International Student). Results in reading and science have not changed significantly over successive PISA cycles, though they remain, as with mathematics, statistically significantly above the OECD average.
In December 2023, the OECD will publish the latest PISA data which will tell us whether England is still ranked above the OECD average or whether the Covid-19 pandemic has pushed us down the international league table.
Figure 1: England performs well against international comparators, but it is not a simple story of continued progression
A series of line charts showing performance in Reading, Mathematics, and Science for year 5, 9, and 11 pupils in England compared to international median/OECD average over various years (2001-2021). The charts show fluctuations in scores, with England generally performing above average but not always showing continuous progression.
Source: PISA 2018, PIRLS 2021, TIMSS 2019
The Government has set an ambitious target for 90 per cent of primary school pupils to be reaching the expected standard in key stage 2 reading, writing and mathematics by the end of the decade. This has been made even more challenging by the impact of the pandemic.
Reaching the 90 per cent target will require a step change in performance overall. In 2019, the latest year for which we have data, less than 5 per cent of mainstream primary schools reached the 90 per cent target.
In the first post-pandemic assessments in 2022, the proportion of pupils achieving the expected standard had fallen by 6 percentage points from the last pre-pandemic assessments in 2019. This fall was driven by lower attainment in both writing and mathematics. However, those same assessments showed that results in reading had recovered, consistent with the findings from PIRLS.
There has been a similar pattern of results for older pupils. The National Reference Test (NRT) in English and mathematics is taken by a representative sample of year 11 pupils. Based on results from the 2023 test, outcomes in English have held up with no statistically significant change in outcomes since 2020. However, there has been a statistically significant decline in mathematics performance at both grade 4 and above, and grade 7 and above.
Figure 2: The government's target for performance at the end of primary school would have been very ambitious even before the pandemic. It now requires a rapid rate of improvement.
A line chart showing the percentage of pupils reaching the expected standard, illustrating "Current performance" (53% in 2015/16 rising to 65% in 2018/19, then falling to 59% in 2020/21 and 2022/23), "Rate of improvement required to reach 90% target" (a steep upward trajectory), and "Where we get to if we now match pre-pandemic improvement (around 2 ppt per year)" (a more gradual upward slope, falling far short of the target).
Source: 'Key Stage 2 attainment (provisional): 2023', (September 2023) with author's trajectories
Figure 3: In 2023, 270,000 primary aged pupils did not reach the expected standard in all of reading, writing and mathematics. The majority would need to if the government is to reach its target for attainment at the end of primary school.
A bar chart showing three categories:
- 75% would need to reach the standard in order to hit the government's 90% ambition.
- 42% are from disadvantaged backgrounds.
- 40% have an identified special educational need.
Source: Analysis of 'Key Stage 2 attainment (provisional): 2023', (September 2023)
Fact 2: Around 40 per cent of the disadvantage gap at age 16 is already evident by age 5
There are persistent gaps in attainment between pupils from disadvantaged backgrounds and their peers. In 2022, this gap was equivalent to around 19 months of learning by the time pupils sat their GCSEs.
Around 40 per cent of the gap at age 16 is already visible at age 5, meaning that if we can narrow the gap in the early years, we will make significant headway in reducing it by the time young people sit their GCSEs. But whilst early education has the potential to benefit those from disadvantaged backgrounds the most, existing use is highest amongst better off families.
There has been a sizeable shift in early years spending away from the tax and welfare system towards free entitlement. This growth in funded hours has been popular with parents but has put pressure on providers. It has disproportionately benefited those higher up the income distribution.
The pandemic has also made things more challenging. Survey data suggests both parents and schools believed that children had been disadvantaged in their wellbeing, as well as in their language and numeracy skills when entering Reception classes in 2020 due to their experiences during the Covid-19 pandemic.
Figure 4: the disadvantage gap is evident in the early years and grows throughout school, but not at a consistent rate.
A pie chart illustrating the development of the disadvantage gap.
- Two fifths of the gap is already present by age five. (top right, dark blue segment)
- One fifth of the gap develops during the course of primary school, two thirds of which happens during reception and key stage 1. (bottom, orange segment)
- The remaining two fifths of the gap emerge during key stage 3 and key stage 4. (top left, grey segment)
Source: 'Divergent pathways: the disadvantage gap, accountability, and the pupil premium', (July 2016)
Figure 5: The disadvantage gap in months – progress had stalled before the pandemic, it then widened to its highest level in a decade
A line chart showing the disadvantage gap in months for EYFSP, Key Stage 2, and Key Stage 4 from 2010/11 to 2021/22. The chart indicates that the gap widened significantly after 2019/20 and 2020/21, which had no assessments due to the pandemic. Key Stage 4 gap in 2021/22 was 18.8 months, Key Stage 2 was 10.3 months, and EYFSP was 4.8 months.
Source: 'EPI Annual Report 2023', (October 2023)
For pupils in primary and secondary schools, the attainment gap between disadvantaged pupils and their peers had stopped closing even before the pandemic.
Pupils from low-income backgrounds were more affected by lockdown restrictions than their peers. The gap between disadvantaged pupils and their peers widened over the course of the pandemic such that the disadvantage gap in 2022 was the highest it had been in a decade in the early years (4.8 months), at the end of primary school (10.3 months), and at GCSE (18.8 months).
While progress had been slow (and indeed stalling), the decade prior to the pandemic did prove that the disadvantage gap could be tackled. Between 2011 and 2016, the gap in secondary schools closed by 8 per cent. Targeted funding through the Pupil Premium and an associated focus on the outcomes of disadvantaged pupils in the accountability system may both have played a role. On average, schools with the highest concentration of disadvantaged pupils made the greatest progress in narrowing the gap.
Based on the trend in closing the gap up until 2016, we were able to predict that the gap would close within around 50 years. That would have meant that, by 2040, we would be around halfway to fully closing the gap. However, the widening of the gap over the last five years has meant we can no longer predict when it will close if, indeed, it ever will.
Fact 3: Quality early years education and care leads to better outcomes but, for the average family, costs can amount to a quarter of their income
High quality early education can improve children's educational, wellbeing, and socio-emotional skills in the short and longer-term and can have a protective effect for disadvantaged children stretching into adulthood.
The current system offers little support to families with the youngest children. The 2023 Spring Budget announced an extension of 30 hours of free childcare to working parents of children aged 9 months to 2 years, but this will not address the issue of lack of accessibility of early childhood education and care (ECEC) for the poorest children whose parents are not in work and may even reduce accessibility if disadvantaged children are crowded-out or providers are forced out of business.
Childcare can be a sizeable proportion of family budgets, particularly for those with the youngest children. For a couple with two children aged 2 and 3, net costs represent 25 per cent of their average wage, which is more than double the OECD average.
For parents using formal childcare (like nurseries and childminders), costs are highest in London, averaging £7.31 for an hour's care but affordability can be a considerable challenge elsewhere given variation in median earnings across the country.
Figure 6: Costs of childcare can represent a sizeable percentage of family budgets, and affordability – measured as cost for two-year-olds per hour as proportion of median hourly wage - varies considerably across the country
A bar chart showing the cost of childcare for two-year-olds per hour as a proportion of median hourly wage across various local authorities. The values range from 0.46 (Hammersmith and Fulham) to 0.26 (Swindon). There are distinct groups of high and lower proportions, with London boroughs generally having higher costs.
Source: 'The cost of childcare: where are England's affordability blackspots?', (March 2023)
The early years workforce included around 339,800 paid staff in 2022. Whilst national figures across the whole early years sector are broadly stable, there are major issues in both recruitment and retention.
These challenges seem to be more acute in private, voluntary, and independent settings than in school-based settings, with reasons for high turnover including low pay, unfavourable working conditions and unrealistic staff expectations of the role. Alongside pay, the major determinant of staffing costs is staff-to-child ratios.
Just 8.6 per cent of the early years workforce have accredited graduate status (early years teacher status or qualified teacher status), despite evidence that direct contact with graduate staff has a positive impact on children's outcomes.
Figure 7: The new early years entitlement places further demand on an already over-extended workforce – estimates of the number of early years professionals needed by 2028
A line chart showing the estimated number of early years professionals needed from 2018 to 2028. Lines are shown for "High", "Most likely high (current ratios)", "Most likely low (relaxed ratios)", and "Low". The "Most likely high" scenario indicates a need for around 370,000 professionals by 2028, with a textual annotation stating that "Under the most plausible scenario, between 24,850 and 27,580 early years professionals will be needed by 2028 to deliver the expected increase in formal childcare hours."
Source: 'How many early-years professionals do we need? Estimating the requirement by 2028', (September 2023)
Fact 4: Today's geographic attainment inequalities will become tomorrow's disparities in earnings and quality of life
There are stark differences in the outcomes of children and young people in different parts of the country. In summer 2022, around a quarter of students in London completed compulsory schooling having not achieved a grade 4 (considered to be a standard pass) in English and mathematics. Across the north of England this increased to a third, and in some parts of the country, as many as a half of students did not achieve this threshold, that is critical to many opportunities of further study or employment.
But this is not a simple north-south divide in attainment. When we look further, we can see that there are big differences between local authorities within regions. North Tyneside, Redcar and Cleveland, Gateshead, and Stockton-on-Tees all outperform a number of London boroughs on this measure.
Figure 8: There are clear regional differences in outcomes (orange) but within each region we can also see big differences between local authorities (blue)
A dot plot showing the percentage of pupils achieving grade 4 and above in English and mathematics in 2022 for various regions (orange dots, indicating regional average) and individual local authorities (blue dots). Regions shown include North East, North West, Yorkshire and The Humber, West Midlands, East Midlands, South West, East of England, South East, and London. The chart illustrates a wide spread of outcomes within regions, with some northern local authorities outperforming some London boroughs.
Source: 'Key Stage 4 performance 2022', (February 2023)
Going into the pandemic we could see well established geographic variation in the outcomes for pupils from low-income backgrounds. In some areas, poorer pupils were over two full years of education behind their peers by the time they sat their GCSEs, including in Blackpool (26.3 months), Knowsley (24.7 months) and Plymouth (24.5 months). In contrast, there are very low GCSE disadvantage gaps concentrated in London, including in Ealing (4.6 months), Redbridge (2.7 months) and Westminster (0.5 months).
Poorer students were the equivalent of five whole A level grades behind their more affluent students nationally in Knowsley (5.4 A level grades behind) North Somerset (4.8 grades behind) and Stockton-on-Tees (4.7 grades behind). Conversely, in many London areas, poorer students were level or even ahead of their more affluent peers nationally. The areas with the lowest disadvantage gaps in the country are Southwark (poorer students are 1.2 A level grades ahead), Redbridge (0.5 grades ahead) and Ealing (0.5 grades ahead).
But the term disadvantage masks a wide range of experiences, and the solutions are unlikely to sit in schools and colleges alone. The persistence of poverty is a key driver of outcomes and understanding the differences in local demographics is essential in understanding why gaps are different in different parts of the country and how they can best be tackled. Indeed, many areas that rank as having some of the worst attainment gaps significantly improve their position once we take account of persistent poverty.
Lack of provision, or lack of different types of provision, are likely to play a role in the paths that young people take and the range of choices available depends on where you live. The routes available to students in post-16 education varies considerably across the country.
Figure 9: Whether a young person is likely to have access to a range of post-16 providers varies considerably across the country. We illustrate by showing the number of sixth forms and FE colleges in each local authority relative to the number of secondary schools
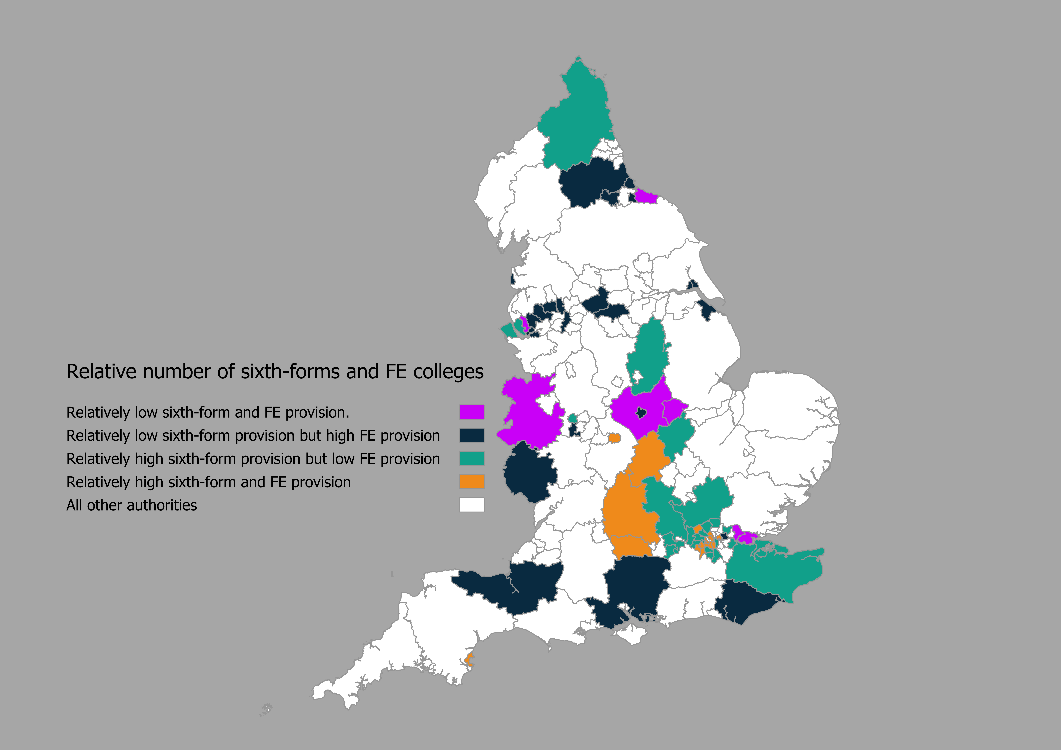
Note: Based on analysis of Get Information About Schools. Map is shaded according to how many sixth forms and FE colleges there are in the local authority, relative to how many schools with year 11 pupils there are with areas grouped into thirds. This approximates to High FE provision meaning at least one FE college to every 11 schools, and low meaning less than one to every 20 schools. High sixth form provision means approximately one sixth-form per 1.2 schools, low sixth-form provision means less than one sixth-form per 2.0 schools. Students will of course be able to cross local authority boundaries to attend provision.
Source: Office for National Statistics licensed under the Open Government License v3.0. Contains OS data © Crown copyright and database right 2023.
Fact 5: While the overall population is set to increase, the number of children in the UK will fall by 1.5 million by 2040
In 2023, the pupil population in state-schools in England was 7.93 million. The Department for Education estimates that this will fall by 802,000 by 2032.
The number of primary aged pupils is already in decline. In 2022, there were 569,000 unfilled places in primary schools, an increase of 2 per cent from 561,000 in 2021, and 24 per cent more than in 2010 (458,000).
The number of pupils in secondary and special schools is expected to peak in the middle of this decade. The scale of the reduction in pupil numbers is equivalent to around 2,100 primary schools and 200 secondary schools. Much of the reduction in pupil numbers will be managed by falling rolls within schools. As funding is primarily determined by the number of pupils a school has, this is likely to mean they receive less money, even if per pupil funding is maintained.
Figure 10: The number of pupils in state-funded schools is expected to decline by about 800,000 over the next nine years
A stacked area chart showing pupil population in state-funded primary, secondary, and special/AP schools from 2010 to 2032. The total pupil population is projected to peak at 7.9m in 2023 and fall by 802k by 2032. Primary pupil population peaked at 4.7m in 2019, and secondary pupil population is projected to peak at 3.2m in 2024.
Source: 'National pupil projections: reporting year 2023', (October 2023)
These population effects are also not consistent. While a quarter of local authorities are forecasting falls of at least 10 per cent in their reception intake between 2021/22 and 2026/27, more than one-in-seven are expecting them to be higher and just under one fifth of schools in England are currently operating at or over capacity.
Figure 11: There are significant geographic differences in how both primary and secondary school intakes are going to change by 2026/27
A scatter plot showing the percentage change in pupil numbers in Reception year (x-axis) versus the percentage change in pupil numbers in Year 7 (y-axis) by 2026/27 for various local authorities in England. Several specific local authorities are highlighted, such as South Gloucestershire, Havering, Liverpool, Leicestershire, Cambridgeshire, Bradford, York, Isle of Wight, Lewisham, Ealing, and Lambeth, showing diverse trends in pupil intake changes.
Source: 'School capacity: academic year 2021/22', (March 2023)
While the falls in pupil numbers are not exceptional by historic standards, reforms to the school system with the expansion of the academies programme will affect how they are managed. Pupil place planning remains the responsibility of local authorities, and managing fluctuations in pupil numbers is made more challenging by the fact that they have no statutory levers to direct academies to adjust admissions numbers.
Fact 6: Many more children are missing school, with one-in-five pupils now persistently absent and vulnerable children amongst the worst affected
Prior to the pandemic, as many as a quarter of a million children were missing out on formal, full-time education. In addition, it is thought that many children simply did not return to school after restrictions to in person teaching ended. But there is no consistent data on children who are home educated, or not in school, and government plans to introduce a statutory register have been postponed.
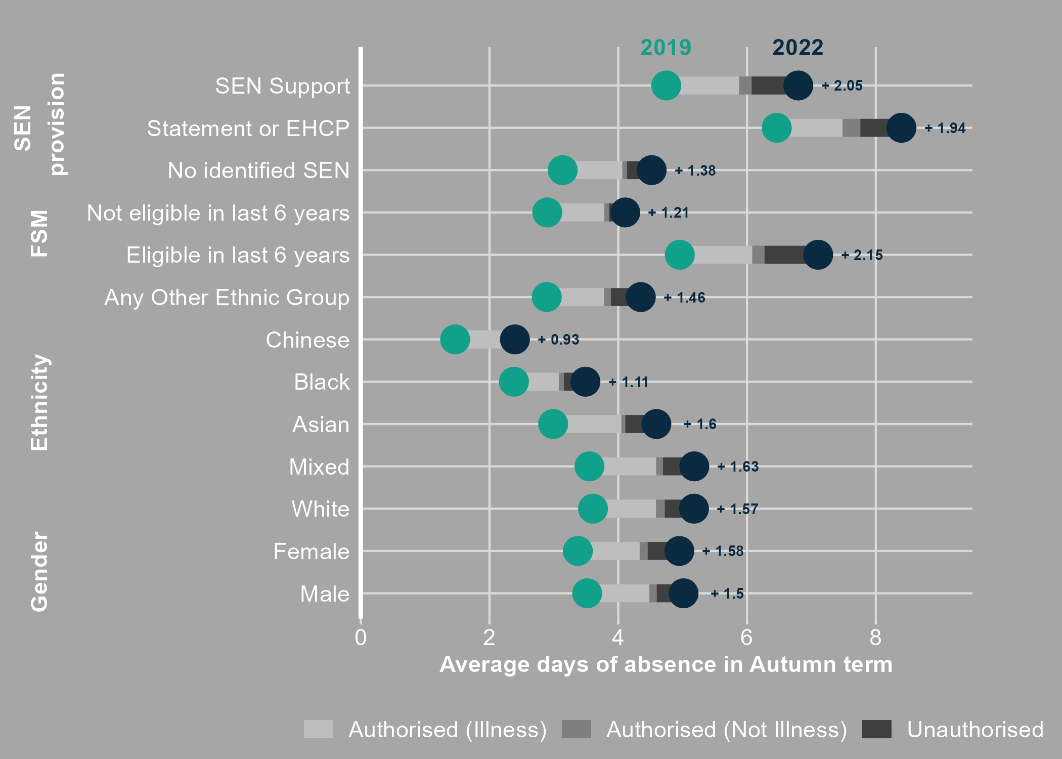
Pupil absence has also increased significantly since the pandemic. In the autumn term of 2022/23, the overall absence rate was 7.5 per cent, compared with 4.9 per cent in autumn 2019/20 (the last term of data prior to the pandemic). Persistent absence - defined as when a pupil misses at least 10 per cent of possible sessions - has also risen sharply, from 13.1 per cent of all pupils to 24.2 per cent over the same period. Both series are now at their highest levels since they began in 2006/07.
Two groups stand out as being worst affected since 2019: disadvantaged pupils and children with special educational needs (SEN). As these groups also entered the pandemic with some of the highest levels of absence, it appears that is also widening educational inequalities for these particular groups.
This widening in the absence gap between disadvantaged pupils and their peers was mostly attributable to reasons other than illness – namely unauthorised absences (which rose more sharply for disadvantaged pupils in absolute terms). It is consistent with mounting evidence that it is the most disadvantaged children and communities whose educational experiences have been most impacted in the wake of the pandemic.
Figure 12: Absence gaps widened for disadvantaged pupils and those with special educational needs between the autumn terms of 2019 and 2022
Source: 'Examining post-pandemic absences in England - part 2', (August 2023)
Fact 7: Rising demand and an unresponsive funding system has meant that the school system is struggling to support some of our most vulnerable children
High needs funding – which supports provision for children with special educational needs and disabilities – has not coped with rising demand. In January 2023, there were just over 389,000 pupils with an Education, Health and Care Plan (EHCP), or statement of special educational needs, in schools in England. That represents an increase of over half over the preceding five years.
A combination of factors is contributing to these rising numbers. These include population growth, advances in medicine, meaning that children born prematurely or with disabilities survive and live longer than before (this also means that additional needs are more complex than ever before), increased diagnosis of some conditions (e.g. autism), increased parental expectations about the support their child should receive, high levels of poverty, and the extension of services for children and young people with special educational needs and disabilities (SEND) up until the age of 25. These numbers do not account for the number of pupils who are home educated because of a lack of suitable provision, nor as concluded by the Education Select Committee, that special provision faces “practices of rationing, gatekeeping and, fundamentally, children and young people's needs being unidentified and unmet.”
Figure 13: The number of pupils with EHCPs has been increasing
A line chart showing the number of pupils with Education, Health and Care Plans (EHCPs) in state-funded special, primary, and secondary schools from 2015/16 to 2022/23. All categories show a consistent increase over the period, with state-funded secondary schools having the largest numbers, reaching 147,427 by 2022/23.
Source: 'Special educational needs in England: January 2023', (June 2023)
Pupils with SEND – particularly those with an EHCP – have, on average, far lower GCSE outcomes than their non-SEND peers. In 2022, pupils with an EHCP were on average nearly 41 months behind their peers. Pupils with SEND without an EHCP were 23 months behind.
Almost 30 per cent of the £10.1 billion of high needs funding in 2023-24 was allocated based on historic data, set at 50 per cent of a local authority's actual spend in 2017-18 (rather than an up-to-date assessment of need). In other words, around a third of high needs expenditure reflects historic spending not current need.
Figure 14: Around a third of funding in the high needs national funding formula is allocated through the historic spend factor – based on spend in 2017/18
A bar chart showing the breakdown of high needs national funding formula components:
- Provisional basic entitlement allocation: £818m
- Historic spend factor funding: £2,786m
- Hospital education and historic pay, pensions and pensions supplementary grant funding: £131m
- Funding floor cost: £204m
- Funding available for other proxy factors: £5,722m
Source: 'High needs funding formula: technical note', (July 2022)
Looked after children are cared for by their local authority for a period of at least 24 hours, for example in a children's residential home or foster home, whilst children in need (CIN) are assessed as needing help and protection because of risks to their health or development. This trend of rising numbers of children in children's social care has been noted in several studies, with the NAO highlighting “significant increases" in the most serious cases. These patterns are also not unique to England and have been broadly mirrored in Wales and Northern Ireland over the last decade, though not in Scotland.
In 2019, looked after children were almost 2.5 years (29 months) behind their peers across GCSE English and maths. The gap for children in need with a child protection plan was smaller but still very wide at 26 months.
Mental health issues amongst children and young people had been gradually increasing over the two decades leading up to the pandemic. In 2017, around 1 in 9 children aged 7-16 had a probable mental health disorder, this increased to 1 in 6 by 2020.
Referrals to NHS mental health services for young people increased by 80 per cent through the pandemic. While there are socio-economic and ethnic differences in the prevalence of mental health issues, gender is the key axis of inequality: around a third of females aged 17 to 24 have probable conditions, compared to a fifth of males.
Mental Health Support Teams (MHSTs) serving groups of schools and colleges are the cornerstone of the current government's response to young people's mental health issues. Despite this investment, need currently far outstrips available support. At the same time, there is evidence that school practices are linked to worse mental health in children, particularly those with existing needs and can lead to exclusion, isolation, failure to identify additional needs, and long wait times for support to be put in place.
Fact 8: Spending on education is above the OECD average, but schools and colleges have faced a funding squeeze that now looks set to continue
Public and private spend on primary to tertiary education in the UK represents 6.3 per cent of GDP, higher than the OECD average of 5.1 per cent. Spending per child, pupil, or student is highest in higher education (£9,600) and lowest in the early years (£4,400).
School spending per pupil fell by 9 per cent in real terms in the decade to 2020. It had been expected that recent increases in school funding would mean that per pupil funding will return to 2009-10 levels in 2024-25, after accounting for school-specific rates of inflation such as increases in teacher pay. The Department for Education has had to reallocate funding from other programmes to help meet the cost of increased teacher pay and ongoing high inflation means that current funding settlements will not be sufficient to give schools the same purchasing power they once had.
The effects of changes in funding have not been felt evenly. Relative expenditure between stages has narrowed, with expenditure in further education seeing a relative decline. Over the last decade, 16-19 funding has fallen in real terms while participation in full-time education has been on the rise. Cuts in 16-19 education have been at twice the rate of those in other school phases.
Figure 15: Per pupil spending in schools is not yet back to levels from 2010
A stacked area chart showing per pupil spending in schools from 2003-04 to 2022-23, broken down into "Spending by schools", "School sixth-form funding", "Spending by local authorities", and "Pension contributions and National Insurance". The total spending per pupil shows a peak around 2010-11, followed by a decline, and then a gradual increase, but not returning to the 2010 peak by 2022-23.
Source: 'Annual report on education spending in England: 2022', (December 2022)
Figure 16: Relative per learner spending has narrowed considerably over the last 30 years
A line chart showing relative per learner spending for "Higher education", "Further education", "Secondary", "Primary", and "Early years" across four time points: 1991-92, 2001-02, 2011-12, and 2021-22. The chart demonstrates that while higher education spending remains the highest, the gap with other stages, particularly early years, primary, and secondary, has significantly narrowed over the decades.
Source: 'Annual report on education spending in England: 2022', (December 2022)
In April 2018, the Department for Education introduced the national funding formula (NFF) for schools to address some of the inequalities in school funding. However, there are no detailed and robust estimates of the cost of running a school. As such the NFF is designed to distribute the total pot of money fairly, based on a set of school and pupil characteristics, but is not necessarily consistent with a school being funded 'correctly'.
The effects of the NFF, and the subsequent policy of ‘levelling-up' funding for schools, have not been felt equally across schools. The design of the NFF has meant that, since 2018, additional funding has been disproportionately targeted towards schools that had historically lower levels of funding and these schools have tended to have less-disadvantaged intakes.
Schools serving the most disadvantaged communities have typically seen funding increase by around 4 per cent in real terms since the introduction of the National Funding Formula in 2018/19. Schools with the very lowest levels of disadvantage have seen funding increase by 8.5 per cent – though these schools still receive lower per pupil funding overall.
Funding for disadvantaged students in 16-19 is based on the deprivation levels of a local area, not on the individual young person (in contrast to the pre-16 funding system), so is less responsive and doesn't benefit from having both an area and student level source of funding.
Figure 17: Increases in school funding since 2017-18 have disproportionately benefited schools serving more affluent communities.
A grouped bar chart showing the percentage increase in school funding (Primary and Secondary) since 2017-18, categorized by the "Percentage of pupils eligible for free school meals (January 2023)". The chart indicates that schools with a lower percentage of pupils eligible for free school meals received higher funding increases (e.g., >= 0% & < 5% received +8.5% for both Primary and Secondary), while schools with a higher percentage of eligible pupils received lower increases (e.g., >= 35% received +4.1% for Primary and +4.0% for Secondary).
Source: 'Education priorities in the next general election', (July 2023)
Fact 9: The government is recruiting fewer than two-thirds of the secondary teachers it needs, and a third of teachers leave within five years
Teacher numbers in both primary and secondary schools have failed to rise in line with increasing pupil numbers. The situation has worsened since the pandemic with recruitment into initial teacher training substantially below the targets set by the Department for Education.
The percentage of the Postgraduate Initial Teacher Training (PGITT) target achieved across primary and secondary schools in 2022/23 was 71 per cent, with the problem particularly acute in secondary schools (59 per cent).
There are particular recruitment challenges for specific subjects and in more disadvantaged schools. Under-recruitment is greatest in computing, design and technology and physics. In physics, less than a fifth of the required trainees were recruited, in part reflecting an increased target because of substantial shortfalls in previous years.
There have been real-terms reductions in teacher salaries since 2010. Salaries for more experienced and senior teachers have fallen by 13 per cent in real-terms since 2010 and starting salaries have fallen by 5 per cent in real-terms. Certain subjects, like STEM, face the issue of pay in competitor occupations being higher than that of teachers' pay. This pay disincentive impacts younger teachers to a greater extent, with teachers outside of London and under the age of 30 earning 10 per cent less than other professionals their age. Those in their 50s earn only 3.5 per cent less.
Figure 18: England's school system has challenges with retention, as illustrated by the cohort of teachers that began teaching in 2017
An infographic showing a grid of human figures, representing a cohort of teachers who began teaching in 2017.
- 15 figures are orange, representing "15 left within a year".
- 16 figures are light blue, representing "16 lasted at least a year but left before five years".
- 69 figures are dark blue, representing "69 were still teaching after five years".
Source: 'School workforce in England 2021/22', June 2022
Teacher vacancies are highest in special schools and alternative provision at 0.9 vacancies per 100 teachers (almost double the rate across all state-funded schools). These schools also have a higher rate of posts being filled on a temporary basis though this is below the recent peak in 2016/17.
Teacher retention is a challenge that is felt even more acutely in further education colleges. In 2019 (the latest point at which there is comparable data) around 25 per cent of college teachers left the profession after one year compared with 15 per cent of teachers in schools. Almost half of college teachers had left the profession after three years (compared with just over a quarter of teachers in schools).
Fact 10: England is home to world class universities, but challenges remain around financial sustainability
Universities in England take nine of the top 100, and three of the top 10 spots in the Times Higher Education World University rankings.
Both the benefits and the costs of higher education are currently shared between individual learners and society, but finding a balance of contributions that is sustainable has been an ongoing challenge for recent governments.
Graduates now owe an average amount of £45,600, and student loan debt in England has now surpassed £200bn. It is now expected that by the mid-2040s, total student debt will reach £460bn.
Following changes to the repayment period and minimum income threshold from this September, the average graduate will pay back around £5,700 more than before. Whilst there will be no change for the very lowest earners, those in the second decile will be nearly £18,000 worse off while those in the ninth decile will benefit by £25,000. These changes will also affect women more than men with an average increase of £12,400. This is because women on average earn less over their lifetimes, and take more time out of the labour market when young than men.
Figure 19: Recent changes to student loan repayment terms represent a shift from higher to lower and middle earning graduates
A grouped bar chart comparing "Pre-2023-24 system" and "2023-24 system" for lifetime repayments across earnings deciles (1 to 9, and Overall). The chart shows that for lower and middle earning deciles, lifetime repayments increase significantly under the 2023-24 system (orange bars are taller), while for higher deciles (e.g., 9), the repayments decrease slightly. The overall average repayment increases from £40,100 to £45,800.
Source: 'Alternative options for higher education fees and funding for England', (May 2023)
In addition to student loans, the level of maintenance support has been based on uncorrected forecasts of inflation. Students from the poorest families will be £1,500 per year worse off than if forecasts had been accurate.
Overall, young people from low-income backgrounds are still less likely to enter higher education at all. While an increasing number of young people have progressed to higher education in recent years, the gap in access between poorer and more affluent students remains stark: students from the most affluent areas are twice as likely to enter higher education than those in the most deprived areas. Students from the most affluent areas are four times more likely to progress to high tariff universities than students from the most deprived areas.
Figure 20: While participation amongst pupils from low-income backgrounds has been increasing, there remains a stubborn gap between them and other pupils which is largely explained by their prior attainment
A line chart showing "Progression to HE by age 19" for "All Other Pupils" (dark blue line) and "Pupils eligible for FSM at age 15" (orange line) from 2009/10 to 2021/22. Both lines show an upward trend, but a significant gap persists, with "All Other Pupils" having a higher progression rate. An additional line shows the "Odds ratio of progression rates" which fluctuates but remains between 2.2 and 2.5, indicating a consistent disparity.
Source: 'Widening participation in higher education', (July 2023)
These large gaps persist despite significant investment from the higher education sector in activities to widen access over the last decade. But much of the gap in progression to higher education is explained by the wide gap in attainment at GCSE.
Fact 11: Closing the gap between skill supply and employer demand could increase national productivity by 5 per cent.
Today, 1 in 10 employers report having a vacancy that they have struggled to fill due to lack of skills or qualifications. Skill-shortage vacancies represent 42 per cent of vacancies in manufacturing, 43 per cent of vacancies in information and communications, and 52 per cent of vacancies in construction.
There is a strong link between educational attainment and labour market outcomes. Lacking any qualifications means you are significantly more likely to be unemployed; more than half of adults who do not currently hold any qualifications are economically inactive compared to 11 per cent of those with a level 4 qualification or above.
However, research from the National Foundation for Education Research and the Nuffield Foundation into what employment skills people will need for working in the future, finds that fundamentally the skills required today – such as communication, collaboration, decision making, problem solving, and information acquisition, processing and analysis – will remain the core skills required in 2035. It also found that of the 2.2 million additional jobs required, all will be in professional and associate professional occupations with an associated need for higher level qualifications and skills.
Figure 21: Employment will be increasingly dominated by services by 2035
A stacked area chart showing employment trends across various sectors from 2010 to 2035. Sectors include "Business and other services", "Trade, accommodation and transport", "Non-marketed services", "Construction", "Manufacturing", and "Primary sector and utilities". The chart projects a significant increase in service sector employment, while manufacturing and primary sectors remain relatively small or decline.
Source: 'Labour market and skills projections: 2020 to 2035', (March 2023)
Despite its importance to the wider economy, the budget for adult education has continuously fallen over the last decade. This includes a 38 per cent reduction in expenditure on adult education and apprenticeships between 2010-11 and 2020-21, and a 50 per cent cut in classroom-based education.
There is also a well-documented employer underinvestment in employee training. Findings from the Employer Skills Survey (ESS) in 2022 indicate that the average number of training days per trainee fell from 7.9 in 2011 to 5.9 in 2022, and from 4.3 to 3.5 per employee. There is a shortage of incentives for employers to invest in employee development when set against other priorities for the reinvestment of profits.
Figure 22: England has relatively low literacy and numeracy scores amongst non-tertiary educated young adults compared with other OECD countries
A scatter plot showing mean literacy score (y-axis) against mean numeracy score (x-axis) for non-tertiary educated young adults across various OECD countries. England is positioned in the lower-middle section, indicating relatively lower scores compared to countries like Japan, Netherlands, and Finland, but higher than Chile and Turkey.
Source: 'OECD - Skills Matter: Further Results from the Survey of Adult Skills', (June 2016)
Figure 23: There has been a steep decline in public expenditure on adult education, particularly on classroom-based education
A stacked area chart showing public spending on adult education (in £ billion in 2022-23 prices) from 2002-03 to 2021-22, broken down into "Work-based learning or apprenticeships" (orange) and "Classroom based adult education" (dark blue). The chart illustrates a significant overall decline in funding, with a particularly steep fall in classroom-based adult education.
Source: 'IFS Adult education and skills – adult education spending over time', (December 2022)
This report highlights 11 key facts about education in England in 2023 that will underlie the challenges and policy responses in the decades ahead.
It is part of the ‘UK 2040: Options' project, which is exploring policy options to improve outcomes for children born today and reaching adulthood around 2040.
UK 2040 OPTIONS EDUCATION POLICY INSTITUTE



