Summary
Catching The Wave provides a window into local authority innovation in England and Wales in the Summer of 2011. It does not provide the full picture of all local authorities, only 38% of councils have applied, and it does not even provide a comprehensive perspective on those who have applied, as each viewpoint is necessarily limited by those who submitted the application to NESTA. Catching The Wave does though, provide the best perspective we have on how local authorities are stepping up to the innovation challenge in the wake of the most dramatic cuts to local government finance in a generation. Catching the Wave is therefore simultaneously partial and important.
The overall picture presented by Catching The Wave is one of a sector that is experiencing a surge in interest and will to innovate. Its ability to innovate is however, where the uncertainty is most prominent.
58% of the applicants are proposing innovative projects, and 38% seeking to support brand new projects. There are indications across most councils of a good understanding of innovation theory, although there are also signs of a challenge in effectively translating this understanding into impact as only 42% of councils are ready to innovate.
Crucially though, there is a good level of openness to receiving external support with only 7% being closed to support (other than financial) and 40% being highly open to support across all projects. This is critical as the two key ingredients for organisational change are the will to change and openness to learning. If these are in place, good progress can be made.
More good news is that the scale of applications, 38% of all local authorities across England and Wales, 78% of County Councils, 63% of London Boroughs, 56% of Unitary Authorities and 58% of Metropolitan Councils suggest that there is a critical mass to support a movement for change.
Whatever happens next, it is clearly a critical moment for local government. Budget reductions have created an unprecedented swell in the interest and will to innovate. Here we outline some ideas for catching the wave of interest and shoring up lasting change.
The purpose of this document is to;
- Quickly and clearly communicate the character, quality and innovation readiness of the applicants for the Creative Councils project
- Explain and map how councils are preparing to meet the current challenges
- Explain how councils are preparing to work differently
- Group different councils in terms of how they are approaching innovation
- Outline support that may be required for different groupings.
About the Authors
Richard Wilson
Richard was the founder and director of Involve and is a director of the social enterprise, izwe. He was involved in shaping the Labour Government policy on empowerment and user involvement. More recently he has worked with the coalition government on the Big Society. His latest publication 'Civic Limits: How Much More Involved Can People Get?' was published by ResPublica in July 2011. Until 2008 he was deputy chair of the UK Government science engagement programme: ScienceWise. Recently he chaired the largest conferences of the French and Swedish EU Presidencies; and the in June 2011, the EU Digital Agenda Assembly. He has worked for many international, national and local government bodies, including most recently the OECD, EC, CLG, London Council's and NESTA. He's a keen writer producing many publications over the years, including four books. He also writes for The Guardian.
Thom Townsend
Thom is a Project Manager at izwe and senior associate at Wilsonielsen. Over the last two years he has been working directly with UK Local Government to deliver innovation projects which have set out to challenge how local government works. With a deep understanding of how innovation takes place in government he has designed and delivered evaluation, project analysis and recommendations to funding partners at London Councils and DCLG and advised private sector organisations on how to deliver effective partnerships with local government. Previously, Thom worked within the private sector before completing postgraduate research into innovation and disruptive change in the International Development sector.
Wilsonielsen
Wilsonielsen helps organisations work better with people.
t: +44 (0)20 7125 0268
a: 47-49 Pitfield Street, London, N1 6DA
w: www.wilsonielsen.com
e: [email protected] | [email protected]
3. The Swell (Analysis Results)
Figure 1: Type of authority that have applied for Creative Councils
Figure 2: Applicant authority types and national totals
Figure 3: Location of all applicants
Figure 4: Project Outcome Areas
Figure 5: Project Output Areas
Figure 6: ICT Projects
Figure 7: Research Projects
Figure 6-13: Project Output Focus and Intended Service Area Focus
Figure 8: Environment Projects
Figure 9: Organisational Improvement Projects
Figure 10: Divestment of Services Projects
Figure 11: Co-Design Projects
Figure 12: Education Projects
Figure 13: Engagement Projects
Figure 14: Social Innovation Strategy Framework
Figure 15: Overall Innovation Breakdown
Figure 16: Overall Project Readiness Breakdown
Figure 17: Old or New Projects Submitted
Figure 18: Disaggregated Authority Innovation Typology Shown as a Percentage
Figure 20: Seniority of Team Submitting Applications
Figure 19 A and B: Centrality to Core Business and Centrality by Innovation Type
Figure 22: Understanding the Innovation Challenge
5. The Shore (Programme Design)
Figure 23: Applicants and Support Type
Figure 24: All Projects Receptiveness to Support
1. Introduction
Local Authorities in England and Wales are going through perhaps their greatest upheaval in a generation. Driven by the reduction in the local authority settlement and a growing awareness by many in local government that the way they work has to change, a new enthusiasm for innovation is sweeping through local authorities across the country. This research looks though, at the longer term goal of supporting local authorities become hubs of innovation, not just in terms of service provision but in how policies are initiated, developed and delivered. Creative Councils aims to change how local government functions from the inside, out; improving how staff work with one another and with external organisations, dissolving historic barriers between people and instead focusing on better services and stronger communities. These are the ultimate goals of Creative Councils.
Catching The Wave seeks to document this surge of interest.
The data that this report is founded upon comes from the 137 applications received for the NESTA and Local Government Group Creative Councils programme in June 2011. 38% of all local authorities across England and Wales applied for the scheme and well over half the County Councils (78%), London boroughs (63%), Unitary Authorities (56%) and Metropolitan Councils (58%). These applications have taken a written form and all findings in this report must be seen through this limited lens and should not be over stated.
It is in this sprit that Catching the Wave has been written, a provisional insight into the character of The Swell (Section 3) in local authority innovation interest, a draft assessment of the implications of this swelling The Break (Section 4) and some initial ideas on how to Shore Up this wave of interest and support more meaningful lasting change (Section 5).
More than anything else, Catching the Wave describes a sector with a clear will to innovate and do things differently; with 58% of councils proposing innovative projects, and 38% seeking to support brand new projects.
There are undoubtably significant challenges to translating the will to innovate into lasting change; for example only 42% of councils are ready to innovate, in that the project outlines provided within the applications point to significantly developed ideas, with high levels of senior buy-in and a clear understanding of the challenge to be addressed. The point however is that the will is often there and the openness to learning in place.
This brief report was compiled and written between the 23rd June and the 18th July 2011 and consists of five major sections including, the report's Methodology (Section 2); Analysis of Results (Section 3), Implications (Section 4) and Programme Design (Section 5).
2. Methodology
Over a two-week period in June and July 2011, 137 applications to the Creative Councils project were analysed. Catching The Wave is based entirely on the applications submitted, and no further contact was made with applicants to explain or clarify any part of the submitted applications.
The data gathering consisted of two central components: research metric development and indicator tagging.
Using an exclusively textual analysis approach, 24 indicators were used to provide insight into:
a) The type of innovation proposed
b) The understanding of the challenge to be addressed
c) The outputs and outcomes of the proposed project
d) The replicability of the project
e) The proposed partnerships for the project and their quality.
Each application was read in full, scored, summarised and tagged and the analysis of the applications was based on the Wilsonielsen research teams' interpretation of only the data available to them in the applications.
3. The Swell (Analysis Results)
The purpose of this section, is to present the key headline results from the analysis in a digestible form. This section exposes the underlying character, The Swell, which has driven the wave of innovation.
Due to the volume of councils submitting proposals, 137 in total, (38% of all local authorities across England and Wales, and well over half the County Councils, London Boroughs, Unitary Authorities and Metropolitan Councils) and the diversity of projects being proposed, it is not always easy to draw clear cut trends. Instead, we have sought to present the information in as clear a way as possible to present a partial picture of local authority innovation at the time of application submission in June 2011.
3.1 Type of Authority
Figure 1 outlines the types of authority which have applied to Creative Councils. The applications comprise of 15% County Councils, 25% District Councils, 15% London Boroughs, 15% Metropolitan Councils and 23% Unitary Authorities and 7.2% Welsh Authorities.
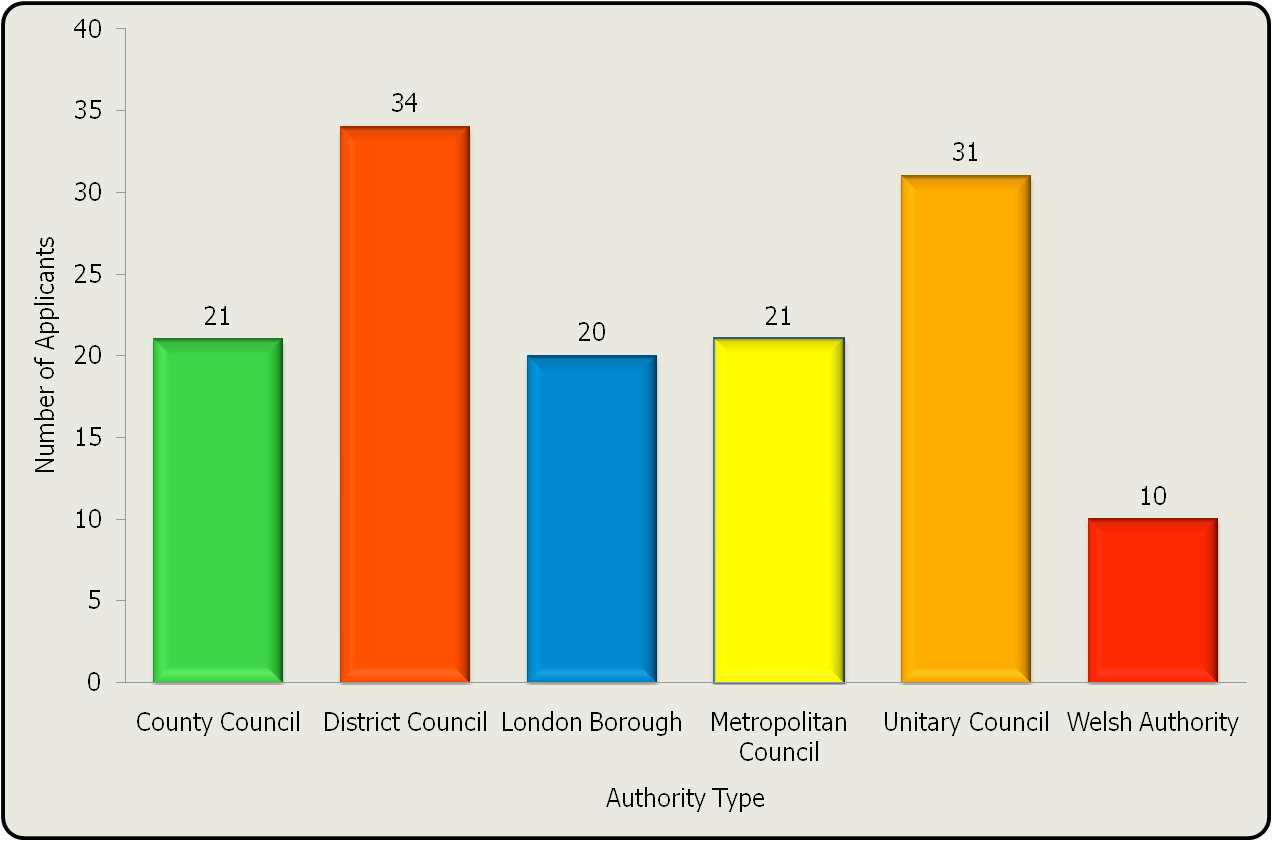
Figure 1: Type of authority that have applied for Creative Councils
3.2 Location of Applicants
In England and Wales, 38% of all authorities submitted an application to Creative Councils. Across all local authorities, discounting District Authorities, 60% have made an application.
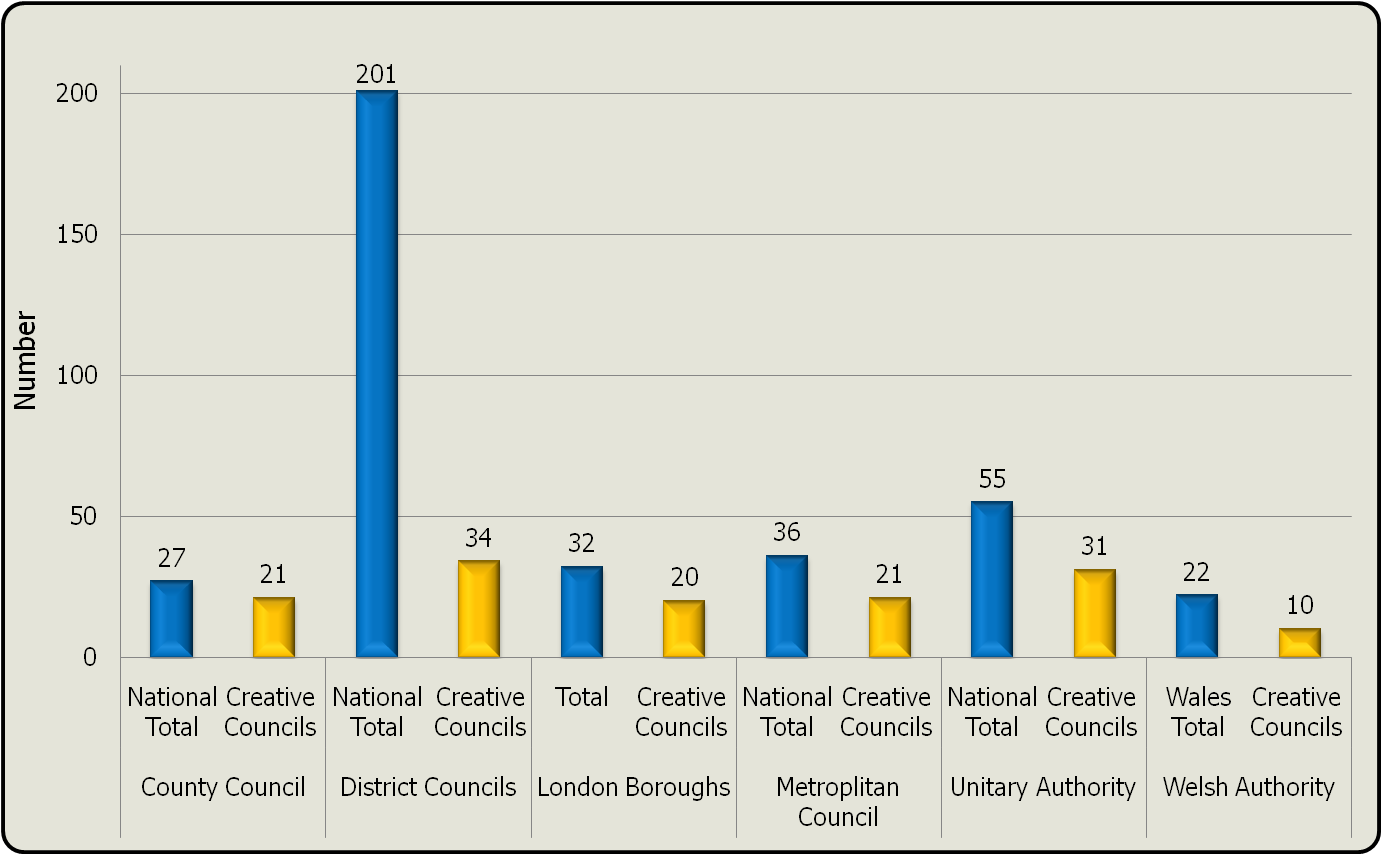
Figure 2 above, outlines the relative proportion of the applicants in relation to the national totals.
This illustrates that 78% of County Councils, 17% of District Councils, 63% of London Boroughs, 58% of Metropolitan Boroughs, 56% of Unitary Authorities and 45% of Welsh Authorities have applied and are therefore included as part of this analysis. With the exception of English District Councils, there is a strong level of applications in all other areas with an especially significant number of Counties and London Boroughs.
Figure 3 shows all applicants by location. There is a good geographical spread of applications with a notable density in the North West (Liverpool and Manchester conurbations). With nearly 66% of London Borough's applying to the programme, a clear grouping also exists in the Capital.
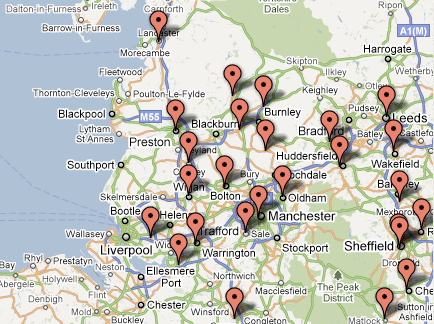
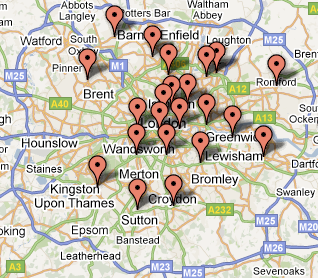
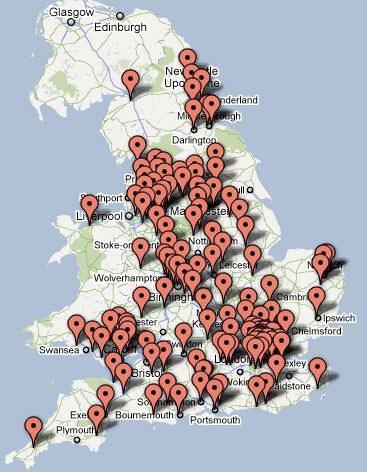
Figure 3: Location of all Applicants
There are no obvious geographic groupings, either in respect of project type or outcomes.
3.3 Overall Typology/Challenge Grouping
The following Figure's (4-13) show the broad type of projects and a breakdown of the service area or group/area of the community the project is intended to impact upon. Finance, Housing and Libraries are omitted in Figure's 6-13 as they each comprise of only one project, and are focussed on 'Whole Community' outcomes.
Here we have outlined the broad foci of projects submitted. Very nearly half (49.6%) are 'Whole Community' focussed, that is, the project's intended outcomes will impact the entire community the applicant serves. Social Services outcome areas represent just over a fifth (21.8%) of projects, unsurprising given the high proportion of local authority spending this service area represents. Internally focussed projects and projects' focussed on older persons services represent the third and fourth largest discrete groups (8% of projects for each focus).
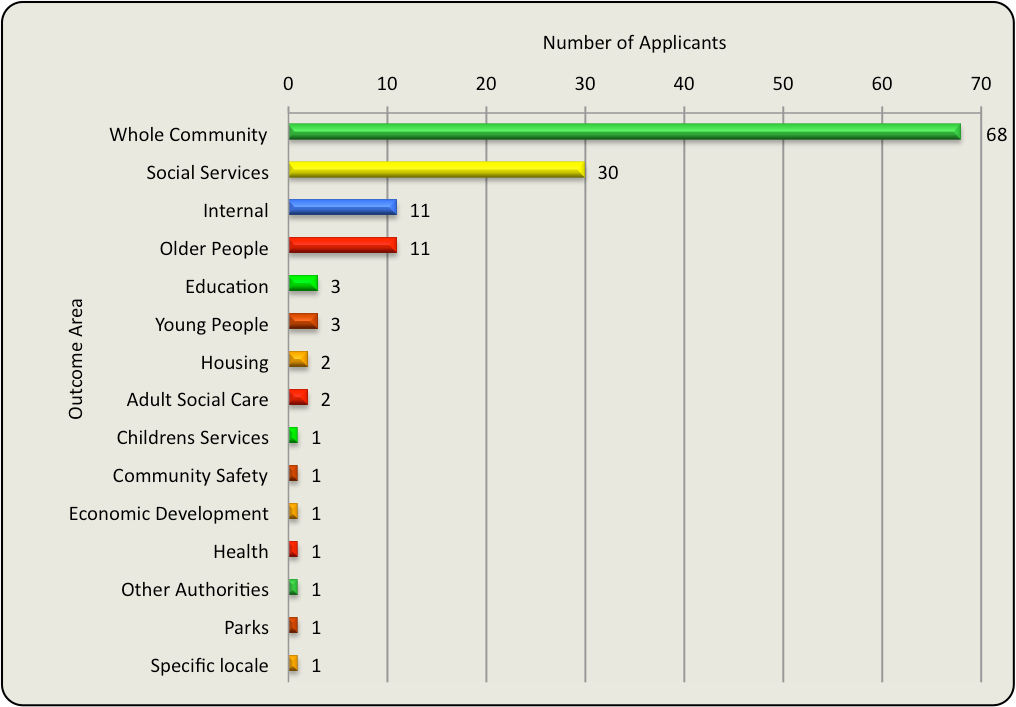
Figure 4: Project Outcome Areas
In the Figure below we have broken down, by number, the type of project outputs, that is the direct outputs of each project, rather than the intended impact area.
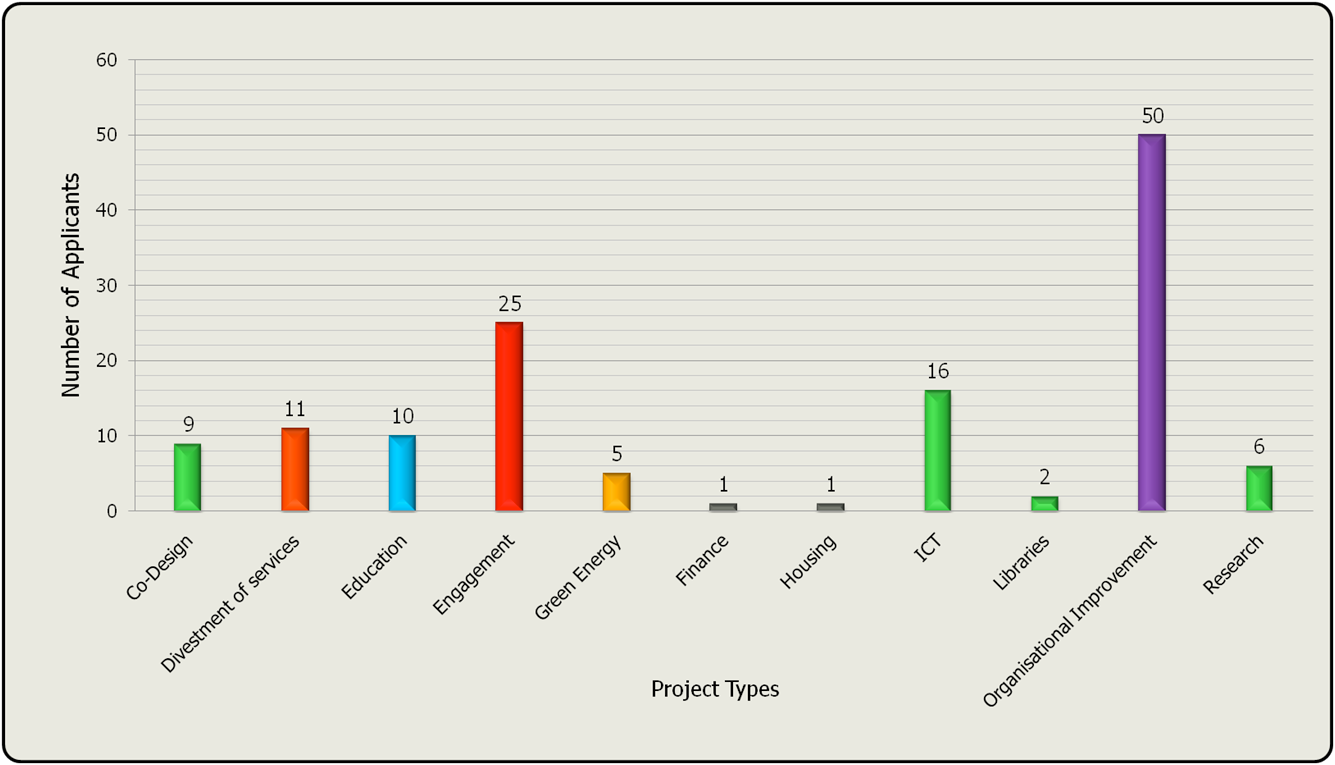
Figure 5: Project Output Areas
In the following eight figure's we disaggregate the top eight project output areas and show the intended outcome area for each.
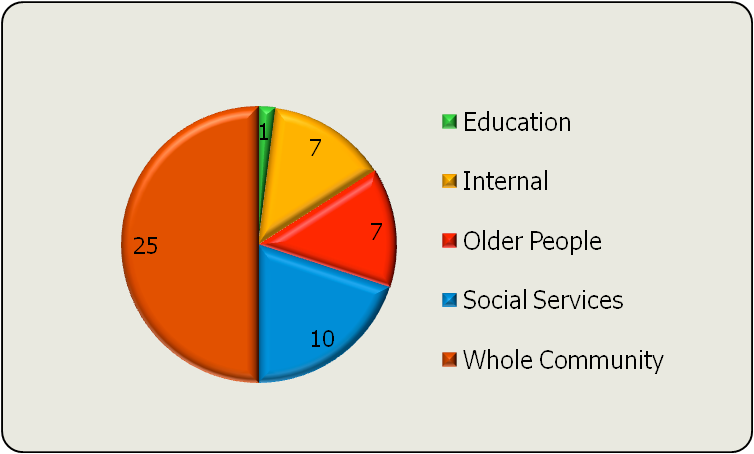
Figure 6: ICT Projects
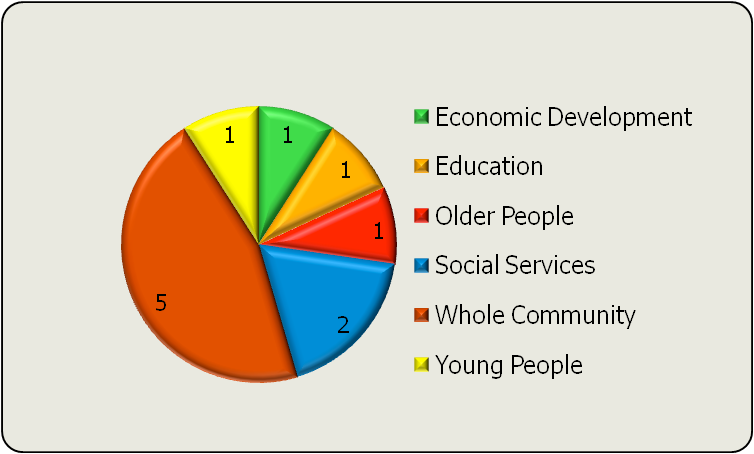
Figure 7: Research Projects
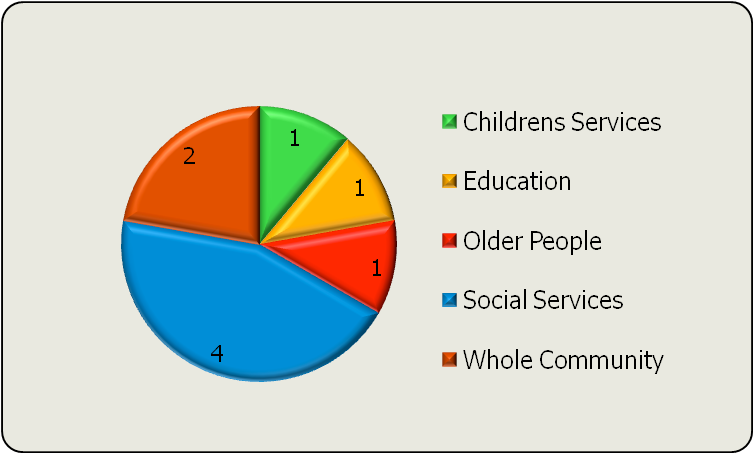
Figure 8: Green Energy Projects
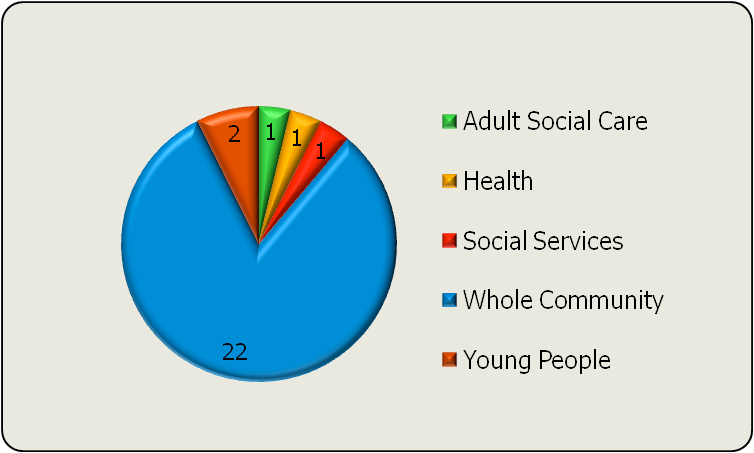
Figure 9: Organisational Improvement Projects
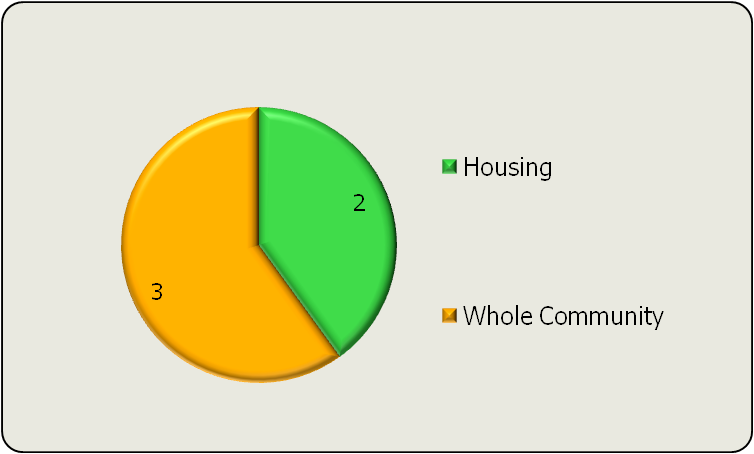
Figure 10: Divestment of Services Projects
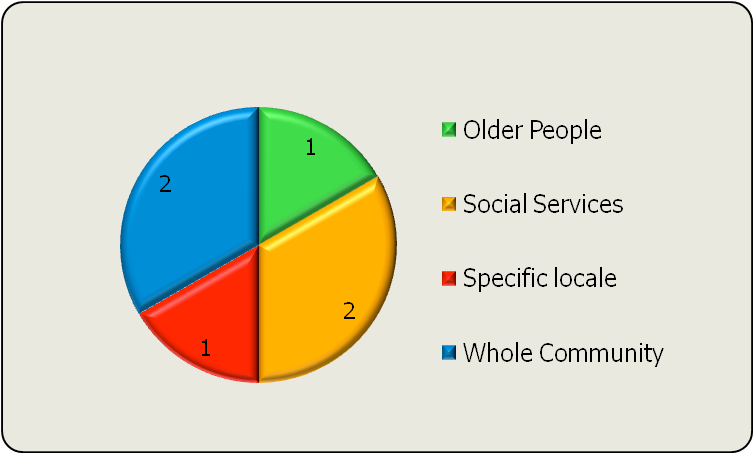
Figure 11: Co-Design Projects
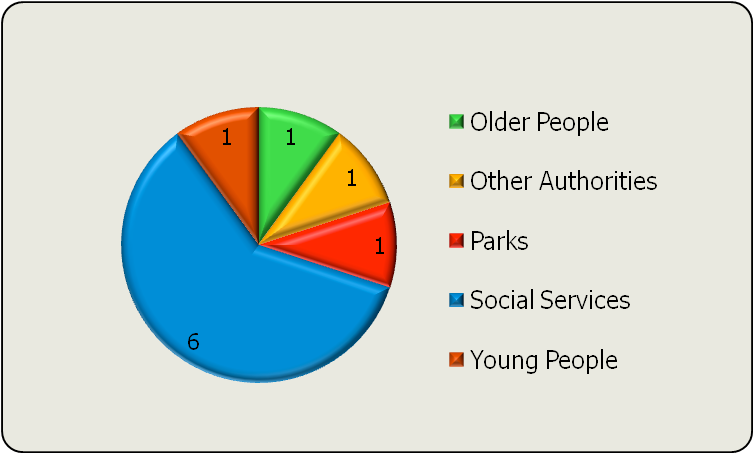
Figure 12: Education Projects
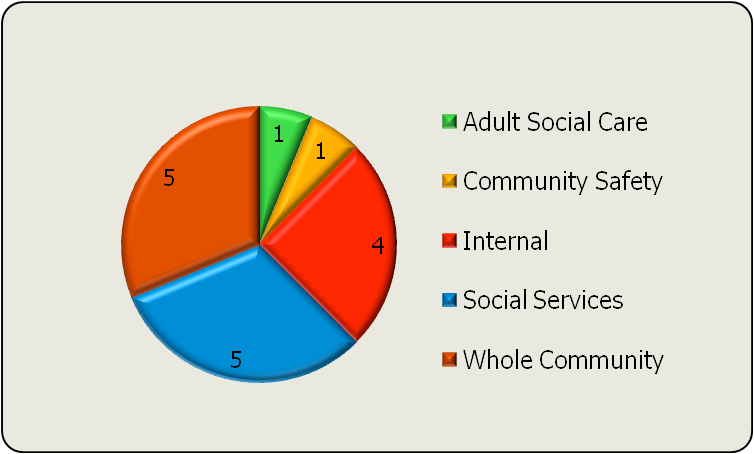
Figure 13: Engagement Projects
3.4 Innovation and Project Readiness
In this section we explore the type of innovation and the degree of project readiness.
Using the Social Innovation Strategy Framework (see Figure 14 below) we have analysed all projects according to their degree of innovation potential. This framework has been used by the NESTA and LG Group team to inform their approach to Creative Councils.
Figure 14: Social Innovation Strategy Framework
This framework categorizes innovation projects based on two dimensions:
- Location: Inside (the organization) or Outside (external engagement)
- Innovation Type: Sustaining (incremental improvement) or Disruptive (radical change)
The four resulting categories are:
- Sustaining & Inside: Improve
- Sustaining & Outside: Combine
- Disruptive & Inside: Reinvent
- Disruptive & Outside: Transform
Figures 15 and 16 on the following pages illustrate the overall proportion of innovation type and project readiness respectively
1 Leadbeater, C. (2011), ‘Choosing the Right Social Innovation Strategy' [presentation], Social Innovation Global Academy, Bilbao April 2011
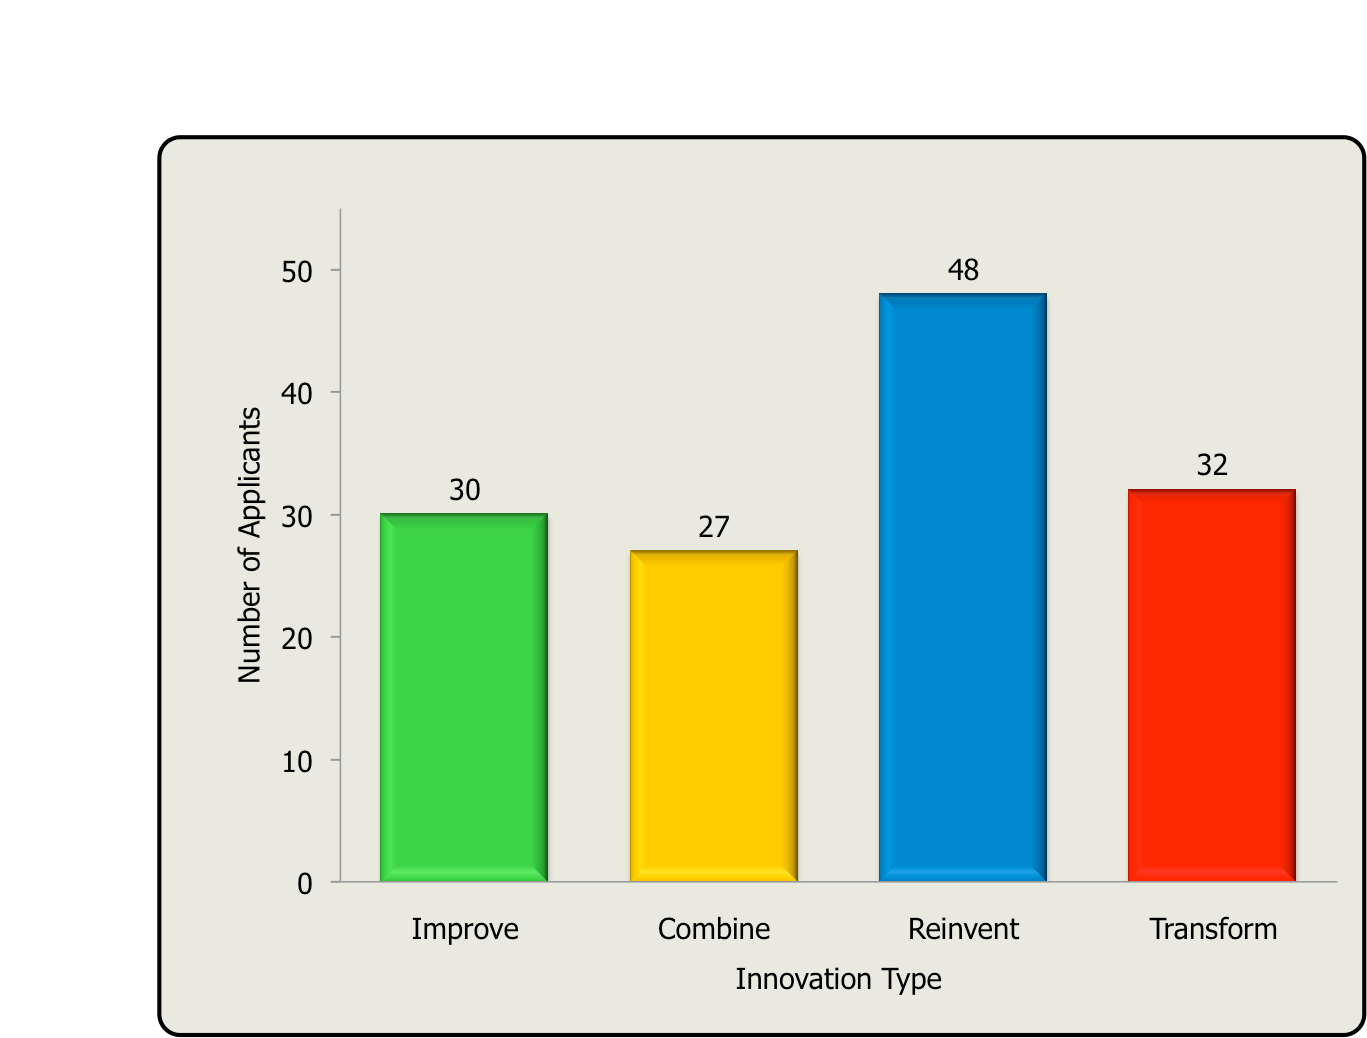
Figure 15: Overall Innovation Breakdown
Through our analysis we at Wilsonielsen have identified 32 ‘Transformative' projects (23%), 48 'Reinvention' projects (35%), 27 ‘Combined' projects (20%) and 30 ‘Improvement' projects (22%).
In the figure's on the following page, we have used 'project readiness' indicators in order to discern the levels of support likely to be required to ensure the projects deliver on their innovation potential.
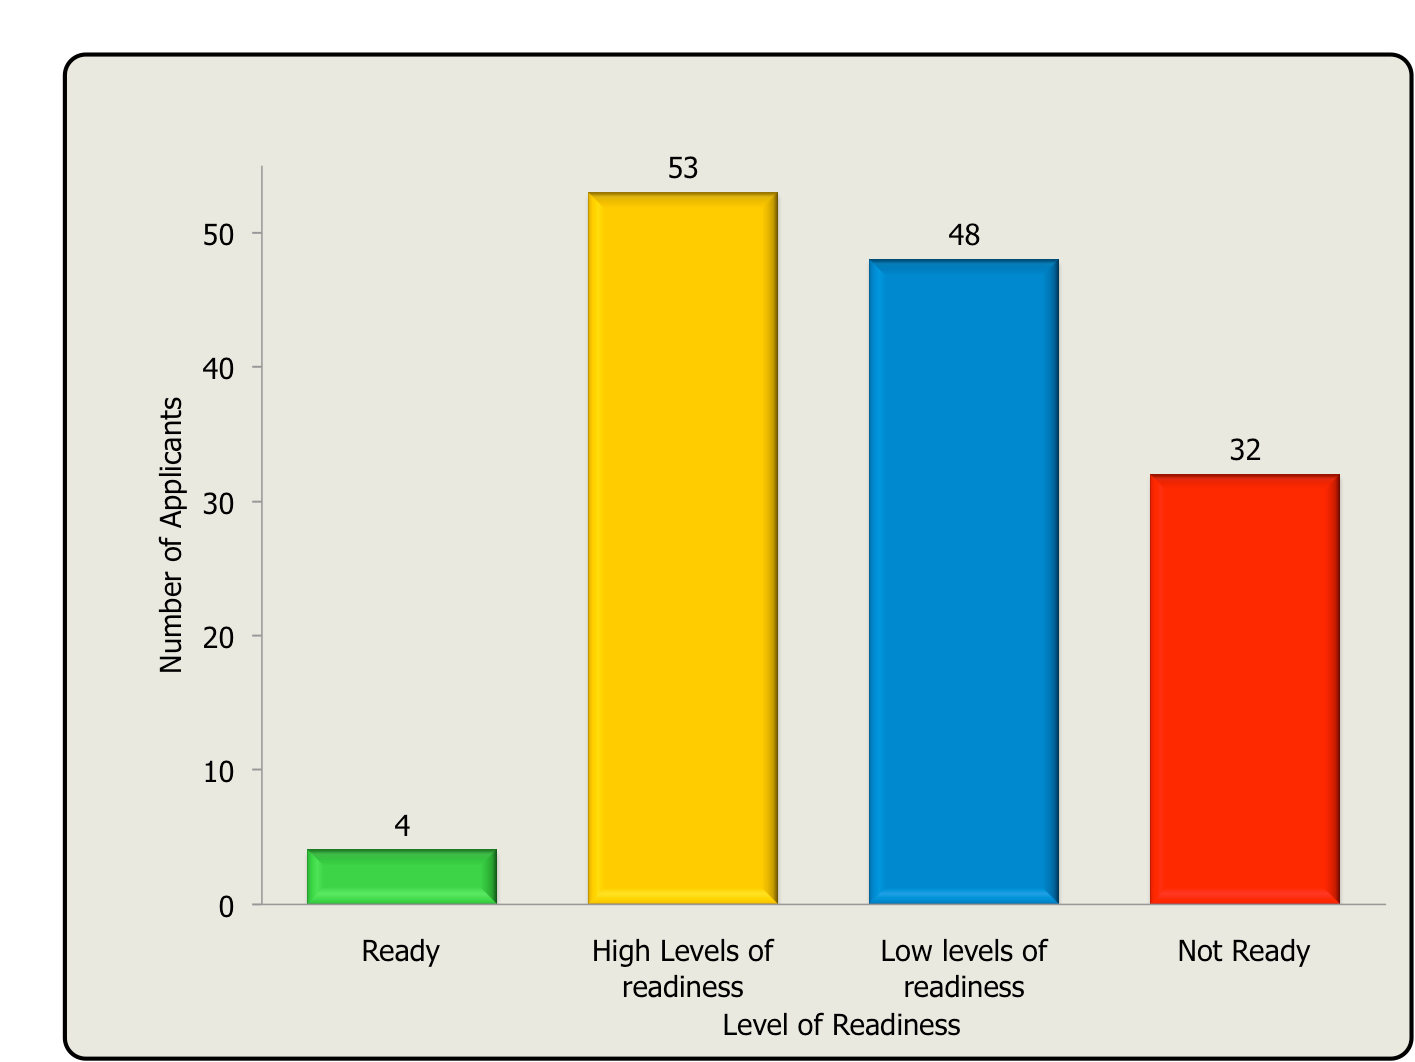
Figure 16: Overall Project Readiness Breakdown
Readiness is a multifaceted concept and we have understood this as comprising of the level of understanding of the challenge to be addressed, alongside the clarity of the idea for tackling the issue combined with the seniority of the team named within the application and how receptive the applicant is to support.
Another simple lens to consider whether the project reflects a genuinely new undertaking is whether the work being put forward is new, something that had been planned for sometime, or a historic work-stream that had been cut. It is important to note that being old or new should not be seen as proxy for bad or good respectively, but it does give an indication of the origins of the project.
Figure 17 on the following page illustrates that 29% of the projects are defined as ‘previous work-streams repackaged', 33% are 'predominantly old work', 25% are 'predominantly new work' and 13% are 'new work'. Which breaks down crudely as 62% old and 48% new. In order to measure 'project newness' we identified obvious signs of project origin, where an applicant clearly stated that the project was an extension or continuation of previous work. Nearly all applicants were explicit in defining the development of the project to date.
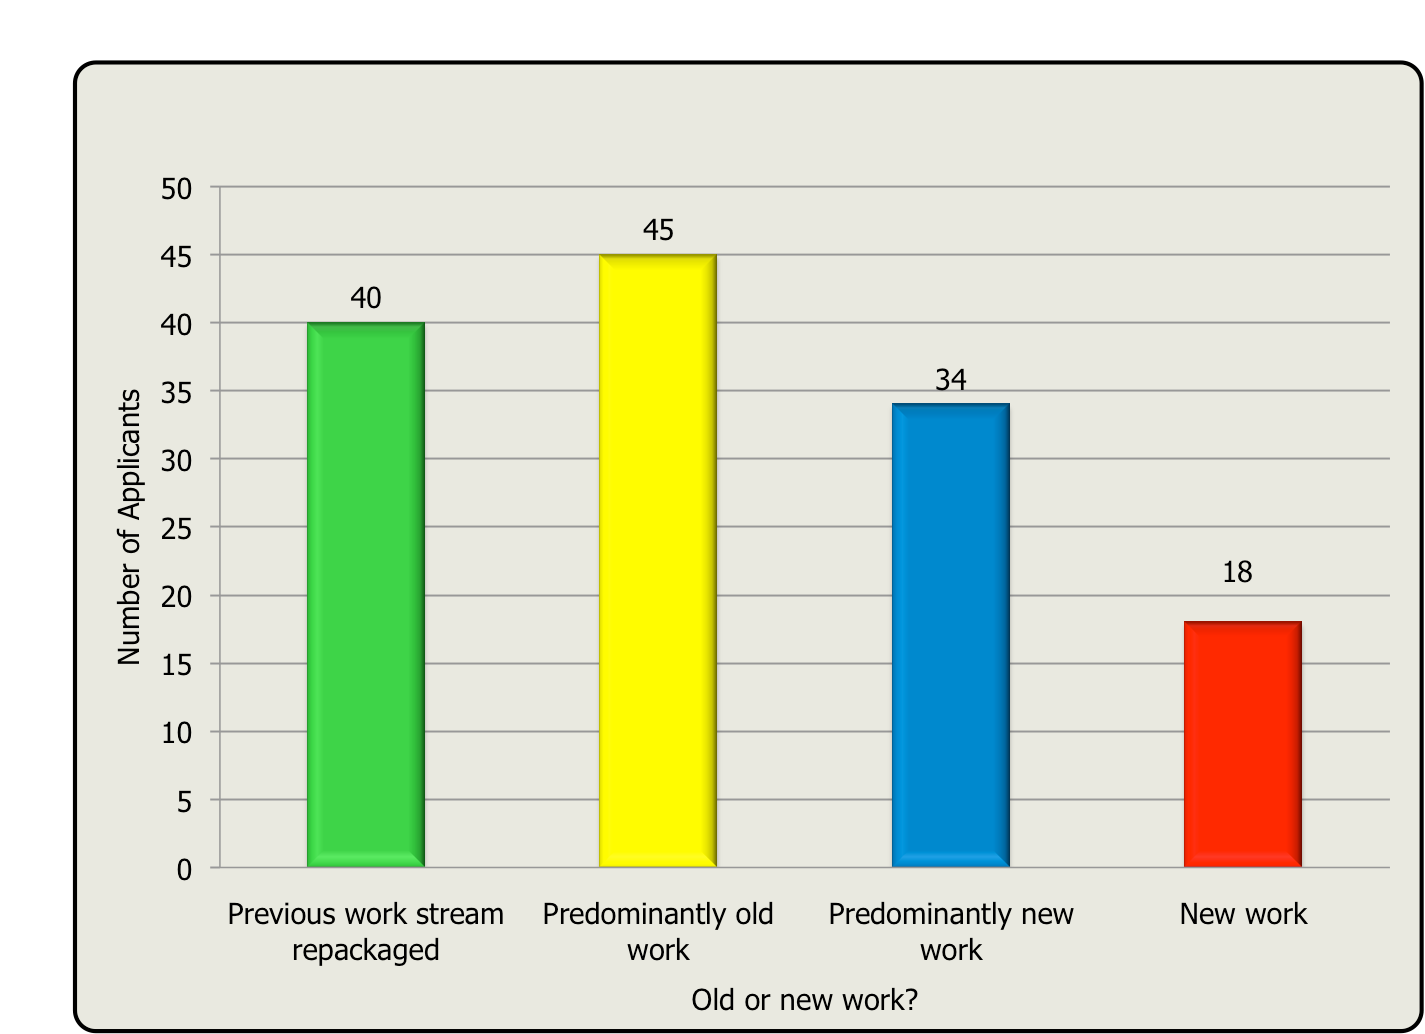
Figure 17: Old or New Proposals Submitted
Of course these figures are crude indications, coming just from application analysis and should be treated with care but nevertheless this gives a useful lens to understand how councils are responding to the innovation challenge.
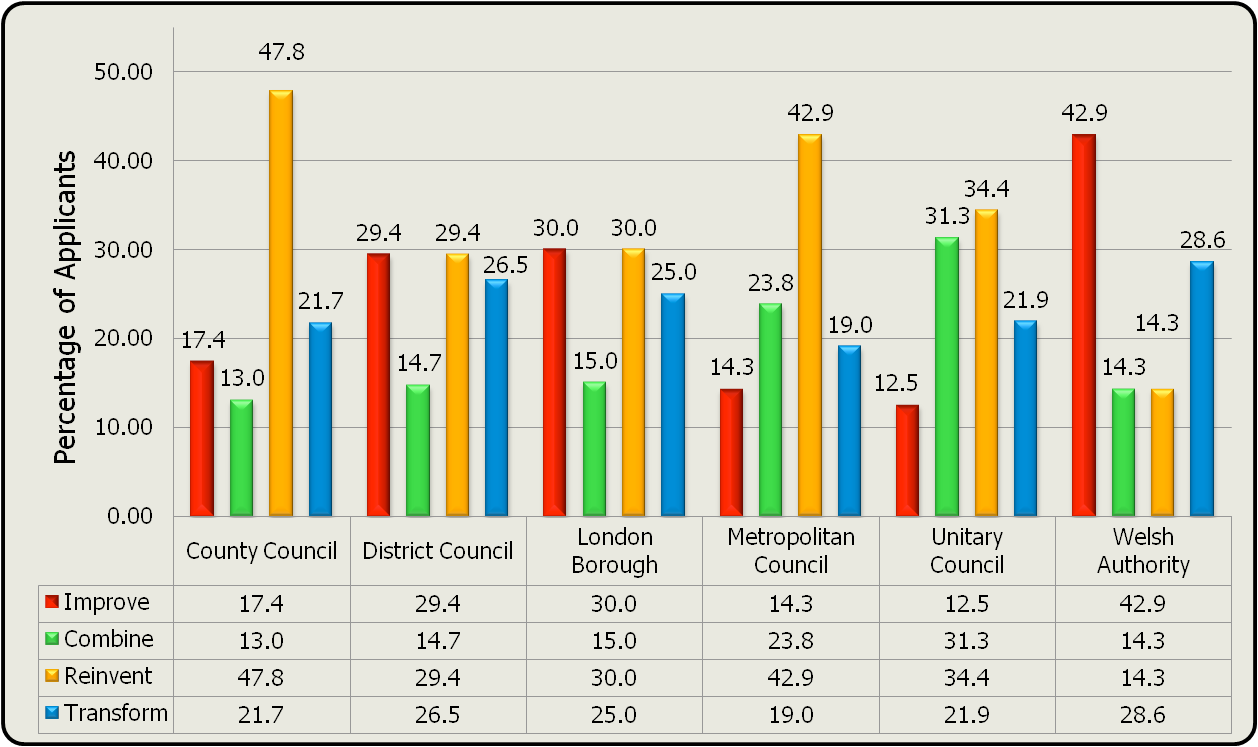
Figure 18: Disaggregated Authority Innovation Typology Shown as a Percentage
Figure 18 has been included to illustrate the spread of innovation type across the authority groups as a percentage. Perhaps most interestingly is that none of the authority groupings show a huge bias towards less or more innovative projects. There is a slight trend towards Counties having more innovative projects, but nothing definitive across all authorities.
3.5 Potential Impact
In this section we explore potential project impact. Clearly impact will be influenced by many of the factors considered throughout Section 3; here however we consider the critical factors of centrality of project to core business (Figure 19 A and B) and seniority of delivery team (Figure 20).
We are aware that there are different schools of organisational innovation thought; some suggesting that it is best to be discrete and not involve senior management until a project is demonstrating that it is delivering; and others who advocate getting the most senior people onboard as soon and as early as possible. We would suggest that actually what's most important is there being an accountable individual who is fully committed to the projects success.
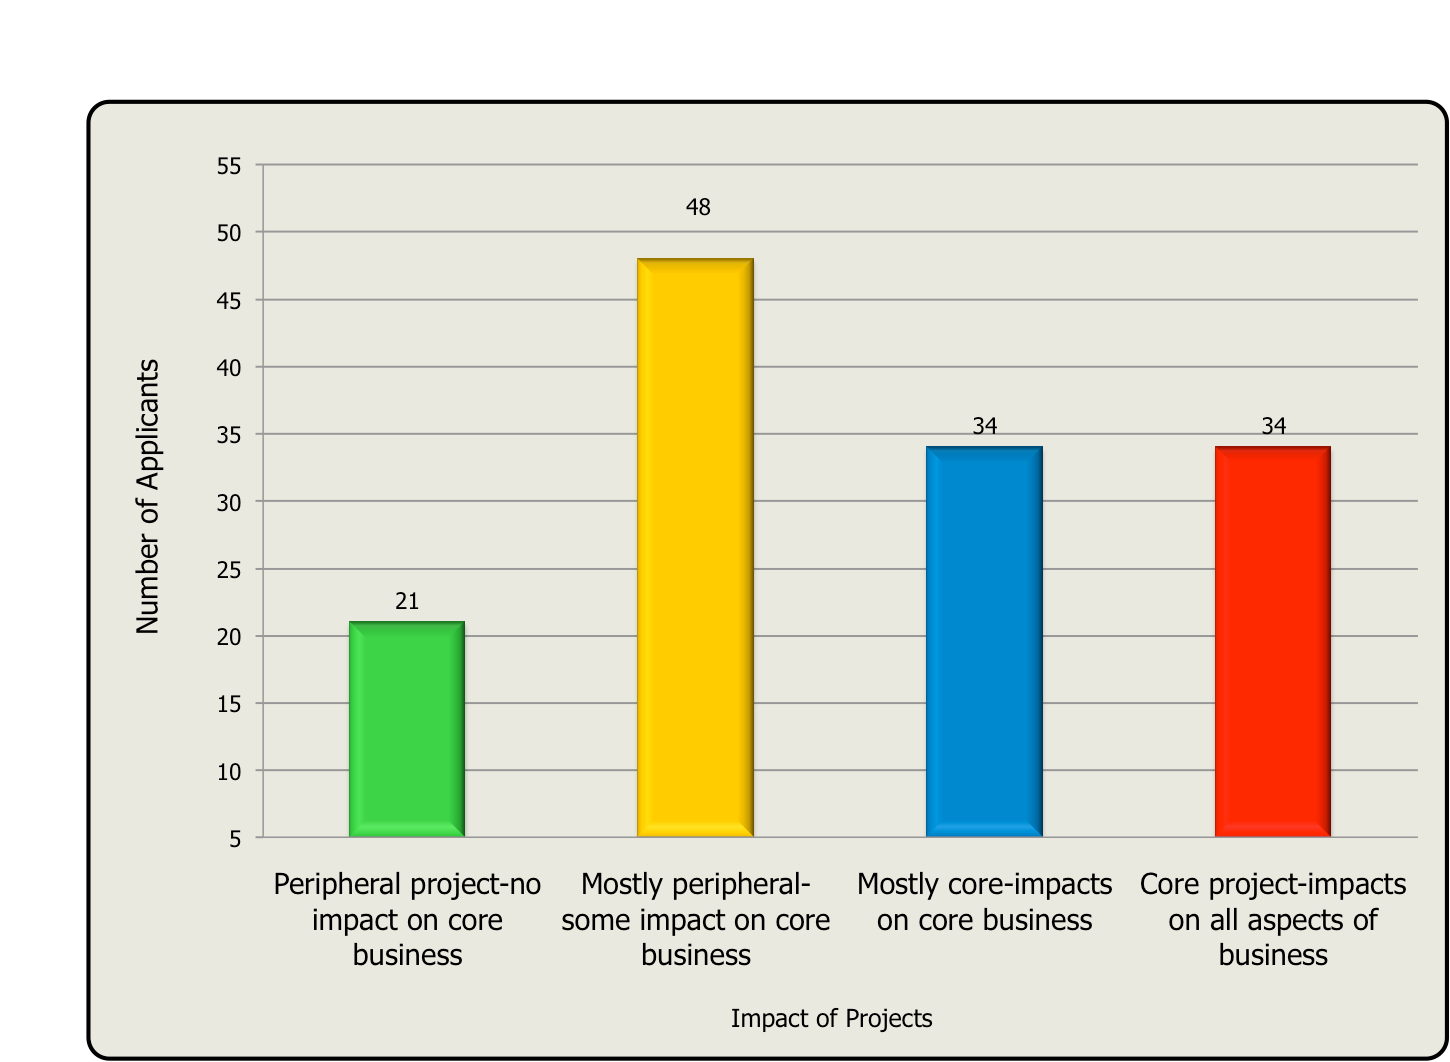
Figure 19 (A) illustrates that there is an even spread between those projects that are core (68 applicants) and peripheral (69 applicants).
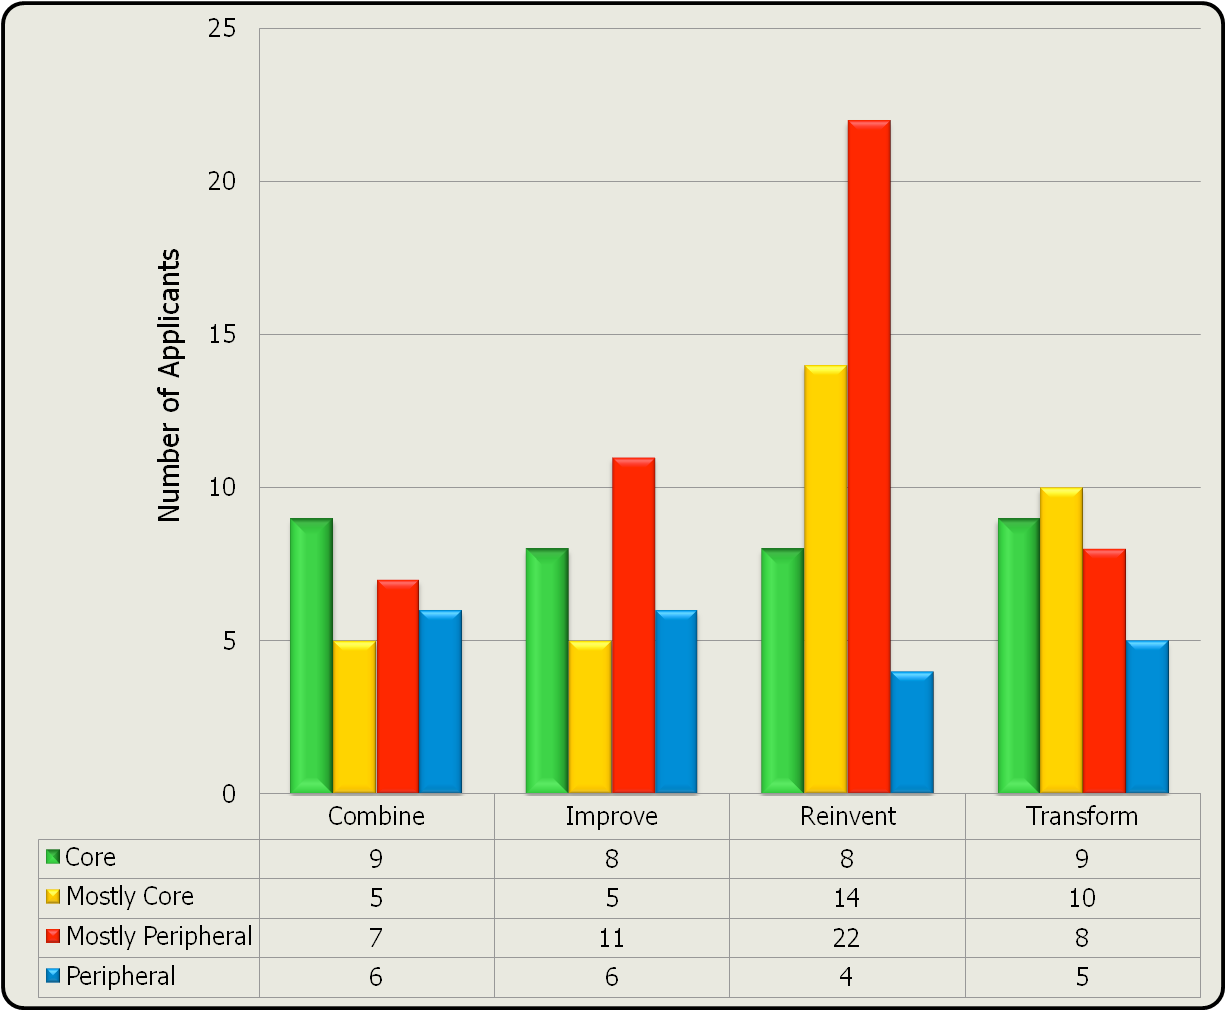
In Figure 19 (B) it is interesting to note that Reinvention projects show a clear tendency towards being peripheral work.
Figure 19A and B: Centrality to Core Business and Centrality to Business by Innovation Type
3.6 Partnerships
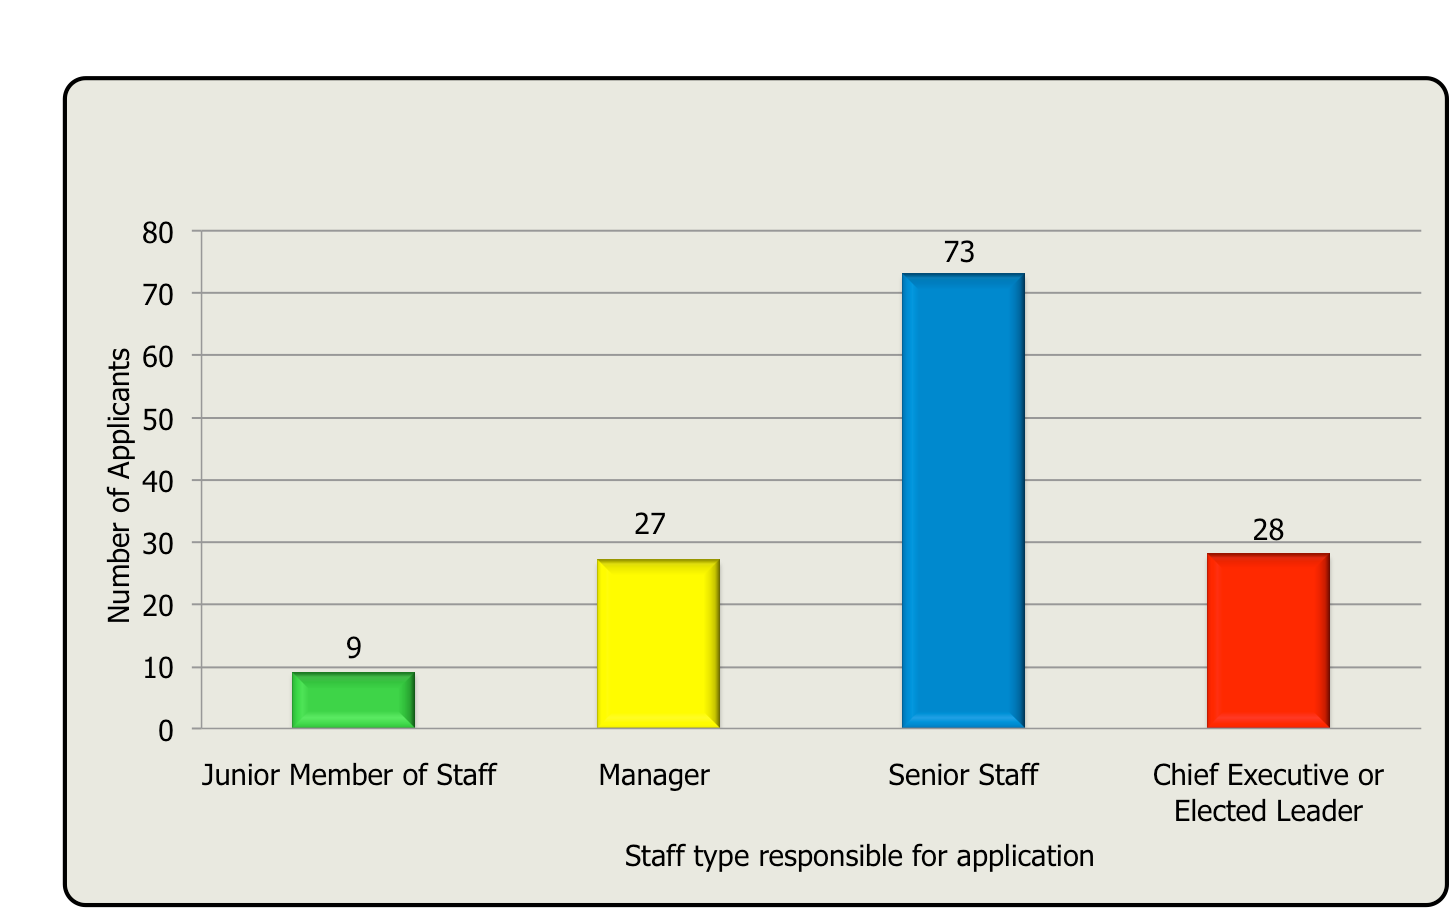
Figure 20: Seniority of Team Submitting Applications
Figure 20 in contrast, suggests a clear balance towards the project being led by a senior team member, with 74% of applications being led by either a senior staff member, CEO or Leader. It should be noted that whilst all applications were officially endorsed by senior staff, this indicator looks at what seniority of staff were named throughout applications.
This section explores the type of partnerships that are being proposed across the applicants and Figure 21 lists the number of partnerships being proposed by partner-sector type. It is worth noting here that a distinction has been made between a 'Public Sector Organisation' (the highest proportion of partnerships)and 'Local Government'.
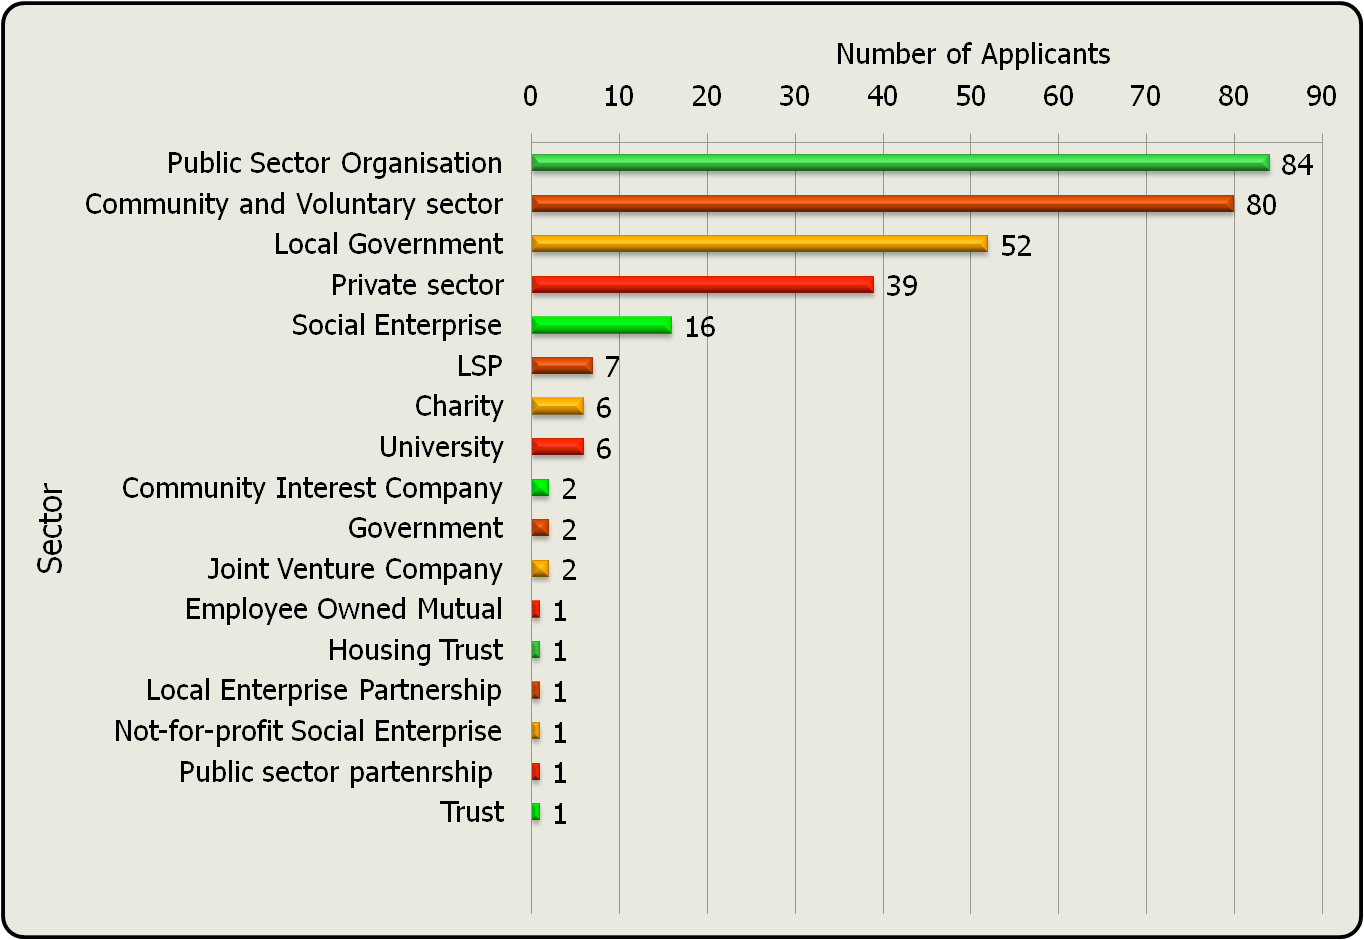
Figure 21: Amount of Partnership Types by Sector
This distinction reflects differences between partnerships named with the local Police Service and NHS (Public Sector) for example, and those partnerships named which are essentially internal, or with the Local Strategic Partnership, which have been classified here as 'Local Government' but could perhaps be thought of as local 'governance'.
3.7 Meeting The Innovation Challenge
In this section we explore a critical factor that is likely to underpin any councils ability to meet the innovation challenge: understanding of the challenge faced.
In order for an organisation to be able to overcome a challenge they often first need to be able to identify and plan for the challenge. Linked to this, innovation projects are often successful because they can be adapted to unforeseen circumstances. Organisations that are flexible, can adapt and learn and tend to be far more innovative.
In Figure 22 below we have crossed indicators measuring how well the problem to be addressed is understood with the applicants level of understanding of the challenge of innovation. We felt it was important to identify to what extent those applicants with a good understanding of the problem they faced also understood the challenge of achieving innovation both internally and externally. As the figure below shows, only 27% scored highly against both of these indicators.
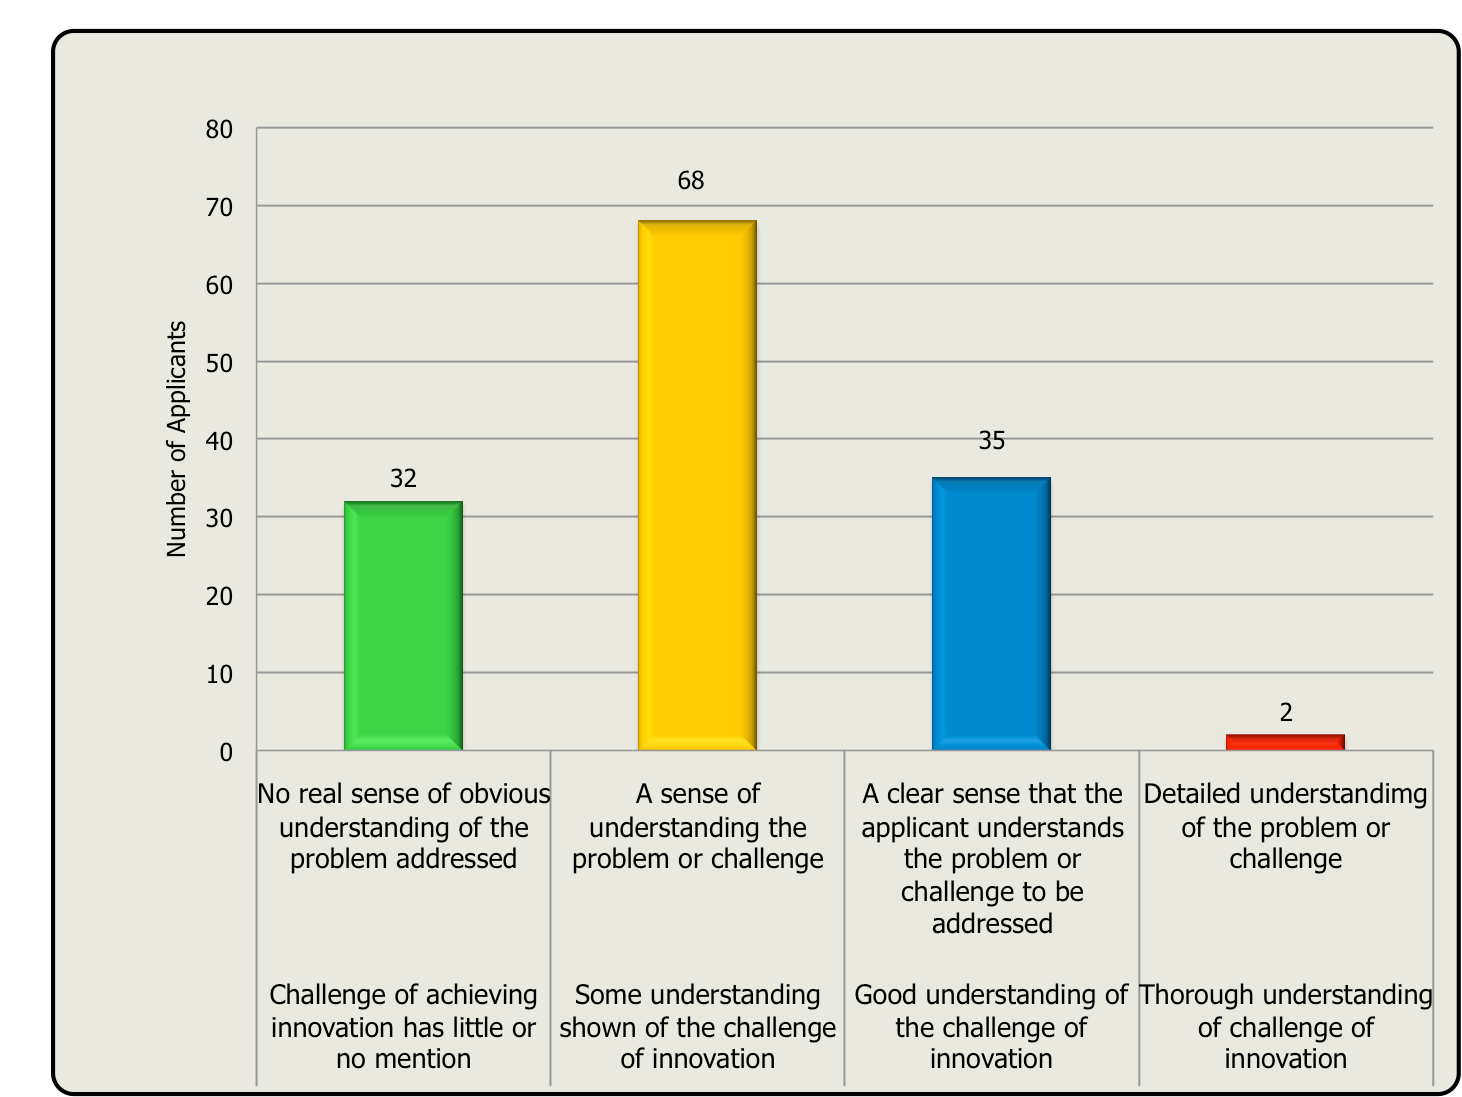
Figure 22: Understanding the Innovation Challenge
4. The Break (Implications)
The purpose of this section is to explore the possible consequences of the data discussed in the previous section. We start by making some observations about possible national trends in terms of local authority innovation, then look at how innovation is framed and explore the potential for transformation.
4.1 National Trends
In this section we seek to identify some of the possible national trends that appear to be emerging from the data.
4.1.1 Areas of Perceived Need for Innovation
Based upon the applications received we consider what the perceived needs in local authorities are for innovation.
Section 3.3 has identified three broad areas where the applications have focussed:
- Social care (44)
- Internal re-design (17): technocratic (6); in-house software business (3)
- Whole Community (53): Engagement/social media; community financial levers: Community Bank; Divestment of services; Stimulating Social Enterprise
The social care focus is probably the biggest discrete grouping with 44 applications, 12 of which focus on older peoples services. Within these 44 applications there is a general division between those seeking to improve internal coordination of services and those seeking to focus on the impact and potential of increased 'personal budgets'. Several of these applications have taken a social enterprise growth approach as devolved personal budget spending could stimulate demand for local services delivered by the community.
4.1.2 A National Co-Design Commitment
Around 30% of all applicants cite an intention to undertake some form of co-production, whether co-design or co-delivery. It is unquestionably, and unsurprisingly the dominant ‘new pubic sector management approach' to be referenced across the applications. At the same time however, there are signs that a majority of applicants, although interested in the idea, have less understanding of the terms mean in practice.
Within the applications, phrases like “co-design” and “co-delivery” are used interchangeably, with liberal references to concepts such as 'public participation' and 'Big Society'. However, there is rarely any reference to the challenges involved in achieving genuine public sector co-delivery, and an almost complete absence of a discerning attitude toward co-production practice. There is a sense then, that “co-design” and “co-production" should be adopted universally, symptomatic we would suggest, of an understanding of the approach but little or no practical experience.
4.1.3 Types of Innovation
As can be seen from Figure 15 (p.14) there is a fairly even distribution across each innovation type, with potentially transformative applications making up a quarter of applications.
However, although there is a widespread and genuine commitment to more radical innovation there is far less evidence that applicants really understand what is required to innovate, with 23% not being at all 'ready' to innovate across the board and only 42% showing evidence of genuinely having an awareness of the challenges faced or genuinely reflecting on how to meet the challenge. Thus we have a situation where people know they need to innovate, and want to innovate but are often less clear about how to actually achieve it.
4.2 Framing Innovation
In this section we explore the different ways in which applicants are framing their approach to innovation.
4.2.1 Models of Change
We have identified three models of change that many of the applicants are using to frame the basis of their projects.
Action Driven: around 24% of the applicants are driven by doing something significantly different.
Structure: 45% of the applications involve the creation of a new system or structure such as the creation of a social media engagement infrastructure, or an internal reorganisation. Most of these structural changes involve the creation of systems, often online, to support partnership or engagement activities.
Evidence: 65% of the applicants have a heavy focus on being supported by NESTA to gather evidence as the basis for future change. Many speak about their need for better understandings of the costs and benefits.
4.2.2 Confusing Outputs and Outcomes
A perennial challenge for any public sector management project is the conflation of outputs and outcomes. This is exacerbated when many of the projects are focussed on a new way of doing things, a process focus. Process is traditionally seen as an output and not an outcome; and yet for many of the applications here, we estimate 60%, the focus of the applications is to change processes, be it creating social value accounting systems, new organisational systems or new approaches to asset management or finance. These are all in essence new ways of working, and not directly outcomes in themselves. Of course, there is an implicit assumption in all applications that the new processes will lead to better outcomes, such as improvements in social care or energy efficiency, but in very few applications is the causal relationship between outputs and outcomes clearly elucidated.
Public officials are used to focussing on process, and this is clearly evidenced here. Again, there is a case for support to be provided from NESTA to help many of the applications develop their processes to ensure they are ‘hard-wired' into genuine positive outcomes.
4.2.3 Asking New Questions To Old Problems
One way of measuring an organisations' level of innovation is the degree to which they are reframing their approach to existing challenges. Going through all the applications there are some (a small proportion, perhaps 15%) applications which demonstrate a radical rethinking of how to address tough intractable issues. In particular we have noticed that there are some examples of challenge reframing in these four areas;
- New Financial Levers: Personal Budgets:
- Significant User/Public Empowerment:
- Divestment of Services:
- Internal Change
Despite the examples listed above however, a majority, 76%, show little or no evidence of re-framing challenges and are on the whole seeking funding for existing, sometimes ‘award winning' or 'proven' approaches and projects.
4.3 Potential for Transformation
In this section we identify some of the overarching drivers and barriers for genuine transformation.
4.3.1 Drivers of Transformation: Walking The Walk
Here we identify three drivers of transformation that we have identified through the projects.
Finances & efficiency: Unsurprisingly the local authority public sector cuts are overwhelmingly the key driver for the vast majority of the proposals submitted. Indeed, there are almost no applications that have been put together in isolation of this awareness. The 25 projects dealing with explicitly financial mechanisms is probably to some extent a product of this need to become more financially creative.
Explicit Recognition of Need to Change: There is a common narrative that, either driven by the cuts or a failure to deliver in more financially abundant times, councils will change; it's not a choice but an inevitability, and the winners will be those who most effectively embrace innovation. This awareness, as we touch on in Section 3.8 should be seen in relation to the limited skills and experience in delivering innovation and change; particularly that which is required to make the changes proposed.
Self Criticism: By self criticism we mean identifying their own problems and the need to change. We have included this as very often organisations who take ownership of their problems have a better track record of overcoming them. In this case, although not a majority, there is a healthy minority of around 25% of applications which either internalise the problem, accepting their need to change; or which identify explicit support they will need if they are to deliver genuine transformation; with 34% saying they have identified clear support requirements and 40% explicitly conscious of their need for support to achieve innovation.
Localism & Big Society: Around a third of applicants have made some reference to the 'big society' or localism, though to what extent these have been a key driver is hard to tell. The 68 'Whole Community' projects can though, be seen as an indicator of further bedding down of the long established trend towards 'hyperlocalism' and support for stronger communities, of which Big Society and localism are to an extent part.
5. The Shore (Programme Design)
This section explores how the Creative Councils programme may be informed by the results of this analysis.
5.1 Support Needs
In this section to provide we look at the generic stated and unstated support needs and also focus on how support may want to be tailored to those projects with a high innovation and impact potential.
5.1.1 Generic Support Needs
In this section we make a distinction between stated support needs and those unstated support needs we have observed through our interpretation of the applications collectively.
Stated Support Needs
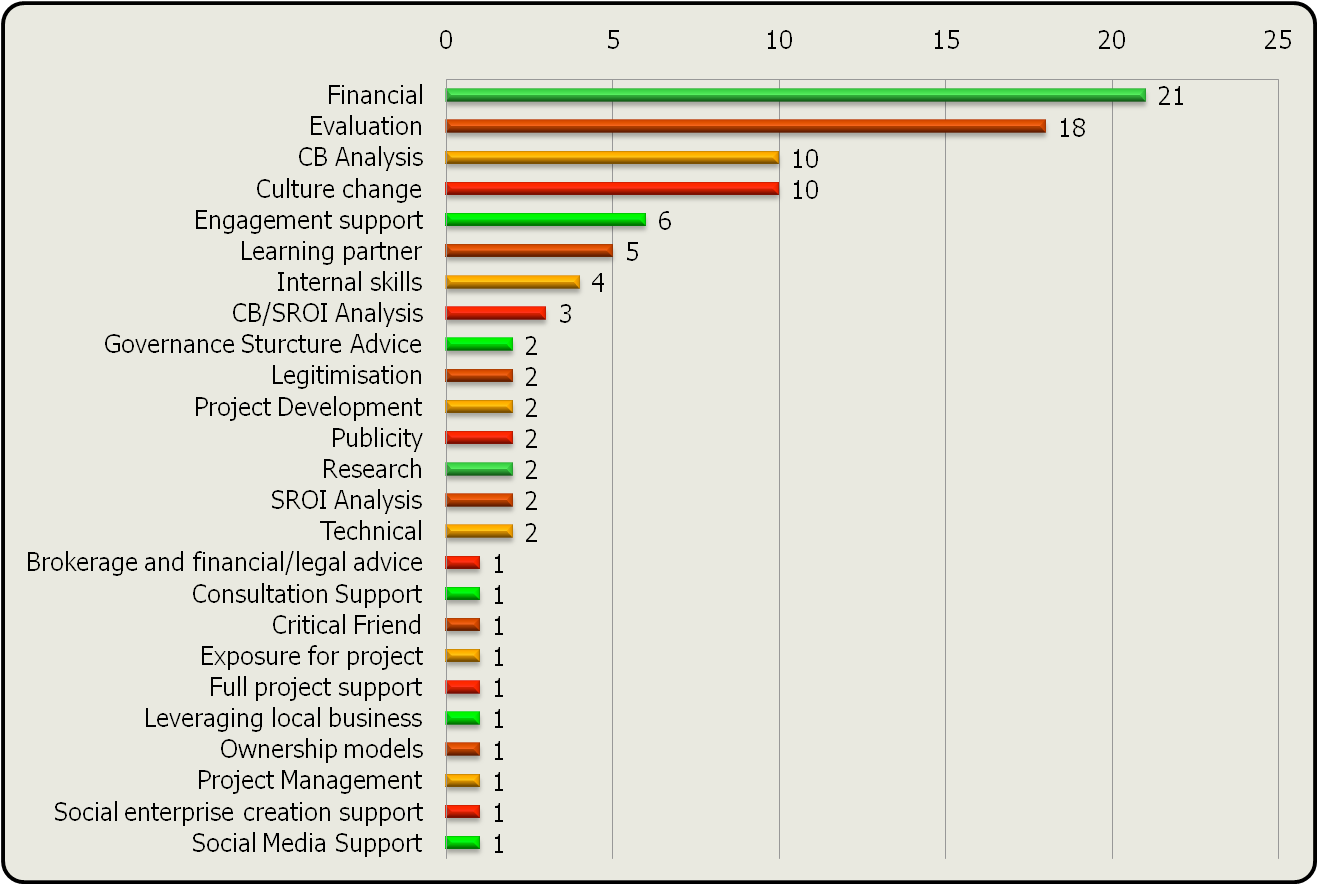
Figure 23: Applicants and Support Type
Based on Figure 23 above we have identified five dominant forms of support that is required across all applicants:
- Project evaluation: (SROI/CB/General Evaluation Support): 33 Projects (24%).
- Finance: 21 Projects (15%)
- Internal Development: 16 Projects- Culture Change (13.7%) & Internal Skills (3%) Governance Structure (2%)
- Engagement: 6 Projects (4.3%)
- Learning: 5 Projects (3.6%)
Implied Support Needs
Through our analysis of the applications we have identified the following seven unstated support needs:
- Better learning systems
- Outcome/output definition
- Innovation support
- Planning for transformation
- Grouping and clustering by theme
- Grouping and clustering by area
- Networking.
The seven unstated support needs are also standard practice in supporting organisations to become more innovative, in particular creating the circumstances for learning, flexibility and change that are often key components in organisations that innovate.
Many of these unstated support needs come back to our ‘Talking the Talk' but not ‘Walking the Walk' point, meaning that although the language and theory of innovation appears to be fairly well embedded in the sector there are signs that the sector still lacks widespread innovation experience.
5.1.2 Receptiveness to Support
Given that we have identified some fairly significant support needs, in order to understand how to configure that support we need to understand how receptive authorities would be to support.
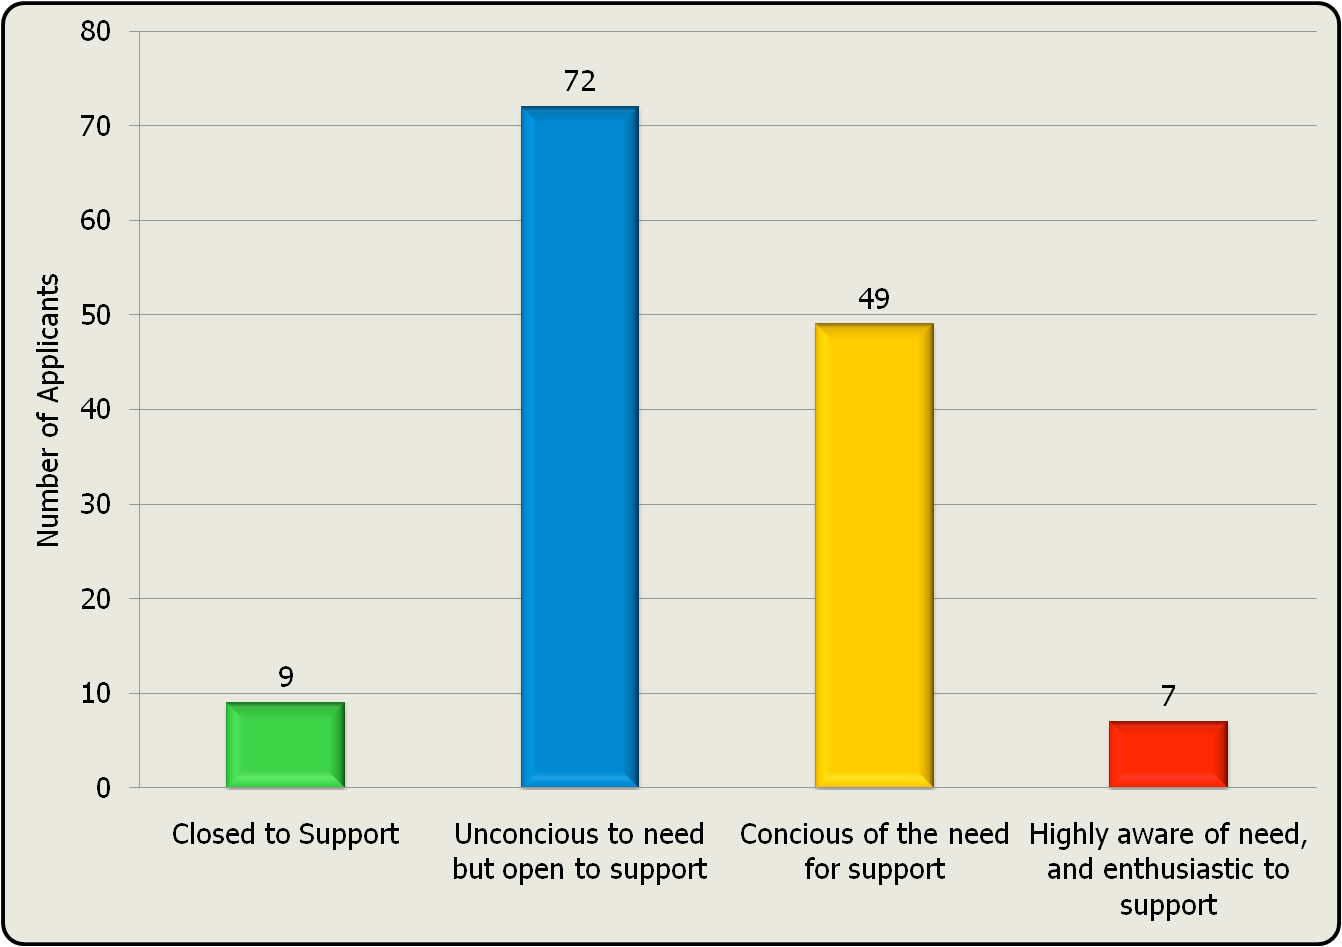
Figure 24:All Projects Receptiveness to Support
The good news from Figure 24 is that the vast majority, over 90%, are potentially open to support. The bad news is that almost 60% are ‘unconscious' of their need for support in terms of getting additional skills or experience. A majority know they need something new such as resources or finance but only a minority 40% have explicitly stated that there are new skills or capability needed (beyond finance and staff capacity). What Figure 24 points at is the degree to which applicants are aware that there are new things for them to learn from others externally to be able to deliver on innovation.
6. Conclusions
Catching the Wave describes a sector in flux and in many ways, the local authority sector is exhibiting classic characteristics of a sector under pressure and changing. More than anything else however, the authorities analysed here are perhaps best described as 'pliable' to becoming drivers of local innovation. What we mean by 'pliable' is that they are soft, ready to change form. Like clay before it has set.
From the majority of applicants, we are witnessing exceptional levels of interest in doing things differently; a genuine commitment to innovation with 74% having a senior staff member named as leading the project, and 20% having the CEO or leader as the named project leader. Perhaps most importantly of all, a healthy level of explicit openness to support, 40%, exists across all projects. 58% of councils are seeking to deliver highly innovative projects (reinvention and transformation), and 38% are seeking to support brand new projects.
Similarly, the scale of interest in the Creative Councils programme is heartening, and it suggests that there is a critical mass of interest, resources and momentum behind the drive to innovate. This augers well that this wave of interest can be translated into a permanent movement for change.
There are of course challenges and 58% of councils are either not ready or demonstrate low levels of readiness. The overarching message should however be that there is a surge of will to innovate sweeping our local government, and where there is a will there should be a way, and because there is high degree of commitment to genuine innovation, and openness to learn about innovation we should be able to find that way.
Key to supporting the transition of the will to innovate, into sustainable ways to innovate will be mainstreaming a culture of learning and reflection across local authorities.
This transition will not though, be straight-forward. Some authorities who publicly state a commitment to innovate are already faltering in the face of stiff opposition. Some local authorities do not have cultures that have evolved to embrace innovation and change, and many are in trauma following significant staff cuts and restructures. When facing a significant challenge all organisations have the choice to transcend the obstacles and seek new ways of working or descend and fall back on tried and tested techniques and established partners.

