We are Nesta.
The UK's innovation
agency for social good.
We design, test and scale solutions to society's biggest problems. Our three missions are to give every child a fair start, help people live healthy lives and create a sustainable future where the economy works for both people and the planet.
For over 20 years, we have worked to support, encourage and inspire innovation.
We work in three roles: as an innovation partner working with frontline organisations to design and test new solutions, as a venture builder supporting new and early stage businesses and as a system shaper creating the conditions for innovation. Harnessing the rigour of science and the creativity of design, we work relentlessly to change millions of lives for the better.
Find out more at nesta.org.uk
If you'd like this publication in an alternative format such as Braille or large print please contact us at: [email protected]
Author
Terpsi Panayotidis and John Barber
Click the Nesta logo on any page to return to the contents
Introduction
One of Nesta's missions is to increase the number of healthy life years lived in the UK while narrowing health inequalities. To achieve this, our mission goal is to halve the prevalence of obesity by 2030. While we know that the most effective way to cut obesity is by changing our food environment, it is important to understand the scale of the change required to see a meaningful reduction across the population.
National statistics have so far relied on the same BMI criteria to assess obesity in all ethnic groups, but this one-size-fits-all measure fails to account for the unique health risks faced by individuals from Black, Asian, and other minoritised ethnic groups living with excess weight. Failure to account for these differences exacerbates existing health inequalities in healthcare access, including structural inequalities such as socioeconomic deprivation.
The National Institute for Health and Care Excellence (NICE) revised its BMI guidelines in 2023, with updates in 2025, to recommend lower BMI thresholds for overweight and obesity for adults from Black, Asian, and some other minoritised ethnic backgrounds. When we apply these updated thresholds we demonstrate that national statistics are likely underestimating the prevalence of overweight and obesity in minoritised ethnic groups and the population as a whole, as well as the scale of existing health inequalities. Our analysis focuses on the adult population of England (aged 16+).
Analysis
Why adjust BMI thresholds based on ethnicity?
Body Mass Index (BMI) is widely used to assess health risks related to body weight and estimate obesity prevalence.
NICE guidelines recommended lowering the BMI thresholds for overweight and obesity for people from South Asian, Chinese, other Asian (Japanese, Korean and Thai), Middle Eastern (Arab and Iranian), Black African or African-Caribbean backgrounds, by about 2.5 kg/m², compared to those for people from white backgrounds (Table 1).
This is because, according to NICE's review, individuals from Black, Asian, and other minoritised ethnic backgrounds face a higher risk of chronic weight-related health conditions at equivalent BMI levels compared to individuals from white backgrounds. In addition to these risks, body composition – including variations in fat mass and muscle mass – varies across ethnic groups. Central adiposity, which refers to the accumulation of excess fat around the abdominal area, is particularly important as it is a critical contributor to an individual's risk of inflammation, cardiovascular diseases and all-cause mortality.
While BMI remains practical at a population level, it is widely acknowledged not to be a direct measure of central adiposity, which is important for assessing individual health risks. For this reason, NICE's updated guidance recommends incorporating waist-to-height ratio (WHtR) as a practical measure to account for individual variations in body composition.
| Weight category |
Black, Asian and other minoritised ethnic background* |
People from all other backgrounds |
| healthy weight |
18.5 to 22.9 kg/m² |
18.5 to 24.9 kg/m² |
| overweight |
23 to 27.4 kg/m² |
25 to 29.9 kg/m² |
| obese |
27.5 to 32.4 kg/m² |
30 to 34.9 kg/m² |
| obesity class 2² |
32.5 to 37.4 kg/m² |
35 to 39.9 kg/m² |
| obesity class 3¹ |
37.5 kg/m² or more |
40 kg/m² or more |
| (morbid obesity) |
|
|
*South Asian, Chinese, other Asian, Middle Eastern, Black African or African-Caribbean family background
How do the revised BMI thresholds affect overweight and obesity prevalence?
The methodology used in the latest 2022 Health Survey for England, published in 2024, estimates obesity prevalence using previous NICE guidelines, which did not differentiate BMI thresholds based on ethnicity. This risks underestimating obesity prevalence, including among minoritised ethnic groups and, consequently, the scale of health inequalities.
To assess the impact of updated BMI thresholds on overweight and obesity prevalence, we used the 2019 HSE data as it was deemed the most appropriate available dataset. The 2022 HSE dataset, used to assess overweight and obesity prevalence, has not been published yet (only the methodology and summary have). We decided not to use the most recent available HSE dataset from 2021. This is due to COVID-19-related limitations, including remote interviews replacing face-to-face visits, a higher reliance on self-reported data, and a significantly lower response rate compared to 2019. Population size corrections were applied to model these results for 2022².
Whilst 2019 is the most recent data available for BMI by ethnicity, we note that overall excess weight prevalence has not changed between 2019 and 2022 (so overall estimates are likely to be representative of 2022 data).
NICE's guidelines do not give specific guidance for individuals of mixed or other ethnic background groups due to the lack of direct evidence or under-representation of people from mixed ethnicity and some other minority ethnic backgrounds in research. We have therefore excluded these groups from our analysis and reporting below to prevent overestimating the impact on prevalence.
We used HSE's classification of ethnicity, which groups adults into White, Black, Asian, mixed and other (Arab and any other) ethnic background groups. Following NICE's evidence review, we included in the analysis adults from Black, Asian and Arab populations. Since HSE does not explicitly specify Middle Eastern or Arab as a category, we used census data to estimate the proportion of individuals within the 'other' category who identify as Arab and conducted the analysis for this subgroup[^3].
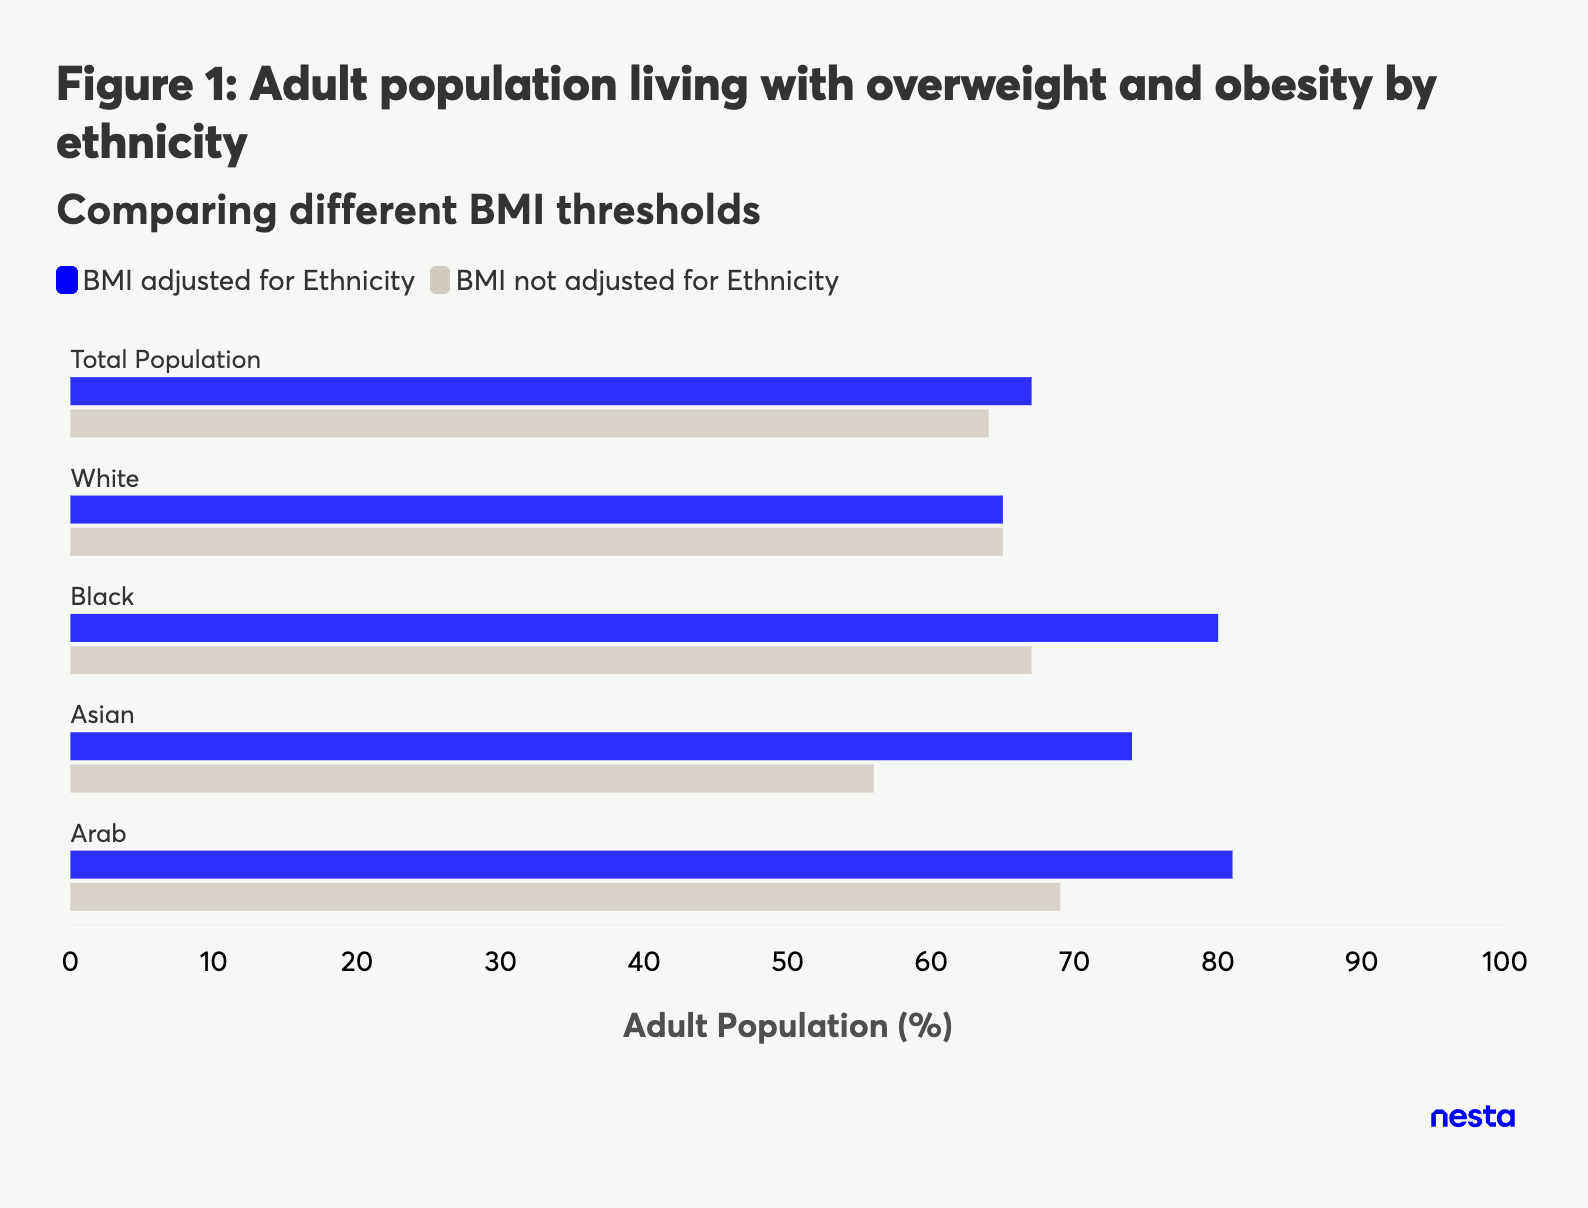
Reassessing obesity prevalence for adults with the updated NICE BMI thresholds reveals a notable shift. Using the differentiated BMI thresholds, there is an absolute increase in overweight and obesity prevalence across all minoritised ethnic groups, compared to when ethnicity is not adjusted for: 13 percentage points (pp) in Black ethnic groups, 18 pp in Asian ethnic groups, and 12 pp in Arab ethnic groups.
This represents a substantial 16% absolute increase in overweight and obesity prevalence within Black, Asian and other minoritised ethnic background groups. This translates to a 2.3% absolute increase in the prevalence of overweight and obesity in the total English adult population from 64.4% to 66.7%, impacting approximately 1 million additional adults. (see Appendix for estimations of changes in obesity-only prevalence).
As NICE highlights, people from some minoritised ethnic backgrounds are at greater risk of chronic health conditions, like cardiovascular disease or type 2 diabetes, at lower BMI thresholds than white individuals. However, research representing many groups remains minimal and non-existent. This gap reflects broader structural inequalities that shape health outcomes. There is strong evidence to suggest that systemic factors, including access to stable employment, poor housing and lived environment and financial insecurity, disproportionately affect people from minoritised ethnic groups. Racial disparities in these areas intersect with and contribute to obesity-related risk and limit access to effective interventions, while the lack of robust evidence makes it harder to develop inclusive patient-centred care.
Taking account of waist-to-height ratio (WHtR)
However, there is further nuance to consider with regard to ethnicity given the considerable variation in fat and muscle mass distribution both within and across different populations.
We sought to explore health risks assessed using WHtR compared to the old and updated BMI classification boundaries. We used a binary measure to compare how the different BMI thresholds classify people as living with overweight and obesity to how the WHtR classifies ‘increased' and 'high' central adiposity.
When comparing WHtR as a measure of health risk to BMI using old NICE thresholds, it becomes evident that the differences in health risk are much more pronounced for Black, Asian, and some other minoritised ethnic groups compared to white ethnic groups. This reflects the importance of complementary measures like WHtR in accounting for the known differences in body composition across ethnicities.
When comparing WHtR to BMI based on the updated thresholds it is encouraging to see that the estimated prevalence is a lot more aligned for individuals from Black, Asian, and some other minoritised ethnic backgrounds. This supports the idea that the lower BMI thresholds may better capture the true health risks faced by these populations.
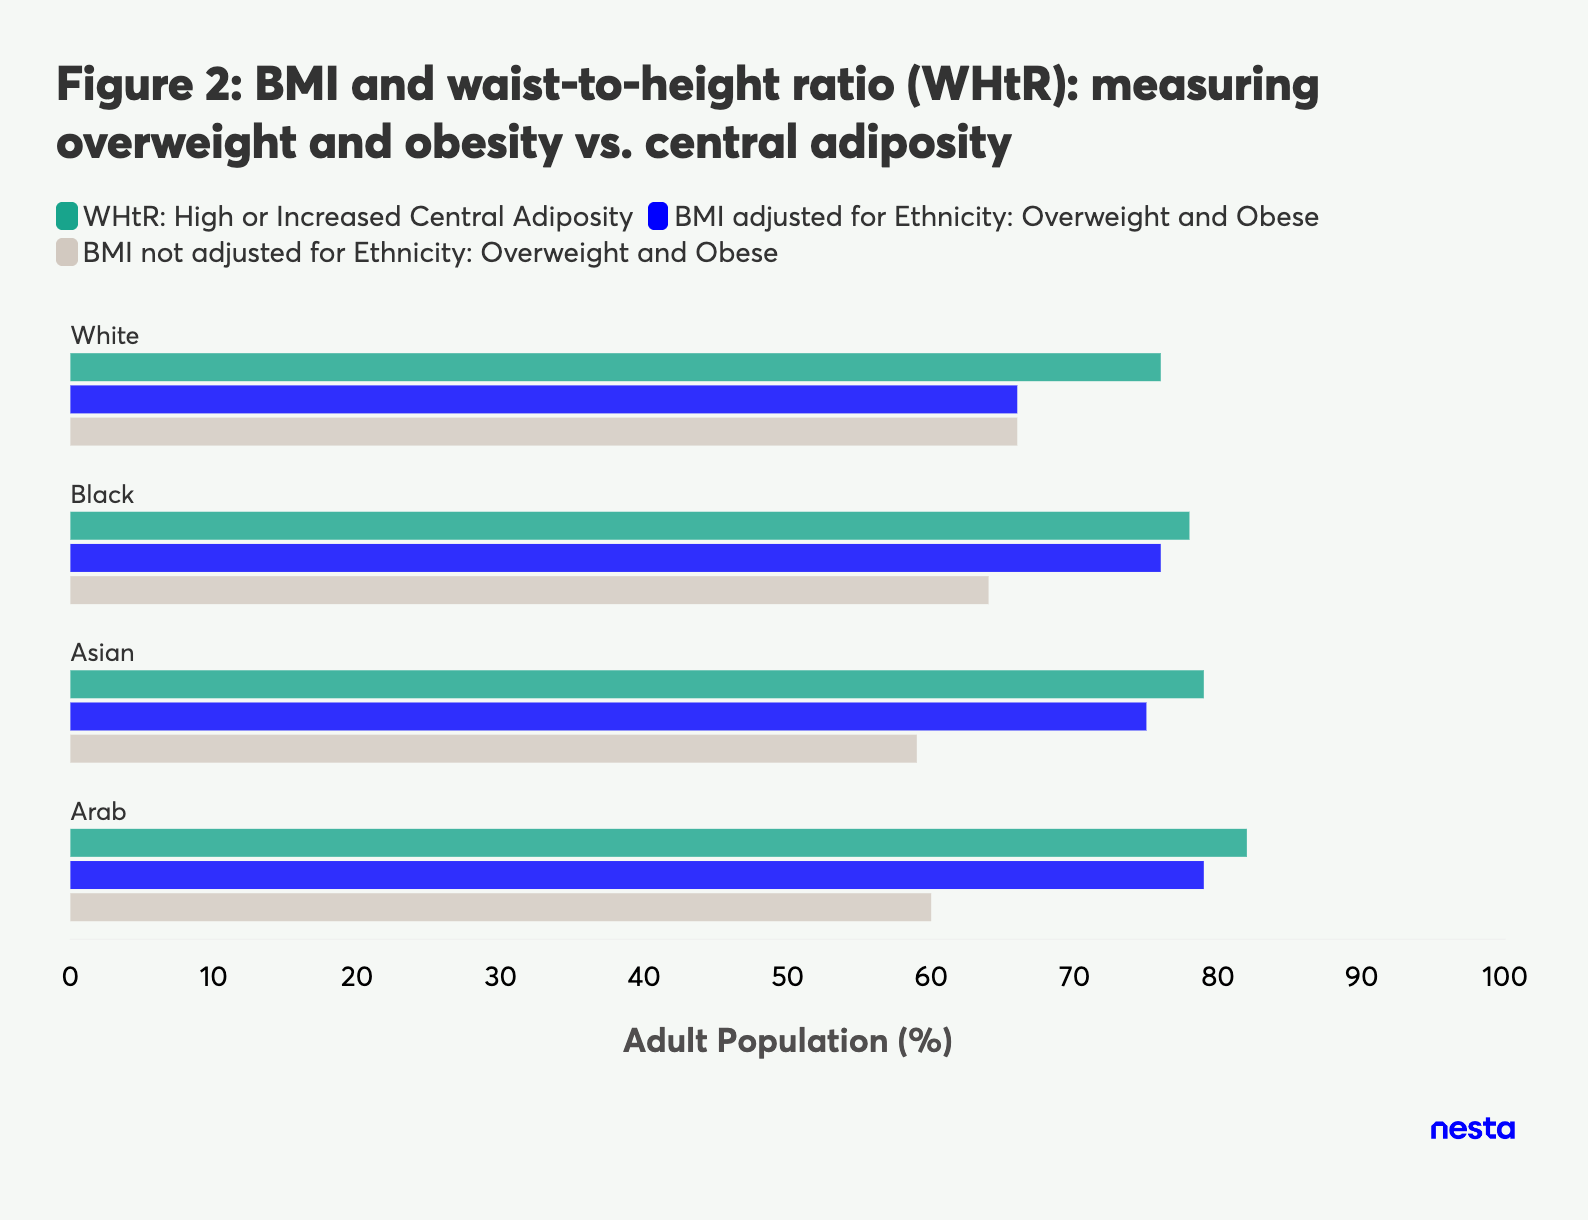
When comparing across ethnic groups, we note that there is variation in whether WHtR or adjusted BMI leads to higher estimates of excess weight or central adiposity which is likely to reflect different body compositions in these groups.
Using central adiposity to assess health risk increases the number of adults from Asian ethnic backgrounds who could be at risk by 4% and the number of adults from Black ethnic backgrounds at potential risk by 2%, compared to using updated BMI alone. This aligns with studies showing that individuals from Asian and Black ethnic backgrounds tend to experience greater levels of central adipose tissue for a given level of total body fat.
Moving towards more equitable obesity assessment
A growing debate has recently emerged, around redefining obesity, driven by the limitations of BMI as a tool for assessing health risks to individuals. While these limitations are valid, BMI remains a practical and widely accepted method for evaluating obesity at the population level, which is the focus of this analysis.
Obesity is a significant public health challenge across the UK. Our analysis using the revised BMI thresholds reveals that obesity prevalence in England may be even higher, and distributed more unequally among ethnic groups than previously estimated.
We observed an increase in overweight and obesity prevalence from 64% to 67% in the total population and from 60% to 76% in people from Black, Asian and other minoritised ethnic backgrounds. Obesity is already a major public health priority; this analysis should further reinforce that priority, especially given the impact on our understanding of health inequalities.
We recommend the adoption of the updated NICE thresholds in future NHS and government national statistics, including the Health Survey for England[^8], to ensure that national and local strategy and policy is based on the most accurate estimates of overweight and obesity and health inequalities.
Appendix
Re-estimating obesity-only prevalence using the updated BMI thresholds
Reassessing obesity prevalence for adults with the updated NICE BMI thresholds reveals an absolute increase in obesity prevalence of 21 percentage points (pp) in Black ethnic groups, 13 pp in Asian ethnic groups, and 23 pp in Arab ethnic groups.
This represents a stark 15 pp increase in obesity prevalence within Black, Asian and other minoritised ethnic background groups, increasing from 23% to 38%. This is a 2 pp increase in the prevalence of obesity in the total English adult population, from 28% to 30%.
Endnotes
- NICE's review did not find any evidence to support the lower thresholds for obesity class 2 and 3 thresholds for these ethnic population groups, but the committee noted that in practice, BMI obesity classes are often determined by lowering the general population thresholds by 2.5 kg/m² for individuals of minoritised ethnic backgrounds. This is endorsed by similar guidance by Public Health England and the British Obesity and Metabolic Surgery Society.
- To align with 2022 we adjusted our estimates by incorporating a 1% annual total population increase since 2019, consistent with ONS data. We have assumed estimates of population distribution by ethnicity using Census 2021.
- We have assumed that the obesity prevalence rates for Arab populations are similar to those of the Other ethnic background group.
- A total of 18.6% of the data was dropped sequentially due to missing values in BMI and ethnicity. Chi-square tests were conducted at each stage to ensure this removal did not significantly alter the distribution of ethnicity and BMI respectively. The results indicate no significant differences in the weighted – via “wt_int” as indicated in the HSE documentation – distributions before and after filtering (dropping missing ethnicity: x² = 0.15, p ≈ 1.0, df = 5; dropping missing BMI: x² = 0.44, p ≈ 1.0, df = 4).
- The BMI binary variable is coded as 1 for individuals living with overweight or obesity and 0 for those with a healthy weight. Similarly, the WHtR binary variable is coded as 1 for individuals experiencing 'high' or 'increased' central adiposity and 0 for those with 'healthy' central adiposity. 'Healthy' central adiposity is defined by a WHtR between 0.4 – 0.49, while a WHtR of 0.5 – 0.59 indicates ‘increased' central adiposity. A ratio above '0.6' signifies high central adiposity. For this analysis, individuals classified as 'underweight' based on BMI were excluded to avoid misinterpretation of the WHtR assessment. As a result, the reported prevalence of overweight and obesity may be slightly overestimated across all groups.
- Waist-to-height ratio data are only available for 51% of participants. Following HSE technical guidelines, we have used only the sub-sample of those with both WHtR and BMI values available and applied “wt_nurse" weights to the data to reach demographic representativeness. Similarly to our first round of filtering, we conducted a chi-square test (x² = 0.061, p ≈ 1.0, df = 4) to ensure that dropping participants with missing waist circumference data does not significantly change the weighted distribution of ethnicity.
- We note there are further nuances relating to the proportions of muscle mass across different ethnic groups.
- Noting this report is based on English data. The devolved nations should consider the implications of this report in their own contexts.
58 Victoria Embankment
London EC4Y 0DS
+44 (0)20 7438 2500
[email protected]
X @nesta_uk
f nesta.uk
www.nesta.org.uk
ISBN: 978-1-916699-34-2
Nesta is a registered charity in England and Wales with company number 7706036 and charity number 1144091. Registered as a charity in Scotland number SC042833.
Registered office: 58 Victoria Embankment, London EC4Y 0DS.