Our methodology
 www.nesta.org.uk/project/estimating-access-to-childcare-places-in-wales/our-methodology/
www.nesta.org.uk/project/estimating-access-to-childcare-places-in-wales/our-methodology/
www.nesta.org.uk/project/estimating-access-to-childcare-places-in-wales/our-methodology/
In England, Scotland and Wales, accessibility figures are often reported at a local authority level. However, a child living near the edge of one local authority might attend a setting in the next one over, simply because it's easier to get to. Local authorities can also cover large areas, and so just because a child lives in the same local authority as a provider, doesn’t necessarily mean that the provider is actually accessible to that child.
To get a more accurate estimate of current and future childcare accessibility in small geographical areas, we have used a technique called a Monte Carlo simulation. This technique uses repeated random sampling to estimate an outcome.
Here’s how we approached it:
Our aim is to work out which children can realistically access which childcare providers - not just which local authority they happen to share, but whether a provider is actually reachable from where a child lives. To do that, we first need to know the area each provider can realistically serve: its "catchment".
We estimated this using each provider's location. About 50% of childcare providers across England, Scotland and Wales have postcode data available, meaning we can pinpoint their exact latitude and longitude. Using these coordinates, we used the TravelTime API to estimate the reachable catchment area around each provider: a polygon (a shape made up of a series of connected points that trace the outer edge of the reachable area). Following reachability definitions used by Ofsted and Flying Start, we defined this as the area reachable within 25 minutes on public transport, 15 minutes walking, and 15 minutes driving.
The remaining providers - mostly childminders, who make up roughly half of all registered providers - don't have postcode data available, so we couldn’t calculate an exact catchment area for them in the same way. Instead, we used publicly available geographical boundaries containing that setting, such as a town or city, a smaller built-up area like a village, or a parliamentary constituency. Polygon data for towns and cities, built-up areas, and parliamentary constituencies, is available from the Office of National Statistics' Open Geography Portal. This introduces some uncertainty, since a childminder's true catchment is likely smaller than the administrative area we're using as a stand-in. We chose to include them anyway: omitting half of all registered providers would distort our picture of local childcare supply more than this uncertainty does.
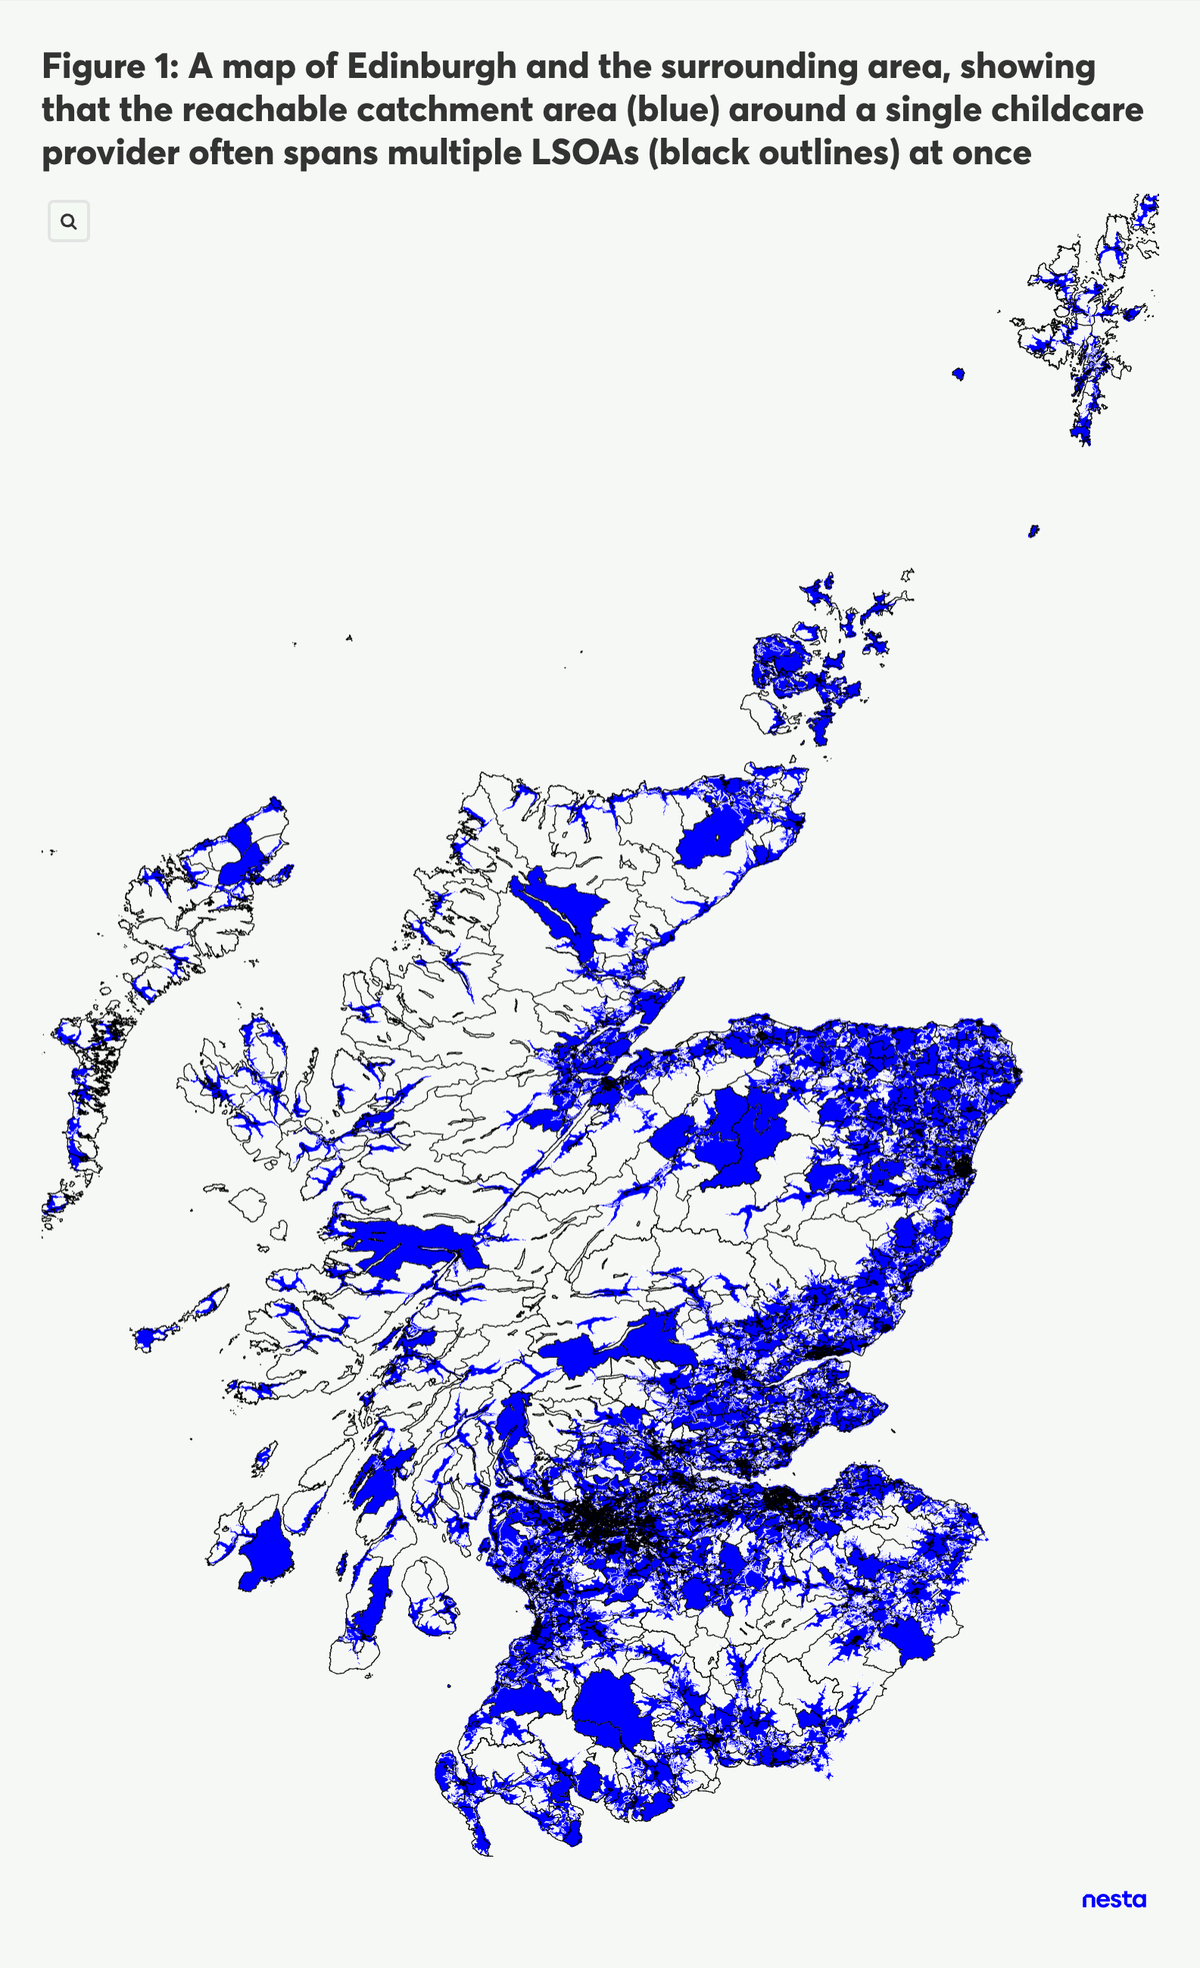
The map below of Edinburgh and the surrounding area shows what these reachable catchment areas look like. Blue areas show the boundaries around childcare providers that are reachable to children according to our definition, while black outlines represent lower layer super output areas (LSOAs) - small geographical boundaries containing around 1,500 residents, for which we have data on the number of children living there. Blue areas often cross over the black outlines: the same childcare provider is reachable to children living in several different LSOAs at once.
Step 1 gave us each provider’s catchment area: the area around it that families could get to within a set travel time. But to know how many children can actually get a place at each provider, we need to know how many children live inside that catchment area specifically - not just in the surrounding local authority.
This is where we hit a data gap: we know how many children live in each LSOA in total, but not exactly where they live. Without exact locations, we can't directly tell how many of a LSOA's children fall inside any particular provider's catchment area, especially since, as we saw in Figure 1, one LSOA can overlap with several providers' catchments at once.
To address this, we simulated a plausible location for where a child could live relative to each provider. If a childcare provider had postcode data, the locations coordinates were drawn from a Gaussian decay function centred on the setting, with the standard deviation set to half of the catchment’s radius - meaning locations closer to the setting were more likely to be chosen. For providers without postcode data, locations were drawn randomly within the catchment area instead.
Each simulated coordinate was then matched to the LSOA containing it, and the population of children in that LSOA was reduced by one. We repeated this process until either all the available places at that provider had been filled, or there were no more children left in the catchment area to place at a setting.
Through this process, the simulation kept track of:
Put together, this gives us an estimate of the proportion of children in each LSOA who have any place - or specifically a highly-rated place - available to them.
In Figure 2 below, we look at Powys, a local authority in Wales. Across its LSOAs, the colour scale shows the proportion of children with a ‘highly rated’ (defined as achieving "good" or "excellent" across all four Care Inspectorate Wales domains) childcare place available to them, with darker blue indicating greater availability. This allows us to estimate childcare availability at a more granular level than local-authority-level supply and demand figures allow.
Figure 2: A choropleth map of highly-rated childcare availability in Powys, Wales, showing stark contrasts between neighboring areas, such as Powys 021C at 0% and Powys 004B at 100%
This choropleth map illustrates the estimated availability of highly rated childcare places for one- to-four-year-olds in Powys, Wales. It uses varying shades of blue to represent percentage bands: 0-25%, 25-45%, 45-65%, and 65-100%. Callouts emphasise the stark contrast between two neighbouring lower layer super output areas (LSOAs). Powys 004B, shaded dark blue, offers 100% availability of highly-rated places, while Powys 021C, shaded light blue, has 0% availability.
Because this simulation involves randomness - children are assigned locations within the catchment area, then matched to a provider - running it again gives us a slightly different number of children assigned places. Repeating the simulation allows us to get a more stable estimate of the proportion of children with an available childcare place.
We used a Monte Carlo simulation. We looked at the running mean: as we added more simulation runs, we tracked how the average number of children allocated a place changed. A flattening line gave us increased confidence that the mean had converged, or stabilised, across runs.
Figure 3 shows what that looked like for our national estimates in Wales, for both the total number of children allocated a place and the number allocated a place specifically at a highly rated setting.
Figure 2: Line charts of the national running mean of total and highly-rated childcare allocations over 200 runs, showing early volatility stabilizing at approximately 61,176 and 33,191 respectively
These charts illustrate the stabilisation of national childcare allocations to show estimated reliability over time. They present running means plotted against 200 runs using solid lines, with dotted reference lines marking convergence points. Total allocations begin with high variance before settling at 61,176. Highly rated allocations initially fluctuate but quickly stabilise at 33,191 by the final run.
By around 150-200 runs, both lines had flattened, suggesting our national-level estimates have converged, and that running the simulation further wouldn't meaningfully change the result.
National convergence, though, doesn’t tell us whether every individual LSOA estimate has stabilised too. We also looked at the Monte Carlo error (MCE) - an indicator of how much the mean varies between runs - and divided it by the mean itself. This gave us a sense of how unstable each LSOA's estimate was relative to its own average, which let us identify the least stable LSOAs (Figure 4). As Figure 4 shows, these lines had also stabilised by 200 runs.
Figure 4: Multi-line charts of running means for total and highly-rated childcare allocations in five unstable LSOAs over 200 runs, demonstrating high early variance narrowing significantly by the final run
These charts track childcare allocations in five volatile local areas to highlight estimate convergence. Each area is represented by a distinct colored line plotted across 200 runs. While total allocation estimates initially fluctuate widely, they eventually narrow to a range between 0.83 and 1.66. Similarly, highly-rated allocations vary sharply at the start but stabilize by the final run, finishing within a closer band of 0.40 to 1.16.
For these LSOAs, the MCE is so high relative to the mean in these areas because almost no children were given a place there to begin with - usually somewhere between 0 and 3, depending on the run. This isn't a sign of a problem - it just reflects how small the numbers in these areas are.
Taken together, these running mean plots gave us confidence that 200 runs was enough to produce stable allocation estimates.
Even with a stable simulation, the underlying methodology has some inherent constraints, which fall into a few categories:
Publicly available data can be used to estimate availability of childcare at a more granular level than local-authority-level population and provider figures allow. In Powys, for example, this approach reveals meaningful differences between neighbouring LSOAs that a local-authority-wide figure would have masked entirely.
By starting from each provider's reachable catchment area, rather than from administrative boundaries, we can more accurately capture how families actually access childcare: crossing into neighbouring areas, and attending settings that are reachable from where they live. This approach takes us one step closer to identifying the specific communities where children are least likely to have a childcare place - and a high-quality childcare place - available to them.
Childcare provider data is available from Ofsted, Care Inspectorate Scotland, and Care Inspectorate Wales for England, Scotland, and Wales, respectively.
Population and demographic data came from the Office for National Statistics' Lower Layer Super Output Area population estimates.