About Nesta

Nesta is a research and innovation foundation. We apply our deep expertise in applied methods to design, test and scale solutions to some of the biggest challenges of our time, working across the innovation lifecycle.

Nesta in Scotland is working to achieve three ambitious missions. We have developed a series of data maps that visualise key metrics most relevant to our mission areas.

All data presented in these maps is drawn from publicly available sources (such as Public Health Scotland, the Scottish Health Survey, and the MCS Data Dashboard) organised by Local Authority area, and has been collated by the Nesta Scotland team to create accessible, visual tools.

A fairer start

We want every child to have an equal start in life. Our mission is to narrow the outcome gap between children growing up in most and least deprived communities in Scotland.
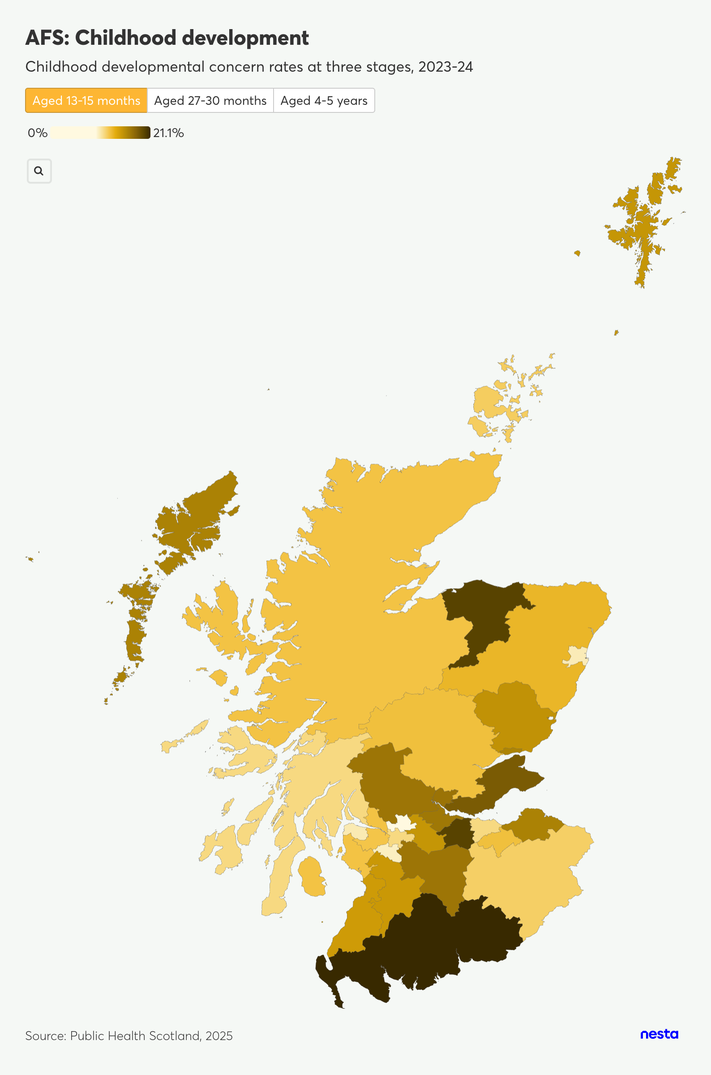
  • Early childhood development: this data tracks developmental concern rates observed by health visitors during the 13-15 month, 27-30 month, and 4-5 year reviews.
Read the text-based description of this image

Image Description

A choropleth map of Scotland titled 'AFS: Childhood development', displaying childhood developmental concern rates for the 2023-24 period. A colour gradient legend indicates concern rates ranging from 0% (light yellow) to 21.1% (dark brown). The map shows varying rates across Scottish local authorities, with the darkest brown areas – indicating the highest rates of developmental concern – located in the southernmost region of Scotland and a few specific areas in the east and central belt. The image credits Public Health Scotland.

A healthy life

We want good health for all, particularly those most affected by existing inequalities. Our mission is to increase the average number of healthy years lived in Scotland, while narrowing health inequalities.
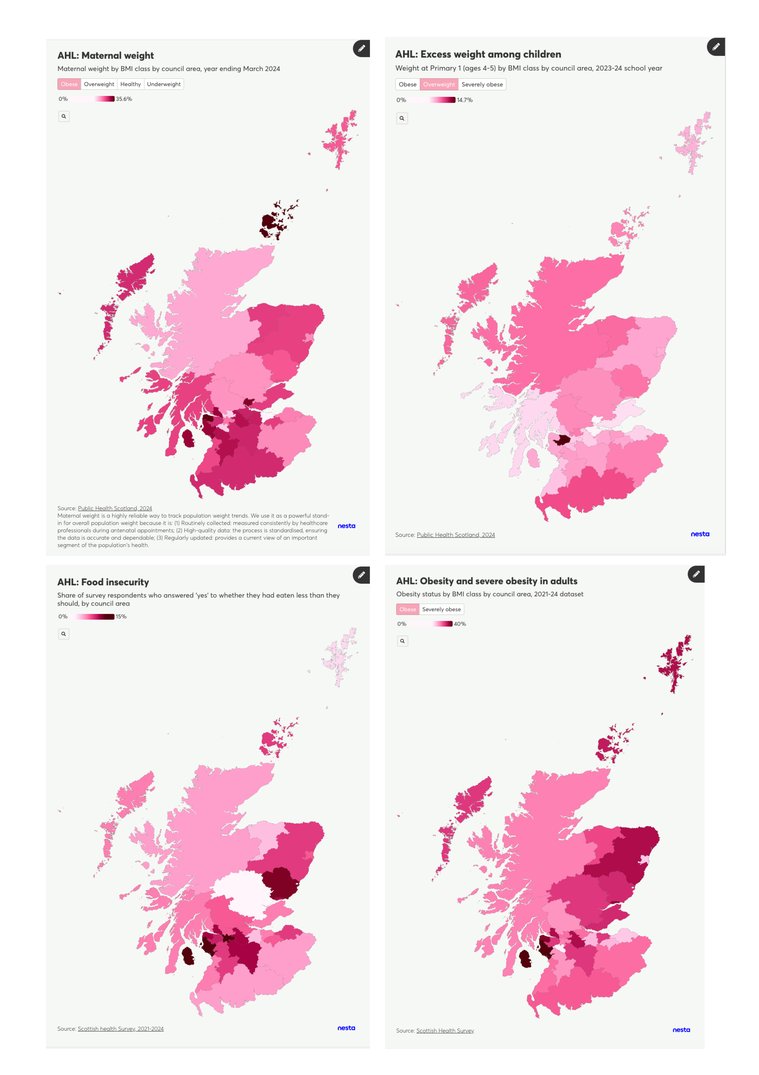
  • Maternal weight and starting school weight: both sets of data are powerful stand-ins for overall population weight because they are
    • Routinely collected: measured consistently
    • High-quality data: the process is standardised, ensuring the data is accurate and dependable.
    • Regularly updated: provides a current view of an important segment of the population's health.
  • Food insecurity: Illustrating the proportion of the population that has struggled to afford or access enough food.
  • BMI (Body Mass Index): General measures of weight across the population as self reported.
Read the text-based description of this image

Image Description

A combined graphic featuring four maps of Scotland displaying various health and food security statistics by council area using a light-pink to dark-burgundy color gradient, where darker colours indicate higher percentages.

  • Map 1: AHL - Maternal weight. Shows the share of maternal obesity (BMI class) for the year ending March 2024. The scale ranges from 0% to 35.6%. Higher rates are seen in island communities (Orkney, Shetland) and pockets of the central belt and southwest. The map includes a note explaining that maternal weight is a highly reliable way to track population weight trends. Source: Public Health Scotland, 2024.
  • Map 2: AHL - Excess weight among children. Shows the share of obesity at Primary 1 (ages 4-5) for the 2023-24 school year. The scale ranges from 0% to 14.7%. Obesity rates are generally lighter across most of the country, with one distinctly dark area in the central belt indicating a localized higher percentage. Source: Public Health Scotland, 2024.
  • Map 3: AHL - Food insecurity. Shows the share of survey respondents who answered 'yes' to whether they had eaten less than they should, ranging from 0% to 15%. The darkest areas, indicating the highest rates of food insecurity, are concentrated in the central belt, particularly around Glasgow, and in Dundee. Source: Scottish Health Survey, 2021-2024.
  • Map 4: AHL - Obesity and severe obesity in adults. Shows obesity status by BMI class from the 2021-24 dataset. The scale ranges from 0% to 40%. Higher rates (darker burgundy) are visible in the northeast, the central belt, and parts of the southwest and island communities. Source: Scottish Health Survey.

A sustainable future

We want a future that works better for people and the planet. Our mission is to accelerate the decarbonisation of household activities in Scotland and improve levels of productivity.

  • Households living in fuel poverty: visualising the number of households struggling to afford to heat their homes.
  • Number of households not connected to the gas network: mapping properties that rely on alternative and often more expensive heating solutions.
  • Number of heat pumps: tracking the adoption and installation of low-carbon heating systems each year, across different local authority areas.
Read the text-based description of this image

Image Description

A combined graphic featuring three maps of Scotland, side-by-side, each displaying different energy and heating statistics by council area using a light-blue to dark-teal color gradient, where darker colours indicate higher values.

  • Map 1: ASF: Fuel poverty. Shows the share of households living in fuel poverty between 2017 and 2019. The scale ranges from 10% (lightest) to 40% (darkest). The highest levels of fuel poverty are concentrated in the Highlands and island regions, while the central belt shows the lowest levels. Source: ScotPHO, 2026.
  • Map 2: ASF: Not on gas network. Displays the share of households not connected to the gas network in 2024, ranging from 0% to 100%. Similar to fuel poverty, the highest percentages (darkest areas) are in the Highlands and islands, while the central urban areas are mostly on the gas network (lightest areas). Source: DESNZ, 2025.
  • Map 3 (Right): ASF: Heatpump installations. Tracks MCS-certified heat pump installations from 2015 to 2025. The map includes a timeline slider currently set to the year 2015. The scale ranges from 0 to 1300 installations. Most of the map is a lighter blue shade, suggesting lower levels of installations overall.