Five lessons from building evidence-strength scoring into an AI policy tool
 www.nesta.org.uk/blog/five-lessons-from-building-evidence-strength-scoring-into-an-ai-policy-tool/
www.nesta.org.uk/blog/five-lessons-from-building-evidence-strength-scoring-into-an-ai-policy-tool/
www.nesta.org.uk/blog/five-lessons-from-building-evidence-strength-scoring-into-an-ai-policy-tool/

Policymakers are increasingly turning to AI tools to navigate large and diverse evidence bases more quickly, but these tools often lack the reliability, transparency and policy-specific tailoring needed to support effective policy design.
We built Policy Atlas in response to that gap. It aims to help policymakers quickly and reliably synthesise global evidence on what works. But knowing which interventions other governments or organisations are trialling only gets users part of the way. Policymakers also need to understand what kind of evidence sits behind a claim, how much weight to place on it, and how confident they should be in the assessment. Without that, AI tools risk producing fluent summaries that make weak, mixed or context-specific evidence appear more certain than it really is.
After testing a large language model-as-a-judge (LLM-as-a-judge) approach, we developed a more explicit framework for classifying, scoring and displaying evidence strength. This blog shares five lessons from that work about making AI-powered evidence synthesis more transparent, interpretable and useful for policy decisions.
The evidence retrieved by Policy Atlas does not all have the same methodological strength. A systematic review, a single observational study and a policy report may all be relevant to the same question, but should not be interpreted in the same way. They differ in how evidence is gathered, how transparent the methodology is, and how much they can be trusted in supporting a causal claim.
If these differences are not made explicit, LLM-generated synthesis can make different evidence types appear similarly authoritative. Evidence can be relevant without being strong, and this distinction needs to remain visible to users.
For Policy Atlas, this meant that evidence strength became a design problem, not just a technical one. Documents are first screened for relevance, and then separately classified by evidence category. This reflected what we were hearing from users, who wanted clearer differentiation by evidence type rather than all documents being treated alike, to have a better understanding of how reliable the output is.
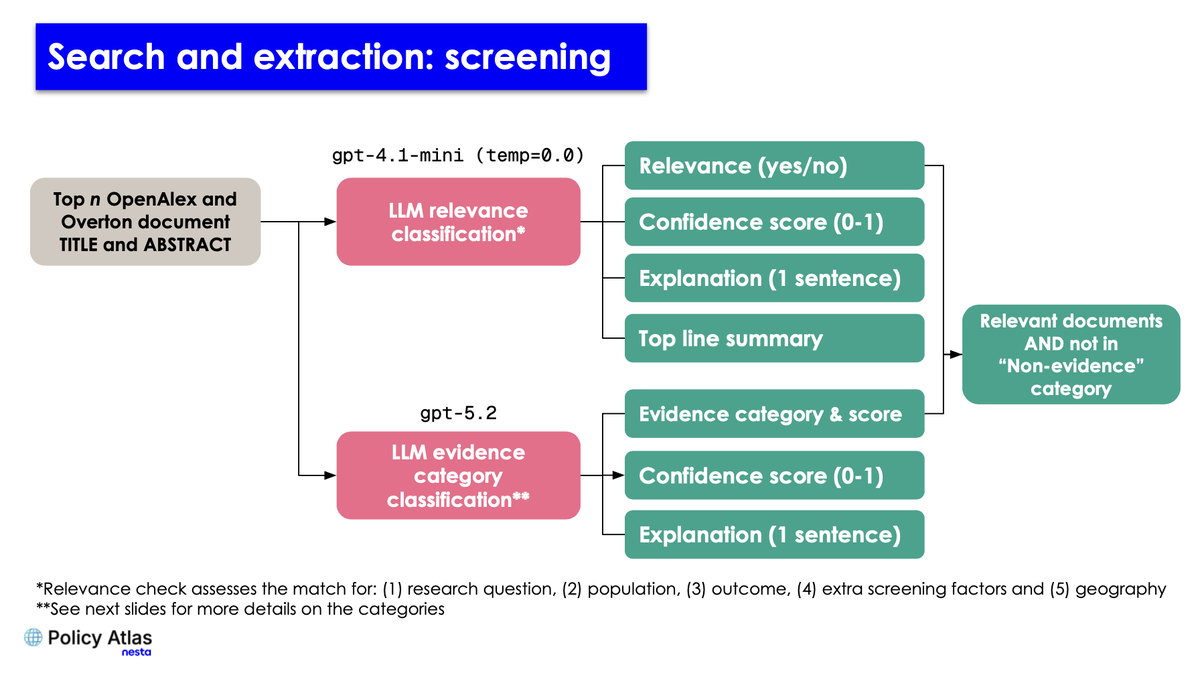
Documents are screened for relevance, and classified by their evidence category with LLMs. We extract justifications and confidence scores from the LLM to give us a more nuanced picture.
After trialling a simple LLM-as-a-judge approach that assigned a score out of five stars based on a rubric, we found it struggled with different document types and produced inconsistent ratings. Users also found the score difficult to interpret because it was not always clear how the tool had arrived at the rating. This was useful as an initial test, but it was not transparent enough on its own.
The problem was not just whether the LLM could assign a score. It was whether that score gave users enough information to understand and challenge the judgement behind it. A single rating was too compressed for the kind of evidence base Policy Atlas works with, where different document types have different methodological strengths and should not be interpreted in the same way.
This led us to a more explicit, stepwise framework. Rather than relying on one overall judgement, we needed to separate out the evidence type from the numerical score, so users could see what kind of evidence they were looking at and why it had been rated in a particular way.
Our framework assesses evidence strength by classifying documents into categories - with each category’s score reflecting the typical methodological strength of that evidence type. The framework draws on hierarchies of medical evidence and the Maryland Scientific Methods Scale. Because much of the grey literature includes policy documents, expert opinion and qualitative evidence - all of which are important for policymakers - we broadened our framework beyond these established hierarchies.
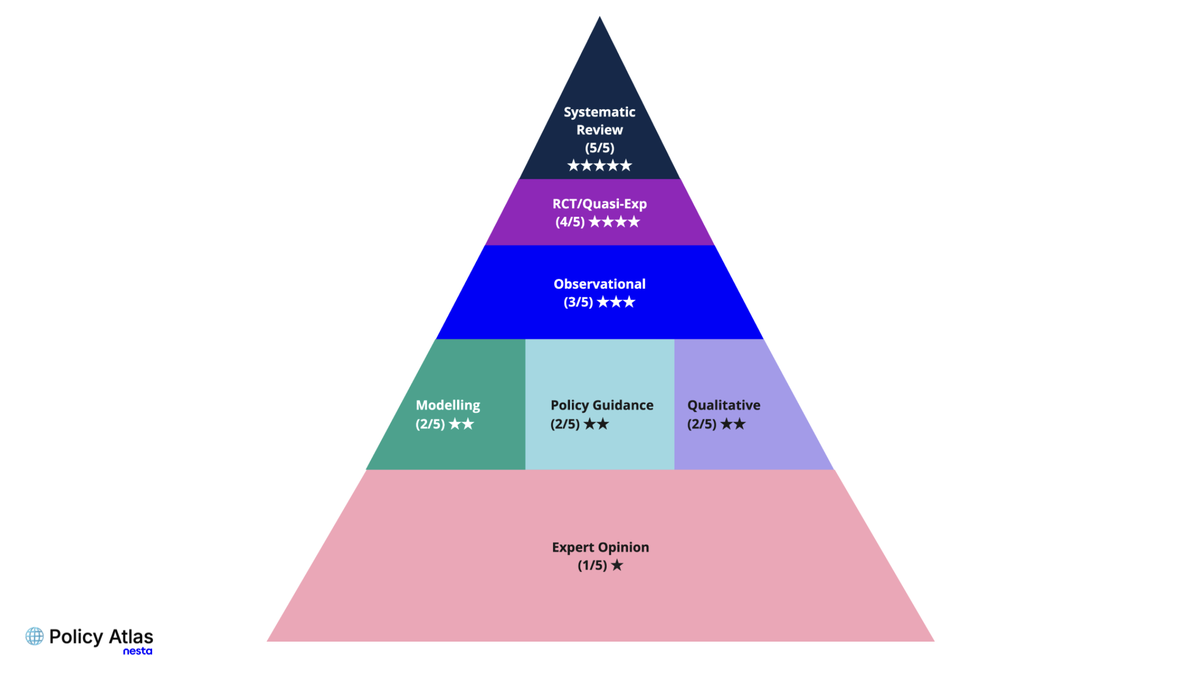
Our framework adapts established hierarchies (hierarchies of medical evidence and the Maryland Scientific Methods Scale (SMS)) to include grey literature, using evidence categories as an approximation of causal strength and methodological rigour.
The framework uses evidence categories as an approximation of causal strength and comprehensiveness, with systematic reviews and meta-analyses at the top, expert opinion at the bottom and other evidence types in between. We integrated this framework into the pipeline by classifying each document from its title and abstract into an evidence category and assigning a base score according to its place in our hierarchy.
We then applied a small number of simple rules, such as a penalty for small samples in causal studies. This moved us from an LLM-as-a-judge assessment to a pipeline that classifies documents and applies explicit scoring rules.
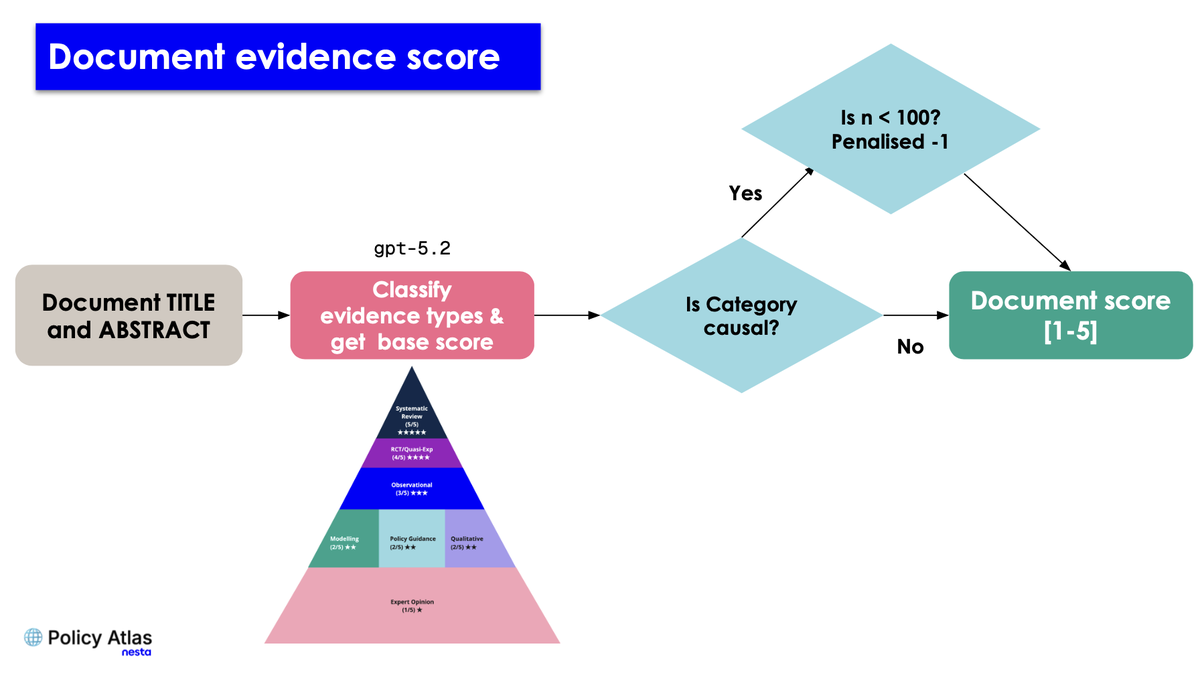
The pipeline assigns a base score based on the evidence category. For causal studies (systematic reviews, meta-analyses and RCT/quasi-experimental), it then applies simple rules such as a penalty for small sample sizes.
We also evaluated the categorisation across 90 human-labelled samples spanning Nesta’s three missions, and tested several prompt and model combinations. Ultimately, we decided to go with GPT-5.2 for the evidence categorisation, as it had the highest accuracy.
For others designing similar systems, one takeaway is that grounding LLM-based assessments in established frameworks can make outputs more consistent and less arbitrary. Using a well-known evidence hierarchy also gave users something familiar to anchor on, even if they were not familiar with the methodological differences between study types.
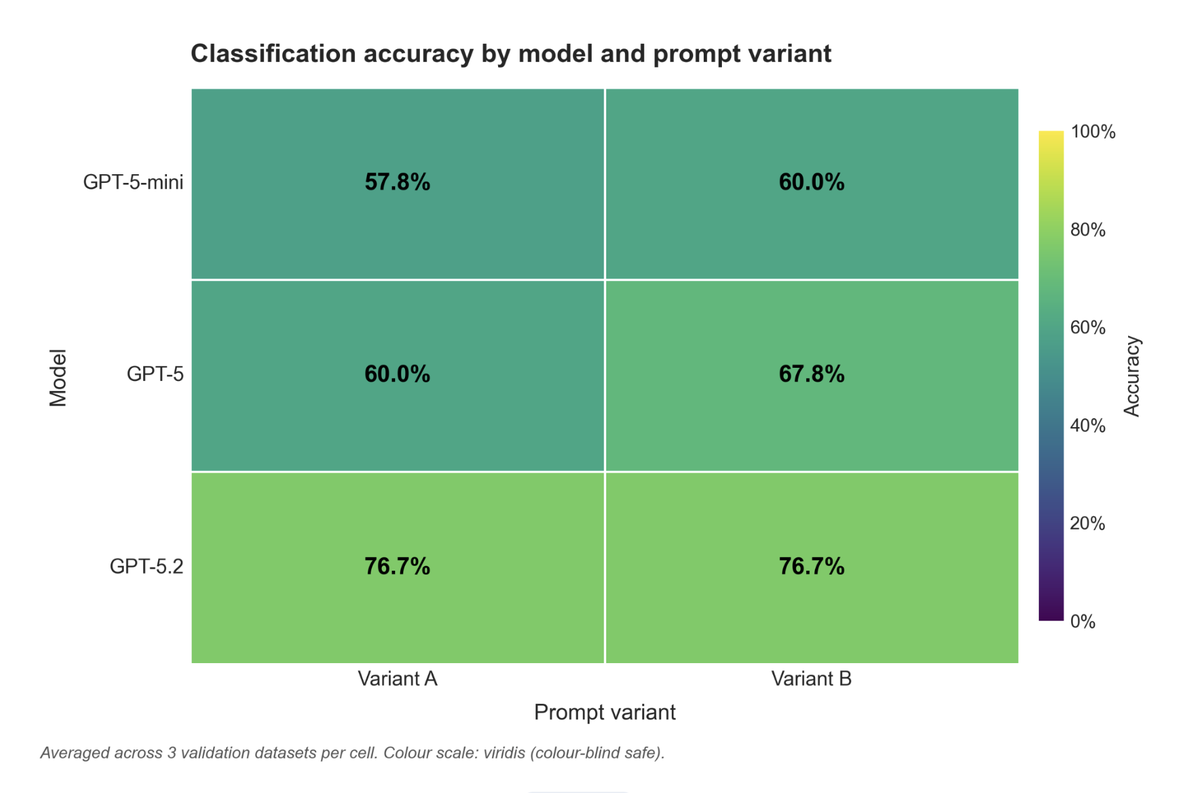
Evaluations across 90 human-labelled samples showed that GPT-5.2 achieved the highest accuracy for evidence categorisation.
Once documents are categorised, the pipeline extracts structured data from each one - policy issues, interventions, outcomes, effect sizes, and high-level conclusions - which underpins downstream features such as intervention theme clustering and executive summary generation. We found that the categorisation framework also mattered beyond evidence scoring because different document types also require different data extraction logic.
Our earlier extraction pipeline had been optimised for single studies, which caused issues with systematic reviews. In practice this meant we needed two extraction workflows, since systematic reviews report aggregate findings rather than study-level findings that include fields such as outcomes, effect sizes and sample size.
Beyond individual documents, Policy Atlas also groups documents into intervention themes, which are clusters of similar policy interventions identified across a search. We believe it is valuable for users to see an overall estimate of the strength of evidence for a particular theme. This means aggregating evidence scores across documents, showing where numerical scores prove more useful than category labels alone.
At the theme level, the pipeline takes the highest qualifying category score and then applies caps for factors such as small sample size, single-study evidence, or low density of evidence. This means the evidence category is not just a label attached to an individual document. It helps shape how evidence is extracted, grouped, scored and prioritised for further AI workflows, such as executive summary generation.
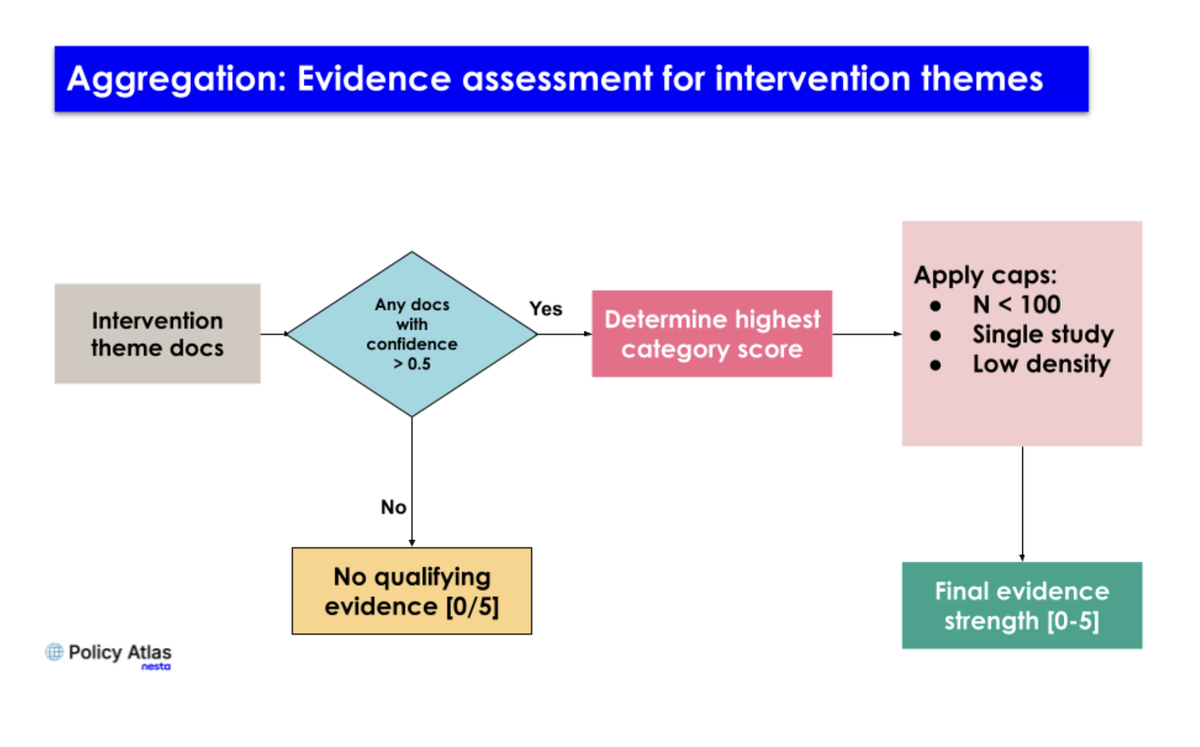
When grouping by intervention theme, the system takes the highest qualifying score and applies caps for factors like low evidence density or single-study evidence.
Rather than flattening this nuance, we made it more visible. We assign a confidence score to each categorisation and apply basic filtering, where the score has to be above a threshold for it to be used. We also prompt the LLM to explain why it has classified the title and abstract in a certain category and include this explanation within the Policy Atlas user interface.
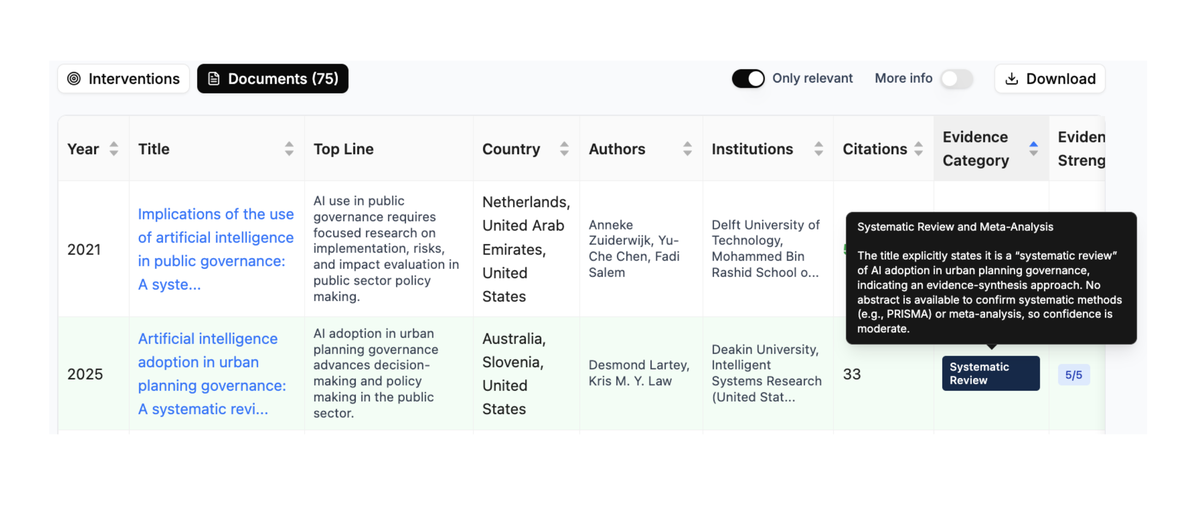
The Policy Atlas interface keeps all relevant evidence and displays explicit categorisations and explanations, allowing users to make their own judgements.
We accepted some loss of precision in order to keep the hierarchy usable. For example, we score systematic reviews and meta-analyses the same, even though meta-analyses should in principle rank higher. The same goes for RCTs versus quasi-experimental studies. We did this because an overly complicated pyramid risks losing the interpretability we get from the current approach.
We also recognise that this hierarchy reflects a particular evidence-based worldview. In some cases, lower-ranked evidence such as qualitative studies may be exactly what a user needs, particularly if they are trying to understand the implementation context, lived experience or how something works in practice. Rather than removing lower-ranked forms of evidence, we preserve them while showing how they were categorised, allowing users to apply their own judgement.
One open question is how far evidence hierarchies should be domain-specific. At the moment, our hierarchy is defined in the same way regardless of domain, but we could imagine that some policy themes have preferences for different evidence types. For example, adult social care policy may prioritise qualitative evidence because policymakers are often trying to understand not just if a service had an effect, but how it was experienced by the people using it.
The same policy domain considerations may apply to sample size penalties. In adult social care, a small observational study may not deserve a penalty if it is capturing people’s lived experience of a service. However, in education, a small sample size may deserve a stronger penalty because trial design is often heavily constrained by statistical power.
Overall, this part of the work reinforced an important point. Making evidence judgement more explicit does not remove nuance, but it does make it easier to handle in a structured way. For us, that was the value of the framework. It made the judgement clearer for users, but it also made the system easier to design, because the same evidence categorisation could be reused across scoring, extraction and synthesis, rather than being locked into a single model output.
To support policy decisions, Policy Atlas needs to do more than retrieve and summarise evidence. It needs to help users understand what kind of evidence they are looking at, how much weight to place on it and how much confidence to place in the assessment.
Policy Atlas, including this evidence strength framework, is open source and available on GitHub. We are keen to receive feedback on how the evidence strength assessment could be improved, and welcome contributions from policymakers, researchers and practitioners working on evidence synthesis, AI tools for policy, or policy design. Reach out to us at [email protected].

