Some households exhibit constant high gas usage throughout the day
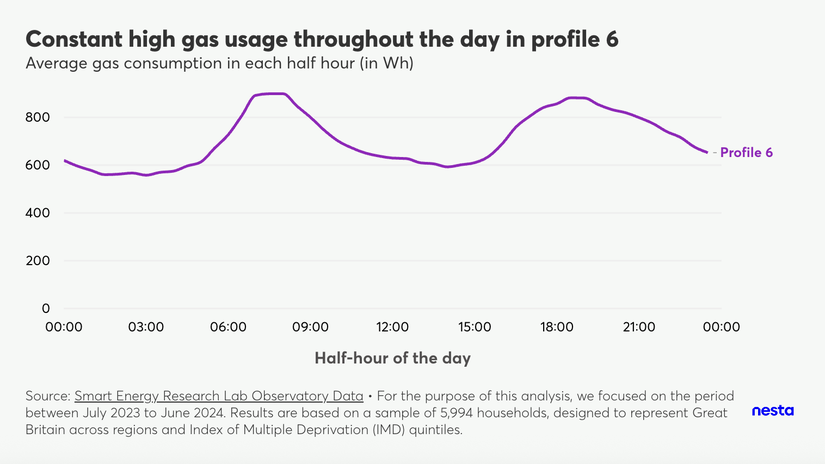
Constant high gas usage throughout the day in profile 6
Image Description
A line chart, titled "Constant high gas usage throughout the day in profile 6", shows the average daily gas consumption curve for profile 6, with the x-axis showing time of day and the y-axis showing gas consumption in Wh. Unlike other profiles, profile 6 shows a constant high gas usage throughout the day.
The footnote highlights the data source, Smart Energy Research Lab Observatory data and that "For the purpose of this analysis, we focused on the period between July 2023 and June 2024. Results are based on a sample of 5,994 households, designed to represent Great Britain across regions and Index of Multiple Deprivation (IMD) quintiles."
As observed across various profiles, average gas consumption generally peaks in the morning and evening. However, profile 6 exhibits this trend less prominently, with households maintaining consistently high gas consumption throughout the day.
Several factors likely contribute to this, including the following.
- Presence of non-working adults: 40% of households in profile 6 consist solely of non-working adults, suggesting a greater likelihood of occupants being home throughout the day.
- Presence of gas central heating: the presence of gas central heating, potentially used consistently throughout the day, also contributes to sustained consumption.
This behaviour is particularly noteworthy given that nearly 50% of homes in this profile are located in deprived areas (although not necessarily meaning that households themselves are deprived). However, we can observe that other profiles with comparable or higher proportions of non-working adults and/or individuals over 65, as well as similar gas heating characteristics, do not display the same consistently high consumption as presented by profile 6.