Households are not evenly distributed across profiles, reflecting that different proportions of the population have different energy consumption behaviours
Distribution of households
Image Description
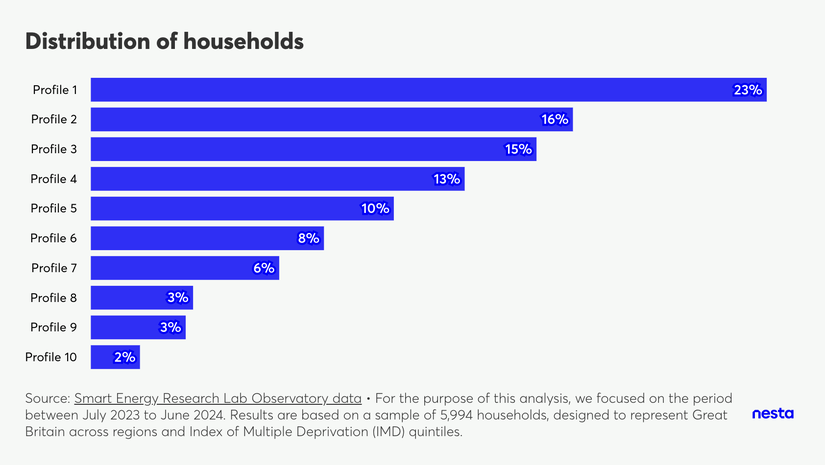
A horizontal bar chart titled "Distribution of households" shows distribution of households by energy-use profile. There are 10 bars, one for each profile, where profile 1 covers 25% of the households (highest value) and profile 10 covers 2% (lowest value).
The footnote highlights the data source, Smart Energy Research Lab Observatory data and that "For the purpose of this analysis, we focused on the period between July 2023 to June 2024. Results are based on a sample of 5,994 households, designed to represent Great Britain across regions and Index of Multiple Deprivation (IMD) quintiles."
Through a mixture of data science techniques and domain knowledge expertise, households were grouped into 10 different energy-use profiles. Results show that households are not evenly distributed, reflecting that different proportions of the population have different energy consumption behaviours. The biggest profile covers 1,374 (23% of) households, while the smallest one covers 100 (2% of) households.
Most households in profiles 7 and 10 don’t consume gas, while most of the other profiles have households that cook or heat their home with gas.