Distinct trimodal peaks are observed in electric heating profiles
https://flo.uri.sh/visualisation/24395768/embed
Image Description
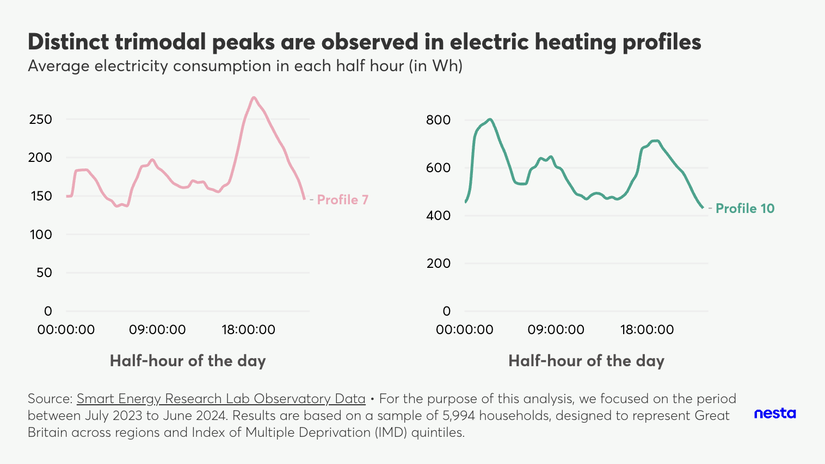
A grid of 2 charts, titled "Distinct trimodal peaks are observed in electric heating profiles", shows the average daily electricity consumption curve for profiles 7 and 10. For each chart, the x-axis shows time of day and the y-axis shows electricity consumption in Wh. Both profiles have distinct trimodal peaks.
The footnote highlights the data source, Smart Energy Research Lab Observatory data and that "For the purpose of this analysis, we focused on the period between July 2023 and June 2024. Results are based on a sample of 5,994 households, designed to represent Great Britain across regions and Index of Multiple Deprivation (IMD) quintiles."
While most electricity consumption profiles show a morning increase and an evening peak, profiles 7 and 10 exhibit particularly distinct trimodal peaks throughout the day. These profiles are characterised by a higher than average proportion of households with electric central heating systems, particularly heat pumps. It's important to note that these trend lines represent the average electricity consumption per profile on a typical day, not individual household consumption. Therefore, these aggregated profiles might be combining diverse behaviours from various households within each group.