A profile comprising 3% of households uses three times more gas, on average, than households in the most commonly observed profile
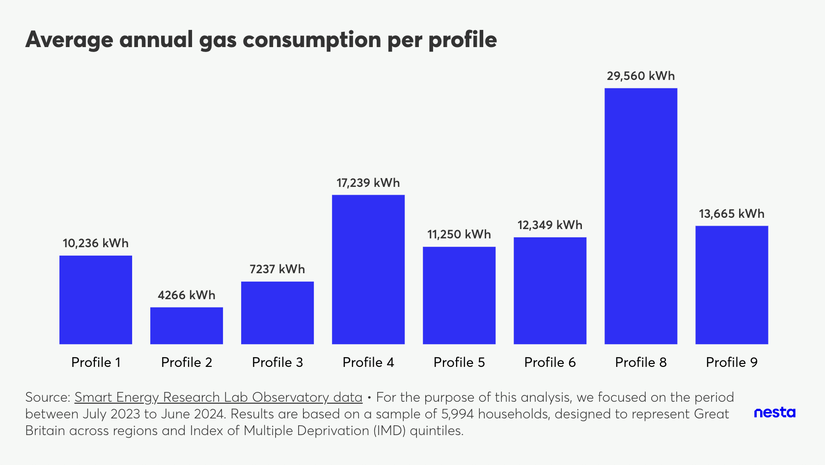
Average annual gas consumption per profile
Image Description
A vertical bar chart titled "Average annual gas consumption per profile" shows the average annual gas consumption in kWh for each energy-use profile. There are 8 bars, one for each profile (except profiles 7 and 10), where profile 2 has the lowest consumption, at 4266 kWh/per year, and profile 10 has the highest consumption, at 29,560 kWh/per year.
The footnote highlights the data source, Smart Energy Research Lab Observatory data and that "For the purpose of this analysis, we focused on the period between July 2023 to June 2024. Results are based on a sample of 5,994 households, designed to represent Great Britain across regions and Index of Multiple Deprivation (IMD) quintiles."
Off-gas homes are primarily found in profiles 7 and 10. Due to the minimal number of on-gas households in these profiles, average annual gas consumption isn't provided as it wouldn't accurately represent these groups.
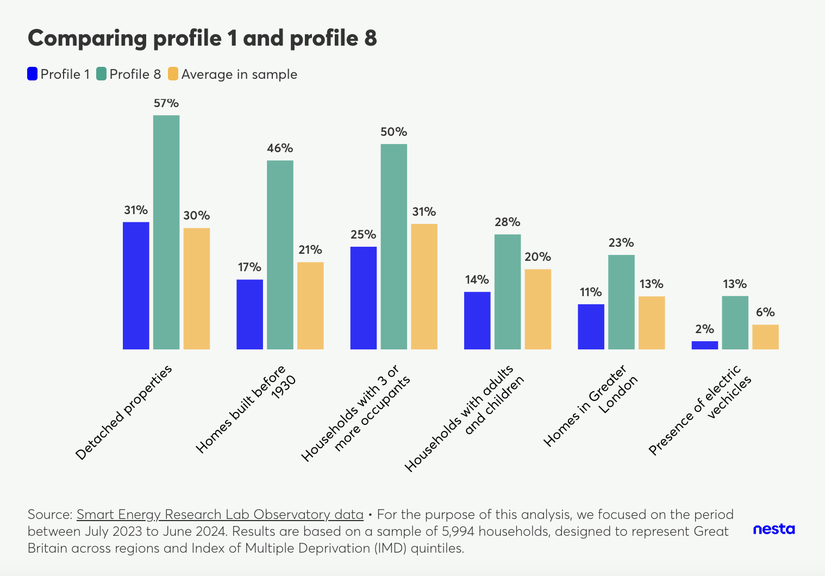
When it comes to gas consumption, the average household in profile 8 consumes considerably more gas than the average household in profile 1. The average annual consumption for profile 8 stands at 29,560 kWh, roughly three times higher than profile 1's 10,235 kWh. Key differences between these profiles include the following.
- Property type: detached properties are more common in profile 8 (57%) than in profile 1 (31%).
- Property age: almost 50% of homes in profile 8 were constructed before 1930, in comparison to profile 1's 16%.
- Household Demographics: half of profile 8 households comprise three or more people and there is a larger proportion of households with children (28%). In profile 1, only a quarter of households have three or more people, with 14% having children.
- Geographic distribution: profile 8 has the highest concentration of homes within Greater London (23%), whereas profile 1 has only 11%.
- Electric vehicle ownership: profile 8 shows a higher adoption of electric vehicles, with at least 13% of households owning one, compared to just 2% in profile 1.
Comparing profile 1 and profile 8
Image Description
A vertical bar chart, titled "Comparing profile 1 and profile 8," compares these two profiles against the sample average based on property information (detached properties, properties built before 1930 and properties in Greater London), presence of electric vehicles and the composition of households (with 3 or more occupants and/or with children).
The footnote highlights the data source, Smart Energy Research Lab Observatory data and that "For the purpose of this analysis, we focused on the period between July 2023 to June 2024. Results are based on a sample of 5,994 households, designed to represent Great Britain across regions and Index of Multiple Deprivation (IMD) quintiles."