Nesta Working Paper No. 14/02
UK investment in intangible assets: Report for Nesta
Peter Goodridge
Jonathan Haskel
Gavin Wallis
Nesta Working Paper 14/02
March 2014
www.nesta.org.uk/wp14-02
Abstract
This report provides an update on estimates of the level of UK market sector investment in knowledge assets. Our main findings are:
- In 2011 the UK market sector invested £137.5bn in knowledge assets, compared to £89.8bn in tangible assets;
- Since the recession of 2008-9, intangible investment has recovered and grew in 2010-11. In contrast investment in tangible assets has been flat;
- Within intangible investment, the asset categories for which the most investment is observed in 2011 are: workforce training (£33.6bn); organisational change (£25.5bn); and software (£24.3bn).
JEL Classification: O47, E22, E01
Keywords: innovation, knowledge, intangibles, investment, capital
We are very grateful for financial support for this research from NESTA. This work was based on data from the Annual Survey of Hours and Earnings (ASHE), National Employers Skills Survey (NESS) and UK Innovation Survey (UKIS), produced by the Office for National Statistics and supplied by the Secure Data Service at the UK Data Archive. The data are Crown Copyright and reproduced with the permission of the controller of HMSO and Queen's Printer for Scotland. The use of the data in this work does not imply the endorsement of the ONS or Secure Data Service at the UK Data Archive in relation to the interpretation or analysis of the data. This work uses research datasets which may not exactly reproduce National Statistics aggregates. Views expressed in this report represent those of the authors and do not necessarily reflect those of affiliated institutions. All errors are of course our own.
The Nesta Working Paper Series is intended to make available early results of research undertaken or supported by Nesta and its partners in order to elicit comments and suggestions for revisions and to encourage discussion and further debate prior to publication (ISSN 2050-9820). © Year 2014 by the author(s). Short sections of text, tables and figures may be reproduced without explicit permission provided that full credit is given to the source. The views expressed in this working paper are those of the author(s) and do not necessarily represent those of Nesta. Corresponding author: Peter Goodridge, Jonathan Haskel, Gavin Wallis, Imperial College Business School, Imperial College, London, SW7 2AZ. [email protected]; [email protected]; [email protected].
1. Introduction
This report builds on previous work which estimated UK market sector investment in knowledge capital (Goodridge, Haskel and Wallis (2012)). We estimate UK market sector investment in knowledge or intangible assets, using the comprehensive framework outlined in Corrado, Hulten et al. (2005), hereafter CHS. Our estimates are measures of all long-lived spending on creating knowledge assets, which contribute to the production of output over a period of greater than one year.
Our main findings are as follows:
1) In 2011, we estimate that the UK invested £137.5bn in intangible assets compared to £89.8bn in tangible assets;
2) Since the recession of 2008-9, intangible investment has recovered and grew in 2010-11. In contrast investment in tangible assets has been flat;
3) Within intangible investment, the asset categories for which the most investment is observed in 2011 are: workforce training (£33.6bn); organisational change (£25.5bn); and software (£24.3bn).
This report proceeds as follows. In section 2 we set out our conceptual framework. In section 3 we discuss our methods for measurement in the context of that framework and present our estimates for UK market sector investment in intangible assets. We also set out the measurement of tangible assets using the data available at time of writing from the Office of National Statistics. That data has been drastically revised since last year and so we present in the Appendix a detailed description of the changes. Section 4 concludes.
2. Conceptual Upstream-Downstream Framework
The following section is a summary of the appropriate conceptual framework to consider production of, investment in, and consumption of, knowledge capital. It is based on the concept of 'upstream' and 'downstream' sectors, as applied in Corrado, Goodridge and Haskel (2011), where the upstream creates original knowledge assets and the downstream uses the knowledge in the generation of final output. For example, the upstream could produce film originals which are used by downstream cinema projectors or television broadcasters, or in the production and distribution of copies, in the generation of final output. Alternatively the upstream could consist of an R&D (or design) unit that produces commercial knowledge to be used in the downstream operations sector. This upstream-downstream framework can be applied to any form of long-lived knowledge that is used in the generation of final output.
Consider then an economy with an innovation (knowledge-producing) sector and a final output (knowledge-using) sector. The innovation sector (upstream) produces long-lasting knowledge assets which contribute to production in the final output (downstream) sector. In this economy we may write the value of gross output in the innovation sector as PNN. This is equal to factor and intermediate costs in the sector multiplied by any mark-up (μ) over those costs, where μ represents the monopoly power earned by the innovator through the ownership of a unique knowledge asset:
PNN = μ(P£LN + PKK N + PMMN + PRRN) (1)
Where: PLN, PKK N and PMMN are payments for labour, capital and intermediates. PRRN are payments for intangible capital services, for instance royalty payments to use music in the production of a film original.
Consider next the final output or downstream sector, which uses the innovative good. They could purchase the asset rights (or some component of them) outright, for a cost PNN (or some proportion of PNN). Alternatively they could rent the good by paying a licence fee, PRR, for T years to the innovation sector. Capital market equilibrium implies that:
T
PNN = Σ PR/(1+r)ᵗ (2)
ᵗ=₁
Where R is the stock of knowledge from which they rent; using the perpetual inventory method (PIM) this might be represented by:
Rₜ = Nₜ +(1-δ)Rₜ₋₁ (3)
Equation (2) says that the value of the asset must equal the discounted rental payments from the users of the good.
The final output sector, which uses the long-lived knowledge asset, produces output, PY.
PᵞY = P£Lᵞ + PkKᵞ + PMMᵞ + PRRᵞ (4)
Where P£Lᵞ, PkKᵞ and PMMᵞ are the payments to labour, physical capital and materials in the using sector, and PRRᵞ are rental payments for using the IP created in the innovation sector. These payments could be explicit rentals, or implicit in the case where the IP is owned by the using firm. We assume that the final output sector is competitive and so there is no mark-up, μ. A similar income identity for the materials sector completes the model.
An adjusted concept of market sector value-added, that accounts for the capitalisation of intangible capital, consists of all the factor payments to labour and (tangible and intangible) capital, with intermediate payments excluded.
PºQ = P£L + PKK + PRR (5)
The following diagram provides a representation of the model using the example of film originals, but can be applied to any other form of knowledge capital.
Figure 1: Theoretical Framework. Upstream and Downstream in the Movie Industry
The diagram illustrates the flow of production and payments in the movie industry, divided into "Upstream" (Creation of artistic original, e.g., Movie Production) and "Downstream" (Use of artistic original, e.g., Cinemas).
Upstream:
* Sales (Gross Output) = PnN
* Costs of Labour, Capital & Intermediates in upstream plus Upstream Payments for rental of artistic originals = ΣPX(N) + PrR(N)
* PnN = µ [ΣPX(N)X(N) + PrR(N)]
Downstream:
* Sales (Gross Output) = PyY
* Costs of Labour, Capital & Intermediates in downstream plus Downstream Payments for rental of artistic originals = ΣPX(Y) + PrR(Y)
* PyY = ΣPX(Y)X(Y) + PrR(Y)
* Memo: PnN = Σ PrR/ (1+r)t
Note to Figure: To make the symmetry clear, a term for μ could also be included in the downstream. We assume that the downstream is competitive, so μ=1, always. Monopoly power does however exist in the upstream, due to the the ownership of rights to a unique asset. So in the upstream, μ>1.
To summarise, in this model, UK investment in IP is the production of long-lived (i.e. with a service life of at least one year) knowledge assets that are owned by UK residents. Consider then the following distinctions:
- 'UK IP production' is all IP production that takes places in the UK, regardless of ownership and duration of life;
- ‘UK IP investment' is restricted to production of IP goods with a service life of more than one year repeatedly used in the production of output (assets), that are owned by a UK resident;
- 'UK IP consumption' is the use of short- or long-lived IP, by firms resident in the UK, regardless of the residency of the owner;
- 'Consumption of UK IP' is the use of UK-owned short- or long-lived IP, in all downstream firms worldwide (not just those resident in the UK)
- 'UK consumption of UK IP' is use of short- or long-lived UK IP in UK downstream firms
So, using our example of a film original, a feature movie produced in the UK but owned by an American firm would be classed as UK production but not UK investment. The projection of that same film in a UK cinema is ‘UK IP consumption', but not 'consumption of UK IP'.
The above framework also highlights the weaknesses in analysing UK IP investment using official datasets. Suppose that we wish to measure the value of a TV or radio drama production (PNN). Our framework illustrates why this is hard to do from published industry data as classified by the Standard Industrial Classification (SIC). Consider the SIC class "Television and Radio Activities'. This does not distinguish between the production of programmes and their broadcast. Moreover, production and broadcasting are often both undertaken by the same organisation. So, both upstream and downstream activities are included in this SIC class. Thus, a measure of sales for the whole industry includes: the downstream revenues earned by the broadcaster (PY ), whether earned from long-lived IP assets or short-lived IP goods; all UK IP production, including short-lived news or sports programmes, and also UK production of assets owned in the Rest of the World (e.g. a US network funding and owning the rights to a programme produced in the UK); as well as UK IP investment (PNN).
Therefore we cannot use published SIC data to identify UK IP investment. Instead, we identify UK production of IP assets owned in the UK. Continuing with the example of TV originals, we use data from production companies or network production arms. Such data are reported for ITV, BBC, Channel 4 in OFCOM reports. This allows us to make an estimate based on the upstream input costs of asset creation, as in (1). However, we have to undertake a number of adjustments. First, to identify investment, we must subtract the costs of production of short-lived goods such as news and sports. Second, we must deduct the costs of production for exported products (not UK-owned) and add in the value of imports (UK-owned). Third, converting such costs into output values requires an estimate of the mark-up, μ, the value of which is uncertain. Alternatively, if available, measures of investment can be estimated using data on the income earned by that asset class (PRR). This latter approach is taken in the estimation of investment in literary and music originals.
3. Measurement
Our measurement approach is designed to be consistent with the UK National Accounts and therefore with official measures of output, income (accruing to labour and capital) and expenditure (including consumption and investment). We start by estimating investment in knowledge assets as identified by Corrado, Hulten et al. (2005) and applied in Goodridge, Haskel and Wallis (2012) for the UK. We then adjust the official data from the National Accounts accurately to count spending on knowledge assets with a shelf-life of more than a year as investment rather than consumption, in a logically coherent framework that avoids double counting.
The categories of knowledge assets in our dataset are as featured in the NESTA Innovation Index, and discussed in greater detail below. Included are new estimates of investment in artistic originals, which have been revised in the national accounts, with the new estimates based on our previous work funded by the UK IPO (Goodridge and Haskel 2011; Goodridge, Haskel et al. 2012).
Below we provide a brief description of the methodologies and sources used to estimate expenditure and investment on UK production of knowledge goods, by asset type. For a more extensive description please consult past work such as Goodridge, Haskel and Wallis (2012).
Following Corrado, Hulten et al. (2005) we identify three broad groups of knowledge assets: i) Computerised information; ii) Innovative property; iii) Economic competencies. The following table sets out UK investment for each of these groups and the asset types within them. All estimates presented are new to this report.
Table 1: UK Market Sector Investment; Tangible & Intangible, £bns nominal
| Year |
1990 |
1995 |
2000 |
2005 |
2010 |
2011 |
| Buildings |
27.0 |
20.5 |
31.5 |
33.7 |
41.7 |
50.6 |
| Plant & Machinery (incl. IT hardware and CT) |
35.3 |
42.6 |
47.9 |
51.2 |
34.3 |
35.0 |
| Vehicles |
9.8 |
10.3 |
9.1 |
10.7 |
13.6 |
4.2 |
| All tangibles |
72.1 |
73.4 |
88.5 |
95.7 |
89.6 |
89.8 |
| Intangible category |
|
|
|
|
|
|
| Computerised information and databases |
7.3 |
11.0 |
17.2 |
22.3 |
23.4 |
24.3 |
| Own-account Software |
4.8 |
5.8 |
9.9 |
11.9 |
12.9 |
13.2 |
| Purchased Software |
2.5 |
5.2 |
7.3 |
10.4 |
10.4 |
11.0 |
| Innovative property |
18.9 |
20.9 |
27.8 |
35.5 |
39.0 |
40.7 |
| Scientific R&D |
7.3 |
8.3 |
10.7 |
12.7 |
14.8 |
15.9 |
| R&D in social sciences and humanities |
0.2 |
0.3 |
0.4 |
0.3 |
0.9 |
0.9 |
| Financial Product Innovation |
0.3 |
0.4 |
0.7 |
0.9 |
1.6 |
1.8 |
| Design (Own-account; Purchased) |
7.5 |
7.8 |
10.6 |
13.9 |
15.4 |
15.5 |
| Artistic Originals (Film; TV & Radio; Music; Books; Misc Art) |
1.9 |
3.0 |
4.9 |
7.0 |
5.7 |
5.8 |
| Mineral Exploration |
1.6 |
1.1 |
0.5 |
0.7 |
0.6 |
0.8 |
| Economic Competencies |
24.1 |
34.9 |
51.2 |
66.0 |
72.1 |
72.6 |
| Branding (Advertising; Market Research) |
4.6 |
6.4 |
9.6 |
11.1 |
12.9 |
13.5 |
| Training |
13.7 |
16.9 |
23.6 |
29.2 |
32.2 |
33.6 |
| Organisational (Own-account; Purchased) |
5.9 |
11.7 |
18.1 |
25.7 |
27.0 |
25.5 |
| All intangibles |
50.2 |
66.8 |
96.2 |
123.8 |
134.5 |
137.5 |
Source: Estimates for tangibles are ONS estimates of private sector investment plus that of public corporations, downloaded on 20th January 2014. Estimates for intangibles are constructed as described below. Note estimates of intangible investment do not equate to expenditure.
We note that these estimates for tangible investment are somewhat lower than we have presented in the past. This is due to ONS revisions to current price investment in the 1990s and 2000s. ONS (2014) reports that overall estimates of current price GFCF for combined assets has been revised down by about 3% on average over the period 1997 to 2010. Within that, tangible investment has been revised down by some 15% on average over that period, while intangible investment (referring only to intangibles already capitalised in the national accounts, namely purchased and own-account software, artistic originals and mineral exploration) has almost doubled in current prices. Changes to official estimates of intangible investment are due to: a) revisions to estimates of investment in artistic originals, based on our previous work (Goodridge and Haskel 2011; Goodridge, Haskel et al. 2012); and b) revisions to estimates of investment in own-account software to better account for net operating surplus in own-account software production (i.e. in terms of equation (1), to better account for PkK N).
The following chart presents estimates of aggregate market sector investment in tangible and intangible asset categories over the period 1990 to 2011. The recession is highlighted using the blue bar.
Figure 2. UK market sector investment in tangible and intangible assets, Nominal £bns
A line graph showing UK market sector investment, nominal (£bns), over time from 1990 to 2010. It depicts two lines: "Tangible" and "Intangible". A shaded blue bar indicates a "Recession" period around 2008-2009. The "Intangible" line rises from below 40 in 1990 to over 120 by 2010, consistently staying above the "Tangible" line since around 1999. The "Tangible" line fluctuates, peaking around 100 before the recession and dropping afterward.
Source: ONS for tangible (downloaded 20th January 2014), this report for intangible
There are two main points to note from this chart. First, investment in intangibles has been consistently higher than investment in tangibles since 1999. Second, although investment in intangibles did decline during the recession it has since recovered and has been growing since 2010. Nominal intangible investment grew at rates of 2.7% in 2010 and 2.2% in 2011. In contrast, tangible investment collapsed in 2009 and has failed to recover since. Nominal tangible investment fell by 15.7% in 2009, and only grew by 0.2% in 2010 and also 2011.
On tangible investment, these are the latest ONS data and reflect recent revisions to official estimates of UK investment. They show that, in 2011, the level of nominal intangible investment is almost equal to its level in 2000 (£90bn in 2011 compared to £89bn in 2000). Therefore, according to the latest data, it seems that over the longest expansion in post-war economic history, nominal tangible investment barely grew at all. The story of the 2000s is one of a slow decline in tangible investment between 2000 and 2004, before a rise in the mid-2000s and then a collapse in the later recession. These data are studied in more depth in Appendix 2. They show that the rise in the mid-2000s is driven primarily by investment in commercial property and intangibles (i.e. those intangibles already capitalised in the national accounts, namely software, artistic originals and mineral exploration). Nominal investment in plant is recorded at a lower level in 2012 than in 1998 (£39bn in 2012 compared to £46bn in 1998). This reflects ONS revisions to nominal investment which primarily consist of a downward revision to investment in plant and an upward revision to investment in intangibles. Note that insofar as plant investment includes computers and software, whose price is falling, nominal investment might fall even if quantities rise.
We now go on to discuss our measurement, and estimates of investment for each asset in more detail.
3.1 Computerised Information and databases
As Table 2 shows, software investment in 2011 was considerable at approximately £24bn, comfortably exceeding Scientific R&D and also a broader definition of R&D that encompasses R&D in social sciences and financial product innovation. Total Software investment comprises both purchased and own-account, and also computerised databases. Software is already capitalised in the National Accounts, and so our source for computer software investment is contained in the ONS work described by Chamberlin, Clayton et al. (2007). Purchased software data are based on company investment surveys and own-account based on the wage bill of employees in computer software occupations, adjusted downwards for the fraction of time spent on creating new software (as opposed to, say routine maintenance) and then upwards for associated overhead costs (a method we use for design below). The data, which run from 1997 to 2011, are updated data provided by ONS. The data are backcast further using previous estimates of market sector software investment as reported in Goodridge, Haskel et al. (2012). Estimates are presented below.
Figure 3. Software: UK Investment, Nominal £bns
A line graph showing UK investment in software in nominal £bns from 1990 to 2010. Three lines are depicted: "Own-account Software", "Purchased Software", and "Software Investment (UK Market Sector)". All lines show an upward trend, with "Own-account Software" and "Purchased Software" contributing to the total "Software Investment". Total investment reaches close to £25bn by 2010.
Source: ONS
3.2 Scientific R&D
As shown in Table 3, in 2011 investment in scientific R&D was approximately £16bn. For business Scientific R&D we use expenditure data by industry derived from the Business Enterprise R&D survey (BERD), which provides data back to 1981. To avoid double counting of R&D and software investment, we subtract R&D spending in “computer and related activities” (SIC 72) from R&D spending since this is already included in the software investment data. R&D that takes place in R&D products is assumed to take place in the R&D services industry, and that spend is allocated out using data on shares of R&D purchases in the Supply Use tables. Since BERD also includes physical capital investments we convert those investments into a capital compensation term, using the resulting physical capital stocks for the R&D sector and the user cost relation.
Figure 4. Scientific R&D: UK Investment, Nominal £bns
A line graph showing UK investment in scientific R&D in nominal £bns from 1990 to 2010. The "R&D Investment (UK Market Sector)" line shows a general upward trend, starting around £4bn in 1990 and reaching over £16bn by 2010, with a notable increase in the mid-2000s.
Source: ONS, BERD
3.3 R&D in social sciences and humanities
In Table 4 the estimate for R&D in social sciences and humanities is £0.9bn in 2011. R&D in social sciences and humanities is estimated as twice the turnover of the industry “Research and experimental development on social sciences and humanities” (SIC07 72.2), where the doubling is assumed to capture own-account spending. Turnover data are taken from published data for the Annual Business Survey (ABS) and previously the Annual Business Inquiry (ABI) and are available for 1997 to 2011.
Data are backcast using turnover data published in the Service Sector review and Business Monitor. This is a small number and we suspect there is little marginal benefit to improving its measurement. The series for non-scientific R&D is presented below.
Figure 5. Non-Scientific R&D: UK Investment, Nominal £bns
A line graph showing UK investment in non-scientific R&D in nominal £bns from 1990 to 2010. The "Non-scientific R&D Investment (UK Market Sector)" line shows fluctuations, remaining below £0.6bn for most of the period, with a noticeable increase towards £0.8bn by 2010.
Source: ONS, ABS, ABI
3.4 Financial Product Innovation
In Table 5, investment in Financial Product Innovation is estimated at £1.8bn in 2011. The measurement methodology for New products development costs in the financial industry follows that of own account software. Further details are in Haskel and Pesole (2010) but a brief outline is as follows. First, we interviewed a number of financial firms to try to identify the job titles of workers who were responsible for product development. Second, we compared these titles with the available occupational and wage data from the Annual Survey on Hours and Earnings (ASHE). The occupational classification most aligned with the job titles was 'economists, statisticians and researchers'. Third, we asked our interviewees how much time was spent by these occupations on developing new products that would last more than a year. Some firms based their estimates on time sheets that staff filled out. Fourth, we asked firms about the associated overhead costs with such workers. Armed with these estimates, we went to the occupational data in the ASHE and derived a time series of earnings for those particular occupations in financial intermediation. Own-account investment in product development is therefore the wage bill, times a mark-up for other costs (capital, overheads etc.), times the fraction of time those occupations spend on building long-term projects. This provides data for 1997 to 2011. Data are backcast further using the growth rate of industry turnover.
Figure 6. Financial Product Development: UK Investment, Nominal £bns
A line graph showing UK investment in financial product innovation in nominal £bns from 1990 to 2010. The "Investment in Financial Product Innovation (UK Market Sector)" line shows a steady increase over time, rising from near zero in 1990 to just under £1.8bn by 2010.
Source: Own estimates, based on ASHE
3.5 Architectural and Engineering Design
As shown in Table 6, for 2011 we estimate investment in Design at £15.5bn in 2011. Purchased data are taken from the Supply-Use Input Output (IO) tables. For own-account we use the own-account software method. Full details are set out in Galindo-Rueda, Haskel et al. (2008).
In the case of purchased investments, as in Goodridge, Haskel et al. (2012), we have chosen to exclude purchases of design by the industry itself (‘Professional, Scientific and Technical Activities', SIC 69t74), since some of these purchases will certainly include outsourcing and subcontracting arrangements which would be double-counting. On own-account, the choice of occupations and the time allocation are, as in financial services, taken from interviews with a number of design firms. We focus on architectural, engineering and design (AED) activities, including architects, engineers (excluding software) and general designers (graphic, product and clothing designers). Interestingly, almost all of the design firms we interviewed have time sheets for their employees which break out their time into administration, design and client interaction/pitching for new business (almost all firms target, for example, that junior designers spend little time on administration and senior more time on pitching). Thus, for professional designers, we assigned 50% of their time to ‘long lived design' and engineers only 10%, with 60% to the rest.
On engineers we note that here there is the potential for double-counting with R&D, since the wages and salaries of engineers that conduct R&D will be reported in the BERD data. Not all engineers will be involved in R&D however. This is another reason for choosing to only allocate 10% of the time of engineers to investment in design.
Further since some design expenditure/activity is short-lived rather than on the building of long-lived assets, we further reduce the estimate by 50% to account for this. This factor is again based on interviews conducted with design companies and the UK Design Council.
These methods provide estimates of investment for 1997 to 2011. Own-account estimates are extended back further using data from the New Earnings Survey (NES) and purchased using data from previous versions of the Supply Use Tables (back to 1992) and prior to that data on the turnover of the design industry as published in the Business Monitor. Our series for UK investment in architectural and engineering design is presented below
Figure 7. Architectural and Engineering Design: UK Investment, Nominal £bns
A line graph showing UK investment in architectural and engineering design in nominal £bns from 1990 to 2010. The "Investment in Design (UK Market Sector)" line shows a general upward trend, rising from approximately £4bn in 1990 to over £14bn by 2010.
Source: Own estimates, based on ASHE and ONS Supply Use Tables
3.6 Artistic Originals
From Table 7, in 2011 the estimate for investment in ‘Artistic Originals' is £5.8bn. Artistic Originals are already capitalised in the national accounts so we use those data. These estimates are revised from past estimates, using new methods and data, based on our previous work funded by the IPO (Goodridge and Haskel 2011; Goodridge, Haskel et al. 2012). We briefly describe the data and methods used below. The estimates incorporate measures of UK investment in: Film; TV & Radio; Music; Books; and Miscellaneous Art.
Estimates for investment in film originals are built bottom-up using data on budgets for UK productions using a microdata set of all UK films produced since 1991. The dataset includes information on co-producing partner countries and indicators on majority and minority funding. We use such information to construct UK ownership shares for each individual film, providing us with an estimate of investment in each UK-owned film original. Estimates for television and radio are based on data for production costs for UK broadcasters, as published in OFCOM Annual Reports, excluding expenditure on short-lived genres or formats such as 'News' or 'Current Affairs'. Estimates for investment in literary originals are calculated using measures of the capital compensation that flows to the owners of rights (namely publishing houses and authors). Under the assumption of steady-state conditions, such compensation can be used as a proxy for investment. Similarly, estimates for investment in recorded originals (music) are also calculated using an income-based approach, with the data on income incorporating the revenues earned by the owners of rights through recording sales, royalties distributed by the music collecting societies, and revenues earned from live performance. For other forms of art that meet the criteria for artistic originals (photography/images, choreographed routines, fine art etc.), estimates are produced using data on the labour costs of relevant occupations as reported in ASHE, and reduced by 50% to account for the possibility of such professions earning a proportion of their income from other sources.
The official data for investment in Artistic Originals run from 1997 to 2011. We extend the estimates back further using a combination of our own estimates (Goodridge and Haskel 2011; Goodridge, Haskel et al. 2012) and the old national accounts estimates from prior to the revision. The series for investment in this asset category is presented below.
Figure 8. Artistic Originals: UK Investment, Nominal £bns
A line graph showing UK investment in artistic originals in nominal £bns from 1990 to 2010. The "Investment in Artistic Originals (UK Market Sector)" line shows a general upward trend, with a notable spike above £7bn in the mid-2000s, before declining and then slightly recovering to around £5bn by 2010.
Source: ONS, based on Goodridge and Haskel (2011) and Goodridge, Haskel et al. (2012).
3.7 Mineral Exploration
As shown in Table 8, in 2011 investment in Mineral Exploration was £0.8bn. Like computerised information and artistic originals, mineral exploration is already capitalised in the National Accounts and the data here are simply data for Gross Fixed Capital Formation (GFCF) from the ONS, valued based on "payments made to contractors or costs incurred on own account. The costs of past exploration, not yet written-off, are re-valued (which in this case may well reduce the value). This expenditure covers the costs of drilling and related activities such as surveys. It is included in GFCF whether or not the exploration is successful.” (ONS 1998). These data run from 1997 to 2011. They are extended back further using data from past releases of the national accounts.
Figure 9. Mineral Exploration: UK Investment, Nominal £bns
A line graph showing UK investment in mineral exploration in nominal £bns from 1990 to 2010. The "Investment in Mineral Exploration (UK Market Sector)" line fluctuates, peaking around £2bn in the early 1990s, declining, and then showing a slight upward trend towards £0.5bn-£1bn in the late 2000s.
Source: ONS
3.8 Branding: Advertising and Market Research
As shown in Table 9, in 2011 we estimate total investment in Branding to have been around £13.5bn. Of this, advertising made up £9.9bn, and market research £3.6bn. Each category is estimated using data on purchases from the Supply Use Tables (product group 73: Advertising and market research services) across all industries. As with design, we exclude purchases made by the industry itself (SIC 69t74, Professional, Scientific and Technical Activities) since some of these purchases include outsourcing and subcontracting arrangements which would be double counting. Advertising and Market research are split using data from the ABS and estimates for market research are further doubled to allow for own-account expenditure. As with design, not all expenditure goes toward the building of reputational assets, since some is short-lived. To account for this we take 60% of the expenditure estimates and assume that proportion represents investment. These data are available from 1997 to 2011. Data are extended back further using previous estimates constructed from past releases of the Supply Use Tables. Our series for investment in Branding is presented below.
Figure 10. Branding: UK Investment, Nominal £bns
A line graph showing UK investment in branding in nominal £bns from 1990 to 2010. The "Investment in Branding (UK Market Sector)" line shows a consistent upward trend, rising from less than £5bn in the early 1990s to over £12bn by 2010.
Source: Own estimates based on ONS Supply Use Tables
3.9 Firm-specific human capital (Training)
From Table 10, our estimate of investment in Training is £33.6bn in 2011. Firm specific human capital - training provided by firms - was estimated using cross sections from the National Employer Skills Survey for 2007 and 2009. We also have data for 1988 from an unpublished paper by John Barber. We thus backcast the series using the EU KLEMS wage bill time series benchmarking the data to three cross sections, and extend the series forward with ONS compensation of employees. Our series for investment in Training is presented below.
Figure 11. Training: UK Investment, Nominal £bns
A line graph showing UK investment in training in nominal £bns from 1990 to 2010. The "Investment in Training (UK Market Sector)" line displays a continuous upward trend, rising from below £15bn in the early 1990s to over £30bn by 2010.
Source: Own estimates based on NESS
3.10 Organisational Structure
As shown in Table 11, for 2011 we estimate investment in organisational structure at £25.5bn. Our data on investment in organisational structure relies on purchased management consulting, on which we have consulted the Management Consultancy Association (MCA), and own-account time-spend, as before. On purchased, the MCA state that they represent 70% of the industry. We therefore apply an upward adjustment to account for the remainder of the industry. We have MCA data for the years 2002-05 and 2009-10. Estimates for other years are interpolated and extrapolated using data on the turnover of the management consulting industry from the ONS ABS and its predecessors. We also assume that not all purchased organisational knowledge represents investment. Therefore 20% of purchased consultancy is removed from the investment figure, on the basis that not all of the knowledge acquired is long-lived capital. The method for own-account relies on identifying managers by occupation. Then using ASHE, we take 20% of the managerial wagebill and assume that covers the own-account costs of investments in the improvement of organisational processes. Our own-account estimates run from 1997 to 2011. They are backcast further using data from the NES. Our series for organisational investment is shown below.
Figure 12. Organisational Structure: UK Investment, Nominal £bns
A line graph showing UK investment in organisational structure in nominal £bns from 1990 to 2010. The "Organisational Investment (UK Market Sector)" line shows a strong upward trend, increasing from less than £5bn in the early 1990s to over £25bn by 2010.
Source: Own estimates based on data from the MCA and ASHE
All the above estimates are presented at the aggregate market sector level. Appendix 1 presents estimates of intangible investment at the industry-level. Appendix 2 discusses any changes to the above estimates compared to those we have published previously.
4. Conclusions
Applying the intangibles framework, as used in the NESTA Innovation Index, we find that total UK market sector investment in intangible assets reached £137.5bn in 2011, compared to £89.8bn of investment in tangible assets. We also note that since the recession of 2008-9, intangible investment has recovered and grew in 2010-11. In contrast investment in tangible assets has been flat. Within intangible investment, the asset categories for which the most investment is observed in 2011 are: workforce training (£33.6bn); organisational change (£25.5bn); and software (£24.3bn).
References
Chamberlin, G., T. Clayton, et al. (2007). "New measures of UK private sector software investment." Economic and Labour Market Review 1(5): 17-28.
Corrado, C., P. Goodridge, et al. (2011). "Constructing a Price Deflator for R&D: Calculating the Price of Knowledge Investments as a Residual."
Corrado, C., C. Hulten, et al. (2005). Measuring capital and technology: an expanded framework. C. Hulten, University of Chicago Press.
Galindo-Rueda, F., J. Haskel, et al. (2008). How much does the UK employ, spend and invest in design, CeRIBA Working paper, April.
Goodridge, P. and J. Haskel (2011). Film, Television & Radio, Books, Music and Art: UK Investment in Artistic Originals, CERIBA working paper.
Goodridge, P., J. Haskel, et al. (2012). "Updating the value of UK copyright investment."
Goodridge, P., J. Haskel, et al. (2012). "UK Innovation Index: productivity and growth in UK industries."
Haskel, J. and A. Pesole (2010). Productivity and Innovation in UK Financial Services: An Intangible Assets Approach.
ONS (1998). "National Accounts: Concepts, Sources and Methods."
ONS (2014). "Multi-factor Productivity, Indicative Estimates to 2012."
Appendix 1: Industry-level Intangible Investment
This appendix presents data for nominal intangible investment at the industry level, based on a nine industry breakdown. The following charts present industry data for each intangible asset. Where relevant, estimates of own-account and purchased estimates have been summed for that category. Estimates for advertising and market research have also been summed to form the asset category 'Branding'. In each chart the line at 2008 marks the start of the recent recession.
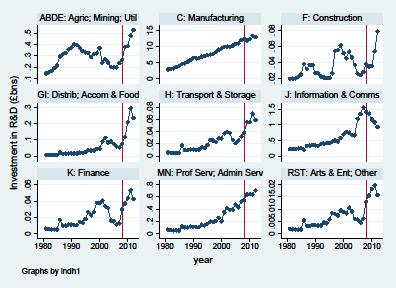 Figure A1.1: Industry-level investment in R&D
Note to figure: Y-axes for each chart have different scales
Figure A1.1: Industry-level investment in R&D
Note to figure: Y-axes for each chart have different scales
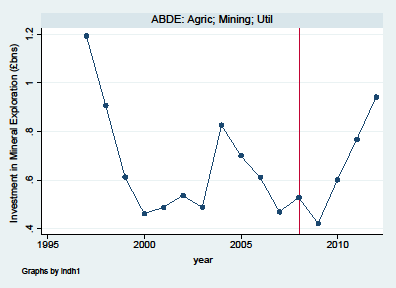 Figure A1.2: Industry-level investment in Mineral Exploration
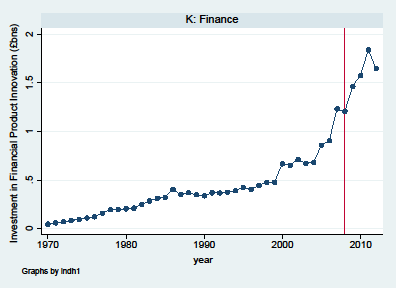 Figure A1.3: Industry-level investment in Financial Product Innovation
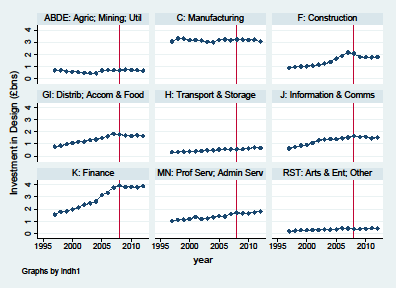 Figure A1.4: Industry-level investment in Design
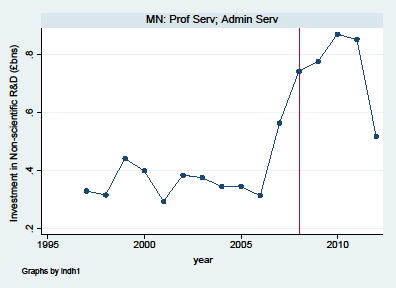 Figure A1.5: Industry-level investment in Non-scientific R&D
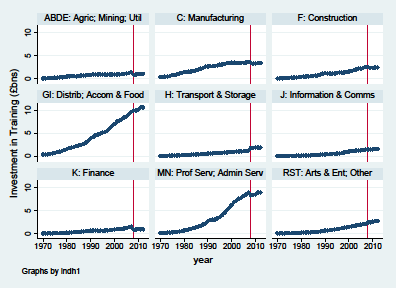 Figure A1.6: Industry-level investment in Training
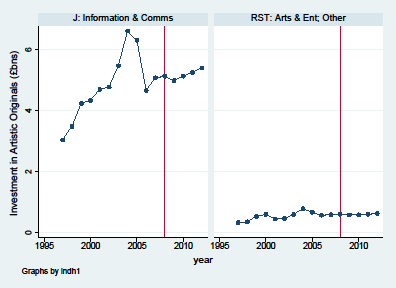 Figure A1.7: Industry-level investment in Artistic Originals
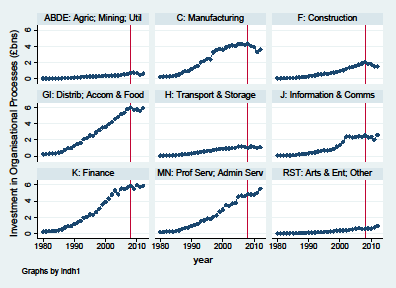 Figure A1.8: Industry-level investment in Organisational Processes
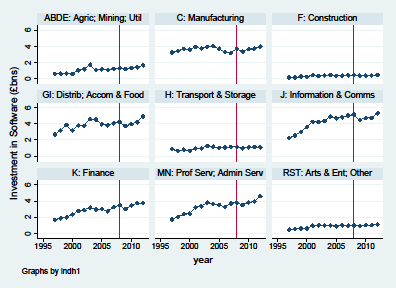 Figure A1.9: Industry-level investment in Software
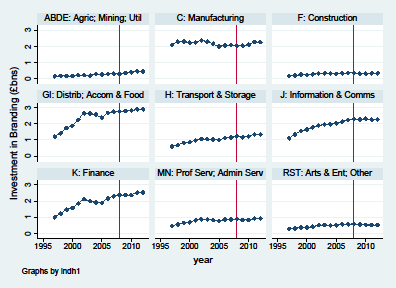 Figure A1.10: Industry-level investment in Branding
Data in the above charts, for 1997 to 2011, are summarised below in Table A1.1.
Table A1.1: Intangible investment by asset, industry and year, Nominal £bns
| Industry (SIC07) |
year |
Scientific R&D |
Mineral Exploration |
Financial Product Innovation |
Design |
Non-scientific R&D |
Training |
Artistic Originals |
Organisational Structure |
Software |
Branding |
Intangibles (Total) |
| ABDE: Agric; Mining; Util |
1997 |
0.29 |
1.19 |
0.00 |
0.69 |
0.00 |
0.89 |
0.00 |
0.29 |
0.60 |
0.15 |
4.09 |
|
1998 |
0.32 |
0.91 |
0.00 |
0.69 |
0.00 |
0.95 |
0.00 |
0.33 |
0.65 |
0.18 |
4.02 |
|
1999 |
0.32 |
0.61 |
0.00 |
0.61 |
0.00 |
0.94 |
0.00 |
0.36 |
0.65 |
0.17 |
3.67 |
|
2000 |
0.37 |
0.46 |
0.00 |
0.58 |
0.00 |
0.95 |
0.00 |
0.39 |
0.61 |
0.16 |
3.52 |
|
2001 |
0.24 |
0.49 |
0.00 |
0.55 |
0.00 |
0.96 |
0.00 |
0.36 |
1.04 |
0.23 |
3.87 |
|
2002 |
0.27 |
0.54 |
0.00 |
0.48 |
0.00 |
0.95 |
0.00 |
0.39 |
1.17 |
0.23 |
4.02 |
|
2003 |
0.24 |
0.49 |
0.00 |
0.46 |
0.00 |
1.02 |
0.00 |
0.40 |
1.74 |
0.20 |
4.54 |
|
2004 |
0.20 |
0.83 |
0.00 |
0.46 |
0.00 |
1.09 |
0.00 |
0.41 |
1.08 |
0.28 |
4.35 |
|
2005 |
0.20 |
0.70 |
0.00 |
0.68 |
0.00 |
1.14 |
0.00 |
0.47 |
1.17 |
0.26 |
4.62 |
|
2006 |
0.20 |
0.61 |
0.00 |
0.72 |
0.00 |
1.23 |
0.00 |
0.55 |
1.08 |
0.29 |
4.69 |
|
2007 |
0.24 |
0.47 |
0.00 |
0.71 |
0.00 |
1.39 |
0.00 |
0.60 |
1.24 |
0.31 |
4.95 |
|
2008 |
0.26 |
0.53 |
0.00 |
0.70 |
0.00 |
0.86 |
0.00 |
0.74 |
1.31 |
0.30 |
4.71 |
|
2009 |
0.38 |
0.42 |
0.00 |
0.74 |
0.00 |
0.94 |
0.00 |
0.77 |
1.19 |
0.37 |
4.82 |
|
2010 |
0.39 |
0.60 |
0.00 |
0.71 |
0.00 |
1.00 |
0.00 |
0.71 |
1.32 |
0.40 |
5.13 |
|
2011 |
0.48 |
0.77 |
0.00 |
0.71 |
0.00 |
1.08 |
0.00 |
0.49 |
1.42 |
0.46 |
5.40 |
| C: Manufacturing |
1997 |
7.69 |
0.00 |
0.00 |
3.05 |
0.00 |
3.26 |
0.00 |
3.27 |
3.23 |
2.09 |
22.59 |
|
1998 |
8.28 |
0.00 |
0.00 |
3.30 |
0.00 |
3.41 |
0.00 |
3.53 |
3.44 |
2.28 |
24.25 |
|
1999 |
9.00 |
0.00 |
0.00 |
3.30 |
0.00 |
3.45 |
0.00 |
3.67 |
3.69 |
2.30 |
25.41 |
|
2000 |
9.30 |
0.00 |
0.00 |
3.17 |
0.00 |
3.51 |
0.00 |
3.60 |
3.58 |
2.22 |
25.39 |
|
2001 |
9.86 |
0.00 |
0.00 |
3.18 |
0.00 |
3.51 |
0.00 |
3.86 |
3.94 |
2.24 |
26.59 |
|
2002 |
9.94 |
0.00 |
0.00 |
3.16 |
0.00 |
3.46 |
0.00 |
4.01 |
3.74 |
2.36 |
26.68 |
|
2003 |
9.83 |
0.00 |
0.00 |
3.03 |
0.00 |
3.48 |
0.00 |
4.12 |
3.94 |
2.29 |
26.68 |
|
2004 |
10.23 |
0.00 |
0.00 |
2.99 |
0.00 |
3.48 |
0.00 |
4.05 |
4.03 |
2.16 |
26.94 |
|
2005 |
10.73 |
0.00 |
0.00 |
3.19 |
0.00 |
3.48 |
0.00 |
4.27 |
3.71 |
1.98 |
27.37 |
|
2006 |
10.90 |
0.00 |
0.00 |
3.24 |
0.00 |
3.55 |
0.00 |
4.30 |
3.30 |
2.07 |
27.37 |
|
2007 |
11.90 |
0.00 |
0.00 |
3.16 |
0.00 |
3.68 |
0.00 |
4.19 |
3.15 |
2.08 |
28.17 |
|
2008 |
12.30 |
0.00 |
0.00 |
3.23 |
0.00 |
3.50 |
0.00 |
4.33 |
3.69 |
2.04 |
29.09 |
|
2009 |
11.85 |
0.00 |
0.00 |
3.22 |
0.00 |
3.29 |
0.00 |
4.06 |
3.34 |
2.04 |
27.81 |
|
2010 |
12.24 |
0.00 |
0.00 |
3.19 |
0.00 |
3.34 |
0.00 |
3.90 |
3.64 |
2.10 |
28.41 |
|
2011 |
13.20 |
0.00 |
0.00 |
3.21 |
0.00 |
3.42 |
0.00 |
3.29 |
3.71 |
2.25 |
29.08 |
| GI: Distrib; Accom & Food |
1997 |
0.03 |
0.00 |
0.00 |
0.78 |
0.00 |
5.55 |
0.00 |
2.92 |
2.66 |
1.20 |
13.15 |
|
1998 |
0.03 |
0.00 |
0.00 |
0.86 |
0.00 |
6.06 |
0.00 |
3.20 |
3.16 |
1.40 |
14.72 |
|
1999 |
0.04 |
0.00 |
0.00 |
0.98 |
0.00 |
6.59 |
0.00 |
3.52 |
3.82 |
1.72 |
16.68 |
|
2000 |
0.05 |
0.00 |
0.00 |
1.08 |
0.00 |
7.03 |
0.00 |
3.61 |
3.15 |
1.87 |
16.79 |
|
2001 |
0.09 |
0.00 |
0.00 |
1.18 |
0.00 |
7.51 |
0.00 |
3.94 |
3.77 |
2.24 |
18.73 |
|
2002 |
0.11 |
0.00 |
0.00 |
1.20 |
0.00 |
7.73 |
0.00 |
4.22 |
3.74 |
2.63 |
19.63 |
|
2003 |
0.09 |
0.00 |
0.00 |
1.32 |
0.00 |
8.02 |
0.00 |
4.58 |
4.56 |
2.62 |
21.18 |
|
2004 |
0.09 |
0.00 |
0.00 |
1.35 |
0.00 |
8.46 |
0.00 |
4.83 |
4.51 |
2.55 |
21.80 |
|
2005 |
0.08 |
0.00 |
0.00 |
1.48 |
0.00 |
8.69 |
0.00 |
5.17 |
3.92 |
2.37 |
21.70 |
|
2006 |
0.06 |
0.00 |
0.00 |
1.63 |
0.00 |
9.12 |
0.00 |
5.35 |
3.79 |
2.66 |
22.62 |
|
2007 |
0.05 |
0.00 |
0.00 |
1.83 |
0.00 |
9.63 |
0.00 |
5.79 |
4.03 |
2.74 |
24.07 |
|
2008 |
0.08 |
0.00 |
0.00 |
1.78 |
0.00 |
9.92 |
0.00 |
6.01 |
4.22 |
2.76 |
24.76 |
|
2009 |
0.12 |
0.00 |
0.00 |
1.71 |
0.00 |
9.95 |
0.00 |
5.70 |
3.72 |
2.79 |
23.98 |
|
2010 |
0.21 |
0.00 |
0.00 |
1.65 |
0.00 |
10.11 |
0.00 |
5.75 |
3.94 |
2.81 |
24.47 |
|
2011 |
0.30 |
0.00 |
0.00 |
1.71 |
0.00 |
10.61 |
0.00 |
5.58 |
4.18 |
2.88 |
25.26 |
| H: Transport & Storage |
1997 |
0.03 |
0.00 |
0.00 |
0.32 |
0.00 |
0.77 |
0.00 |
0.76 |
0.86 |
0.60 |
3.34 |
|
1998 |
0.02 |
0.00 |
0.00 |
0.34 |
0.00 |
0.83 |
0.00 |
0.82 |
0.65 |
0.68 |
3.34 |
|
1999 |
0.03 |
0.00 |
0.00 |
0.37 |
0.00 |
0.86 |
0.00 |
0.89 |
0.80 |
0.82 |
3.76 |
|
2000 |
0.03 |
0.00 |
0.00 |
0.39 |
0.00 |
0.91 |
0.00 |
0.91 |
0.66 |
0.86 |
3.76 |
|
2001 |
0.04 |
0.00 |
0.00 |
0.40 |
0.00 |
0.95 |
0.00 |
0.95 |
0.93 |
0.96 |
4.23 |
|
2002 |
0.04 |
0.00 |
0.00 |
0.41 |
0.00 |
1.02 |
0.00 |
0.97 |
0.94 |
1.05 |
4.43 |
|
2003 |
0.04 |
0.00 |
0.00 |
0.48 |
0.00 |
1.03 |
0.00 |
1.01 |
1.26 |
1.04 |
4.87 |
|
2004 |
0.03 |
0.00 |
0.00 |
0.47 |
0.00 |
1.06 |
0.00 |
1.02 |
1.17 |
1.03 |
4.77 |
|
2005 |
0.02 |
0.00 |
0.00 |
0.54 |
0.00 |
1.10 |
0.00 |
1.19 |
1.04 |
0.99 |
4.87 |
|
2006 |
0.03 |
0.00 |
0.00 |
0.58 |
0.00 |
1.14 |
0.00 |
1.21 |
1.07 |
1.12 |
5.15 |
|
2007 |
0.03 |
0.00 |
0.00 |
0.57 |
0.00 |
1.20 |
0.00 |
1.16 |
1.16 |
1.15 |
5.26 |
|
2008 |
0.04 |
0.00 |
0.00 |
0.56 |
0.00 |
1.82 |
0.00 |
1.02 |
1.13 |
1.22 |
5.79 |
|
2009 |
0.06 |
0.00 |
0.00 |
0.57 |
0.00 |
1.83 |
0.00 |
1.18 |
0.97 |
1.16 |
5.77 |
|
2010 |
0.06 |
0.00 |
0.00 |
0.64 |
0.00 |
1.85 |
0.00 |
1.14 |
1.10 |
1.22 |
6.00 |
|
2011 |
0.07 |
0.00 |
0.00 |
0.71 |
0.00 |
1.87 |
0.00 |
1.01 |
1.14 |
1.34 |
6.14 |
| J: Information & Comms |
1997 |
0.50 |
0.00 |
0.00 |
0.63 |
0.00 |
0.65 |
3.04 |
0.77 |
2.24 |
1.10 |
8.93 |
|
1998 |
0.47 |
0.00 |
0.00 |
0.75 |
0.00 |
0.79 |
3.48 |
0.89 |
2.53 |
1.32 |
10.24 |
|
1999 |
0.58 |
0.00 |
0.00 |
0.87 |
0.00 |
0.90 |
4.24 |
1.16 |
2.99 |
1.56 |
12.29 |
|
2000 |
0.69 |
0.00 |
0.00 |
0.93 |
0.00 |
0.99 |
4.34 |
1.37 |
3.57 |
1.64 |
13.52 |
|
2001 |
0.77 |
0.00 |
0.00 |
1.08 |
0.00 |
1.09 |
4.69 |
1.76 |
4.24 |
1.77 |
15.40 |
|
2002 |
0.75 |
0.00 |
0.00 |
1.30 |
0.00 |
1.14 |
4.78 |
2.42 |
4.22 |
1.88 |
16.47 |
|
2003 |
0.68 |
0.00 |
0.00 |
1.36 |
0.00 |
1.21 |
5.48 |
2.42 |
4.32 |
1.96 |
17.42 |
|
2004 |
0.66 |
0.00 |
0.00 |
1.40 |
0.00 |
1.27 |
6.62 |
2.29 |
4.85 |
1.96 |
19.06 |
|
2005 |
1.19 |
0.00 |
0.00 |
1.39 |
0.00 |
1.28 |
6.32 |
2.35 |
4.66 |
2.03 |
19.22 |
|
2006 |
1.35 |
0.00 |
0.00 |
1.46 |
0.00 |
1.30 |
4.66 |
2.44 |
4.78 |
2.13 |
18.12 |
|
2007 |
1.55 |
0.00 |
0.00 |
1.53 |
0.00 |
1.47 |
5.08 |
2.35 |
5.01 |
2.23 |
19.22 |
|
2008 |
1.42 |
0.00 |
0.00 |
1.64 |
0.00 |
1.51 |
5.14 |
2.56 |
5.10 |
2.28 |
19.65 |
|
2009 |
1.35 |
0.00 |
0.00 |
1.57 |
0.00 |
1.45 |
4.99 |
2.33 |
4.45 |
2.26 |
18.40 |
|
2010 |
1.17 |
0.00 |
0.00 |
1.59 |
0.00 |
1.49 |
5.14 |
2.37 |
4.70 |
2.31 |
18.76 |
|
2011 |
1.08 |
0.00 |
0.00 |
1.46 |
0.00 |
1.58 |
5.25 |
2.02 |
4.71 |
2.25 |
18.36 |
| K: Finance |
1997 |
0.02 |
0.00 |
0.44 |
1.56 |
0.00 |
0.71 |
0.00 |
2.64 |
1.69 |
1.00 |
8.06 |
|
1998 |
0.03 |
0.00 |
0.48 |
1.78 |
0.00 |
0.75 |
0.00 |
3.04 |
1.87 |
1.23 |
9.18 |
|
1999 |
0.04 |
0.00 |
0.48 |
1.83 |
0.00 |
0.80 |
0.00 |
3.57 |
2.00 |
1.47 |
10.17 |
|
2000 |
0.04 |
0.00 |
0.67 |
1.97 |
0.00 |
0.90 |
0.00 |
3.88 |
2.33 |
1.58 |
11.36 |
|
2001 |
0.04 |
0.00 |
0.65 |
2.13 |
0.00 |
0.94 |
0.00 |
4.29 |
2.77 |
1.84 |
12.66 |
|
2002 |
0.03 |
0.00 |
0.71 |
2.37 |
0.00 |
0.95 |
0.00 |
4.81 |
2.88 |
2.11 |
13.88 |
|
2003 |
0.03 |
0.00 |
0.67 |
2.48 |
0.00 |
1.02 |
0.00 |
5.33 |
3.18 |
1.99 |
14.70 |
|
2004 |
0.02 |
0.00 |
0.68 |
2.62 |
0.00 |
1.13 |
0.00 |
4.83 |
2.98 |
1.91 |
14.16 |
|
2005 |
0.02 |
0.00 |
0.86 |
3.15 |
0.00 |
1.24 |
0.00 |
5.54 |
3.03 |
1.88 |
15.71 |
|
2006 |
0.01 |
0.00 |
0.90 |
3.34 |
0.00 |
1.41 |
0.00 |
5.50 |
2.74 |
2.15 |
16.06 |
|
2007 |
0.01 |
0.00 |
1.23 |
3.77 |
0.00 |
1.49 |
0.00 |
5.69 |
3.24 |
2.29 |
17.72 |
|
2008 |
0.03 |
0.00 |
1.21 |
3.94 |
0.00 |
0.84 |
0.00 |
5.86 |
3.49 |
2.38 |
17.75 |
|
2009 |
0.04 |
0.00 |
1.46 |
3.81 |
0.00 |
0.93 |
0.00 |
5.54 |
3.00 |
2.36 |
17.14 |
|
2010 |
0.04 |
0.00 |
1.58 |
3.83 |
0.00 |
0.96 |
0.00 |
5.97 |
3.44 |
2.36 |
18.18 |
|
2011 |
0.05 |
0.00 |
1.84 |
3.78 |
0.00 |
0.92 |
0.00 |
5.76 |
3.74 |
2.52 |
18.61 |
| MN: Prof Serv; Admin Serv |
1997 |
0.19 |
0.00 |
0.00 |
1.02 |
0.33 |
4.53 |
0.00 |
2.06 |
1.72 |
0.45 |
10.30 |
|
1998 |
0.21 |
0.00 |
0.00 |
1.13 |
0.32 |
5.15 |
0.00 |
2.24 |
2.05 |
0.56 |
11.65 |
|
1999 |
0.26 |
0.00 |
0.00 |
1.14 |
0.44 |
5.67 |
0.00 |
2.70 |
2.38 |
0.65 |
13.23 |
|
2000 |
0.20 |
0.00 |
0.00 |
1.19 |
0.40 |
6.24 |
0.00 |
2.94 |
2.44 |
0.69 |
14.11 |
|
2001 |
0.35 |
0.00 |
0.00 |
1.35 |
0.29 |
6.90 |
0.00 |
3.53 |
3.22 |
0.82 |
16.46 |
|
2002 |
0.42 |
0.00 |
0.00 |
1.18 |
0.38 |
7.18 |
0.00 |
3.41 |
3.35 |
0.88 |
16.80 |
|
2003 |
0.38 |
0.00 |
0.00 |
1.24 |
0.38 |
7.60 |
0.00 |
3.69 |
3.81 |
0.86 |
17.95 |
|
2004 |
0.39 |
0.00 |
0.00 |
1.32 |
0.35 |
7.79 |
0.00 |
3.77 |
3.64 |
0.83 |
18.09 |
|
2005 |
0.48 |
0.00 |
0.00 |
1.43 |
0.35 |
8.17 |
0.00 |
4.54 |
3.54 |
0.78 |
19.28 |
|
2006 |
0.43 |
0.00 |
0.00 |
1.41 |
0.31 |
8.53 |
0.00 |
4.66 |
3.27 |
0.86 |
19.48 |
|
2007 |
0.53 |
0.00 |
0.00 |
1.61 |
0.56 |
8.95 |
0.00 |
4.61 |
3.70 |
0.87 |
20.83 |
|
2008 |
0.55 |
0.00 |
0.00 |
1.72 |
0.74 |
8.33 |
0.00 |
4.88 |
3.81 |
0.89 |
20.93 |
|
2009 |
0.64 |
0.00 |
0.00 |
1.66 |
0.78 |
8.44 |
0.00 |
4.80 |
3.52 |
0.84 |
20.67 |
|
2010 |
0.65 |
0.00 |
0.00 |
1.65 |
0.87 |
8.47 |
0.00 |
4.79 |
3.82 |
0.83 |
21.07 |
|
2011 |
0.64 |
0.00 |
0.00 |
1.74 |
0.85 |
8.93 |
0.00 |
5.02 |
3.94 |
0.93 |
22.05 |
| RST: Arts & Ent; Other |
1997 |
0.01 |
0.00 |
0.00 |
0.19 |
0.00 |
1.18 |
0.32 |
0.24 |
0.48 |
0.29 |
2.70 |
|
1998 |
0.01 |
0.00 |
0.00 |
0.23 |
0.00 |
1.28 |
0.34 |
0.27 |
0.57 |
0.32 |
3.02 |
|
1999 |
0.01 |
0.00 |
0.00 |
0.27 |
0.00 |
1.36 |
0.52 |
0.36 |
0.63 |
0.37 |
3.52 |
|
2000 |
0.01 |
0.00 |
0.00 |
0.28 |
0.00 |
1.45 |
0.59 |
0.39 |
0.61 |
0.37 |
3.69 |
|
2001 |
0.01 |
0.00 |
0.00 |
0.29 |
0.00 |
1.53 |
0.44 |
0.39 |
0.96 |
0.42 |
4.04 |
|
2002 |
0.01 |
0.00 |
0.00 |
0.29 |
0.00 |
1.63 |
0.45 |
0.39 |
1.00 |
0.51 |
4.29 |
|
2003 |
0.01 |
0.00 |
0.00 |
0.31 |
0.00 |
1.75 |
0.58 |
0.45 |
0.98 |
0.52 |
4.61 |
|
2004 |
0.01 |
0.00 |
0.00 |
0.31 |
0.00 |
1.83 |
0.78 |
0.49 |
0.98 |
0.49 |
4.88 |
|
2005 |
0.01 |
0.00 |
0.00 |
0.33 |
0.00 |
1.93 |
0.66 |
0.60 |
0.89 |
0.50 |
4.91 |
|
2006 |
0.00 |
0.00 |
0.00 |
0.43 |
0.00 |
2.04 |
0.56 |
0.67 |
1.01 |
0.57 |
5.28 |
|
2007 |
0.01 |
0.00 |
0.00 |
0.40 |
0.00 |
2.09 |
0.58 |
0.57 |
0.96 |
0.57 |
5.18 |
|
2008 |
0.01 |
0.00 |
0.00 |
0.36 |
0.00 |
2.46 |
0.60 |
0.59 |
0.97 |
0.60 |
5.58 |
|
2009 |
0.02 |
0.00 |
0.00 |
0.38 |
0.00 |
2.44 |
0.57 |
0.63 |
0.92 |
0.55 |
5.51 |
|
2010 |
0.02 |
0.00 |
0.00 |
0.38 |
0.00 |
2.60 |
0.58 |
0.61 |
1.03 |
0.53 |
5.74 |
|
2011 |
0.02 |
0.00 |
0.00 |
0.44 |
0.00 |
2.72 |
0.59 |
0.76 |
1.03 |
0.52 |
6.07 |
Appendix 2: Revisions: comparison with previously published estimates
This appendix outlines revisions to our estimates of intangible investment and also official measures of tangible investment. Our most recent past publication of intangible investment was Goodridge, Haskel and Wallis (GHW, 2012).
A2.1 Revisions to measures of intangible investment
One difference between the estimates of investment published in this report and those in GHW (2012) is the industrial classification at which they are published. Previous estimates we constructed according to a market sector definition based on SIC03, sections A-K & OP. New estimates are constructed for the market sector but based on SIC07, sections A-K, MN & RST.
Our new estimates for intangible investment extend to 2011 and include revisions in the back-series. A comparison with past estimates is presented in Figure A2.1 below.
Figure A2.1.1: Nominal UK market sector intangible investment, old and new estimates (£bns)
A line graph showing nominal UK market sector intangible investment in £bns from 1990 to 2010, comparing "Intangible investment (new)" with "Intangible investment (GHW, 2012)". Both lines show a strong upward trend, with the "new" estimates generally higher than the "GHW, 2012" estimates, especially in the later years, reaching over £140bn by 2010.
Source: This report and GHW (2012)
As can be seen there has been a small upward revision to estimates of intangible investment. This revision is due to the following changes. Estimates for investment in Market Research have been revised upward due to changes in the product classification of the Supply Use tables as a result of the revisions to the SIC. In past estimates, the product category used was “Market research, management consultancy" and market research was separated out using information from the ABS and ABI. The new product category is ‘Advertising and market research services'. Therefore management consultancy no longer has to be subtracted and the resulting estimates for market research are higher than those previously published. Estimates for investment in training are also higher than previously published. Past estimates were adjusted downward using estimates of the component of training that is Health and Safety and/or Induction training. Since some of this training likely does contribute to growth in productivity, such an adjustment has not been made to the estimates included in this report. In this report, estimates for investment in Artistic Originals are taken from the national accounts. In GHW (2012) we used our own estimates for investment in this asset category. The national accounts estimates are slightly higher than those we used in previous reports. National accounts estimates for investment in own-account and purchased software have also been revised up, in the case of own-account to better account for net operating surplus in own-account software production.
A2.2 Revisions to official ONS measures of investment
In the main text we noted that the estimates for nominal tangible investment presented in this report are lower than those we have presented previously (Goodridge, Haskel and Wallis 2012). This is due to ONS revisions. In summary, overall investment as recorded in the national accounts is similar to that previously published. However, within that, tangible investment has been revised down and intangible (software, artistic originals and mineral exploration) investment has been revised up. Below we present some charts of the new nominal investment data compared to those we published in Goodridge, Haskel and Wallis (2012).
First we show new data for market sector (private sector and public corporations) investment in buildings. There has been some downward revision to investment in buildings in the late 1990s and early 2000s. Overall however the series are similar and the new data still show a strong rise over much of the 2000s.
Figure A2.2.1: Nominal UK market sector investment in buildings, old and new estimates (£bns)
A line graph comparing "Buildings (GHW 2012)" and "Buildings (New ONS)" investment in nominal £bns from 1970 to 2012. Both lines show similar trends, rising to peaks around the 1990s and 2000s, with "New ONS" estimates generally slightly lower than "GHW 2012" in the late 1990s and early 2000s, but still showing a strong rise over much of the 2000s, reaching close to £50bn by 2012.
Next we look at the data for plant & machinery which includes ICT hardware. The chart shows that revisions to investment in this category have been significant. In 2001, estimates of investment have been revised down from £55bn to £37bn, a reduction of approximately one third. Although the new series is fairly volatile, estimates of investment in 2012 are similar to the level seen in 2001 (£40bn in 2012 compared to £37bn in 2001).
Figure A2.2.2: Nominal UK market sector investment in plant (incl. ICT hardware), old and new estimates (£bns)
A line graph comparing "Plant (incl. ICT hardware) (GHW 2012)" and "Plant (incl. ICT hardware) (New ONS)" investment in nominal £bns from 1970 to 2012. The "New ONS" estimates are significantly lower than "GHW 2012" in the 2000s, showing a downward revision. Both lines exhibit volatility.
The next chart shows old and new data for investment in vehicles. Again there have been downward revisions. Investment has been revised down by approximately £3bn in 1999 and 2000, and by around £5bn in 2007. The latter is a downward revision of approximately 50% (£15bn to £10bn).
Figure A2.2.3: Nominal UK market sector investment in vehicles, old and new estimates (£bns)
A line graph comparing "Vehicles (GHW 2012)" and "Vehicles (New ONS)" investment in nominal £bns from 1970 to 2012. The "New ONS" estimates show downward revisions compared to "GHW 2012", particularly in the late 1990s and 2000s, with a notable drop around 2007. Both lines show fluctuations.
Having looked at the revisions to each asset category, the next chart plots the new series for investment in each category, plus official estimates of investment in intangibles. The chart shows that growth in nominal investment since 2000s is driven by buildings and intangibles. Vehicles is relatively flat and similarly plant is at a similar level in 2012 to the level seen in 2000 (although there was a rise and then a fall in the mid-2000s in this asset category).
Figure A2.2.3: Nominal UK market sector investment, by asset, new estimates (£bns)
A multi-line graph showing nominal UK market sector investment in £bns from 1990 to 2012 for four asset categories: "Buildings", "Plant", "Vehicles", and "Intangibles". The "Buildings" and "Intangibles" lines show significant growth, with intangibles generally having the highest investment. "Plant" shows some fluctuation but ends near its 2000 level. "Vehicles" remains relatively flat and at the lowest investment level among the assets.




