Nesta Working Paper No. 13/03
The Impact of Direct Support to R&D and Innovation in Firms
Paul Cunningham
Abdullah Gök
Philippe Laredo
MIOIR
Nesta Working Paper 13/03
January 2013
www.nesta.org.uk/wp13-03
Abstract
This paper is part of the Compendium of Evidence on the Effectiveness of Innovation Policy Intervention. It examines the evidence on schemes that aim to promote or enhance the performance of R&D activities within companies. More specifically, in order to avoid overlaps with other reports in this series, coverage is restricted to supply-side measures which provide finance, specifically in the form of grants or loans, to support R&D undertaken by firms alone. Overall, the available evidence on the operation of direct measures seems to focus on a number of outcomes and effects, including rationales, user characteristics, governance aspects, input additionality, output additionality and behavioural additionality effects. This set of outcomes and effects is used to structure the analysis of the evidence. The report notes that the impact of policy intervention exhibits a skewed distribution - the 'average' success of a programme tends to be based on a small number of successful cases which is accompanied by a long 'tail' of less or non-successful cases, and that most of the studies reviewed consider one point in time and do not examine the longer time frame, thus the persistence of effects arising from the policy interventions was not generally measured. Two further main findings are that much of the academic literature focuses on the issues of input and, to a lesser extent, output additionality, whereas policy evaluations tend to focus on the continued relevance of the rationale of intervention and on its implementation performance. The report concludes with a number of key lessons for policy makers.
JEL Classification: O38
Keywords: Impact, Innovation policies, direct support, innovation support, R&D support, direct measures
The Compendium of Evidence on the Effectiveness of Innovation Policy Intervention Project is led by the Manchester Institute of Innovation Research (MIoIR), University of Manchester, and funded by Nesta, an independent charity with the mission to make the UK more innovative. The compendium is organised around 20 innovation policy topics categorised primarily according to their policy objectives. Currently, some of these reports are available. All reports are available at http://www.innovation-policy.org.uk. Also at this location is an online strategic intelligence tool with an extensive list of references that present evidence for the effectiveness of each particular innovation policy objective. Summaries and download links are provided for key references. These can also be reached by clicking in the references in this document. Author: Dr Paul Cunningham, MIOIR, Harold Hankins Building, Manchester Business School, University of Manchester, M13 9PL, [email protected]
The Nesta Working Paper Series is intended to make available early results of research undertaken or supported by Nesta and its partners in order to elicit comments and suggestions for revisions and to encourage discussion and further debate prior to publication (ISSN 2050-9820). © 2013 by the author(s). Short sections of text, tables and figures may be reproduced without explicit permission provided that full credit is given to the source. The views expressed in this working paper are those of the author(s) and do not necessarily represent those of Nesta.
This report is part of the Compendium of Evidence on the Effectiveness of Innovation Policy Intervention Project led by the Manchester Institute of Innovation Research (MIoIR), University of Manchester. The project is funded by the National Endowment for Science, Technology and the Arts (NESTA) - an independent body with the mission to make the UK more innovative.
The compendium is organised around 20 innovation policy topics categorised primarily according to their policy objectives. Currently, some of these reports are available.
 All reports are available at http://www.innovation-policy.org.uk. Also at this location is an online strategic intelligence tool with an extensive list of references that present evidence for the effectiveness of each particular innovation policy objective. Summaries and download links are provided for key references. These can also be reached by clicking in the references in this document.
- Figure 1: Direct government funding of business R&D, as % of total BERD, 2000 and 2008
List of Tables
- Table 1: Direct RDI support measures - typical intervention logic
- Table 2: Meta-evaluation by García-Quevedo (2004)
- Table 3: Evidence on Behavioural Additionality of Direct Measures in OECD (2006)
- Table 4: Summary of the Evidence on Input Additionality
- Table 5: Summary of the Evidence on Output Additionality
- Table 6: Summary of the Evidence on Behavioural Additionality
Executive Summary
The direct support of R&D within companies has a comparatively long history, dating from the efforts made by governments, particularly in the immediate post-Second World War period, for the support of industry programmes deemed to be of national importance and developing into a series of large-scale manufacturing support programmes which reached a peak in the 1970s. Since this time, there has been a shift away from the direct support of single R&D projects within large individual firms, towards a focus on direct support to SMEs, or by the creation of a more generic innovation friendly environment through the provision of tax credits, for example, or by facilitating access to credit in less direct ways. At the same time, the 'grand programmes' have been replaced by programmes targeting mission oriented objectives, included the so-called 'grand' or 'societal challenges' which engage a broader range of innovation actors from the private and public sectors. In the face of economic constraints arising from the credit liquidity crisis of 2008, the rationale for direct support initiatives can also be provided by a desire to maintain business R&D activity (for example, within specific industry sectors or economically disadvantaged regions) or to more generally mitigate the adverse financial climate within which firms currently operate.
This report focuses on the evidence of the effectiveness of publicly supported schemes that aim to promote or enhance the performance of R&D activities within companies. More specifically, in order to avoid overlaps with other reports in this series, coverage is restricted to supply-side measures which provide finance, specifically in the form of grants or loans, to support R&D undertaken by firms alone. This excludes demand-side measures which form the subject of another report in this series. Similarly, support for collaboration with other firms, in the form of networks, or with knowledge providers such as universities and public research organisations are also dealt with in separate reports.
The rationale for the provision of direct support for R&D is founded on the assumption that R&D conducted within firms will, directly or indirectly stimulate innovation that leads to the production of new marketable products, processes or services. This view is strongly based on the linear model of innovation, thus explaining the long history of this type of measure, which ultimately derives from the traditional notion of public industrial policy. Direct measures satisfy the classical economic rationale for public intervention, being linked to the capacity of firms to appropriate investments made and the relative importance of spillovers associated with their R&D efforts, i.e. in an effort to compensate for firms' propensity to under invest. The shift towards a focus on SMEs has been supported by arguments over the comparative efficiency of financing R&D activities in smaller companies, which offers access to an increased range of clients although there are counter-arguments over the relative size of spillovers that can be gained from the support of larger firms. One of the key benefits of direct measures to support R&D as a policy instrument is that they may be targeted at specific areas where government intervention may make a difference (i.e. of economic significance, or of regional, national or supra-national policy concern); on the other hand, they are less effective at dealing with broad policy concerns (such as a lack of industry R&D investment) where instruments such as fiscal incentives may be more appropriate.
Overall, despite their relative simplicity in comparison with other innovation support schemes, the evaluation of direct measures also exhibits a number of particular problems. First is the timing and periodicity of evaluations, with the desired effects of the measure arising at a variable speed from its implementation. Thus, uptake and management issues will manifest themselves rapidly, while, at the other extreme, months or years may elapse until prototypes have been generated or new products, processes or service introduced to the market. Similarly, organisational and behavioural changes will take time to generate and become embedded, whilst the sustainability of these and other desired effects will require even longer time frames. Many of the anticipated impacts of direct support measures are readily measurable: R&D expenditure, growth, profitability and employment, for example, all lend themselves to the construction of quantitative indicators which are generally easily obtained. However, information on less tangible outcomes such as skills, innovation capabilities and capacities, and spillover effects, etc. is less easily captured in the form of comparable statistics. Next, in common with many other types of policy intervention, it is difficult to identify the types of outcome and impact that arise from the direct support of R&D in the absence of counterfactual examples or benchmarks established prior to the establishment of the funding. Finally, the direct outcomes of public support may be difficult to distinguish from other forms of support, particularly as the size of the target firm increases.
Overall, the available evidence on the operation of direct measures seems to focus on a number of outcomes and effects, including rationales, user characteristics, governance aspects, input additionality, output additionality and behavioural additionality effects. This set of outcomes and effects was used to structure the analysis of the evidence.
The final section of this report offers a series of general lessons and conclusions based on the evidence reviewed, both from the academic and policy literature. Our first observation concerns the overall finding within both the theoretical literature and from the evaluation of other policy areas that the impact of policy intervention exhibits a skewed distribution – the 'average' success of a programme tends to be based on a small number of successful cases which is accompanied by a long 'tail' of less or non-successful cases. However, only a limited number of academic studies touch upon this issue. Secondly, most of the studies reviewed considered one point in time and did not examine the longer time frame, thus the persistence of effects arising from the policy interventions was not generally measured (although this forms a critical element for the assessment of behavioural additionality).
Turning to the report's conclusions, the first is that the issue of input additionality and, to a lesser extent, output additionality, form the cornerstone of most of the academic work on the subject of direct support for R&D. Here, crowding-out effects are more often found in firm level studies rather than at studies focused at the industry/country level. Various academic studies have tried to explain these results, noting that government and privately financed R&D are complementary up to a 10% subsidisation rate, while above 20% they fully substitute. Other influential factors include industry type, firm size and the wider economic context. Lastly, the 'halo-effect' can be significant – companies that have been successful in attracting support in the past tend to be more successful in the current programme.
In contrast, it appears that policy evaluations tend to focus on the continued relevance of the rationale of intervention and on its implementation performance. From the evaluation perspective, it is interesting that despite the longevity of this type of intervention there is still a policy imperative to seek assurance that the underpinning rationale is still being met.
Most evaluations seem to point towards evidence that the projects being supported would not have gone ahead or would have been slower, with less depth, or less technical sophistication than if the support had not been available. This finding was more convincing for younger and or smaller firms.
It is also clear that the implementation process (especially the means by which successful applicants are selected) is critical to the eventual success of the programme overall. In this respect, the most successful firms (i.e. those demonstrating the greatest benefits from the scheme) tend to be those with prior experience in performing R&D and those which have been previous recipients of government support. Accordingly, the recommendations for programme management that arise from evaluations tend to be aimed at encouraging programme managers to adopt a more pro-active interaction with potential applicants (through the provision of advice at the proposal stage, or by offering complementary services, including marketing support and training).
The evaluations in this particular study share a common feature with those of many other schemes in that there are strong calls for less bureaucracy and greater administrative simplification, while at the same time the evaluators would often like to see a greater amount of monitoring (in order to simplify their tasks and reduce the need for basic data/information gathering).
A further key point is that complementarity greatly contributes to the overall success of the measures examined, although this is based on the findings of a small number of studies. Nevertheless, all the relevant evaluations point towards a far greater level of success for firms (particularly small firms) in measures that combine direct and indirect support. In this case, direct support appears to drive higher levels of technological development and the use of more advanced technologies, while the indirect support (such as advisory services and coaching/training) covers other aspects of the development process.
In summary, the key lessons for policy makers to emerge from the analysis concern:
- The need for a better targeting of measures (in order to optimise the chances of recipients demonstrating a successful outcome) although this raises the question of how to avoid picking winners (and, indeed, if this should be avoided?)
- The optimization of the benefits that can be derived when direct measures are delivered alongside or as part of a complementary set of services and further support.
- However, it is also clear that simply encouraging firms to undertake (invest in) more R&D is not enough and evaluations should focus to a greater extent on output and behavioural additionality effects, such as the delivery of products, services, jobs, and other lasting and persistent effects). On these issues, the available evaluation evidence is scarcer and more mixed in its conclusions.
1. Introduction
The use of direct measures for the stimulation of R&D probably has the longest pedigree within the policy maker's tool box of available instruments. Certainly, from an historical perspective, the array of schemes in use has been one of the most extensive when compared to other forms of R&D support and the promotion of innovation. Originating in the large sectoral programmes derived from the defence industry after the Second World War, this form of support saw its 'golden years' in the range of manufacturing support programmes in place during the 1970s. These were complemented and then superseded by what have been called 'technological programmes' based on collaborative research (Callon et al., 1997). At the same time, the generic programmes were focused on SMEs, and progressively complemented by tax credits that were thought simpler to implement and a less ‘risky' form of support for government. The latter have taken greater prominence in the 2000s and today represent the major source of the allocation of public funds to private small firms in OECD countries.
In addition, in recent years, there have been a number of shifts in terms of the objectives of support schemes (i.e. towards the promotion of science-industry collaboration and, more latterly, the mobilisation of finance) which reflect an increasing sophistication in the goals of innovation support. Similarly, direct support to companies has also become more elaborate, with an increase in (or, more accurately, a resurgence of) focus on thematic or sectoral goals in an effort to build capacity or to seek specific solutions (such as those associated with Grand Challenges) (Cunningham et al., 2008).
However, this report has a somewhat narrower focus and uses the classification offered by European Commission (2003)); it thus restricts its coverage to supply-side measures which provide finance, specifically in the form of grants or loans, to support R&D undertaken by firms alone (our emphasis). An analysis of demand-side measures (the other 'arm' of the classification given by European Commission (2003) which can involve the provision of similar streams of finance for the procurement of R&D forms the subject of another report in this series. Similarly, support for collaboration with other firms, in the form of networks, or with knowledge providers such as universities and public research organisations are also dealt with in separate reports.
Given the prevailing economic situation that has followed the credit liquidity crisis of 2008, the rationale for current direct support initiatives may also be stimulated by a desire to maintain business R&D activity (for example, within specific industry sectors or economically disadvantaged regions) or to more generally mitigate the adverse financial climate within which firms currently operate.
This report, one of a series produced under the NESTA Compendium of Evidence on the Effectiveness of Innovation Policy Intervention, will first focus on setting the broad conceptual background for direct measures of innovation policy support to firms, the rationale for their deployment and the main types of approach adopted. This will be followed by an overview of the available literature, both in the form of evaluation reports and in secondary academic and grey literature which explicitly present or reflect on the types of direct support and on the evidence for its impact on innovation. Next, we will organise the available evidence according to
2. Conceptual Background
the nature of the impacts that have been documented and the metrics (and their associated methodologies) that have been used to analyse such impacts. Finally, the report will present the main lessons learned, for example in terms of the main types of impact identified, the effect of contextual conditions on policy implementation (including interactions with other forms of innovation support) and the implications for evaluation methodologies.
Direct measures for the support of innovation are predicated on the assumption that R&D conducted within firms will, directly or indirectly stimulate innovation that leads to the production of new marketable products, processes or services. In short, it is strongly based on the linear model of innovation, a fact that explains the long history of this type of measure. Indeed, such support for industrial R&D predates the emergence of the notion of innovation and originally formed the mainstay of public industrial policies. Moreover, public support for R&D has a major impact on driving the quality and quantity of R&D overall.
2.1 Rationale
The classical economic rationale for public intervention is linked to the capacity of firms to appropriate investments made or, in other words, the relative importance of spillovers associated with their research and development efforts. These factors lead firms towards an underinvestment, which, at the macro level results in a sub-optimal equilibrium. Thus, the objective of the public intervention is to compensate for these effects and to encourage or incentivise firms to invest to a greater extent than they would do if there were no public support.
This explains the long-standing existence of public intervention: first and foremost to protect inventors (Rigby and Ramlogan, 2012) then to support the development of technologies that are shared within an industry (for example, the industrial research centres in Germany or the French centres techniques after the second world war); and, increasingly, through the development of programmes dedicated to support the R&D efforts of firms and/or the adoption of new technologies by firms.
According to the way in which they deliver financial support to their target audience, these programmes can be described as 'indirect' (typically through the use of fiscal policies, see Köhler et al. (2012)) or 'direct'. The latter are the focus of this report. Over time, they have tended to be focused to a greater extent on SMEs, arguably the only net creators of manufacturing jobs within the OECD countries over the last 20 years, and there are also arguments that limited government subsidies can have a proportionately greater effect (and certainly reach a much larger audience potentially increasing the likelihood of successful intervention) if allocated to smaller companies rather than larger companies who have a more diverse portfolio of R&D interests and greater resources with which to support these.
The reasoning conveyed by this approach is as follows: an increase in R&D will, in a significant number of cases (R&D, being a risky activity, cannot always be successful), drive the development of new products, lead to new market sales and create new employment opportunities within the individual firms supported. At the macroeconomic level, these effects can, however, be restricted or levelled off by the losses incurred by the loss of market share suffered by other, national, competing firms.
Therefore, in order to justify such public support, historically, two complementary rationales have been put forward. The first is associated with the competitive edge of firms engaged in international markets (where there is an imperative to increase exports and thus increase activities and jobs). The other is linked with 'catching-up', that is taking positions in the home market that were previously occupied by foreign firms (for instance, see List (1841) and later Furtado (1964)) on protecting 'infant industries' and more recent arguments by Mazzoleni and Nelson (2007)). With the rapid globalisation movement in manufacturing, the importance of this latter argument is re-emerging in a number of OECD countries.
This line of reasoning, as in the case for tax credits, also explains why evaluations tend to focus on input additionality as a core measure of success at the micro-level, and on employment (and, sometimes, on exports) generated at the macro-level, as our analysis of the evidence supports.
Though central, this argument is insufficient to cover the spectrum of rationales for the direct government support of firm innovation activities. Following Bozeman and Dietz (2001)), we should also consider: (a) a broader understanding of the 'market failure paradigm' and (b) consider two further paradigms; the cooperation paradigm and the mission paradigm.
A broader understanding of the concept of 'market failure' drives us to a consideration of two key additions focused on firm capabilities. One of these deals with sectors where firms are too small to innovate: this was exemplified at the turn of the 20th century in the agriculture sector with the creation of extension services. A more recent and broader addition considers small firms in general and the need for them to integrate development and innovation into their normal activities. Behavioural change then becomes a central consideration and translates as changes in their organisation and production routines.
The 'cooperation paradigm' takes into account the effective conditions under which firms can innovate, and the role of other actors, whether these are suppliers of intermediate goods or knowledge, users or financiers. The OECD classifies this type of feature as "incomplete markets" (OECD, 2011); these are addressed by other reports within this compendium.
The 'mission paradigm' deals with the innovations that are needed for producing and delivering 'public' or 'collective' goods, such as defence and security, communication infrastructures, health, environmental protection or the amelioration of climate change, to name but a few. Historically, the dominant public sector answer to the problem of R&D needs has been to create so-called mission oriented public research organisations. In a few cases, regulatory mechanisms have been introduced in order to provide for new product development (the archetypal example being drug development). However, the trend towards deregulation and privatisation has radically changed the landscape over the last decades.
Most operators of 'public' or 'collective' goods are now large multinational private actors, whose individual size should guarantee an effective ability to innovate. However, these activities are typically characterised by very long developmental time frames (often more than a decade for any new development) and, as the defence sector has shown, firms seldom consider such time-frames. Instead, they prefer to remain focused on incremental innovation; consequently they face difficulties when needing to address new challenges or to take advantage of emerging breakthrough technologies. This has prompted the emergence of (public) programmes focused on "grand societal challenges”, that is, societal problems that require breakthrough innovations both in products and services, and in redefining needs and practices. Mostly, these programmes require a coordinated effort by multiple actors (see Cunningham and Ramlogan (2012)), but in quite a number of cases, public entities either directly procure the R&D (see Edler and Rigby (2012)) or develop programmes that directly address firms (especially in the areas of energy consumption, environmental preservation or pollution abatement).
As noted, the focus of this report is on direct measures, that is, support based upon the projects proposed by individual firms and selected through a programme management process. Despite its extensive track record, direct government funding has been under discussion for some time, many analysts considering that indirect measures (and in particular fiscal measures) are both less costly in terms of intermediation costs and less prone to government failure (defined as the non-optimal selection of recipients or allocation of funds). However OECD calculations (see Figure 1) highlight that direct measures retain their importance in six countries where they represent at least 6% of the total Business R&D of the country,
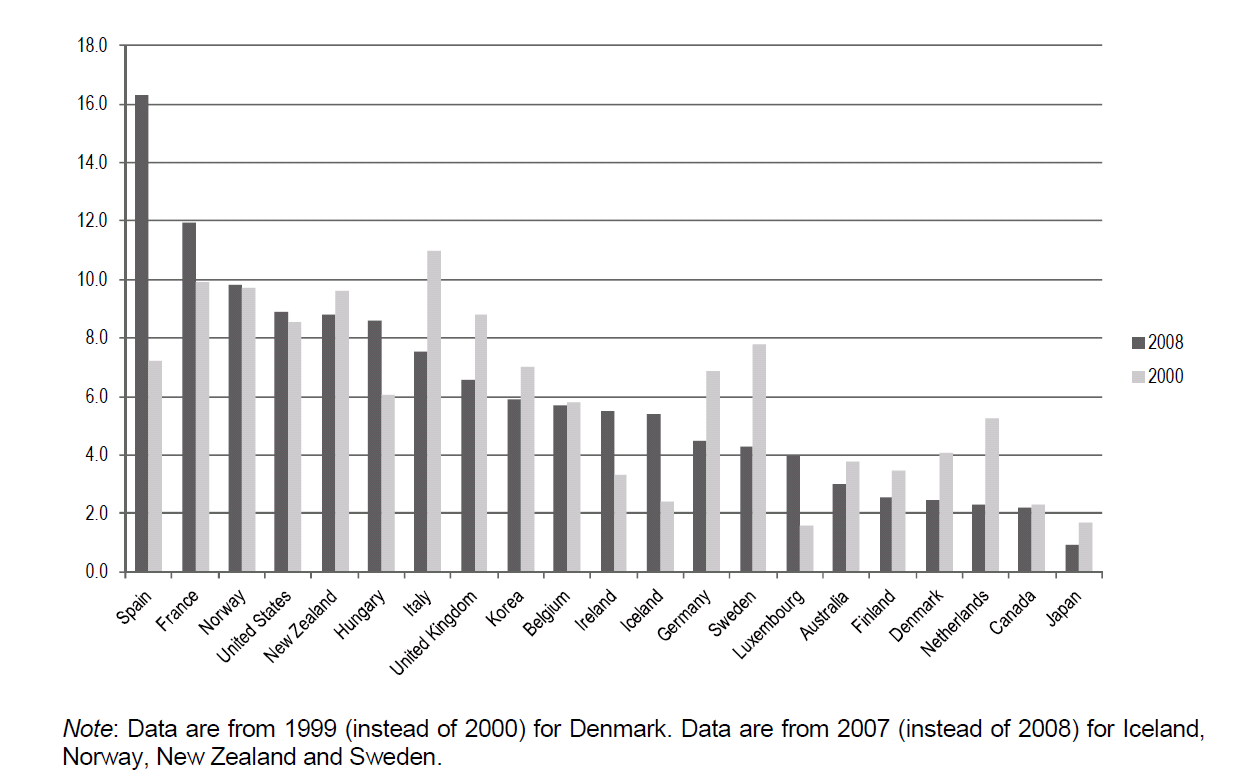
Note: Data are from 1999 (instead of 2000) for Denmark. Data are from 2007 (instead of 2008) for Iceland, Norway, New Zealand and Sweden.
2.2 Implementation: designing direct measures
When considering design criteria, three elements differentiate programmes
- their target
- the selection mechanism
- the duration and operation of the programmes
2.2.1 Programme targets
There has been a high level of variation in the targets addressed by direct measures. Historically speaking, some programmes have addressed all manufacturing firms, whatever the industry and size (for example, the 'aide à l'innovation' in France in the 1970s). However, from the 1980s, there has been a general movement to consider only 'smaller firms", the definition of size depending upon countries: below 50 employees, below 250 or in some cases, including 'mid-size' firms (up to 2,000 employees).
In addition, for a long time, programmes tended to consider only legal entities, whereas now most only support 'independent firms' (that is, firms that are not controlled by a large corporation). In some cases the spectrum has been widened to engineering and other "knowledge intensive business services” (KIBS). Half of the examples provided by a review of business innovation support policies by the OECD (2011)) correspond to this category; for example, the Danish national advanced technology foundation, the Dutch innovation credit scheme, the Foundation for Finnish inventions, the “British matched grant funds or the English Innovation, Research and Development grants" [sic]. One can add to these the French agency OSEO with its scheme to support innovation projects, which has been running for over 40 years.
Similarly there is a long tradition of supporting the development and innovation capabilities of firms in 'strategic' sectors. The "large technology programmes” were a common feature of OECD countries in the 1960s and 1970s, in particular for so-called 'secteurs de pointe' (aerospace, nuclear, telecommunications and the computer industry). However, these have been ended or have been "Europeanised" (i.e. transformed into collaborative programmes through EUREKA or the EU Information Society programmes) or have become marginal in the country policy landscape. Nevertheless, they have undergone something of a revival since the beginning of the last decade, as a new form of industrial policy targeting 'strategic aims' (as exemplified by the programmes of the UK Technology Strategy Board) and for addressing 'societal goals', for example, the 'green car programme' in Australia.
2.2.2 Selection mechanisms
The OECD (2011: 32-33) review underlines the importance of the selection of projects in design features. Selection is considered to be a core dimension for the overall efficiency of the programme. Two central mechanisms are used: the first is based on a permanent call associated with a 'professional evaluation' (for example, in the case of the French OSEO, three expert reviews are conducted into the technological aspects, the commercial aspects and of the financial aspects, and a final decision is made by the management of the programme). In most cases, firms receive clear answers and commitments within three months. The second mechanism is to have periodic calls (with fixed deadlines) combined with the use of an external review panel that operates a ranking of proposals and with a final selection done by the programme directorate and/or its 'strategic committee'. There have been numerous debates
2.2.3 Duration and operational structures
concerning the latter process, highlighting the risk of picking winners and alternate mechanisms have been considered, such as various auction procedures (see Giebe et al. (2006)) for a review).
Most generic programmes for the support of SMEs have no fixed duration; they are generally associated with the establishment of an autonomous professional dedicated body in charge of managing the programme: for example, the National Advanced Technology foundation in Denmark, or the foundation for Finnish inventions in Finland. Some of these agencies, like TEKES in Finland and OSEO in France are multi-purpose, managing this generic programme alongside a number of other mechanisms or targeted programmes. These targeted programmes are often time bounded (typically, four to five years with, de facto, one or two renewals), and are among many programmes managed by organisations or administrations. They seldom have a dedicated structure (although there are exceptions like the energy ‘reduction en environment preservation' programmes in France managed by the ADEME agency).
2.3 Overview of the current situation
As already noted, there has been a shift in the focus of support towards more indirect mechanisms with a concomitant decline in the direct support of R&D, particularly that associated with the procurement of R&D by government, notably in areas such as defence (OECD, 2011), although this has been partially balanced by an increase in support for broader societally- and environmentally-oriented goals, such as climate change amelioration, ageing, etc. Moreover, the application of direct support has also become increasingly sophisticated, and its use has been combined with additional policy goals such as the encouragement of collaboration and knowledge transfer between firms or between firms and public sector knowledge producers (as in collaboration programmes) or through more complex constellations of knowledge producers and users (as in network or cluster programmes). Similarly, the direct support schemes that remain have become more targeted, notably towards the encouragement of high technology SMEs and start-ups, for example. One of its key benefits as a policy instrument is that direct funding may be targeted at specific areas where government intervention should make a difference; conversely it is not as effective at dealing with broad policy concerns (such as a lack of industry R&D investment) where, for example, instruments such as fiscal incentives may be more appropriate if the lack of investment is caused by financial barriers, or innovation vouchers, if the lack of investment is due to informational or knowledge inequalities. In general, all seek to reduce the risks encountered by businesses in innovating.
Broadly speaking, in this report, we predominately deal with two types of direct funding approach:
- Grants which cover a variable proportion of the anticipated or actual business R&D costs. These may be awarded for a set of defined activities in a number of ways, but are usually allocated according to a first-come-first-served or on a competitive bidding basis;
- Soft loans are provided either directly by a government agency or through commercial banks or other financial intermediaries. These may be reimbursable only under specific conditions (for example, on the successful outcome of a product development project and the subsequent generation of new sales), or may require repayment regardless of the supported outcomes.
Two further direct funding approaches may be encountered (Reid et al., 2012):
- Government loan guarantees; these are intended to facilitate commercial banks or other financial intermediaries in the granting of business loans, though reducing the need for businesses to provide collateral when applying for a loan.
- Government support to seed capital, business angel networks and early stage venture capital funds. These can take a range of forms, including the creation of a fund-of-funds, co-investment, etc.
A small number of the schemes we examine in this report fall into the third category; support for seed capital, business angel networks, etc. are, however, outside the remit of this report.
The support to which direct funding may be put by enterprises is also relatively diverse and can include support to undertake product development, enhancing product design, prototyping, process innovation, technology acquisition, organisational change, improvements to product marketing, etc. Again, we reiterate that this report focuses on the direct support provided for the support of individual R&D projects within single firms: collaborative and networking schemes are dealt with elsewhere, as is support for the procurement of products and services for public institutions and lead market development.
2.4 Challenges for evaluating policy
2.4.1 Major anticipated impacts
The typical intervention logic for direct support measures is illustrated in Table 1. The range of outputs, results and long-term results generally provide opportunities for quantitative measurement in variety of comparative (before/after or counterfactual) approaches.
| Inputs |
Outputs |
Results |
Long term results |
| * Grants |
* Increased business R&D investment leveraged by public funds |
* New products or services launched |
* Growth in sales and exports of innovative or hi-tech products and services |
| * Subsidised loans |
* Acquisition of new technology |
* New or upgraded production lines |
* Increased labour productivity rates |
| * Equity financing (subordinated loans, seed capital, funds of funds, etc.) |
* Equity (co-)investment in new or existing innovative firms |
* New hi-tech firms established |
* Increased share of hi-tech manufacturing employment and knowledge intensive service jobs in total employment |
|
* Increased collaboration with universities, etc; |
|
|
Table 1: Direct RDI support measures - typical intervention logic
These outcomes are also reflected in the evaluations we have reviewed in the course of this study, which have examined a similarly broad range of anticipated impacts ranging from the more or less immediate effects on the recipient firms to longer-term and broader ranging impacts. This variety is illustrated in the table presented in Annex 1 (and is summarised below), although it should be noted that a number of the studies from which the table is drawn focus on specific impacts of the programme (such as additionality) rather than the full range of expected effects.
In addition to the range of impacts and effects illustrated in Annex 1, several evaluation studies also examined aspects of the uptake and delivery of programmes and schemes, in some cases quite extensively. A common focus was on the characteristics of the recipient companies: in some cases this was restricted to a descriptive overview of such characteristics whereas other studies attempted to link these to the likelihood of success (e.g. De Laat et al. (2001); Huergo et al. (2009); PACEC (2001)).
To summarise, the available evidence seems to focus on a number of outcomes and effects:
- Rationales (evidence that the rationale for the scheme still exists and the scheme is relevant)
- User characteristics (descriptive information on the successful applicants of the measure)
- Governance aspects (information on how the measure is delivered, administered and managed)
- Input additionality (evidence relating to the creation of additional input arising from government intervention, such as increased R&D expenditures, increased employment, etc.)
- Output additionality (outputs that would not have been created without the government subsidy/loan, including increased sales, exports, etc.)
- Behavioural additionality effects (evidence related to changes in firm/organisational behaviour).
This set of outcomes and effects will be used to structure the analysis of evidence, below.
2.4.2 Key evaluation challenges
Clearly, while a number of the outcomes and impacts described above are relatively easy to monitor and measure either directly (employment, turnover, etc.), several, particularly those relating to behavioural changes and longer term impacts (regional economic prosperity/growth, spillovers, transfer of knowledge, etc.), are much harder to quantify and measure, whilst the more sophisticated elements of innovation capacity and capability building, particularly those relating to skills and operational practices may be harder to capture. Lemola and Lievonen (2008), for example, highlight the difficulties of measuring societal impacts for evaluation purposes.
Overall, despite their relative simplicity in comparison to other innovation support schemes, direct measures also exhibit a number of particular problems. These include:
Timing and Periodicity of evaluations:
The immediate effects of direct support of R&D in firms are comparatively easy to identify from their outset, including descriptive information on the rate of uptake of the scheme, the characteristics of successful applicants and feedback on administrative aspects of the support mechanism. Similarly, it will generally take little time for some of the intended consequences of support such as concrete R&D projects undertaken, increased R&D expenditures, additional employment generated, etc, to be demonstrated. However, further anticipated outcomes and effects are less likely to be manifested until significant periods of time have elapsed. Thus, months or years may elapse until prototypes have been generated or new products, processes or service introduced to the market. Similarly, organisational and behavioural changes will take time to generate and become embedded, whilst the sustainability of these and other desired effects will require even longer time frames.
Thus, as in many evaluation situations, the timing of the evaluation will need to strike a balance between being early enough to deliver timely management information and yet allow sufficient time to pass for appropriate results to be generated. As we can see from the evidence, evaluations of direct measures tend to focus strongly on the measurement of input/output ratios and additionality effects, attention also being paid to governance aspects: despite their objectives (which typically include a contribution to the competitive performance of a region, sector, country, or other level of aggregation), little of the evaluation evidence concerns longer term impacts. However, this itself represents a further evaluation challenge.
Scope of impact:
Many of the anticipated impacts of direct support measures are readily measurable: R&D expenditure, growth, profitability and employment, for example, all lend themselves to the construction of quantitative indicators which are generally easily obtained. However, information on less tangible outcomes such as skills, innovation capabilities and capacities, are less easily captured in comparable statistics. Similarly, spillover effects and transfer phenomena are harder to trace other than in largely anecdotal forms and may require the use of detailed interview approaches or specific case studies, which in turn poses problems for the assessment of programme wide, aggregate impacts and effects.
Counter-factuality and benchmarking:
In common with many other types of policy intervention, it is difficult to identify the types of outcome and impact that arise from the direct support of R&D in the absence of counterfactual examples (i.e. cases where funding was not provided) or benchmarks established prior to the establishment of the funding. The selection of counter-factual examples is problematic since such firms may exhibit characteristics that dissuaded them from applying for funding (for example, they did not require funding, the programme focus fell outside their strategic remit, funding entailed too many constraints, etc.) or which precluded them from a successful application (for example, an inability to meet eligibility criteria). Even if suitable firms can be found, there may be a strong likelihood that the comparison samples are not following identical development and growth trajectories – firms with good innovation performances may be more likely to apply for, obtain and benefit from public support innovative than less innovative firms. Thus a truly comparable sample of non-participants is difficult to create. Likewise, benchmarking can also be problematic; it is difficult to obtain sufficient performance data for firms prior to their application and receipt of public support, particularly, in the ideal case if this data is required to construct a profile of the firms’ growth trajectory over a number of years rather than utilising a single point in time for an ex ante/ex post comparison. Such data is even less likely to be available for newly established or high-growth SMEs.
Attribution:
Again a common problem facing many evaluations, the direct outcomes of public support may be difficult to distinguish from other forms of support. This is not a major issue in the case of smaller companies, but as the size of the company involved increases, the difficulty in distinguishing the effects of public support from other income streams and from parallel activities undertaken by the company becomes increasingly problematic.
3 Scope
3.1 Academic literature
The general background literature dealing with innovation policy evaluation and innovation policy interventions was also scanned for examples of relevant evaluations. The search focused on articles published after 1990 while several important sources published in the 1980s were also included. A sophisticated search using the Scopus database revealed more than 400 articles. After eliminating those that were not relevant to this study or which lacked the necessary quality, around 100 articles remained for analysis. A number of meta-evaluations covering multiple individual evaluations were also included in the review. It was observed, in general terms, that a portion of the academic literature is linked to evidence obtained through evaluations, because the scholars were also the evaluators, they advised the policy-makers or evaluators, or they used the data collected in the evaluation process as the basis for academic outputs.
3.2 Policy evaluations
For the purposes of this report, a number of evaluation reports were also reviewed. These related primarily to innovation support schemes delivered in the form of grants or soft loans, the primary purpose of which was the direct support of R&D within the target companies. A small number of the schemes reviewed had subsidiary objectives, such as the promotion of collaboration with other companies or with public sector institutions, or the associated delivery of advisory services to SMEs. However, in these cases it was possible to distinguish between the evaluation of primary aims and objectives and these secondary concerns. The set of schemes, together with a very brief description, is presented below.
- ANVAR: Procédure d'aide au projet d'innovation: Soft loan scheme targeted at SMEs, established in 1979 and evaluated in 2001 (France)
- DEMO 2000: Sector-specific technology development programme – targeted at oil companies and supply companies, set up in 1999, evaluated in 2005 (Norway)
- FFF-Industrial Research Promotion Fund: Set up in 1967, provides grants, loans, subsidies for bank loan interest and bank loan guarantees for R&D projects in companies; evaluated 2003 (Austria)
- Grant for R&D/SMART: provides a flexible range of grant-based R&D support to SMEs; full version launched in 1988, several evaluations (UK)
- IWT subsidies: range of variable rate subsidies (grants) for SMEs (Flanders)
- MERA Programme: sector specific (automotive) competence and cooperation building R&D support: launched 2005, evaluated 2008 (Sweden)
- National R&D Programme for Medical & Welfare Apparatus: direct grant support for R&D in medical and welfare sectors, including procurement and collaborative aspects; implemented 1976, evaluated in 2003 (Japan)
- NRC Industrial Research Assistance Programme: provides both advisory services and non-repayable contributions to develop SME R&D capacities – started 1951, evaluated 2007 (Canada)
- R&D Capability Grants Scheme: provides grants for the establishment or enhancement of company R&D activities in Ireland. Set up 2000, evaluated in 2003.
- R&D Start Programme: variable range of grant subsidies to support R&D, commercialisation and cooperation with the tertiary sector. Running since 1967, several evaluations (Australia)
- Small Firms Loan Guarantee Scheme: provides guarantee to encourage banks, etc. to lend money to support SMEs’ R&D projects and start-ups. Established 1981, evaluated 2010 (UK)
- SPIN: sector-specific (software) R&D support grant and loan programme operated by Tekes, in place since 2000, evaluated several times (Finland)
- Technology Development Projects (PDT), Technological Innovation Projects (PIT) & Aggregated Industry Research Program (PIIC): soft grants and loan programmes for the support of R&D in a range of firms (Spain)
- Tekes R&D support: broad review of Tekes’ measures to support company R&D across a range of sectors
- ZIM Programme: R&D grant support for SMEs for the support of R&D, commercialisation, cooperation and network development: launched 2008, evaluated 2009, (Germany)
4 Summary of findings
Our review of the literature (both academic and policy-oriented) is structured around the major types of issues or effects typically addressed by evaluations of direct measures, as noted in Section 2.4.1. Thus, Section 4.1 examines the evidence to support that the rationale for the scheme still exists and the scheme is relevant in the contemporary policy context, together with the degree to which the schemes conferred general additionality. The next three sub-sections are concerned with aspects of implementation and governance: Section 4.2.1 reviews the evidence in terms of programme uptake and the relationship of user or participant characteristics to uptake and success effects; Section 4.2.2 examines issues related to administration and management, while Section 4.2.3 looks at the co-delivery of complementary services and forms of support, either within or alongside the measures under review. The following three sub-sections deal with the evidence of effects, namely: input additionality evidence relating to the creation of additional input arising from government intervention, such as increased R&D expenditures, increased employment, etc. (Section 4.3.1), output additionality outputs that would not have been created without the government subsidy/loan, including increased sales, exports, etc. (Section 4.3.2) and behavioural additionality - evidence related to changes in firm/organisational behaviour (Section 4.3.3).
As already identified in an earlier review of collaborative support schemes (Cunningham and Gök, 2012), from our examination of the evaluations conducted into direct measures, it is clear that evaluations again tend to focus on two major characteristics: the efficiency of the schemes (i.e. ratio of input to output metrics) and the extent to which they have been successful in achieving their objectives. The means by which metrics of success are achieved receives much less attention. This point was identified in a review of evaluations of UK government industry support schemes where it was noted that:
"The evaluation evidence based on the BERR interventions was heavily distributed towards the productivity drivers of enterprise (and to a lesser extent innovation) and the P[ublic] S[ervice] A[greements] concerned with business success.... This – and the gaps in the evidence base meant that there was limited potential for mapping a range of distinctive logic chains to link the interventions with higher level BERR objectives” (SQW Consulting, 2009).
The SQW review was able to derive sufficient evidence from the large number of evaluation studies examined to make an assessment of the main ways in which the evaluated support schemes may have contributed to productivity growth and its drivers. From this, a tentative 'performance score' was derived for the evaluated schemes. This was based on four factors "assumed to be critical in identifying interventions that improve productivity in a cost effective way:
- minimising public expenditure per assisted business;
- maximising the business numbers assisted;
- minimising non-additionality (i.e. achieving high net/gross output ratios); and
- maximising the additional effect on productivity and business performance".
From their detailed review of 16 interventions which achieved high performance scores, the authors suggested that efficiency gains among the recipients were best achieved through the improvements the schemes delivered in terms of intangible variables such as management practices, better information and knowledge and improved networking.
The point was also highlighted by a review of the UK Smart scheme (PACEC, 2001) which recommended that "further research should be undertaken to identify which events or components of support during the lifetime of a Smart project are critical in terms of market place success". Unfortunately, and possibly due to the inherent difficulties involved in evaluating these components, subsequent evaluations still did not address this aspect.
4.1 Conformance with rationale
One of the most striking features concerning the selection of evaluations we have examined relates to the age of many of the programmes they concern: at least one of our sample programmes was initially launched in every decade as far back as the 1950s. The longevity of these programmes and the enduring need for governments to continue to launch similar direct grant support for R&D strongly suggest that the rationale for this type of measure still persists.
However, despite this, given the dynamic nature of innovations systems and the growth in our understanding of their behaviours, it is clear that one of the initial questions that evaluators of any programme should pose is whether the rationale for support is still justified.
It is therefore unsurprising that a number of evaluations in our sample have examined the appropriateness of the programme or intervention in terms of its rationale and relevance in the contemporary policy context. Several also examine the general issue of additionality and link this explicitly to programme relevance – i.e. the evidence that companies would not have done what they did, or in the same way, without government support was taken to support the view that the rationale of the programme still held. Indeed, the rationale for many schemes is that the support overcomes a range of barriers to firm participation and/or the undertaking of R&D projects. The more specific issues of input additionality, output additionality and behavioural additionality tend to be evaluated in more sophisticated and detailed evaluative approaches and are addressed in separate sections later in this report.
In a review of Tekes (the Finnish innovation agency) funding, Raivio et al. (2012) determined through an interview programme, that Tekes funding was essential for the recipients' R&D activities and that, without this support, development would have been slower, if not impossible. However, while in a number of cases company survival was dependent on Tekes support, in others the same products would have been developed in the absence of funding. The issue of respondent variability is encountered in several evaluations and can often be linked to the characteristics of the recipient firms, a point which is revisited below (Section 4.2.1).
Similar findings emerge from a PREST (2003) evaluation of the Japanese National Research and Development Programme for Medical and Welfare Apparatus (NRDPMWA). Some 58% of participants indicated that the project would not have taken place without support. The primary reasons for the need for funding were given as high technical risk and small markets, while the programme also appeared to offer access to human resources (in the medical and university sectors) to several participants. The probable effects of the absence of funds (in cases where the project would still have gone ahead) would have been a reduced scale, less ambitious and without collaborators. However, the evaluation found that there was an incompatibility between the rationales of the government sponsors which was not addressed by the programme: whilst the Ministry of Health and Welfare focused on the goal of supporting the procurement of equipment for the benefit of patients or welfare recipients, that of the Ministry of Economy, Trade and Industry was to promote industrial competitiveness in the sector: a key lesson was that programme rationales should be consistent between all involved agencies and their realisation should be within the capabilities of the participants.
The UK's SMART scheme which supports R&D projects in SMEs has been subject to a number of evaluations over its lifetime. A review in 1994 (Barber et al., 1994) found that "some aspects of the rationale for the SMART scheme have not been validated mainly because they were incorrectly founded. However SMEs have undoubtedly benefitted and in this respect the rationale is supported by the evaluation and overall additionality is high at around 85%". A further evaluation, seven years later PACEC (2001) did not comment on the rationale thus it seems that this may have been adjusted. Additionality was again high, with two-thirds of award winners stating that their project would definitely or probably not have gone ahead without support, while only a small minority said the opposite. Again, firm characteristics were a factor in the degree of additionality achieved, with Micro-firms being more likely than Small firms, and considerably more likely than Medium-sized firms, to indicate that their projects would definitely or probably not have gone ahead without support. Support was also likely to have the effect of making projects happen earlier and, to a lesser extent, on a larger scale and broader in scope than would otherwise have been the case. Another review, conducted eight years later (PACEC, 2009) again found that the rationale for the scheme (now re-named the Grant for R&D), which focused on the existence of a funding gap for R&D and innovation projects for SMEs, arising from relatively high levels of risk and uncertainty associated with these activities, was clearly addressed and firms were found to improve their attitude towards R&D and innovation.
A similar rationale, that of addressing a lack of finance experienced by SMEs, was also addressed by the UK's Small Firms Loan Guarantee (SFLG) scheme. An evaluation (OMB Research, 2010) found that the scheme was the first application that 80% of SFLG user businesses had made to any source for their project, with 76% noting that no other sources of finance were available to them. Additionality was only moderate with 43% of SFLG users probably or definitely not have achieving similar results without the SFLG guaranteed loan, compared to 38% of non-users who had obtained a loan. Just below half of SFLG users would probably or definitely not have gone ahead with the project or start-up funded by the loan in its absence, compared with 65% of non-users who obtained alternative finance.
De Laat et al. (2001) report good additionality as evidence for the continued rationale for support in their evaluation of the soft loan scheme of the French innovation agency (ANVAR): 75% of the companies receiving the loan would not have realised the project in the same way or would have done it at all without support. Company characteristics were again a factor: the net impact of the scheme was potentially more important for 'young' companies rather than 'mature' companies. The authors' explanation was that "where R&D projects form the core of a company's strategy, the high potential net impact diminishes with the companies' ability to finance parts of its R&D from cash flow or from external private sources, whereas projects that are less central to the firms' activity may be abandoned once public financing ceases" (De Laat et al., 2001). This seems to suggest that programme rationales should also acknowledge the characteristics of the target companies and that different types/categories of companies will have different requirements, implying the need for differentiated or focused implementation and delivery systems rather than generalist or broad brush approaches.
A similar finding was made in the evaluation of the Austrian Industrial Research Promotion Fund (FFF): smaller, younger companies that face higher levels of risk and where project funding forms a larger component of R&D investment would be expected to benefit to a greater degree (KOF et al., 2004). Evidence indicated that the smallest firms were the most dependent upon the FFF subsidy to undertake their R&D projects. This phenomenon was not directly related to company size, however, since it was found that companies with between 100 to 250 employees were least likely to demonstrate additionality: very large firms tend to have a large portfolio of alternative projects, thus it was assumed that FFF funding may influence which project gets done, rather than if any R&D is performed. Overall, FFF funding was found to make the projects possible in around 33% of cases, while in other cases funding helped overcome larger technical risks or to get products to market more quickly. An interesting finding was that 15-22% of the firms who were unsuccessful in getting funding indicated that their projects remained unchanged; the analysis showed that this implied that 10-15% of the firms whose projects were rejected were attempting to 'free ride' on the FFF subsidy. It was not known what proportion of the funded projects involved such free riding. These findings suggest that the overall rationale for the support may not have been as strong for some of the recipient companies and that changes in the implementation or targeting of the programme might have been necessary.
To conclude, the evidence on rationales seems to point to a number of lessons:
- Programme rationales should be consistent between all the agencies/sponsors involved in the support and governance of the programme, and their realisation should be within the capabilities of all the participants.
- A robust ex ante assessment of the rationale for the scheme is critical in contributing to its uptake and overall success,
- Similarly, evaluations should test the ongoing relevance of the scheme in terms of its original rationale, even in the case of long-lived support instruments.
- Rationales should take account of the characteristics (and, hence, requirements) of the range of target companies they address in order to maximise uptake and the efficient allocation of resources
4.2 Implementation and governance
Implementation and design cover a range of programme attributes such as the selection processes used to allocate funding, the mode of delivery, the speed of subsidy payment, the handling of enquiries and the bureaucratic demands imposed on recipients (such as the need for reporting, etc.), to name but a few. The evidence obtained from the review suggests that the way in which the support measure is delivered and administered can be a contributory factor in way in which firms decide to participate or not and on the level of its success.
4.2.1 Uptake
A number of studies examined the association between firms' characteristics in the context of general additionality (i.e. in terms of whether certain types of firms were more or less likely to accrue benefits from their participation): this set of evidence is examined under the section on rationales (Section 4.1). In contrast, a further number of evaluations examined the characteristics of participating firms in a purely descriptive way, although none were found to draw any policy lessons from this information.
Thus, in an early evaluation of the Smart scheme in the UK (which included an evaluation of the complementary SPUR (Support for Projects Under Review) scheme, it was found that award winners tended to be young, independent businesses, for whom being involved in Smart made them more ambitious to grow and that mainly they applied in order to develop new products and services although there was a range of other objectives (PACEC, 2001). Eight years later, the same characteristics were still observed with the most common reason given by award winners for participation being to develop new prototypes, products, and services, with a range of subsidiary technology-related objectives (PACEC, 2009).
A study of a range of grants and loans made by the Spanish Centre for the Development of Industrial Technology (CDTI) found that participation was dependent on firm size, with smaller firms being more likely to participate. Firms that were engaged in exporting were more likely to receive a grant (Huergo et al., 2009). In a later paper (Huergo and Trenado, 2010), the authors follow up their analysis. The results show that companies from high or medium-tech industries, and those firms with previous experience in similar programmes were more likely to apply for a low interest loan. The R&D intensity of the proposed project was found to significantly increase the probability of a successful application.
A further number of the studies covered in the literature review also examined the links between firm characteristics and participation in direct support schemes. Examining survey data on Spanish firms receiving support from the Ministry of Industry, Blanes and Busom (2004) found some common patterns in the characteristics of participating firms: firms with experience in R&D tended to be more likely to participate; subsidy policies were more effective in attracting firms that already do R&D (particularly in high-tech industries), than in inducing non-R&D performers to undertake R&D; firm size may be a barrier to participation and relatively smaller firms are more likely to participate. However, significant variation was encountered across the range of agencies and industries surveyed.
Soriano and Peris-Ortiz (2011) carried out an analysis of the database of applications to the Spanish Regional Government of Valencia's Institute for Small and Medium-sized Industries for R&D subsidies in SMEs in order to explain the approval/rejection and the success/failure of the projects that sought state funding. Inter alia, they found that applications from firms with a higher technological level were more likely to gain approval, as were firms with prior experience of applications. The latter variable also contributed to the chances of project success; each previous application increased the likelihood of being successful by 8%, although the reason for this was not readily explained.
Without being able to go into further detail with regard to the design and administration of the support schemes under review, it is difficult to draw any major conclusions from this evidence since the characteristics of the successful applicant firms are likely to be highly dependent on the selection processes applied. Clearly, programme administrators will seek to ensure that eligibility criteria are designed to comply with the programme rationale and to ensure successful outcomes: only firms meeting these eligibility criteria will be awarded support. In this sense, the policy instrument becomes selective and is not neutral in its audience in the way that fiscal measures are. However, provided the rationale is well considered and is used to carefully define the eligibility criteria, this should not be a problem. The topic of selection processes is examined in the next section.
4.2.2 Administration and management
A number of evaluations remark on the selection processes employed by various schemes. For instance, in their evaluation of the Smart scheme, Barber et al. (1994) noted that while several participating companies had achieved high levels of success there was a "long tail of projects with limited exploitation expectations or results" and that “the success of the scheme depends on a relatively small proportion of highly productive projects followed by a long tail of comparatively less successful ones. About four fifths of projects gave rise to third year sales of less than £0.5m, including around a quarter which were abandoned without any exploitation”. This was felt to indicate that there was scope for improving participant quality by making the selection process more effective. In addition, the authors suggested that better monitoring of projects would both help to inform better appraisal and to enable downstream support needs to be identified (the issue of complementary interventions is discussed in the following section).
Other reviews also made suggestions towards improving the likelihood of participating firms' success: the PREST (2003) evaluation of the Japanese NRDPMWA identified a need to attract greater numbers of more innovative small firms to work with the existing large participants. However, these suggestions, aimed at creating an "industrial ecology” favourable to innovation would have shifted the scheme's focus towards networking and collaboration, and, consequently, have expanded the rationale for the programme. In this vein, the authors identified a role for a coordinating programme manager who could enlarge and strengthen the network around the programme and encourage new applicants. In response to the finding that projects were over-specified in advance, it was suggested that more generic guidelines should be used allowing companies to exercise their greater creativity in developing solutions and identifying market opportunities.
The issue of a more bilateral dialogue to guide participation was also noted by PACEC (2009) in their evaluation of the UK Grant for R&D: stakeholders felt that the scheme's synergies and impact could be increased by involving them more in planning and engaging them to a greater extent. Additional improvements included a streamlining of the application process: a request that had also been made in the 2001 evaluation of the scheme (PACEC, 2001), together with increasing the upper limits of the grant and less reporting requirements. Another, unsurprising finding was that participants were less "favourable towards the idea of loans instead of grants and the idea of providing equity in return for finance. Amongst the possible alternatives to grant funding, the award winners were least averse to a system of repayments based on royalties from sales of project outputs” (PACEC, 2001). In other words, next to the receipt of government support on the condition that companies would also contribute funding, there was a preference for schemes where repayment was contingent upon revenues raised from a project – i.e., where there had been a successful outcome.
From experience with the German ZIM programme, a 'classic' R&D support scheme for SMEs, Deuten and Hiltunen (2011) considered that the provision of advice, prior to the submission of a formal application led to an improvement of the quality of applications and contributed to the efficiency of the overall application process. This was followed by light and quick selection procedures, which did not involve external assessors and which were carried out by the programme management agencies (see below). This was felt to be particularly useful for SMEs, as was the swift payment method operated by the programme management. Finally it was noted that the use of an efficient and effective IT-system, which allowed the three modules of the ZIM programme to be managed by different agencies as one integral programme also contributed greatly to its smooth running.
Deuten and Hiltunen (2011) also highlighted the overall management process of the ZIM programme as a good practice example. Here there was close collaboration and a clear division of labour between the programme owner (ministry) and the programme management agencies. The main criteria and objectives are designed by the ministry, which also funds the programme while the technical operation of the programme is carried out by specialist agencies (Projektträger). The latter are able to concentrate on their core tasks of programme administration in a way that ministries are not. However, unlike the above examples of good practice arising from the ZIM evaluation, the transferability of this aspect is limited since it depends on the rather unique German governance structure. According to the authors, this model allowed project handling times to be reduced from the assessment phase onwards.
Stakeholder complaints concerning bureaucratic procedures are commonplace across most evaluations of policy interventions, but such procedures can have a positive aspect: the evaluation of Tekes support measures encountered complaints about excessive bureaucracy but the process which forced companies to prepare a project application was found to be valuable as a first step towards the later development of an entire product concept (Raivio et al., 2012).
As a means to examine the efficiency of programme delivery, some evaluations were found to have included audits of the administrative costs of programmes. For example, an evaluation of the Australian Start grants programme found a 6% ratio of departmental costs to programme costs, higher than that of the R&D Tax Concession programme (2%), mainly due to the high salary cost component of the Start administration. In addition, compared with the Tax Concession programme, Start grants were found to demonstrate significantly higher compliance costs, with an average ratio of compliance cost to total R&D project expenditure of 5.9% compared with 3.4% for the Tax Concession.
As in the Tekes case, however, there is a positive aspect in that anecdotal evidence seems to indicate that the more rigorous application and monitoring process results in a better managed project, with better outcomes than might otherwise be the case. Some reported options for reducing compliance costs and streamlining the grant process were to simplify the applications and introduce an electronic based process (Allen Consulting Group, 2000).
Excessive bureaucracy has been found to lead to a decline in programme attractiveness: a review of the Canadian Industrial Research Assistance Programme (IRAP) found that it had begun to experience a decline in client numbers. Amongst other factors, the view of clients that programme access had become more difficult and burdensome was highlighted as one reason for the decline in client reach (National Research Council of Canada, 2007). The evaluation also examined the economy, efficiency and cost-effectiveness of the Programme and found opportunities for the improvement of its performance in the area of resource utilisation or economy: programme costs (direct, indirect and corporate overhead) represented just over a third of total programme expenditures. Prompted by a series of audits, the Programme had been required to introduce procedural changes to reduce risk. Evidence was found that the increased accountability, monitoring and performance requirements might have had an impact on the ability of the Programme to deliver funding and advice in an efficient manner. In turn this may have contributed to the decline in the reach of IRAP and its ability to address particular types of clients (e.g., start up firms, small firms) or projects with relatively high risk. A further negative factor affecting Programme efficiency was the influence of changes in available budgets from one fiscal year to the next. Uneven levels of funding, or uncertainty over the amount available for SME projects was found to influence the general efficiency of the Programme, its reach and the satisfaction level of both staff and firms with the Programme itself (National Research Council of Canada, 2007).
In conclusion, it appears that a number of implementation factors can contribute to the overall success of a programme. These include:
- The use of a rigorous selection process, which can be combined with close monitoring;
- The provision of advice to prospective participants during the application process;
- A greater level of bilateral engagement between programme management and participants, particularly during the design and implementation stages of the supported projects;
- Minimising bureaucracy and utilising an efficient and effective delivery process;
- Programme management needs to have a thorough understanding of the programme, its rationale and operational requirements and be sensitive to the needs of participating companies; it should not function simply as a delivery agent;
- Continuity of the level of anticipated available support is essential to retain audience confidence.
4.2.3 Provision of complementary services
A further issue connected with that of programme design concerns the way in which programme effects and impacts can be enhanced or synergised by the development of complementary interventions and forms of support. As noted by Raivio et al. (2012), "participation in a programme is in many cases only one phase in a longer relationship between a company and Tekes”, although "it is clear that the impact of any single programme or even a long cooperation with Tekes on the growth and success of a company can seldom be verified reliably".
Barber et al. (1994), in their evaluation of the Smart scheme, recommended that “the potential for linkage or combination with SPUR [a complementary support scheme for small companies] and the various options for such a combination should be considered". This recommendation was indeed taken up at a later date.
In their evaluation, Barber et al. (1994) also noted that "one of the aims of the scheme is to stimulate small businesses to develop and market products" and that "the evidence available indicates that post development exploitation poses the greatest problem to small companies". Pointing to the absence of such marketing support in SMART, they suggested that it could be provided in the form of managerial and commercial advice. This advice was apparently not taken on board by the programme management since the 2003 evaluation of the impact of the scheme on skills by PACEC identified a "clear need for advice on skills and training before, during and after Smart projects" (PACEC, 2003). This need was most acute during the critical application stage of the Smart process and remained strong during the development phase. Moreover, over half of the firms sought external assistance on skills and training at the ends of the projects or when preparing to market their outputs.
A similar need was identified by De Laat et al. (2001) in their evaluation of the ANVAR soft loans scheme. Their analysis showed that companies were often unable to commercialise their innovations fully, largely due to weak exploitation of results and the problem of supplying commercial and marketing advice. Complementary services suggested by the authors included the provision of specific services for young companies and coaching to starting entrepreneurs (De Laat et al., 2001). Likewise, the PREST (2003) evaluation of the Japanese NRDPMWA suggested that complementary measures should be added to the programme in order to assist small firms with preliminary (international) market studies before they commit to a full project.
Continuity of support is also an identified issue: Oakey (2000), in a general review of UK support measures, found a need "to improve the impact of both public and private sector investment and assistance by applying them to developing small firms in a co-ordinated manner (i.e. to ensure that public support triggers private investment and, conversely, to increase the effectiveness of public sector support with private sector finance)". Another evaluation of the Smart/Grant for R&D scheme in 2009 found that over 30% of companies subsequently claimed R&D Tax Credits linked to their supported projects and that lack of finance still formed the major barrier to carrying out further R&D after the completion of the supported projects. However, the support had improved the chances of companies obtaining subsequent support (PACEC, 2009).
This latter point was echoed by De Laat et al. (2001) in their 2001 evaluation of the ANVAR soft loans scheme. They found that the "labelling” effect of ANVAR could be crucial for helping small companies in their efforts to secure complementary financing.
In another example, the UK SFLG scheme was found to often form part of a package of external advice and support. A significant proportion of SFLG users stated that they had used external sources of information, help or advice to assist with their business development, more than the proportion of non-users who had obtained a loan (OMB Research, 2010). A further point identified by Cowling (2010) was that, since "a significant minority of SFLG supported businesses are seeking to innovate and/or expand into new geographical, particularly international, markets, there may be a case for SFLG supported businesses to be offered advisory support programmes in parallel with their financial support".
To further develop the notion of 'bundling' forms of support into a single measure, in their evaluation of the German ZIM programme, Deuten and Hiltunen (2011) state that it is "good practice to streamline the mix of policy instruments by integrating several programmes into one modular programme. This improves the accessibility and transparency for client firms and allows for more efficient programme implementation. The concept of streamlining is transferable to other policy contexts that are characterised by fragmentation in the mix of policy instruments". An example provided was the use of the "Aid for advisory services and innovation support services" instrument in close linkage with the R&D projects supported under ZIM, notably once they had entered the commercialisation phase.
However, by way of a caution against the inclusion of too many forms of support into a single instrument, KOF et al. (2004), in their evaluation of the Austrian FFF programme, noted that although grants, loans and guarantees are all valuable instruments to circumvent the problems firms face in accessing capital for the financing of R&D projects, the different types of instruments should be used independently in order to address the different types of market failures faced – i.e. risk averse firms and risk averse capital markets.
Finally, to revisit the idea of complementary forms of support, Cressy (2001) notes that both grants and tax concessions are important enablers of innovation activity in SMEs, while, as noted above, the evaluation of the Smart/Grant for R&D (PACEC, 2009) found that a third of businesses had gone on to claim R&D tax credits linked to Grant for R&D projects. In the evaluation of the Australian R&D Start programme it was noted that Start formed a "major programme within the innovation system and complements the R&D Tax Concession programme".
The literature also provides some insights on the role of the two types of support. Mamuneas and Nadiri (1996) find that "publicly financed R&D induces cost savings but crowds out privately financed R&D investment, while the incremental R&D tax credit and immediate deductibility provision of R&D expenditures have a significant impact on privately financed R&D investment. The optimal mix of both instruments is an important element for sustaining a balanced growth in output and productivity in the manufacturing sector”
In their study of government support instruments in Shanghai, Zhu et al. (2006) find that (stable) direct funding by government has a positive effect on industrial R&D investment whereas tax incentives led enterprises in the observed industrial sectors to switch to more general and less costly science and technology (i.e. low-tech) activities, which was seen as a less desirable outcome.
In a general study of Canadian industry, Bérubé and Mohnen (2009) examined the effectiveness of R&D grants for Canadian firms that already benefit from R&D tax credits. They found that firms that benefited from both policy measures introduced more new products than their counterparts that only benefited from R&D tax incentives, made more world-first product innovations and were more successful in commercialising their innovations.
Carboni (2011) used a comprehensive firm level data set in the manufacturing sector to compare the performance of direct measures and tax credits schemes in Italy. His results suggested that public assistance enabled recipient firms to achieve more private R&D than they would have in the absence of public support and that tax incentives appeared to be more effective than direct grants, although grants encourage the use of funding sources internal to the firm. Conversely, Grilli and Murtinu (2012), concluded from their study of Italian NTBFs that "selective R&D subsidies outperform other types of scheme in fostering NTBF performance".
Three main conclusions emerge from the above analysis of the evidence:
- The provision of complementary services (such as advice, training on aspects of business and management practice, support for marketing, etc.) within a support measure can enhance the likelihood of successful outcomes by developing the capacity of the recipient firm to capitalise on all aspects of the supported project. Moreover, such services are more likely to have a longer term impact in that the skills they imbue may be employed by the firm in future projects beyond that supported by the instrument in question. The downside is that these will increase the overall budget of the measure or reduce the number of companies it can support.
- Complementary support schemes, if well designed and provided alongside the direct support may enhance and broaden its overall impact. However, there are negative sides to this in that coordination costs will be higher and a number of rationales for support will need to be balanced in order to address a range of market failures, for example.
- The combination of direct measures (which may be employed in a strategic manner by governments, for example by targeting specific sectors, regions or types of firm) and fiscal incentives (which engage firms in a broader, reactive fashion) seems to represent the optimal policy mix for industry support aimed at the primary rationale of enhancing industrial R&D expenditures.
4.3 Evidence of effects
The academic literature is rich on the evidence of additionality of R&D and innovation direct measures. While most of the literature focuses on grants, there are also a number of studies on loans and loan guarantees. A substantial number of studies examine the impact of public finance of private R&D without distinguishing the modality of the measures. Most of these studies use industry (sector)-level or macro-level data while there are also studies that use firm-level CIS data which do not have any information on the measures.
The effectiveness of direct measures has been studied since the early 1980s. However, there has been a recent surge in this type of study. We have reviewed pre-1990 studies through a number of meta-evaluations which cover around 100 studies in total, while the post-1990 evidence is reviewed directly. We organised our analysis around the concept of input, output and behavioural additionality.
Input additionality (i.e. the degree to which firm inputs increased because of the government support) and output additionality (i.e. the amount of firm outputs increased because of the government support) are well-established concepts in the evaluation of direct support to R&D and innovation. The two concepts of input and output additionality are widely considered as the hallmark of the neoclassical policy rationale which ultimately seeks to remedy market failures. The neoclassical rationale builds on the assumption that the core of innovative activity (knowledge creation) is in large part non-rival and non-excludable and therefore it posits public good characteristics; much of the knowledge created is not appropriable. As Griliches argued earlier (1992), R&D spillovers create positive market, knowledge and network externalities to such a degree that the social return exceeds the private return. Further, innovative activities, especially front-end R&D, are very risky, indivisible and often excessively costly. Thus, there is risk that the investment to the innovative activity might not be as desired (profitable) as possible for actors to persuade them to invest. In combination, these features ultimately lead to the risk of under-investment since the private optimum level of innovative activity could be less than the social optimum level (Arrow, 1962; Bach and Matt, 2002; Hall, 2002; Nelson, 1959; Stoneman and Vickers, 1988).
Thus, the role of the government is to i) reduce uncertainty, ii) substitute failing markets by sharing risks and costs and iii) devise ways to overcome inappropriability. The government should devise and implement policies to attain the 'second best' social optimum as closely as possible, and any policy should be an improvement compared to the initial market failure case. Therefore, fundamentally, a policy is successful only if it creates input and/or output additionality. If a government action designed to address market failures does not create more inputs and/or outputs that would have been created without it (e.g. input and/or output additionality), then it is unsuccessful (Gök and Edler, 2012: 3).
After it was coined in 1995, the concept of behavioural additionality has been gaining prevalence (see OECD (2006) for a pilot application in 11 countries and Gök (2010); Gök and Edler (2012) for more background).
"Behavioural additionality (i.e. persistent behavioural change influenced by government action) is considered as the core of the evolutionary/structuralist view which urges policy action to increase the cognitive capacities of agents and/or to resolve exploration, exploitation, selection, system, and knowledge processing failures rather than simply addressing market failures. Thus, a policy is only successful if it increases the capacities of agents that are crucial for innovation activity and performance (cognitive, networking etc.) and by doing so leads to persistent effects. One-off non-persistent impacts are not sufficient for successful policy. Further, the changes in behaviour as a result of influencing capacity then, in a logical step, lead to an increase in innovation performance. The logic chain of the intervention is thus more indirect compared to the market failure rationale. The key criterion is an increase in the innovation enabling capacity of agents in such a fashion than would have been the case without government involvement and also to such an extent that it contributes towards the resolution of various non-market failures and leads to more innovation. Bach and Matt (2002, 2005) call this 'cognitive capacity additionality' while Georghiou (2004, 2007; Georghiou and Clarysse, 2006) call it "behavioural additionality" (Bach and Matt, 2002, 2005; Lipsey, 2002; Lipsey and Carlaw, 1998a, 1998b, 2002; Lipsey et al., 2005)” (Gök and Edler, 2012: 3).
The issue of general additionality, that is, whether or not recipient firms would have done the same activities, to the same extent or in the same way, can be interpreted as evidence of the continuing rationale for the existence of the policy intervention. In this very general sense, it has been discussed under the topic of rationales in Section 4.1.
A substantial portion of the literature focuses on the methodological issues of measurement. Issues arising from the use of control groups, especially selection bias, are popular in the academic literature. While some of the studies try to implement methods used in other policy areas such as educational policy, health policy, social policy, etc., other studies recognise the
Impact of Direct Support to R&D and Innovation in Firms
Cunningham, Gök and Laredo
difficulties associated with the nature of R&D and innovation and focus on matching designs to overcome these problems.
While most of the reviewed studies focus on the issue of effectiveness directly, we have identified two important issues that are somewhat underemphasised in the literature. First of all, it is well documented in the theoretical literature on innovation studies and also in the evaluation of other policy areas, that the impact of policy intervention exhibits a skewed distribution (as noted by Barber et al. (1994)). However, only a limited number of the academic studies touch upon this issue. For instance, González et al. (2005: 946) found that "almost half of large non-performing firms could be induced to perform innovative activities by financing less than 10% of their R&D, and one out of three small non-performing firms by financing up to 40% of their expenses". Similarly, Hsu et al. (2009) identify "ideal, compliant, and marginal" types of firms and show that subsidies have a high impact on only the ideal type of firm. Lee (2011) shows that the impact is not uniform and changes according to conditioning characteristics.
A second issue is related to the persistence of effects. Almost all studies we reviewed considered one point in time and therefore did not discuss if the effects they report endured in a subsequent period. This is particularly important in the case of behavioural additionality where persistence is a key element of the definition of the concept as discussed above. There are only two studies where persistence is tackled. González and Pazó (2008: 1402) in their econometric analysis of data of 2000 Spanish manufacturing firms during 1990-1999 found that the effects they report are "weaker when persistence is considered". A more comprehensive effort is by Roper and Hewitt-Dundas (2012) who looked at the persistence of input, output and behavioural additionality in Ireland over the period 1991 to 2011. They report strong evidence of sustained output additionality and behavioural additionality for networking while their evidence of sustained input additionality and behavioural additionality for capabilities and resilience is weaker. Even though this study is the most advanced attempt to capture persistence, it only looks at the change between subsequent periods and therefore only considers changes in the following 3 to 6 years.
We have identified 43 pieces of evidence on input additionality, 25 on output additionality and 9 on behavioural additionality. This evidence is presented in the following sections.
The rich literature on the impact of direct measures on the inputs of recipient firms includes a number of extensive meta-evaluations (see Annex 2).
In their pioneering work in which they analysed 33 studies, David et al. (2000) found that studies on firm or line of business aggregation level tend to find more substitution effects (i.e. public financing replaces private financing) than macro-level studies. In addition, the US-based studies in their analysis tend to find more substitution effects than non-US based studies.
García-Quevedo (2004) revealed that out of 74 studies analysed, 38 indicated complementarity (i.e. public financing increases private financing), 17 substitutability and that the results were insignificant in 19 studies. Similar to David et al. (2000), García-Quevedo (2004) identified that crowding-out is more common in firm level studies compared to industry- and country-level studies (Table 2).
|
Complementarity |
Insignificant |
Substitutability |
Total |
| Firm |
17 |
10 |
11 |
38 |
| Industry |
8 |
3 |
1 |
12 |
| Country |
13 |
6 |
5 |
24 |
| Total |
38 |
19 |
17 |
74 |
Table 2: Meta-evaluation by García-Quevedo (2004)
An explanation for the conflicting results is provided by Kauko (1996: 323) who suggests that "if the problem of endogeneity is avoided in one way or another, public subsidies turn out to be a rather inefficient stimulus for private R&D. Always, when different results have been obtained, the study is potentially biased because of the endogeneity of subsidies.” Kauko (1996: 323) argues that because one of the main determinants of being awarded an R&D subsidy is the R&D investment intention of the firm and because this intention variable is also related with their actual R&D investment decisions, there will always be a statistical relationship between R&D subsidies and R&D intensity although the relationship is in fact due to the intention variable.
The sensitivity of the results to the methodology used is also discussed by Siegel et al. (2003) who call for more sophisticated evaluation techniques. Similarly, Klette et al. (2000) argue that studies with structural models could provide more operational programme management information than currently used non-parametric models. Buigues and Sekkat (2011) provide an extensive literature review of different methods used in policy areas other than innovation policy and lessons for innovation policy evaluation.
More recent studies using macro-level data find no evidence of crowding out of private R&D by public R&D finance or their results are insignificant from the outset or the results are very sensitive to the parameters of the econometric method they employ. Bassanini and Ernst (2002) report in their analysis across 18 OECD countries between 1993 and 1997 that no significant change in private R&D occurred. Falk (2006a: 545) found by using a similar dataset that "direct R&D subsidies and specialisation in high-tech industries also contribute significantly to business-sector intensity, but these effects are only significant using the first-differenced GMM specification." Again by using a very similar dataset, Guellec and Van Pottelsberghe de la Potterie (2003) show that both government and privately financed R&D are complementary up to a subsidisation rate of 10%, but after 20% they substitute. Finally, Coccia (2012) finds positive relationships between public and private R&D expenditure in Italy and a number of other OECD economies. One common shortcoming of macro-level studies is that the variables they use - private R&D spending and publicly financed private R&D spending - do not allow differentiation between different support modalities. However, in most instances, they assume that most of the publicly funded R&D is in the form of grants and therefore the terms 'publicly financed R&D', 'publicly financed private R&D', 'government support', 'grants' and 'subsidies' are used interchangeably.
A number of studies utilise industry level data to assess the impact. Callejón and García-Quevedo (2005) find that while publicly financed R&D increases private R&D expenditures, the effects are more significant in medium-high and medium-low technology industries. Mamuneas and Nadiri (1996: 78) show, in their econometric analysis of industry level data from NSF between 1956 and 1988, that "publicly financed R&D and company-financed R&D are substitutes in low R&D intensive industries, but are weak substitutes in high R&D intensive industries." Analysis of industry level R&D investments in Shanghai for the period 1993-2002 by Zhu et al. (2006) reveals that direct government funding increases R&D investment.
The bulk of the evidence on input additionality uses micro level data. A number of authors looked at project additionality, i.e. whether the project would have happened without the public support. Feldman and Kelley (2003) found positive project additionality in the US Advanced Technology Programme, Falk (2007) calculated project additionality around 70% in the Austrian FFF Programme, Hsu et al. (2009) calculated that 7% of the projects would not have happened in the Taiwanese ITDP Grants and Lenihan and Hart (2004) concluded that the deadweight (projects that would have happened anyway) was 19% in Enterprise Ireland's Programmes. Among those academic studies which find increased spending (i.e. input additionality) are Antonelli (1989), Carboni (2011), González and Pazó (2008: 1402) and Herrera and Bravo Ibarra (2010).
Some evaluation studies reached a similar result: 58% of projects would not have taken place without the Japanese National Research and Development Programme for Medical and Welfare Apparatus (PREST, 2003), 85% of the SMART participants in 2001, 53% in 2003 and 70% in 2009 (PACEC, 2001, 2003, 2009), 25% of the projects that participated in the French ANVAR scheme would have happened anyway (De Laat et al., 2001) while this ratio is 33% for the Austrian FFF programme (KOF et al., 2004).
Among micro-level studies, a number of articles utilise CIS data. The Community Innovation Surveys (CIS) are a series of surveys conducted in EU member states, EFTA countries and EU candidate countries by the national statistical bodies in cooperation with EUROSTAT. The data collection methodology is based on the Oslo Manual (OECD and Eurostat, 2005) and therefore sensu lato compatible with the national innovation surveys conducted in the US, Canada, Australia and other OECD member states. The first CIS took part in 1992, and subsequently in 1996, 2001, 2005, 2007 and 2009. CIS6 was sent to 28,000 UK enterprises with 10 or more employees and the UK response rate was around 50% (BIS, 2012). Among other questions about the characteristics of business and their innovation activities CIS asks if they received any public financial support for innovation activities from various levels of government.
Among CIS based studies, a stream of articles utilises the Mannheim Innovation Panel (i.e. the German contribution to CIS), especially those by Czarnitzki. Aerts and Schmidt (2008) report no crowding out from the econometric analysis of CIS3+4 in Germany and Flanders. Almus and Czarnitzi (2003) found that subsidised firms increased their R&D spending by about 4% (CIS2). In a follow-up analysis of CIS3, Czarnitzki and Licht (2006) reported increased R&D expenditures (more in Eastern German firms who would not have conducted R&D otherwise). In another study that compared East and West Germany, Czarnitzki (2006) found that R&D subsidies in East Germany made SMEs less sensitive to external financial constraints compared to SMEs in West Germany. Czarnitzki and Bento (2012) observed no crowding-out in their analysis of econometric analysis of CIS4+5+6 and monitoring data from the Belgium Flanders IWT Programme. Furthermore, they calculated that R&D spending in supported firms is 3.75% higher than un-supported firms, R&D employment is 9.57% higher than un-supported firms and there is no declining effect in the case of repeated subsidies or finance from other sources. Hussinger (2008) found a 30% increase in private R&D spending. With Spanish CIS data Gelabert et al. (2009) found crowding out in the firms that had higher levels of appropriability (patents, models/designs, trademarks and copyrights, trade secret, design complexity and lead time). Econometric analysis of CIS3 for Norway by Clausen (2009) shows that research subsidies stimulate research expenditure while development subsidies stimulate development expenditures, but not vice versa.
The validity of the CIS has been under academic scrutiny since its introduction and this has allowed a continuous improvement in the survey methodology over time (OECD, 2007; Smith, 2004). However, there are still important reasons why CIS data should be used carefully especially in investigating the impact of government support: CIS does not ask for information on the particular programmes from which firms benefited but asks only if, and at what level, they were supported. Furthermore, CIS data is anonymous and it is not possible to conduct a follow-up survey or a qualitative research programme on the basis of its analysis. For these reasons it is almost impossible to make any contextualisation with regard to the nature of the government intervention.
Another stream of research which examines the input additionality of public support for private R&D is related to the prestige effects of grants in receiving other external finance for R&D. Feldman and Kelley (2003; 2006) report in two articles that the US ATP programme led to a "halo effect" which allows subsidised firms to successfully raise external finance. Similarly, Meuleman and De Maeseneire (2012) found that the Belgian, IWT-Flanders' SME Innovation Programme has a positive signalling effect for debt and equity finance.
The issue of external finance has also been explored by Heijs (2003) who found that 34% of the firms that benefited from the Spanish low interest credits for R&D exhibit free-rider behaviour. The profile of the free-rider firms was not significantly different than other firms (in terms of size, sector, age, etc.).
A number of studies recognise the issue of skewed distribution and the differential characteristics of R&D and innovation direct support measures. However, the characteristics that increase additionality are ambiguous. Firm size is one. An article by Lach (2002) reports no significant effect overall but shows increased R&D spending for small firms and decreases for large firms. Results in González et al. (2005), Özçelik and Taymaz (2008) and Paunov (2012) are positive overall but more significant for small firms. Alecke et al. (2012) reports that in 2003 East German firms in Thuringia increased their R&D spending with public subsidies whilst micro-firms showed the largest increases. Lenihan and Hart (2006) report higher deadweight (amount of subsidies that would have been financed by the firm anyway) for larger domestic firms. However, Cerulli and Potì (2012), in their econometric analysis of Italian firms, found that "Firms that exhibit more additionality are generally larger, more oriented towards patenting and with a lower negative growth of fixed capital accumulation, while the rest tend to exhibit crowding-out".
Other characteristics that influence input additionality are industry sector, dependency on external finance and R&D experience. Lee (2011: 269) found that crowding-out effects in their dataset from Canada, Japan, Korea, Taiwan, India and China are "more likely to be observed for firms with high technological competence, clustered firms, firms operating in industries with low technological opportunities, firms facing low competitive market pressure, firms with a low or accelerating past growth performance and firms without the experience of engaging in collaborative or contract R&D.” Paunov (2012) argues that his results are more significant for new and medium aged firms but not for old firms and for low-tech firms rather than high tech firms. Conversely, Özçelik and Taymaz (2008) report that while firms in all sectors supported by the Turkish TTGV Loan Programme show positive effects, firms in technology intensive sectors have more positive results.
Hyytinen and Toivanen (2005) found in their analysis of Finnish SMEs during 2001-2002 that "firms in industries that are more dependent on external financing invest relatively more in R&D and are relatively more growth-oriented when they have more government funding (potentially) available".
Görg and Strobl (2007) compare domestic and multinational plants in Ireland and find that while there is no evidence of crowding out for multinational plant, large grants substitute private expenditure for domestic plants. In a similar analysis, Lenihan and Hart (2006) calculate 78.4% deadweight for domestic firms and 71.3% for foreign firms that received financial assistance from Shannon Development during 1995.
Econometric analysis of a survey by Paunov (2012) of 1,223 firms across Argentina, Brazil, Chile, Colombia, Costa Rica, Mexico, Peru and Uruguay during the 2008–2009 economic crisis reveals that access to public funding significantly decreased the possibility of abandoning an R&D project due to economic crisis.
While it is highly difficult to reach clear-cut conclusions from the analysis of the literature on input additionality, it appears that macro-level studies find relatively more additionality. There are a number of studies that calculated the project additionality around 70%. While there are also counter examples, smaller firms, firms in relatively low technology sectors and firms from less advanced regions tend to exhibit more input additionality. However, the analysis of the literature shows that the results are mostly statistically insignificant and usually exceedingly sensitive to methodology applied.
The evidence on input additionality is summarised in Table 4 in Annex 2.
4.3.2 Output Additionality
While the literature on the additionality of R&D and innovation direct support measures is dominated by input additionality, there are a growing number of output additionality studies. Unlike input additionality, there are no meta-evaluations relating to this topic and all of the studies are at the micro level (firm, plant, project etc.).
One of the most popular types of output investigated in the literature is innovation performance. In particular, CIS based studies allow the analysis of this variable as they gather information on the quantity of innovations performed by firms. Albors-Garrigos and Barrera (2011: 1315) report a positive relationship between subsidies and innovation performance and quote "organizational regime of the firms, openness to external partners and innovation sources, cooperative skills, innovative behaviour and size (only for high-tech)" as mediating factors in their econometric analysis of CIS3 for Spain. According to Schneider and Veugelers (2010) who analysed young, small highly innovative companies in the German CIS4, while in general average R&D subsidies are statistically associated with higher innovative performance, there is no evidence that this is true for young, small highly innovative companies. Un and Montoro-Sanchez (2010) argue that public funding increases the propensity to innovate but only when combined with firms' own resources. An econometric analysis of the 2005 Survey of Innovation from Statistics Canada by Bérubé and Mohnen (2009) shows that firms receiving tax credits and grants are more innovative (in terms of number innovations, world-first innovations and commercialisation) than firms receiving only tax credits.
Some studies focus on the impact of direct measures on patenting. Alecke et al. (2012) calculates a 20% increase in the probability to apply for a patent (only in SMEs but not in micro firms) in East German firms in Thuringia in 2003. Czarnitzki and Licht (2006) also find increased patenting activity in both East and West Germany. Cerulli and Potì (2012) observe in the Italian Fondo per le Agevolazioni della Ricerca, a "3.5% increase in the number of patents for each additional million euros of the firm's own R&D expenditure" and "firms that exhibit more additionality are generally larger, more oriented towards patenting and with a lower negative growth of fixed capital accumulation, while the rest tends to exhibit crowding-out". Positive and significant impacts on the propensity to patent in Spain were observed by Herrera and Bravo Ibarra (2010). A conflicting result is presented by Gelabert et al. (2009) who identified a negative relationship between public support and appropriability (patents, models/designs, trademarks and copyrights, trade secret, design complexity and lead time) in Spain. Finally, patents in the Swedish soft and hard loan schemes have a higher probability of expiring (due to failure to pay the annual renewal fee) for R&D projects but not for commercialisation projects (Svensson, 2013).
The relationship between productivity and direct R&D and innovation support is also a popular topic in the literature. On the one hand, there are studies that found no productivity increase. Thus an analysis of 779 firms from the Compustat database in the US between 1992 and 1999 by Billings et al. (2004) reveals that productivity of government sponsored R&D is significantly lower than privately financed R&D. According to Czarnitzki and Licht (2006), marginal productivity is lower for publicly financed R&D than firm financed R&D for a sample of firms from Western Germany. In their analysis of UK Regional Selective Assistance and the SMART/SPUR schemes, Harris and Robinson (2004) found that while assisted plants in the Regional Selective Assistance programme increased productivity compared with other plants in the UK, but decreased compared with like-for-like plants, there was no significant productivity difference for plants in the SMART/SPUR programme. In Germany, Hussinger (2008) found no productivity difference in publicly induced R&D expenditure.
In contrast, another set of research produces conflicting results. Colombo et al. (2011) calculate a 31.4% increase in total factor productivity (TFP). The analysis of the Irish Forfas programmes' participants showed that grants increase TFP, plant age is significantly positively associated with increased TFP and financially constrained firms exhibit more TFP increase with grants (Girma et al., 2007). Similarly Grilli and Murtinu (2012) identify that in Italy grants have positive and significant effects on TFP while tax incentives do not. In the only industry level output additionality study, Mamuneas (1999) estimates productivity increase by the spillover of publicly financed R&D in the US.
Among those studies which looked at new products, Hujer and Radić (2005) found insignificant effects on new products and services for large firms and weak significant effects on small and medium size firms in Germany. However, if the method is adjusted, the results became insignificant or negative. In contrast, Herrera and Bravo Ibarra (2010) estimated positive and significant impacts on production in Spain.
Analysis of 242 R&D projects supported under the Japanese NEDO scheme by Aoshima et al. (2011) revealed that receiving government funding hinders commercialisation and, compared with non-subsidized R&D, the use of internal resources is less intense and therefore entails less chance of commercialisation. According to Ebersberger (2011), subsidized firms in the Finnish Tekes programme are significantly less likely to exit than they would be without the subsidy. The analysis also revealed that subsidies do not have a significant effect on the closure of firms: subsidies for innovation do not keep companies alive which would have to close without subsidies.
In two related articles on the Taiwanese ITDP Grants, Hsu and his colleagues (Hsu et al., 2009; Hsueh and Hsu, 2011) found that firms in the biotechnology and pharmaceuticals industry exhibit less output and behavioural additionality and that the aggregated efficiency, technical efficiency and scale efficiency of government supported R&D projects are significantly different in different industries.
Few studies focus on jobs created. In one recent case, Czarnitzki and Bento (2012) calculate that more than 10,000 jobs or 16,800 person/years of R&D employment were created by the Belgium Flanders, IWT Programme. However, evaluation studies tend to cover output additionality more often and in a more comprehensive manner. For instance, among outputs looked at by PACEC (2001) in the SMART programme are prestige, credibility, employment, exports, growth within the companies concerned and their suppliers and subcontractors. For the same measure, PACEC (2009) reported 6,000-9,000 net additional jobs and £400-£600 million net GVA. GVA, net additional jobs, sales and exports were also calculated for SFLG (Cowling, 2010). Similarly, evaluation of Australian R&D Start programme used similar metrics and found positive evidence (Allen Consulting Group, 2000).
As in the case of input additionality, the conclusions of the analysis of output additionality literature are not clear-cut. Output additionality seems to be created when government support is combined with another favourable factor such as the recipient firm's openness, capabilities and capacity and the availability of other forms of support. Direct measures help but they are not sufficient on their own. The conflicting results of output additionality are most probably due to the absence and presence of the other factors. It is less clear how firm size, location, industry and other firm characteristics influence output additionality compared to input additionality. While the academic literature considers a vast array of outputs, evaluation studies are focused on easily communicable indicators such as GVA, employment or exports.
The evidence on output additionality is summarised in Table 5 in Annex 2.
4.3.3 Behavioural Additionality
The concept of behavioural additionality was coined in 1995 by Georghiou and colleagues (Buisseret et al., 1995) to complement the traditional measures of input and output additionality. They argued that the fact that a firm spends more on R&D because of government support (i.e. input additionality) or the amount of outputs it creates with the help of government support (i.e. output additionality) are not sufficient to assess the success of a policy or to design a new one. For the first time, they proposed to analyse what happens inside the firm as a result of the government intervention by asking the question "what difference does policy make in the behaviour of the firms it supports?" (Buisseret et al., 1995).
Since 1995, the concept has attracted a considerable amount of scholarly and policy attention. Around half of the innovation policy evaluations in Europe (conducted between 2002 and 2007) investigated the issue of behavioural additionality implicitly or explicitly (Gök and Edler, 2010; 2012). The concept has been used with four different interpretations: i) an extension of input additionality covering increased scale, scope and acceleration, etc., of the desired outcomes, ii) the change in the non-persistent behaviour related to R&D and innovation activities, iii) the change in the persistent behaviour related to R&D and innovation activities, and iv) the change in the general conduct of the firm with substantial reference to the building blocks of behaviour. The majority of evaluations and scholarly studies discussing the concept of behavioural additionality use collaboration as one of the key, if not the sole, behaviours on which they focused. While these evaluations that focus on collaboration are covered in (Cunningham and Gök, 2012), we have identified further behavioural additionality evidence that is not related to collaboration behaviour.
Cluster analysis by Hsu et al. (2009) indicates that firms supported by the Taiwanese ITP scheme in the biotechnology and pharmaceuticals industry exhibit lower degree of output and behavioural additionality. Based on the analysis of US data, Mamuneas and Nadiri (1996) argue that "new scientific knowledge resulting from government financed R&D expands firms' basic knowledge and thus induces the firms' own R&D"
Falk (2007) estimated that in the absence of the Austrian FFF scheme, 36%-46% of firms would have postponed the starting date of the project, 57%-64% would have had longer project durations, 65%-66% would have had delayed accessibility to project results, and 42%-52% would have had less sophisticated technical demands. Similarly, Özçelik and Taymaz (2008) conclude that the Turkish TTGV loan scheme led to accelerated R&D especially for smaller firms and firms in technology intensive sectors.
In a comparison of the Irish Republic with Northern Ireland, Hewitt-Dundas and Roper (2010) found that extensive additionality (the probability of undertaking innovation) and improved product additionality (incremental innovation) were significant for both domestic and foreign firms in Northern Ireland while this was significant only for domestic firms in the Republic of Ireland.
In 1977, Rubenstein et al. (1977: 356) identified that governments support only marginally successful projects and hesitate to support high risk high gain projects. The conclusion of a 2011 econometric analysis of CIS3 for Spain by Albors-Garrigos and Barrera (2011: 1315) is very similar: "only firms with more sophisticated innovative behaviour and skills to develop external sources and cooperation linkages perform better innovation-wise and therefore the subsidies received have a higher impact" In contrast, however, Feldman and Kelley (2003) report that the US ATP programme stimulates higher risk projects.
Five studies in OECD's pilot project to measure behavioural additionality (OECD, 2006) are related with direct measures (Table 3). This study classified behavioural additionality consisting of the following dimensions:
- Project Additionality (Project launch): this was mentioned in relation to input additionality above. The results of the evaluation of 5 programmes ranges between 28% and 58%.
- Acceleration Additionality (Accelerated schedule): 16% to 100% of the projects would have been conducted more slowly.
- Scale and Scope Additionality (Expanded scale & scope): 46% - 92% of the projects would have been in a smaller scale or scope
- Challenge Additionality (More challenging research): Between 48% and 78% of the projects would have been less challenging.
- Network Additionality (More collaboration): 42%-78% would have been less collaborative.
- Follow-up Additionality (Project follow-up): a significant portion of projects were followed by other projects.
- Management Additionality (Improved management): increased levels of various management practices
The summary of evidence in each of these dimensions is presented in Table 3.
| Measure |
Reference |
Project Additionality (Project launch) |
Acceleration Additionality (Accelerated schedule) |
Scale and Scope Additionality (Expanded scale & scope) |
Challenge Additionality (More challenging research) |
Network Additionality (More collaboration) |
Follow-up Additionality (Project follow-up) |
Management Additionality (Improved management) |
| Australia R&D Start Programme |
Department of Industry Tourism and Resources of Australia (2006) |
• 37% would have cancelled. |
• 100% would have taken longer |
• 92% would have scaled down. |
• 78% would have been less challenging
• 64% would have reduced range of applications. |
• 67% formed new collaboration with another company
• 48% formed new collaboration with universities or research institutes. |
• 87% participated in subsequent government programmes |
• 70% introduced entrenched changes in R&D management, 60% enhanced their commitment to R&D, 56% improved their understanding of benefits of R&D, 50% changed commercial strategy |
| Austria Austrian Federal R&D Support Scheme (FFF) |
Falk (2006b) |
• 28% would have cancelled (31% did cancel)
• 61% would have sought alternative funds (25% did seek alternative funds). |
• 32% would have postponed (43% did postpone).
51% would have taken longer (61% did take longer). |
• 74% would have scaled down (60% did scale down). |
• 49% would have been less challenging (40% were less challenging). |
• 51%/55% collaborated with public research organisations/other firms. |
• 43% resulted in subsequent activities. 63% extended R&D into new areas. |
|
| Finland Tekes Funding Programme |
Hyvärinen (2006) |
• 20% would have cancelled. |
|
• 46% would have scaled down. |
• 48% of projects were too risky to carry out alone.
73% would have reduced technical ambition. |
• 53% strengthened collaborative networks.
50% collaborated with research institutes. 35% increased subcontracting. |
|
• 44% affected long-term business strategies.
53% doing R&D not connected to short-term business strategy. |
| Germany Public R&D Project Funding |
Fier et al. (2006) |
• With government funding, 53% sped up project launch; 28% sped up project implementation. |
|
• With government funding, 55% extended project size. |
• With government funding, 60% pursued more technically challenging projects. |
• 78%/74% intensified collaboration with research institutes /industry.
• 42%/58% formed new collaboration with research institutes/industry. |
.... but new networks do not necessarily last long after funding has ended. |
• 66% changed R&D management as a result of public funding procedures |
| Norway Loans and Grants from Innovation Norway |
Madsen and Brastad (2006) |
• 53% would have cancelled. |
• 16% would have slowed the R&D. |
|
|
|
• 67% increased competence, usually in product development. |
|
Table 3: Evidence on Behavioural Additionality of Direct Measures in OECD (2006)
Again it is highly difficult to reach a conclusion from the analysis of the behavioural additionality studies. Unlike input and output additionality, behavioural additionality studies always report positive results (while negative behavioural additionality has been discussed in the literature, there is no empirical study that examines it) and they use a wider range of indicators (i.e. behaviour types). While this represents an answer to the call for experimentation to broaden our understanding of the impact of the innovation policy by Edler et al. (2012) and Edler and Guy (2010), there is also the danger of misuse of the notion of behavioural additionality. Gök and Edler (2012), in their study which identified three types of use of behavioural additionality evaluations in innovation policy-making, illustrate that sometimes behavioural additionality is used to cover up suboptimal performance in input and output additionality. As behavioural additionality can be defined in a variety of ways, sometimes evaluators bend the definition of the concept and use behavioural additionality as a means to demonstrate a positive result. A final conclusion related to the impact of the direct measures on behavioural additionality is that although there is a wide variety of effects under this heading, almost all of the studies fail to explain the dynamics of these effects. They focus too much on the questions of how much and by whom and fail to explore why and how. This, in turn, limits the explanatory power of the concept.
The evidence on behavioural additionality is summarised in Table 6 in Annex 2.
5 Lessons and Conclusions
Programmes directly supporting the R&D efforts of individual firms have a long history in OECD countries. Their rationale has long been associated with the importance of spillovers from private R&D. This drives firms to limit their R&D investments and thus the ambition of such programmes is, at the macro-level, to insure a 'better' social optimum, and, at the meso- and micro-levels, to reinforce the competitiveness of industries and firms, meaning both greater exports (and a better balance of payments) and more jobs. These public programmes can be generic (covering all types of firms and all sectors) or targeted (considering specific types of firms, specific industries or problems). While these direct programmes constituted the core of public intervention towards firms in the 1960s and 1970s, they have since been superseded by indirect instruments (mainly tax credits) and by collaborative programmes that fund groups of actors. They thus are now one instrument in the wide portfolio of supply-side instruments.
Before addressing the evidence gathered about these direct programmes, two comments are worth making:
i. The generic programmes addressing all sectors have tended to continue over time, often entailing a professionalisation of their management through agencies or foundations, but they have focused on smaller firms, mostly SME and sometimes mid-size firms; large firms have thus been progressively excluded from such support. This trend has been reinforced by the progressive closure of so-called 'large programmes' in high tech industries that tended to support 'national champions'. In most countries, these 'generic' programmes now represent the core direct support to firms. This does not mean that there are less sector- or industry-targeted programmes; rather, the latter mostly operate through collaborative research activities and their importance is now such that we have devoted a specific report to them elsewhere in this compendium.
ii. The evidence gathered for this study comes both from evaluations and from academic studies. While in the case of tax credits both were strongly articulated, this is not usual here: there are very few econometric studies in the evaluations we have found, and many academic articles do not address a specific programme or type of intervention but rather any of a range of types of public support received by firms (this is in large part driven by the use of CIS studies). This leads to a de facto quasi specialisation: evaluations focus on the continued relevance of the rationale of the intervention and on its implementation performance, while academic articles mostly focus on input additionality, and to a lesser extent on output additionality.
We now examine in turn the evidence gathered and the lessons derived from it. It is organised in four main points.
1The first major lesson is linked to the duration of direct support programmes (especially the generic ones). Policymakers regularly require a check on the continued relevance of the rationale and objectives of such programmes consequently evaluations devote an important share of their effort to this point. This is usually done through surveys that test the opinions of recipients (sometimes also using control groups of failed applicants) This approach has a number of disadvantages, particularly in cases where there may be a perceived advantage if the respondent reacts in a positive way to the support. In addition, statements about prospective or potential additionality (i.e. the project would not have gone ahead without funding) cannot be subject to verification. Similarly, there are also problems associated with the use of alternative approaches such as control groups and counter-factual analyses.
2There is a clear convergence of most evaluations around certain results. In the vast majority of cases, the projects supported would not have been started, or would have been done more slowly, with less depth and with a lower level of technological input/output. The younger and the smaller the firm, the more convincing the results are. Thus, the broader the coverage of firm size, the more 'deadweight', that is the greater the number of firms who would have performed the project in the same way without public support. This may well explain why there has been a general trend to focus these direct support programmes towards smaller sized or younger firms.
3The recent OECD review (2011) highlights the fact that the success of programmes heavily depends upon their implementation, and within it, especially on the selection processes employed. The latter point is deemed crucial by a number of evaluations since it drives uptake. One central conclusion can be derived from this analysis: the selection process (the criteria defined, the information required, the selection mechanism) de facto entails a bias towards certain firm characteristics - firms with an established experience in R&D and firms that have already received a public grant seem to be far more successful in these programmes. This drives a number of evaluations to push programme management to be more pro-active in their relations with potential applicants, provide them with advice at the proposal level, and organise complementary services, including training or support for marketing. The latter are even considered by some evaluations as a key feature for the long-term impact of the programme.
Of course the usual caveat applies: there is almost no evaluation that does not ask for less bureaucracy, more simplification and reduced time lags; but at the same time the same evaluations ask for more information to be gathered, more monitoring. In one word this is probably the greatest inconsistency found in most recommendations leaving policy makers with their own responsibility in establishing a trade-off that will not be detrimental to the attractiveness of the programme. One element emerges in numerous evaluations - the issue of stability and a quest for policymakers to stop changing the eligibility criteria, or the delivery process, etc., each time there is a change of minister or a shift in ministerial responsibilities. Conversely, it may be argued that a certain degree of novelty can remove tendencies towards inertia and closed networks of beneficiaries.
An important final note on implementation; a few studies have looked at the complementarity between direct and indirect support. They all point to a far greater success for (small) firms in measures that combine both, each having its specific interest. Thus, the direct support appears to drive higher levels of technological development and the use of more advanced technologies, while the indirect support covers the other aspects of the development process.
4Input additionality – that is, more R&D spending being associated with public support – is the cornerstone of most of the academic work done to test whether these programmes are useful or not for the economy. The most extensive review made, García-Quevedo (2004) revealed that, out of 74 studies analysed, 38 indicated complementarity (i.e. public financing increases private financing), 17 substitutability and that the results were insignificant in 19 studies. Crowding-out is more often found in studies that focus at the firm level rather than in studies that directly address industry-level or entire countries.
Academic studies have thus tried to explain these contradictory results.
- One alley is to consider the overall level of public funding in total BERD: Guellec and Van Pottelsberghe de la Potterie (2003) argue that both government and privately financed R&D are complementary up to a subsidisation rate of 10%, but after 20% they fully substitute. Given the prevailing budgetary situation in OECD countries and the present balance, one could thus be optimistic about the overall usefulness of such programmes.
- Another attempt has been to consider the type of industries and the effects upon them. It seems, from Spanish studies, that effects are greater in the medium technology industries (both low and high) compared to truly high or low technology industries. One could well explain these results along two complementary lines: small, young, high tech firms require far more than simply financial support: incubators, science parks, business angels and seed capital are known to be critical for their success (see corresponding report in this compendium), the funding by direct programmes comes then as a complement, and is only productive if the rest of the entrepreneurial ecology is there. On the low tech side, industrial technical centres and industrial districts (the Italian way) or clusters have demonstrated their effectiveness in pushing competitiveness: direct project funding becomes productive mostly when these other dimensions are present to raise the firms' technological capabilities. Thus in both cases we find a similar argument as mentioned before: performance is not an issue of a single measure but of a combination of measures. However these two cases show us the variety of complementary measures that need to be in place, and the spectrum of the policy mix to be in a position to address these different situations.
- It also seems that the wider context in which firms operate may play a significant role (this was demonstrated by comparing the effects on small firms from the former West and East Germanies). This could have potentially important implications for taking regional differences into account.
- The issue of firm size has been analysed in cases where all types of firms were supported. A powerful evaluation of the Israeli programmes (Lach, 2002; Trajtenberg, 2002) again finds similar results as those evaluations dealing with the relevance of the rationale (see conclusion 1 above). The authors underline the important deadweight, linked to large domestic firms which counterbalances the very positive effects on small firms.
- Finally, several evaluations highlight the 'halo' effect (one form of support acting as a proof of credibility for the firm and helping it to access complementary resources). The support operates as a quasi-rating, and the importance of ratings in order to access finance is currently a major focus of economic discussions!
Overall, the findings from the evaluations suggest two strategies: one is to better target the audience of the programme (but at the risk of accusations of picking winners), and the other is to make sure the measure is inserted in a portfolio of complementary public interventions that will enhance both the probability of success and a greater and longer lasting impact.
5Doing more R&D is however not enough. What matters, is that this increased effort should materialise in new products or services in the market, new market shares, increased exports and through these the creation of new jobs (output additionality) and that the learning and changes associated with undertaking the project remain thereby entailing behavioural changes and additionality. Do we have evidence for this? Unfortunately there is not much and what is there is not clear-cut. Few studies have analysed the quantity of new products and/or of patents, even fewer have compared total factor productivity and nearly none have directly addressed behavioural changes. Whatever the criterion, results differ widely between countries. For instance there are opposite results for TFP between the US and Germany on the negative side versus Italy and Ireland on the positive side. Very few studies (Flanders, Australia) consider job creation; these find it is positive for the firms supported but little is known at the overall level of the industry, the region or the country. Only one study (Roper and Hewitt-Dundas, 2012) deals with the lasting effects: they found, for the Irish Republic and Northern Ireland, extensive additionality (the probability of undertaking innovation) and improved product additionality (incremental innovation). This clearly tells us about the importance of making efforts in order to better appraise the effective impact of programmes that directly support the RDI efforts of individual firms. Thus, there is a rationale for the use of long-term ex post evaluation studies together with periodic, qualitative, in-depth case studies.
6 References
Aerts, K., Schmidt, T., 2008. Two for the price of one?. Additionality effects of R&D subsidies: A comparison between Flanders and Germany. Research Policy 37, 806-822.
Albors-Garrigos, J., Barrera, R.R., 2011. Impact of public funding on a firm's innovation performance. Analysis of internal and external moderating factors. International Journal of Innovation Management 15, 1297-1322.
Alecke, B., Mitze, T., Reinkowski, J., Untiedt, G., 2012. Does Firm Size make a Difference? Analysing the Effectiveness of R&D Subsidies in East Germany. German Economic Review 13, 174-195.
Allen Consulting Group, 2000. Evaluation of the [Australian] R&D Start Program, Final Report to the Department of Industry Science and Resources.
Almus, M., Czarnitzki, D., 2003. The effects of public R and D subsidies on firms' innovation activities: The case of Eastern Germany. Journal of Business and Economic Statistics 21, 226-236.
Antonelli, C., 1989. A failure-inducement model of research and development expenditure. Italian evidence from the early 1980s. Journal of Economic Behavior and Organization 12, 159-180.
Aoshima, Y., Matsushima, K., Eto, M., 2011. Commercialization of government funded R&D: Follow-up research survey on NEDO research projects, Portland, OR.
Arrow, K., 1962. Economic Welfare and the Allocation of Resources for Invention, in: Nelson, R. (Ed.), The Rate and Direction of Inventive Activity. Princeton University Press, Princeton.
Åström, T., Jansson, T., Niklasson, L., Faugert, S., 2008. Evaluation of the Manufacturing Engineering Research Area (MERA) Programme. VINNOVA.
Bach, L., Matt, M., 2002. Rationale for Science & Technology Policy, in: Georghiou, L., Rigby, J., Cameron, H. (Eds.), Assessing the Socio-Economic Impacts of the Framework Programme (ASIF). Report to European Commission DG Research, pp. 93-145.
Bach, L., Matt, M., 2005. From Economic Foundations to S&T Policy Tools: a Comparative Analysis of the Dominant Paradigms, in: Llerena, P., Matt, M. (Eds.), Innovation Policy in a Knowledge-Based Economy: Theory and Practice. Springer, Berlin Heidelberg.
Barber, J., Brinkley, B., Hills, P., 1994. An evaluation of the Small firms Merit Award for Research and Technology (SMART). Department of Trade and Industry Research and Technology Policy Assessment Unit, London.
Bassanini, A., Ernst, E., 2002. Labour market regulation, industrial relations and technological regimes: a tale of comparative advantage. Industrial and Corporate Change 11, 391-426.
Bérubé, C., Mohnen, P., 2009. Are firms that receive R&D subsidies more innovative? Canadian Journal of Economics 42, 206-225.
Billings, B.A., Musazi, B.G.N., Moore, J.W., 2004. The effects of funding source and management ownership on the productivity of R&D. R and D Management 34, 281-294.
BIS, 2012. The Community Innovation Survey.
## References

Blanes, J.V., Busom, I., 2004. Who participates in R&D subsidy programs?: The case of Spanish manufacturing firms. Research Policy 33, 1459-1476.

Hansen, T.B., Karlsson, T., Godø, H., 2005. Evaluation of the DEMO 2000 program, RAPPORT 7/2005. NIFUSTEP, Oslo.

Bozeman, B., Dietz, J.S., 2001. Research Policy Trends in the United States, in: Laredo, P., Mustar, P. (Eds.), Research and innovation policy in the new global economy, an international comparative analysis. Edward Elgar, Cheltenham, pp. 47-78.

Buigues, P.A., Sekkat, K., 2011. Public Subsidies to Business: An International Comparison. Journal of Industry, Competition and Trade 11, 1-24.

Buisseret, T.J., Cameron, H.M., Georghiou, L., 1995. What Difference Does It Make - Additionality in The Public Support Of R&D In Large Firms. International Journal of Technology Management 10, 587-600.

Callejón, M., García-Quevedo, J., 2005. Public subsidies to business R&D: Do they stimulate private expenditures? Environment and Planning C: Government and Policy 23, 279-293.

Callon, M., Laredo, P., Mustar, P., 1997. The Strategic Management of Research and Technology. Economica International, Paris.

Carboni, O.A., 2011. R&D subsidies and private R&D expenditures: Evidence from Italian manufacturing data. International Review of Applied Economics 25, 419-439.

Cerulli, G., Potì, B., 2012. The differential impact of privately and publicly funded R&D on R&D investment and innovation: The Italian case. Prometheus 30, 113-149.

Clausen, T.H., 2009. Do subsidies have positive impacts on R&D and innovation activities at the firm level? Structural Change and Economic Dynamics 20, 239-253.

Coccia, M., 2012. Political economy of R&D to support the modern competitiveness of nations and determinants of economic optimization and inertia. Technovation 32, 370-379.

Colombo, M.G., Grilli, L., Murtinu, S., 2011. R&D subsidies and the performance of high-tech start-ups. Economics Letters 112, 97-99.

Cowling, M., 2010. Economic Evaluation of the Small Firms Loan Guarantee (SFLG) Scheme. Institute for Employment Studies.

Cressy, R., 2001. Review of Policy to Help SMEs Develop and Apply New Technologies. Unpublished report to the Small Business Service.

Cunningham, P., Gök, A., 2012. Compendium of Evidence on the Effectiveness of Innovation Policy Intervention: Impact of Innovation Policy Schemes for Collaboration. NESTA and Manchester Institute of Innovation Research, London and Manchester.

Cunningham, P., Ramlogan, R., 2012. Compendium of Evidence on the Effectiveness of Innovation Policy Intervention: Innovation Networks. NESTA and Manchester Institute of Innovation Research, London and Manchester.

Cunningham, P.N., Neves, E., Robson, D., 2008. INNO-Learning Platform: Mini-Study 1: Mapping of Innovation Support Measures. European Commission, Directorate General for Enterprise.

Czarnitzki, D., 2006. Research and development in small and medium-sized enterprises: The role of financial constraints and public funding. Scottish Journal of Political Economy 53, 335-357.

Czarnitzki, D., Bento, C.L., 2012. Value for money? New microeconometric evidence on public R&D grants in Flanders. IWT Studies.

Czarnitzki, D., Licht, G., 2006. Additionality of public R&D grants in a transition economy: The case of Eastern Germany. Economics of Transition 14, 101-131.

David, P.A., Hall, B.H., Toole, A.A., 2000. Is public R&D a complement or substitute for private R&D? a review of the econometric evidence. Research Policy 29, 497-529.

De Laat, B., Warta, K., Williams, K., 2001. Evaluation of ANVAR’s “Procédure d'aide au projet d'innovation”, 1993 - 1999, Paper presented at the OECD, Paris, 4 November 2001.

Department of Industry Tourism and Resources of Australia, 2006. Behavioural Additionality of Business R&D Grant Programmes in Australia, in: OECD (Ed.), Government R&D Funding and Company Behaviour: Measuring Behavioural Additionality. OECD, Paris.

Deuten, J., Hiltunen, M.P., 2011. Peer Review of ZIM, the Central Innovation Programme for SMEs (Zentrales Innovationsprogramm Mittelstand), INNO-Partnering Forum.

Ebersberger, B., 2011. Public funding for innovation and the exit of firms. Journal of Evolutionary Economics 21, 519-543.

Edler, J., Berger, M., Dinges, M., Gök, A., 2012. The practice of evaluation in innovation policy in Europe. Research Evaluation 21, 167-182.

Edler, J., Guy, K., 2010. Conclusions and Ways Forward, in: Edler, J. (Ed.), INNO-Appraisal Final Report. Report to EC DG Enterprise and Industry, Manchester.

Edler, J., Rigby, J., 2012. Compendium of Evidence on the Effectiveness of Innovation Policy Intervention: Demand driven innovation and public procurement. NESTA and Manchester Institute of Innovation Research, London and Manchester.

European Commission, 2003. Raising EU R&D Intensity: Improving the Effectiveness of the Mix of Public Support Mechanisms for Private Sector Research and Development. European Commission EUR 20716, Brussels.

Evaltec, 2003. Review of the Irish Development Agency's Research and Development Capability Grants Scheme.

Falk, M., 2006a. What drives business Research and Development (R&D) intensity across Organisation for Economic Co-operation and Development (OECD) countries? Applied Economics 38, 533-547.

Falk, R., 2006b. Behavioural Additionality of Austria's Industrial Research Promotion Fund (FFF), in: OECD (Ed.), Government R&D Funding and Company Behaviour: Measuring Behavioural Additionality. OECD, Paris.

Falk, R., 2007. Measuring the effects of public support schemes on firms' innovation activities. Survey evidence from Austria. Research Policy 36, 665-679.

Feldman, M.P., Kelley, M.R., 2003. Leveraging Research and Development: Assessing the Impact of the U.S. Advanced Technology Program. Small Business Economics 20, 153-165.

Feldman, M.P., Kelley, M.R., 2006. The ex ante assessment of knowledge spillovers: Government R&D policy, economic incentives and private firm behavior. Research Policy 35, 1509-1521.

Fier, A., Aschhoff, B., Löhlein, H., 2006. Behavioural Additionality of Public R&D Funding in Germany, in: OECD (Ed.), Government R&D Funding and Company Behaviour: Measuring Behavioural Additionality. OECD, Paris.

Furtado, C., 1964. Development and Underdevelopment. University of California Press, Berkeley.

García-Quevedo, J., 2004. Do public subsidies complement business R&D? A meta-analysis of the econometric evidence. Kyklos 57, 87-102.

Gelabert, L., Fosfuri, A., TribÓ, J.A., 2009. Does the effect of public support for r & d depend on the degree of appropriability? Journal of Industrial Economics 57, 736-767.

Georghiou, L., 2004. Evaluation of Behavioural Additionality. Concept Paper. IWT-Studies 48, 7-22.

Georghiou, L., 2007. What lies beneath: Avoiding the risk of under-evaluation. Science and Public Policy 34, 743-752.

Georghiou, L., Clarysse, B., 2006. Introduction and Synthesis, in: OECD (Ed.), Government R&D Funding and Company Behaviour: Measuring Behavioural Additionality. OECD Publishing, Paris.

Giebe, T., Grebe, T., Wolfstetter, E., 2006. How to allocate R&D (and other) subsidies: An experimentally tested policy recommendation. Research Policy, 1261–1272.

Girma, S., Görg, H., Strobl, E., 2007. The effect of government grants on plant level productivity. Economics Letters 94, 439-444.

Gök, A., 2010. An Evolutionary Approach to Innovation Policy Evaluation: Behavioural Additionality and Organisational Routines, PREST. The University of Manchester, Manchester.

Gök, A., Edler, J., 2010. Exploring the Use of Behavioural Additionality, in: Edler, J. (Ed.), INNO-Appraisal: Understanding Evaluation of Innovation Policy in Europe. Report to EC DG Enterprise and Industry, Brussels.

Gök, A., Edler, J., 2012. The Use of Behavioural Additionality Evaluation in Innovation Policy-Making. Research Evaluation forthcoming.

González, X., Jaumandreu, J., Pazó, C., 2005. Barriers to innovation and subsidy effectiveness. RAND Journal of Economics 36, 930-950.

González, X., Pazó, C., 2008. Do public subsidies stimulate private R&D spending? Research Policy 37, 371-389.

Görg, H., Strobl, E., 2007. The effect of R&D subsidies on private R&D. Economica 74, 215-234.

Griliches, Z., 1958. Research costs and social returns: hybrid corn and related innovations. The Journal of Political Economy 66, 419-413.

Griliches, Z., 1992. The search for R&D spillovers. Scandinavian Journal of Economics, 29-47.

Grilli, L., Murtinu, S., 2012. Do public subsidies affect the performance of new technologybased firms? The importance of evaluation schemes and agency goals. Prometheus 30, 97-111.

Guellec, D., Van Pottelsberghe De La Potterie, B., 2003. The impact of public R&D expenditure on business R&D*. Economics of Innovation and New Technology 12, 225-243.

Hall, B.H., 2002. The assessment: Technology policy. Oxford Review of Economic Policy 18, 1-9.

Harris, R., Robinson, C., 2004. Industrial policy in great Britain and its effect on total factor productivity in manufacturing plants, 1990-1998. Scottish Journal of Political Economy 51, 528-543.

Heijs, J., 2003. Freerider behaviour and the public finance of R & D activities in enterprises: The case of the Spanish low interest credits for R & D. Research Policy 32, 445-461.

Herrera, L., Bravo Ibarra, E.R., 2010. Distribution and effect of R&D subsidies: A comparative analysis according to firm size. Intangible Capital 6, 272-299.

Hewitt-Dundas, N., Roper, S., 2010. Output additionality of public support for innovation: Evidence for Irish manufacturing plants. European Planning Studies 18, 107-122.

Hsu, F.M., Horng, D.J., Hsueh, C.C., 2009. The effect of government-sponsored R&D programmes on additionality in recipient firms in Taiwan. Technovation 29, 204-217.

Hsueh, C.C., Hsu, F.M., 2011. Efficiency and advantage of government-sponsored R&D projects: An inter-industry comparison, San Jose, CA, pp. 231-238.

Huergo, E., Trenado, M., 2010. The Application for and the Awarding of Low-Interest Credits to Finance R&D Projects. Review of Industrial Organization 37, 237-259.

Huergo, E., Trenado, M., Ubierna, A., 2009. Impacto de los créditos blandos en el gasto en I+D empresarial: La empresa española y el apoyo del CDTI ala I+D+I. CDTI, Universidad Complutense.

Hujer, R., Radić, D., 2005. Evaluating the impacts of subsidies on innovation activities in Germany. Scottish Journal of Political Economy 52, 565-586.

Hussinger, K., 2008. R&D and subsidies at the firm level: An application of parametric and semiparametric two-step selection models. Journal of Applied Econometrics 23, 729-747.

Hyvärinen, J., 2006. Behavioural Additionality of Public R&D Funding in Finland, in: OECD (Ed.). Government R&D Funding and Company Behaviour: Measuring Behavioural Additionality. OECD, Paris.

Hyytinen, A., Toivanen, O., 2005. Do financial constraints hold back innovation and growth?: Evidence on the role of public policy. Research Policy 34, 1385-1403.

Kauko, K., 1996. Effectiveness of R & D subsidies - A sceptical note on the empirical literature. Research Policy 25, 321-323.

Klette, T.J., Møen, J., Griliches, Z., 2000. Do subsidies to commercial R&D reduce market failures? Microeconometric evaluation studies. Research Policy 29, 471-495.

KOF, Joanneum Research, Technopolis, Universiteit Twente, 2004. Evaluation of the Austrian Industrial Research Promotion Fund (FFF) and the Austrian Science Fund (FWF). WIFO, Vienna.

Köhler, C., Rammer, C., Larédo, P., 2012. Compendium of Evidence on the Effectiveness of Innovation Policy Intervention: Fiscal Incentives for Business R&D. NESTA and Manchester Institute of Innovation Research, London and Manchester.

Lach, S., 2002. Do R & D subsidies stimulate or displace private R & D? Evidence from Israel. Journal of Industrial Economics 50, 369-390.

Lee, C.Y., 2011. The differential effects of public R&D support on firm R&D: Theory and evidence from multi-country data. Technovation 31, 256-269.

Lemola, T., Lievonen, J., 2008. The role of innovation policy in fostering open innovation activities among companies.

Lenihan, H., Hart, M., 2004. The use of counterfactual scenarios as a means to assess policy deadweight: An Irish case study. Environment and Planning C: Government and Policy 22, 817-839.

Lenihan, H., Hart, M., 2006. Evaluating the additionality of public sector assistance to irish firms: A question of ownership? Policy Studies 27, 115-133.

Lipsey, R.G., 2002. Some Implications of Endogenous Technological Change for Technology Policies in Developing Countries. Economics of Innovation and New Technology 11, 321 - 351.

Lipsey, R.G., Carlaw, K., 1998a. A Structuralist Assesment of Technology Policies: Taking Schumpeter Seriously on Policy. Industry Canada, Ottawa.

Lipsey, R.G., Carlaw, K., 1998b. Technology Policies in Neo-Classical and Structuralist-Evolutionary Models. OECD Science Technology and Industry Review 22 (Special Issue on "New Rationale and Approaches in Technology and Innovation Policy"), 30-73.

Lipsey, R.G., Carlaw, K., 2002. The Conceptual Basis of Technology Policy, Department of Economics Discussion Papers. Simon Fraser University Vancouver.

Lipsey, R.G., Carlaw, K.I., Bekar, C.T., 2005. Economic Transformations: General Purpose Technologies and Long Term Economic Growth. Oxford University Press, New York.

List, F., 1841. National Systems of Political Economy, English (1904) ed. Longman, London.

Madsen, E.L., Brastad, B., 2006. Behavioural Additionality of Innovation Norway's Financial Support Programmes, in: OECD (Ed.), Government R&D Funding and Company Behaviour: Measuring Behavioural Additionality. OECD, Paris.

Mamuneas, T.P., 1999. Spillovers from publicly financed R&D capital in high-tech industries. International Journal of Industrial Organization 17, 215-239.

Mamuneas, T.P., Nadiri, M.I., 1996. Public R&D policies and cost behavior of the US manufacturing industries. Journal of Public Economics 63, 57-81.

Mazzoleni, R., Nelson, R., 2007. Public research institutions and economic catch-up. Research Policy, 1512-1528.

Meuleman, M., De Maeseneire, W., 2012. Do R&D subsidies affect SMEs' access to external financing? Research Policy 41, 580-591.

National Research Council of Canada, 2007. Impact Evaluation of the NRC Industrial Research Assistance Program (NRC-IRAP).

Nelson, R.R., 1959. The Simple Economics of Basic Scientific Research. The Journal of Political Economy 67, 297-306.

Oakey, R.P., 2000. Policies to help small and medium sized firms to develop and apply new technology. PACEC.

OECD, 2006. Government R&D Funding and Company Behaviour: Measuring Behavioural Additionality. OECD Publishing, Paris, p. 246.

OECD, 2007. Science, Technology And Innovation Indicators In A Changing World: Responding to Policy Needs. OECD Publishing.

OECD, 2011. Business Innovation Activities - Selected Country Comparisons. OECD, Paris.

OECD, Eurostat, 2005. OECD Proposed Guidelines for Collecting and Interpreting Technological Innovation Data: Oslo Manual 3rd Edition. OECD, Paris.

OMB Research, 2010. Small Firms Loan Guarantee (SFLG) Scheme Recipient and Comparison Group Survey Results,. Department for Business, Innovation and Skills URN 10/511.

Özçelik, E., Taymaz, E., 2008. R&D support programs in developing countries: The Turkish experience. Research Policy 37, 258-275.

PACEC, 2001. Evaluation of Smart. DTI Publications: Small Business Service.

PACEC, 2003. Evaluation on the Skills Impact of the Smart Scheme (Final Report). Department of Trade and Industry.

PACEC, 2009. Evaluation of Grant for Research and Development & Smart. DIUS/LDA URN 09/1059, London.

Paunov, C., 2012. The global crisis and firms' investments in innovation. Research Policy 41, 24-35.

PREST, 2003. Evaluation of National Research and Development Programme for Medical and Welfare Apparatus. Japanese Ministry for Economics, Trade and Industry.

Raivio, T., Lunabba, J., Ryynanen, E., Timonen, J., Antikainen, M., Laner, S., 2012. Software, mobile solutions and games industry: Evaluation of Tekes Software-related programmes. Tekes, Helsinki.

Reid, A., Cunningham, P.N., Edler, J., Kamburow, T., Simmonds, P., 2012. Evaluation of Innovation Activities. Guidance on methods and practices. European Commission, Directorate-General for Regional Policy.

Rigby, J., Ramlogan, R., 2012. Compendium of Evidence on the Effectiveness of Innovation Policy Intervention: Support Measures for Exploiting Intellectual Property. NESTA and Manchester Institute of Innovation Research, London and Manchester.

Rogers, E.M., 1962. Diffusion of innovations. The Free Press, New York.

Roper, S., Hewitt-Dundas, N., 2012. Does additionality persist? A panel data investigation of the legacy effects of public support for innovation?, Manchester Institute of Innovation Research Seminar Series: 11/09/2012, Manchester, UK.

Rubenstein, A.H., Douds, C.F., Geschka, H., Kawase, T., Miller, J.P., Saintpaul, R., Watkins, D., 1977. Management perceptions of government incentives to technological innovation in England, France, West Germany and Japan. Research Policy 6, 324-357.

Schneider, C., Veugelers, R., 2010. On young highly innovative companies: Why they matter and how (not) to policy support them. Industrial and Corporate Change 19, 969-1007.

Siegel, D.S., Wessner, C., Binks, M., Lockett, A., 2003. Policies Promoting Innovation in Small Firms: Evidence from the U.S. and U.K. Small Business Economics 20, 121-127.

Smith, K., 2004. Measuring Innovation, in: Fagerberg, J., Mowery, D.C., Nelson, R.R. (Eds.), The Oxford Handbook of Innovation. Oxford University Press, Oxford.

Soriano, D.R., Peris-Ortiz, M., 2011. Subsidizing technology: How to succeed. Journal of Business Research 64, 1224-1228.

SQW Consulting, 2009. Synthesis of Evaluation Evidence: Final report Department for Business, Enterprise and Regulatory Reform.

Steurs, G., Verbeek, A., Vermeulen, H., Clarysse, B., 2006. A look into the Black Box What difference do IWT R&D grants make for their clients? . IWT Studies 56.

Stoneman, P., Vickers, J., 1988. The assessment: the economics of technology policy. Oxford Review of Economic Policy 4, 1-16.

Svensson, R., 2013. Publicly-funded R&D programs and survival of patents. Applied Economics 45, 1343-1358.

Trajtenberg, M., 2002. Government Support for Commercial R&D: Lessons from the Israeli Experience, in: A.B. Jaffe, J. Lerner and S. Stern (Eds.), Innovation Policy and the Economy, Volume 2. MIT Press, Cambridge.

Tsipouri, L., Reid, A., Arundel, A., Hollanders, H., 2006. European Innovation Progress Report. European Commission DG Enterprise and Industry, Brussels.

Tsipouri, L., Reid, A., Mannik, K., Rannala, R., Ruiz Yaniz, M., Bruno, N., Elci, S., 2009. European Innovation Progress Report. European Commission DG Enterprise and Industry, Brussels.

Un, C.A., Montoro-Sanchez, A., 2010. Public funding for product, process and organisational innovation in service industries. Service Industries Journal 30, 133-147.

Zhu, P., Xu, W., Lundin, N., 2006. The impact of government's fundings and tax incentives on industrial R&D investments - Empirical evidences from industrial sectors in Shanghai. China Economic Review 17,51-69.

## Annex 1: Direct support measures: impacts {: #annex-1 }

<div class="table-container" markdown="1">

| Programme | short-term/immediate | medium-term, broader | longer-term, broad | Reference |
|:----------|:---------------------|:---------------------|:-------------------|:----------|
| ANVAR: Procédure d'aide au projet d'innovation | Increased turnover Increased additionality | Likelihood of increased turnover and client base Impacts on employment |                            | (De Laat et al., 2001) |
| DEMO 2000 (Norway) | Increase additional value of individual R&D projects Increase value to supplier companies | Increase future value of individual R&D projects in oil companies Increase future value of service companies' activities | Increase R&D spending within oil & gas sector Realise additional commercial benefits from oil & gas activities | (Hansen et al., 2005) |
| FFF-Industrial Research Promotion Fund (Austria) | Additionality effects on R&D spend Impact on labour productivity Impact on project likelihood | Increased firm innovation capacity Increased (R&D) employment Increased propensity to invest in R&D Decreased risk aversion |                            | (KOF et al., 2004) |
| Grant for R&D/SMART (UK) | Development of products/prototypes Increased productivity & profitability Increased/improved technology use and adaptation Generation of IP | Improved company performance/survival overall Improved capacity to innovate Improved attitude to risk/R&D Increased access to capital Increased propensity to collaborate | Increased employment and GVA at regional/national level | (PACEC, 2009) |
| IWT subsidies (Flanders)[^7] | Development of new products or, processes Impact on project additionality Impact on R&D spending additionality | Impact on scope of R&D Impact on collaboration Impact on firms' innovation capabilities | Impact on location of R&D activities | (Steurs et al., 2006) |
| IWT grants (Flanders) | Impacts on employment Additionality effects on R&D |                            | Employment impact on local economy | (Czarnitzki and Bento, 2012) |
| MERA Programme (Sweden) |                            |                            | Enhance industrial potential for car production in Sweden | (Åström et al., 2008) |
| National R&D Programme for | Meets rationales Additionality | Strategic and operational changes | Spillovers to other firms Impacts on | (PREST, 2003) |
| Medical & Welfare Apparatus (Japan) | Sales of innovative products Internal technological spillovers | Programme value-for-money | users                      |                            |
| NRC Industrial Research Assistance Program (Canada) | Stimulate commercialisation of new products and processes Meets rationale | Increase SME innovation capacities & capabilities Increase sales & employment growth | Increase economic impact of SME R&D activities Increase national wealth creation | (National Research Council of Canada, 2007) |
| R&D Capability Grants Scheme (Ireland) | Increase additional firm R&D expenditures | Extend scope of R&D Increase R&D-related employment | Increase national R&D spending Influence decisions on location of R&D activities in Ireland | (Evaltec, 2003) |
| R&D Start Programme (Australia) | New products, processes, services | Additionality on sales, employment and R&D Increased collaboration activity | Impact on domestic and export competitiveness Increased ability to enter new product/export markets Knowledge/capability transfers or spillovers | (Allen Consulting Group, 2000) |
| Small Firms Loan Guarantee Scheme (UK) | Purpose of uptake Increased chance of project/start-up success | Increased employment/ turnover growth Sourcing of external finance | Improved growth prospects Introduction of new/improved products, processes or services | (OMB Research, 2010) |
| Small Firms Loan Guarantee Scheme (UK) | Meets rationales Sales and employment growth Ethnic/deprived area uptake | Increased propensity to export Increased use of leading edge technology Effects on productivity | Benefits to the economy in terms of GVA Net increase in employment Net increase in sales Effect on gross exports | (Cowling, 2010) |
| SMART (UK) | Meets rationales Technological innovation Marketable outputs Propensity to attract further funding | Increased turnover, exports and employment Increased profitability Programme value-for-money Integration with other schemes | Wider dissemination of innovation Spillover effects Displacement rates | (PACEC, 2001) |
| SMART (UK) | Impact on skills needs Changes in skills levels Additionality (with regard to skills) Advice and support required | Impact on workforce development Growth and innovation planning |                            | (PACEC, 2003) |
| SPIN (Finland) |                            | Firm-level competences | Sector wide R&D            | (Raivio et al., 2012) |
| Technology Development Projects (PDT), Technological Innovation Projects (PIT) & Aggregated Industry Research Program (PIIC) (Spain)[^8] | Additionality on R&D spending | Strategic and operational changes Export growth & internationalisation | Other industries & society | (Huergo et al., 2009) |
| ZIM Programme (Germany) | Increase company R&D and innovation efforts Reduce risks of R&D projects | Rapidly introduce R&D outcomes to the market Enhance and increase R&D collaboration activities Improve company innovation capacities and capabilities |                            | (Deuten and Hiltunen, 2011) |

</div>

[^7]: Note: this study (and related studies into this programme) focused on the concept of behavioural additionality.
[^8]: Review was relatively limited and focused on characteristics of participating firms rather than grant impacts and effects.

## Annex 2: Summary of Evidence on Additionality {: #annex-2 }

### Table 4: Summary of the Evidence on Input Additionality

<div class="table-container" markdown="1">

| Reference | Context | Data/Method | Results |
|:----------|:--------|:------------|:--------|
| (Buigues and Sekkat, 2011) | Meta-evaluation | Meta-evaluation of R&D and non-R&D subsidies | - Includes a literature review of R&D and non-R&D subsidies |
| (David et al., 2000) | Meta-evaluation | Meta-evaluation of 33 econometric studies that use, micro, meso and macro data | - Studies that are on firm or line of business aggregation level tend to find more substitution effect than macro level studies.
- US based studies tend to find more substitution effect than non-US based studies. |
| (García-Quevedo, 2004) | Meta-evaluation | Meta-evaluation of 78 econometric studies that use, firm, industry and country level data | - Out of 74 studies analysed, 38 indicated complementarity, 17 substitutability and the results were insignificant in 19 studies
- Crowding-out is more common in firm level studies compared to industry and country level studies |
| (Kauko, 1996: 323) | Meta-evaluation | Meta-evaluation of econometric and interview based studies | - "If the problem of endogeneity is avoided in one way or another, public subsidies turn out to be a rather inefficient stimulus for private R&D. Always when different results have been obtained, the study is potentially biased because of the endogeneity of subsidies." |
| (Klette et al., 2000) | Meta-evaluation | Meta-evaluation of 5 microeconometric studies | - Studies with structural models could provide more operational programme management information than currently used non-parametric models |
| (Siegel et al., 2003) | Meta-evaluation | Meta-evaluation of a number of new technology based firms support programmes including US ATP and UK SMART | - This is a Small Business Economics journal special issue on the impact of small business focused innovation programme
- ATP is successful especially in financing R&D intensive SMEs
- Need for more sophisticated evaluation techniques |
| (Aerts and Schmidt, 2008) | Flanders (IWT programme) and Germany (no particular programme) | Econometric analysis of CIS3+4 in Germany and Flanders | - No crowding out |
| (Alecke et al., 2012) | East Germany | Econometric analysis of data on East German firms in Thuringia in 2003 | - Subsidies increase R&D spending on average 2.4%
- 1% increase in support induces 0.21% additional private R&D expenditure
- The results are positive and significant in all firms but more in micro firms |
| (Almus and Czarnitzki, 2003) | R&D subsidies in East Germany | Econometric analysis (non-parametric matching technique) of Mannheim Innovation Panel between 1994 and 1998 | - Subsidised firms increased their R&D spending by about 4%. |
| (Antonelli, 1989) | Italy, no particular programme | Econometric analysis of custom survey and annual report data for 86 firms during 1981-1983 | - Increased R&D expenditure: elasticity of R&D expenditures with respect to direct subsidies = 0.37 |
| (Bassanini and Ernst, 2002) | 18 OECD countries, no particular programme | Econometric analysis of aggregate data from OECD MSTI and ANBERD 1993-1997 | - No significant change |
| (Callejón and García-Quevedo, 2005) | Spain, no particular programme | Econometric analysis of industry-level data for Spain | - Publicly financed R&D increases private R&D expenditures.
- The effects are more significant in medium-high and medium-low technology industries |
| (Carboni, 2011) | Italy, no particular programme | Analysis of the Survey of Manufacturing Firms (SMF) carried out by the Area Studi of Capitalia Bank 1989-2003 | - Firms receiving support spends more on R&D than they would have spent without a support |
| (Cerulli and Potì, 2012) | Italy, Fondo per le Agevolazioni della Ricerca (FAR) | Econometric analysis of Fondo per le Agevolazioni della Ricerca (FAR), managed by the Italian Ministry of Research (Miur) database 2000-2004 | - "Firms that exhibit more additionality are generally larger, more oriented towards patenting and with a lower negative growth of fixed capital accumulation, while the rest tends to exhibit crowding-out" |
| (Clausen, 2009) | Norway, a number of programmes including direct measures | Econometric analysis of CIS3 for Norway | - Research subsidies stimulate research expenditure, development subsidies stimulate development expenditures, but not vice versa |
| (Coccia, 2012) | Italy and OECD, no particular programme | Econometric analysis of macro data for OECD and Italy | - Positive relationship between public and private R&D expenditure |
| (Colombo et al., 2011) | Italy, no particular programme, grants and tax comparison | Econometric analysis of 247 Italian new technology based firms RITA (Research on Entrepreneurship in Advanced Technologies) database 1994-2003. | - General impact of receiving subsidy (grants or tax credits) is positive but statistically insignificant
- Grants increased private R&D expenditure 5% |
| (Czarnitzki and Bento, 2012) | Belgium Flanders, IWT Programme | Econometric analysis of CIS4+5+6 and monitoring data, 4761 firms | - no crowding-out
- R&D spending in supported firms is 3.75% higher than un-supported firms
- R&D employment is 9.57% higher than un-supported firms
- No declining effect in case of repeated subsidies or finance from other sources |
| (Czarnitzki and Licht, 2006) | East and West Germany, no particular programme | Econometric analysis of Mannheim Innovation Panel (MIP) data for 1994-2000 | - Increased R&D expenditures (more in Eastern German firms who would not have conducted R&D otherwise) |
| (Czarnitzki, 2006) | East and West Germany, no particular programme, SME focused | Econometric analysis of Mannheim Innovation Panel (MIP) | - R&D subsidies in East Germany makes SMEs less sensitive to external financial constraints compared to SMEs in West Germany |
| (Falk, 2006a: 545) | 17 OECD countries, no particular programme | Econometric analysis of aggregate data from OECD MSTI and ANBERD 1975-2002 | - "Direct R&D subsidies and specialisation in high-tech industries also contribute significantly to business-sector intensity, but these effects are only significant using the first-differenced GMM specification." |
| (Falk, 2007) | Austria FFF Programme | Analysis of the survey on the 1200 participants of the Austrian | - In the absence of funding,
  - 13.36%-21.93% of firms would have carried out their projects anyway,
  - 46.70%-56.82% would have carried out with changes,
  - 29.82%-31.37% would not have carried out at all |
| (Feldman and Kelley, 2003) | US Advanced Technology Program | Analysis of a survey on US ATP participants in 1989 + interviews | - ATP award winners were more successful in raising external finance than non-winners
- ATP funded projects that would not have otherwise happen |
| (Feldman and Kelley, 2006) | US Advanced Technology Program | Analysis of the data about applicants to the 1998 competition of the US Advanced Technology Program | - Halo effect: subsidy "crowds-in" other investment to firms |
| (Gelabert et al., 2009) | Spain, no particular programme | Econometric analysis of Spanish CIS | - Negative relationship between public support and appropriability (patents, models/designs, trademarks and copyrights, trade secret, design complexity and lead time)
- Crowding-out in the firms that has higher levels of appropriability |
| (González and Pazó, 2008: 1402) | Spain, no particular programme | Econometric analysis of data of 2000 Spanish manufacturing firms during 1990-1999 | - No crowding-out but a very small additionality. Effect is weaker when persistence is considered. |
| (González et al., 2005) | Spain, no particular programme | Econometric analysis of data of 2000 Spanish manufacturing firms during 1990-1999 | - Overall positive effect: those who would not have conducted R&D would increase their spending more (mainly small firms) |
| (Görg and Strobl, 2007) | Ireland, Forfas programmes | Econometric analysis of the Annual Business Survey 1999-2002 and Forfas monitoring data | - Domestic plants: small and medium scale grants do not crowd out (or may create small amount of additionality) but large grants substitute private expenditure
- Multinational plants: no evidence of crowding-out |
| (Guellec and Van Pottelsberghe de la Potterie, 2003) | 17 OECD countries, no particular programme | Econometric analysis of aggregate data from OECD MSTI and ANBERD 1983-1996 | - Government financed R&D and privately finances R&D are complementary up to a subsidisation rate of 10%, but after 20% substitute |
| (Heijs, 2003) | Spanish low interest credits for R&D | Analysis of IAIF/CDTI questionnaire of 435 supported firms | - 34% of the firms exhibit free-rider behaviour (indicators: firms substituted own resources, firms could have used other internal and external resources and firms indicated that quantity of the support was not important)
- The profile of the free-rider firms is not significantly different than other firms (in terms of size, sector, age, etc.) |
| (Herrera and Bravo Ibarra, 2010) | Spain, no particular programme | Analysis of 'Business Strategy Survey' (Encuesta sobre Estrategias Empresariales - ESEE), sampled by the SEPI Foundation, about 3000 Spanish firms with more than 10 employees. | - Positive and significant impact on innovation input
- Positive and significant impact on production and technology purchase |
| (Hsu et al., 2009) | Tawian ITDP Grants | Statistical analysis (mostly in the form of cluster analysis) of 127 government-sponsored R&D | - 29% of the projects would be same scale, 6% would be smaller, 7% would not have happened |
| (Hussinger, 2008) | Germany, no particular programme | Econometric analysis of Mannheim Innovation Panel (MIP) 1992-2000 | - 30% increase in private R&D spending |
| (Hyytinen and Toivanen, 2005) | Finland, no particular programme | Econometric analysis of data on Finnish SMEs during 2001-2002 | - "firms in industries that are more dependent on external financing invest relatively more in R&D and are relatively more growth-oriented when they have more government funding (potentially) available" |
| (Lach, 2002) | R&D subsidies by the Office of the Chief Scientist in Israel | Econometric analysis of the Surveys of Research and Development in Manufacturing conducted by the Central Bureau of Statistics during 1990-1995 | - Increased R&D spending for small firms but decreased for large firms
- Overall no significant increase |
| (Lee, 2011: 269) | Canada, Japan, Korea, Taiwan, India and China | Econometric analysis of the World Bank database of Institutional and Policy Priorities for Industrial Technology covering Canada, Japan, Korea, Taiwan, India and China | - "the complementarity (crowding-out) effect is more likely to be observed for firms with low (high) technological competence, unclustered (clustered) firms, firms operating in industries with high (low) technological opportunities, firms facing high (low) competitive market pressure, firms with a low or moderate (accelerating) past growth performance and firms with (without) the experience of engaging in collaborative or contract R&D."
- "the differential effect of firm size and age on the public-private R&D relationship is not statistically evident largely due to the complicated interplay of the four different (i.e., opposite or mixed) differential effects associated with firm size and age."
- "the effect of public R&D support may vary across the types of public R&D support as well as countries" |
| (Lenihan and Hart, 2004) | Enterprise Ireland programmes | Analysis of Enterprise Ireland programmes 2000-2002 through in-depth face-to-face interviews of 42 cases | - Pure deadweight 19%, employment deadweight between %45.4 and 64.7
- For 45.9%, the support is leverage for other external finance |
| (Lenihan and Hart, 2006) | Ireland, Shannon Development | Econometric analysis of firms that received financial assistance from Shannon Development during 1995 | - Deadweight
- 78.4% for domestic firms
- 71.3% for foreign firms
- Higher deadweight for larger domestic firms |
| (Mamuneas and Nadiri, 1996: 78) | R&D Grants in the US | Econometric analysis of industry level data from NSF during 1956-1988. | - "publicly financed R&D and company-financed R&D are substitutes in low R&D intensive industries, but are weak substitutes in high R&D intensive industries." (p.78)
- if all the government spending on tax credits were transferred to grants, R&D spending would decrease in all industries but after-tax costs would increase in high-tech industries and decrease in low-tech industries |
| (Meuleman and De Maeseneire, 2012) | Belgium, IWT-Flanders' SME Innovation Programme | Econometric analysis of IWT supported 1107 SMEs 1995-2004 | - Grant has positive signalling effect for debt and equity finance |
| (Özçelik and Taymaz, 2008) | Turkey, TTGV Loan Programme | Econometric analysis of Annual Survey of Manufacturing Industries (ASMI), R&D Survey and official support data | - No crowding out
- While all firms show positive effects, effects are larger for smaller firms
- While firms in all sectors show positive effects, firms in technology intensive sectors benefit more |
| (Paunov, 2012) | Latin America, no particular programme | Econometric analysis of a survey of 1223 firms across Argentina, Brazil, Chile, Colombia, Costa Rica, Mexico, Peru and Uruguay during the 2008-2009 economic crisis | - Access to public funding significantly decreases the possibility of abandoning an R&D project due to economic crisis
- Results are significant for
  - small firms but not for large firms
  - new and medium aged firms but not for old firms
  - low-tech firms but not for high tech firms |
| (Zhu et al., 2006) | Shanghai, tax incentives and grants for R&D | Analysis of industry level R&D investments in Shanghai for the period 1993-2002 | - Direct government funding increases R&D investment |

</div>
Table 5: Summary of the Evidence on Output Additionality
| Reference |
Context |
Data/Method |
Result |
| (Albors-Garrigos and Barrera, 2011: 1315) |
Spain, no particular programme |
Econometric analysis of CIS3 for Spain |
- Subsidies have positive impact on innovation performance
- Mediators for the influence of public funding
o organizational regime of the firms
o openness to external partners and innovation sources,
o cooperative skills
o innovative behaviour
o size (only for high-tech) |
| (Alecke et al., 2012) |
East Germany |
Econometric analysis of data on East German firms in Thuringia in 2003 |
- 20% increase in probability to apply for a patent (only in small and medium firms not in micro firms) |
| (Aoshima et al., 2011) |
Japan, New Energy and Industrial Technology Development Organization (NEDO) Supports |
Analysis of 242 R&D projects supported by NEDO |
- Receiving government funding hinders commercialisation
- Compared with non-subsidized R&D use of internal resources are less intense and therefore entails less chance of commercialisation |
| (Bérubé and Mohnen, 2009) |
Canada, comparison of R&D grants and tax credits |
Econometric analysis of 2005 Survey of Innovation from Statistics Canada |
- Firms receiving tax credits and grants are more innovative (in terms of number innovations, world-first innovations and commercialisation) than firms receiving only tax credits |
| (Billings et al., 2004) |
US, no particular programme |
US firm-level pooled data of 779 firms from Compustats 1992-1999 |
- Productivity of government sponsored R&D is significantly lower than privately finances R&D |
| (Cerulli and Potì, 2012) |
Italy, Fondo per le Agevolazioni della Ricerca (FAR) |
Econometric analysis of Fondo per le Agevolazioni della Ricerca (FAR), managed by the Italian Ministry of Research (Miur) database 2000-2004 |
- "3.5% increase in the number of patents for any 1 million euros of additional firm's own R&D expenditure"
- Firms that exhibit more additionality are generally larger, more oriented towards patenting and with a lower negative growth of fixed capital accumulation, while the rest tends to exhibit crowding-out |
| (Colombo et al., 2011) |
Italy, no particular programme |
Econometric analysis of 247 Italian new technology based firms RITA (Research on Entrepreneurship in Advanced Technologies) database 1994-2003. |
- General impact of receiving subsidy (grants or tax credits) is positive but statistically insignificant
- Grants increased TFP 31.4% |
| (Czarnitzki and Bento, 2012) |
Belgium Flanders, IWT Programme |
Econometric analysis of CIS4+5+6 and monitoring data, 4761 firms |
- More than 10000 jobs or 16800 person/years of R&D employment created |
| (Czarnitzki and Licht, 2006) |
Germany, no particular programme |
Econometric analysis of Mannheim Innovation Panel (MIP) data for 1994-2000 |
- Increased patenting activity in both East and West Germany
- marginal productivity is lower for publicly financed R&D than firm financed R&D only for Western Germany |
| (Ebersberger, 2011) |
Finland, Tekes programmes |
Econometric analysis of Statistics Finland, the Finnish Funding Agency for Technology and Innovation (Tekes) and the Technical Research Center of Finland (VTT) 1994-1996 |
- Subsidized firms are significantly less likely to exit than they would be without the subsidy. The analysis also reveals that subsidies do not have a significant effect on the closure of firms: Subsidies for innovation do not keep companies alive which would have to close without subsidies. |
| (Gelabert et al., 2009) |
Spain, no particular programme |
Econometric analysis of Spanish CIS |
- Negative relationship between public support and appropriability (patents, models/designs, trademarks and copyrights, trade secret, design complexity and lead time)
- Crowding-out in the firms that has higher levels of appropriability |
| (Girma et al., 2007) |
Ireland, Forfás programmes |
Plant-level analysis of Irish Economy Expenditure Survey (IEE) and Forfás Annual survey, 1087 plants 1992-1998 |
- Grants increase total factor productivity (TFP)
- Plant age is significantly positively associated with increased TFP with grants
- Financially constrained firms exhibits more TFP increase with grants |
| (Grilli and Murtinu, 2012) |
Italy, no particular programme, comparison of grants with tax credits |
Econometric analysis of 247 Italian new technology based firms RITA (Research on Entrepreneurship in Advanced Technologies) database 1994-2003. |
- Grants have positive and significant effect on TFP while tax incentives do not |
| (Harris and Robinson, 2004) |
UK Regional Selective Assistance and the SMART/SPUR |
Econometric analysis of plant level monitoring data for 7737 firm during 1990-1999 |
- Assisted plants in Regional Selective Assistance programme increased productivity compared with the plants in the UK, but decreased compared with like-for-like plants
- No significant productivity difference for plants in SMART/SPUR programme |
| (Herrera and Bravo Ibarra, 2010) |
Spain, no particular programme |
Analysis of 'Business Strategy Survey' (Encuesta sobre Estrategias Empresariales - ESEE), sampled by the SEPI Foundation, about 3000 Spanish firms with more than 10 employees. |
- Positive and significant impact on propensity to patent
- Positive and significant impact on production and technology purchase |
| (Hsu et al., 2009) |
Tawian ITDP Grants |
Statistical analysis (mostly in the form of cluster analysis) of 127 government-sponsored R&D |
- Firms in biotechnology and pharmaceuticals industry exhibits less output and behavioural additionality |
| (Hsueh and Hsu, 2011) |
Taiwan, no particular programme |
Data envelopment analysis of 110 government supported R&D projects in Taiwan between 1997-2005 |
- Aggregated efficiency, technical efficiency and scale efficiency of government supported R&D projects are significantly different in different industries |
| (Hujer and Radić, 2005) |
Germany, no particular programme |
Econometric analysis of IAB Establishment Panel conducted by the German Federal Employment Office 1999-2000 |
- Large firms: insignificant effect on new products and services, small and medium size firms: weak significant effect
- If method is adjusted, the results become insignificant or negative
- Only positive effects in East German firms |
| (Hussinger, 2008) |
Germany, no particular programme |
Econometric analysis of Mannheim Innovation Panel (MIP) 1992-2000 |
- No productivity difference in publicly induced R&D expenditure |
| (Hyytinen and Toivanen, 2005) |
Finland, no particular programme |
Econometric analysis of data on Finnish SMEs during 2001-2002 |
- "firms in industries that are more dependent on external financing invest relatively more in R&D and are relatively more growth-oriented when they have more government funding (potentially) available" |
| (Mamuneas, 1999) |
US, no particular programme |
Econometric analysis of Bureau of Labor Statistics industry level data for the period 1949-1991 |
- Productivity increase by the spillover of publicly finances R&D
- Social gain in output = 16% |
| (Schneider and Veugelers, 2010) |
Germany, no particular programme |
Econometric analysis of young, small highly innovative companies in German CIS4 |
- While in general average R&D subsidies are statistically associated with higher innovative performance, there is no evidence that this is true for young, small highly innovative companies |
| (Svensson, 2013) |
Sweden, soft loans for R&D and hard loans for commercialisation |
Survival analysis |
- Patents in the government support has higher probability of expiring for R&D project but not for commercialisation projects |
| (Un and Montoro-Sanchez, 2010) |
Spain, no particular programme |
Econometric analysis of CIS data for service firms |
- Public funding increases propensity to innovate but only when combined with firms' own resources |
Table 6: Summary of the Evidence on Behavioural Additionality
| Reference |
Context |
Data/Method |
Result |
| (Albors-Garrigos and Barrera, 2011: 1315) |
Spain, no particular programme |
Econometric analysis of CIS3 for Spain |
- "only firms with more sophisticated innovative behaviour and skills to develop external sources and cooperation linkages perform better innovation-wise and therefore the subsidies received have a higher impact" |
| (Falk, 2007) |
Austria FFF Programme |
Analysis of the survey on the 1200 participants of the Austrian |
- In the absence of funding,
o 35.53%-46.43% would have postponed starting date of the project
o 56.73%-63.64% Longer duration of the project
o 64.59%-66.01% Later accessibility of project results
o 42.08%-51.50% Technical demands less sophisticated |
| (Feldman and Kelley, 2003) |
US Advanced Technology Program |
Analysis of a survey on US ATP participants in 1989 + interviews |
- ATP programme stimulates higher risk projects |
| (Hewitt-Dundas and Roper, 2010) |
Ireland, no particular programme |
Econometric analysis of Irish Innovation Panel (IIP) 1991 |
- Northern Ireland:
o extensive additionality (the probability of undertaking innovation): positive and significant
o improved product additionality (incremental innovation): positive and significant
o new product additionality (radical innovation): positive but insignificant for domestic plants
- Ireland:
o extensive additionality (the probability of undertaking innovation): positive but only significant for domestic plants
o improved product additionality (incremental innovation): positive but only significant for domestic plants
o new product additionality (radical innovation): positive but only significant for domestic plants |
| (Hsu et al., 2009) |
Tawian ITDP Grants |
Statistical analysis (mostly in the form of cluster analysis) of 127 government-sponsored R&D |
- Firms in biotechnology and pharmaceuticals industry exhibits less output and behavioural additionality |
| (Mamuneas and Nadiri, 1996) |
US, no particular programme |
Econometric analysis of Bureau of Labor Statistics industry level data for the period 1949-1991 |
- "new scientific knowledge resulting from government financed R&D expands firms' basic knowledge and thus induces the firms' own R&D" |
| (Özçelik and Taymaz, 2008) |
Turkey, TTGV Loan Programme |
Econometric analysis of Annual Survey of Manufacturing Industries (ASMI), R&D Survey and official support data |
- Accelerated R&D
- While all firms show positive effects, effects are larger for smaller firms
- While firms in all sectors show positive effects, firms in technology intensive sectors benefit more |
| (Rubenstein et al., 1977: 356) |
Meta-evaluation |
Covers a range of government "incentive programmes (IPs)" including grants in the UK, France FR Germany and Japan |
- "It is only in rare instances that IPs are perceived to have any direct effect on specific R&D decision-making"
- "In the administration of IPs, governments are seen to be too slow and complex in their response to the needs of industry"
- IPs support only marginally successful projects and hesitate to support high risk high gain projects |




