
We developed a toolkit for monitoring online activity leading up to the 2015 UK election with University of Sheffield.
Nesta Working Paper 15/12
Issued: July 2015
Keywords: social media analysis, NLP, General Election 2015, Twitter
Abstract
This report describes the Political Futures Tracker developed by the GATE team at the University of Sheffield, consisting of a toolkit we have developed for social media monitoring of tweets and other online material leading up to the 2015 UK election.
The toolkit includes data collection, semantic analysis, information aggregation, search and visualisation tools, which allow analysts to dig deep into the data and to perform complex queries over large volumes of data. The infrastructure enables users to monitor incoming data streams from Twitter, analyse the tweets and make the analysis results available for searching.
It has been applied to two scenarios: long-term monitoring of tweets by parliamentary candidates (and responses to those tweets) throughout the election campaign, and short-term intensive monitoring of tweets with particular hashtags during the televised leaders' debates, in near-real time.
Authors
Diana Maynard, Ian Roberts, Mark A Greenwood, Leon Derczynski, Kalina Bontcheva - University of Sheffield
Nesta Working Paper 15/12 July 2015 www.nesta.org.uk/wp15-12
Abstract
This report describes the Political Futures Tracker developed by the GATE team at the University of Sheffield, consisting of a toolkit we have developed for social media monitoring of tweets and other online material leading up to the 2015 UK election. The toolkit includes data collection, semantic analysis, information aggregation, search and visualisation tools, which allow analysts to dig deep into the data and to perform complex queries over large volumes of data. The infrastructure enables users to monitor incoming data streams from Twitter, analyse the tweets and make the analysis results available for searching. It has been applied to two scenarios: long-term monitoring of tweets by parliamentary candidates (and responses to those tweets) throughout the election campaign, and short-term intensive monitoring of tweets with particular hashtags during the televised leaders' debates, in near-real time.
Keywords: Social Media analysis; NLP; General Election 2015; Twitter
The Nesta Working Paper Series is intended to make available early results of research undertaken or supported by Nesta and its partners in order to elicit comments and suggestions for revisions and to encourage discussion and further debate prior to publication (ISSN 2050-9820). © Year 2015 by the author(s). Short sections of text, tables and figures may be reproduced without explicit permission provided that full credit is given to the source. The views expressed in this working paper are those of the author(s) and do not necessarily represent those of Nesta.
1. Introduction
The Political Futures Tracker consists of a toolkit we have developed for social media monitoring which combines a series of generic GATE1 tools inside a flexible architecture that allows each component to be easily adapted to the specific social media monitoring task and its domain. In particular, the framework includes semantic analysis, aggregation, and search tools, which allow analysts to dig deep into the data and to perform complex queries which do not just rely on surface information, plus the ability to make interesting correlations between the data. The generic framework is described in Section 2, while the topic and sentiment analysis tools are described in Section 3. Section 4 describes the semantic analysis and linked open data component, while Section 5 describes the future thinking component. Finally, in Section 6 we give some description of the visualisation components to show the analysis of the data in interesting ways.
2. Infrastructure
One of the principal targets of the Political Futures Tracker project has been to develop the infrastructure that allows us to monitor incoming data streams from Twitter, analyse the tweets and make the analysis results available for searching in near-real-time. This section describes the architecture we have created, and explains how we applied it to two different scenarios long-term monitoring of tweets by parliamentary candidates (and responses to those tweets) throughout the election campaign, and short-term intensive monitoring of tweets with particular hashtags during the televised leaders' debates, in near-real time.
2.1 Basic Architecture
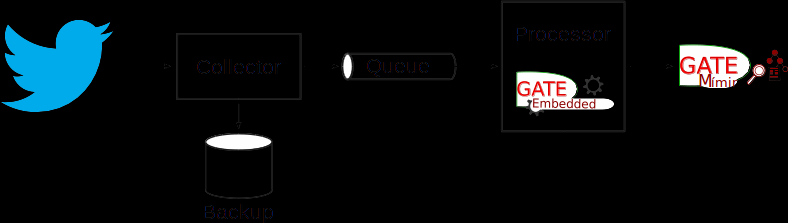
The live processing system is made up of several distinct components:
- The “collector” component receives tweets from Twitter via their streaming API and forwards them to a reliable messaging queue (JBoss HornetQ). It also saves the raw JSON of the tweets in backup files for later re-processing if necessary.
- The “processor” component consumes tweets from the message queue, processes them with the GATE analysis pipeline and sends the annotated documents to GATE Mimir for indexing.
- GATE Mimir receives the annotated tweets and indexes their text and annotation data, making it available for searching after a short (configurable) delay.
Figure 1 Simple architecture of the system
2.2 Collecting the Data
Twitter offers a set of streaming APIs that deliver tweets to consumers in real time as they are posted. Of particular interest for our purposes is the statuses/filter API, which allows you to specify certain constraints and then then delivers all tweets (up to a maximum of around 50 per second) that match those constraints. Various kinds of constraints are supported, but the two that are of interest to us are:
- track: a textual filter that delivers all tweets that mention specified keywords (typically hashtags)
- follow: a user ID filter that delivers all tweets by specified Twitter users, as well as any tweet that is a retweet of, or a reply to, a tweet by one of the specified users.
For the long-term monitoring use case, we use the YourNextMP service to assemble a list of all known parliamentary candidates who have a Twitter account. We add to this list any former MPs who are not standing for re-election, plus official political party accounts such as @Conservatives, and accounts for prominent non-Westminster politicians (e.g. the SNP and Plaid Cymru leaders, who are members of the Scottish Parliament and the Welsh Assembly respectively), and follow this list of user IDs.
For the debates, we simply track relevant hashtags for each debate (#leadersdebate, #BBCdebate), plus more general hashtags relating to the election (#GE2015, #UKElection, etc.).
The collector component uses the Hosebird client, a Java library written by Twitter themselves to simplify access to the streaming API. The Hosebird library handles the complexity of authentication, long-lived HTTP connections, and backoff-and-retry behaviour when the connection drops for any reason, so the actual collector logic is very simple. When a tweet arrives on the stream, the collector parses the JSON to extract the tweet ID, then packages the JSON into a message and sends it to the message queue, tagged with its ID (for de-duplication purposes). In parallel, the collector writes the tweet JSON to a backup file, so it is preserved for future reference (for example, following improvements to the analysis pipeline during the project we were able to go back and re-process previously-collected tweets with the new pipeline).
On top of the core collector library, we add a simple web front-end to configure the collector with Twitter API credentials and details of which users and/or hashtags we want to follow.
2.3 Processing the tweets
The processor component is a simple standalone Java application built using the Spring Boot framework. Spring Boot handles the routine tasks, like parsing of command line arguments, configuration of logging, and management of the application lifecycle, and allows you to very quickly create applications based on the Spring Framework in a few lines of code and configuration. In particular, it has support for the Java Message Service (JMS), allowing us to create a message consumer application with a few Java annotations.
We use GATE's Spring support to load the GATE processing pipeline and inject it into the message listener created by Spring Boot. Command line parameters supply the locations of the GATE processing pipeline, the queue to pull messages from, and the Mimir index to receive the results. The processing pipeline itself is described in Section 3.
2.4 Indexing the results
The processor sends its annotated tweets to a GATE Mimir indexing server. Mimir indexes the plain tweet text, structural metadata like sentence boundaries, hashtags and @mentions, and the semantic annotations detected by the analysis pipeline, such as topic mentions, sentiment expressions, and references to MPs from the previous parliament and candidates for election. We also index document-level metadata such as the tweet author, the timestamp of the tweet to a suitable level of granularity (the nearest hour for the long-term collection, the nearest minute for the high-intensity debate analysis). Mentions of candidates and former MPs are linked to a semantic knowledge base that provides additional information such as their party affiliation and which constituency they are standing in, and the constituencies are in turn linked to higher-level geographic regions, allowing us to formulate complex queries such as "Find all positive sentiment expressions about the 'UK economy' theme in tweets written by Labour candidates for constituencies in Greater London.” By issuing a series of such queries, for each broad theme, each party, each region, etc. we can generate useful visualizations like these.
Mimir builds index structures from the annotated data in memory, and performs a “sync to disk" at regular intervals to make the indexed tweets available for processing. The interval between sync jobs determines how close to real-time the tweets become searchable -- for the continuous processing of tweets by candidates, one sync per hour is sufficient, but for the debates where we receive thousands of tweets per minute and want to visualise the results as quickly as possible, we sync at least once every five minutes.
2.5 Robustness and scalability
The architecture is deliberately loosely coupled -- there is no direct dependency between the collector and processor components, communication is mediated through the message queue and the components can be distributed across different machines for higher performance and/or robustness. If a processor fails, incoming tweets will simply stack up in the message queue and will be dealt with when the processor restarts.
If the throughput is higher than a single processor can sustain then we can scale out horizontally by starting up more processor instances, and the message queue will handle the sharing out of messages among consumers without duplication. For extremely high throughput, beyond that which a single Mimir can handle, each collector could post its annotated tweets to a separate Mimir index, with searches handled through a federated front-end index. However this has not proved necessary in our tests, since one Mimir instance can easily sustain 10-15,000 tweets per minute, far more than the Twitter streaming API is prepared to deliver.
On the collector side, it is possible to run several collector instances on different machines, all delivering messages to the same queue. These could be clones, all configured to stream the same tweets (to guard against the failure of a single collector), or each collector could be set up to follow a different hashtag (to get around the rate limits Twitter imposes on a single streaming connection). Either way, the message queue takes care of filtering out duplicates so that each distinct tweet is only processed once. This was a factor in the choice of HornetQ as the message broker, as it has native support for duplicate message detection.
3. Analysing the Tweets
The application we have developed for text analysis consists of a pipeline of processing resources developed in GATE. This consists of the following components:
- Named Entity Recognition (identifying Persons, Places, Organisations etc.) and Linking (mapping these to their respective URIs in Wikipedia or other web-based knowledge sources), using the pre-existing GATE applications TwitIE [1] and YODIE [3] respectively.
- Topic Detection (detecting mentions in the text of major topics and subtopics, e.g.
- environment, immigration etc. in various lexical forms, e.g. “fossil fuels” are an indicator of an “environment” topic). The list of topics was derived from the set of topics used to categorise documents on the gov.uk2 website.
- MP and Candidate recognition (detecting mentions of MPs and election candidates in the tweet - by name or twitter handle - and linking them to their respective URIs). This is performed via gazetteers.
- Author recognition (detecting who the author of the tweet is, and linking them to the relevant URI in DBpedia). This is performed via grammar rules and gazetteer matching.
- Sentiment Analysis (detecting whether the tweets convey sentiment and if so, whether it is positive or negative, the strength of this sentiment, and whether the statement is sarcastic or not; detecting also who is holding the opinion and what topic the opinion is about, e.g. David Cameron (holder) is being positive (sentiment) about the environment (opinion topic)). These tools were adapted from those developed in [5,6], in order to relate specifically to the political tweets scenario.
3.1 Topic Detection
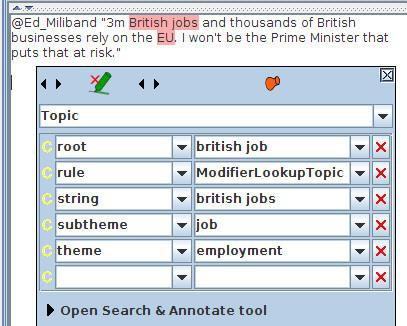
Topic detection is performed by classifying terms according to the set of key themes used on the gov.uk web pages, such as “borders and immigration” “UK economy", “environment", etc. To classify the terms, we first created sets of gazetteer lists - one for each theme - and performed direct matching against these keywords. We extended this via a set of JAPE rules in order to also match terms which were Noun Phrases and matched a head or modifier word in a list. For example, if we have the term “jobs” in a list as a head word, and we find the string “British jobs” in the text, annotated as a noun phrase, we can perform a match, as shown below. This means that we do not have to pre-specify every possible keyword in the text in advance, as this matching can be done on the fly. Each topic matched gets allocated not only a theme (the topic matched) but also a sub-theme which is based on the root form of the term (discovered via morphological analysis). This enables variations of terms to be collected together (i.e. in our example, all variations of "job" would be grouped together - this is useful for later visualisations of important topics and themes). Figure 2 shows a screenshot of a tweet containing the phrase "british jobs”, which has been annotated as a topic with the theme “employment”. We can see in this picture also that it has a subtheme “job”.
Figure 2 Screenshot of a tweet containing a topic annotated with its theme
3.2 Sentiment detection
The idea behind the sentiment detection component is to find out what kinds of opinions the MPs and candidates are expressing about the topics described above. This is in contrast with most of the existing pre-election social media analysis tools, which are focusing on public sentiment and which parties are becoming more or less favourable (and ultimately attempting to predict the election results themselves).
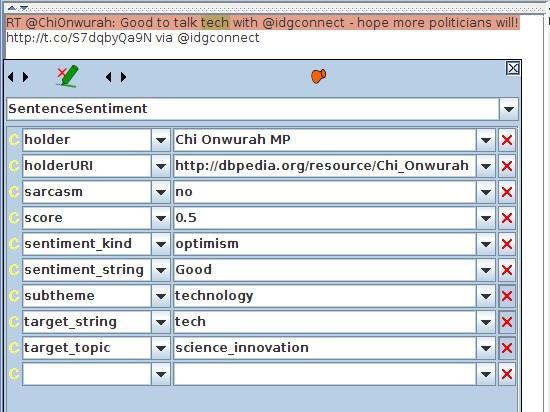
The sentiment detection component is based on an adaptation of our core rule-based sentiment analysis tools used in GATE. Adapted gazetteer lists of positive and negative words, as well as other indicators such as swear words, emoticons, sarcastic indicators and so on, are combined with a set of JAPE rules to determine the nature and strength of the sentiment (positive or negative), who the opinion holder is, what topic the sentiment refers to, and whether it is sarcastic or not. The rules for sentiment strength and score combine a number of linguistic features such as adverbs, negation, conditional sentences, questions, swear words, sarcasm indicators and so on. Further rules then attempt to link the correct opinion holder and topic with the sentiments found, if more than one exist within the same tweet or sentence. These essentially operate by chopping the tweet or sentence into phrases and preferring closest matches within phrases, but considering also the confines of any linguistic constraints such as conditionals. Figure 3 shows a screenshot of an annotated tweet depicting positive sentiment towards the topic of technology by MP Chi Onwurah, the author of the tweet.
Figure 3: Screenshot of a tweet annotated with sentiment
4. Semantic Analysis: Linking Open Data
While a number of interesting analyses can be performed over the raw processed data, the scope for discovering interesting connections is greatly widened when the data is made easily searchable. As mentioned in Section 2, GATE Mimir is used to index the semantically annotated documents and to allow Linked Open Data to be used to restrict searches. We use DBpedia as a rich source of knowledge to aggregate information from the individual documents in interesting ways.
For the domain of UK politics, DBpedia contains a wealth of useful information. Every current UK MP is represented, along with their constituency and the political party to which they belong. For geographical information, we make use of the NUTS1 regions. NUTS (Nomenclature of Territorial Units for Statistics) is a geocode standard for referencing the subdivisions of the UK and other EU countries for statistical purposes, and is represented in DBpedia. At the first level (NUTS1), there are 12 UK regions, which we use in order to make geographical observations and visualisations when constituency offers too fine-grained a distinction.
We have used data from a number of sources to annotate documents, and these same sources were also used to enrich DBpedia with relevant and reliable domain information. The main problem we had to overcome is that there is no single canonical source that covers all existing MPs and candidates for the upcoming election. Instead, we currently have three different sources of data that describe them; DBpedia, Twitter and YourNextMP. All three sources provide URIs that can identify a single person, be that a traditional URI such as provided by DBpedia, or a Twitter handle which can easily be converted to a URI. Each MP and candidate may be described in all three data sources, but will be contained in at least one. Where a person appears in more than one source, we have asserted owl:sameAs properties between them in the ontology to ensure that, regardless of which URI is used, all data we have about a person will be available for use at both indexing time and during subsequent semantic searches and aggregation.
Fortunately, each constituency in the UK does have a URI within DBpedia, which we have used as the canonical reference. Information about a constituency contains details of the current MP, but not the candidates known to be standing in the forthcoming election. We have added the information using the http://nesta.org.uk/property/candidate property to link URIs for candidates from the YourNextMP dataset to the constituencies within DBpedia.
While aggregation at the level of constituencies is interesting, more useful is to look at the NUTS1 regions. Unfortunately while the regions themselves are present in DBpedia, there is no reliable and consistent way of determining which region a constituency is a member of, so we have again augmented DBpedia to provide this data using the http://nesta.org.uk/property/partOf property to model the relationship. Another DBpedia inconsistency is the fact that within the 12 NUTS1 regions there is no way of determing the ID of the region (a three letter code); for some regions this is encoded using the http://dbpedia.org/property/nutsCode property, while some use http://dbpedia.org/property/nuts, and some do not include the code at all. For consistency we have added the code to all 12 regions using the http://nesta.org.uk/property/nuts1code property.
This data cleaning and linking of sources gives us a rich data set that can be used to restrict search queries in many different ways to produce insightful analysis. For example, Figure 4 shows a query executed in Mimir to find all tweets by Conservative MPs or election candidates that mention something related to the UK economy, and an example of a tweet found. Neither the fact that the tweet author (Richard Short) is a Conservative MP, nor the words “UK economy”, are explicitly mentioned in the text: the MP information comes from querying DBpedia, while the relationship between "pensions" in the text and the economy comes from our semantic annotation.
Figure 4.: Example of a Mimir query

The query shown is:
{QQ YO.ID tiill!loauthor_party=..Conservative Party"} OVER {Topic fheme=..yeconomy"}
Below is an example tweet found:
Richard Short ToryShorty
With so many protected from Labour’s pension raid are they sure it will even generate £2.7bm #bbcsp
5. Future Thinking
The goal of the future thinking component is to identify phrases that may have a temporal orientation, and try to guess what that orientation is. The end result is a temporal_thinking annotation, optionally containing features for direction (either fwd or bck) and for the degree, i.e. the temporal distance, which is a number typically between –5 and +5, with negative numbers indicating a retrospective statement and smaller numbers meaning not-so-distant thinking.
This is achieved by first identifying temporally-relevant terms. Such terms fall into multiple categories. First, there are those words and phrases that are particularly relevant to the election and to political discourse as a whole: these are domain specific. We extracted these phrases from the documents provided by Nesta that had some highlighted phrases in five political speeches, and then grew the list to cover other types of content. Most of these were temporal expressions, or timexes, a broad class of phrases that all try to reference some kind of calendar [7,4]. The expressions specific to the political domain included phrases such as election, traditions, our lifetimes, the war, and the long run. In addition, some indicators of future or past thinking that were not temporal expressions were included; these were phrases specific to political speeches and soundbites, and included expressions such as my parents and same old, which were indicators of past and future thinking respectively.
Dates are also normalised using the GATE normaliser tools. The distance of the date from the present gives it a different weight. They are divided into a few classes: before 2015; before the election; until the end of next year; until 2020.
In addition, we use temporal signals to determine the temporal direction of the events and ideas discussed. These temporal signals are conjunctions that place an argument in either the future, past, or present. It is important to recognise these in order to spot shifts in direction. They also serve as indicators of something temporal going on, in the absence of other information. Temporal signals can be monosemous, having only a temporal meaning, as in simultaneously or as soon as. They can also be polysemous, often having a spatial interpretation too, e.g. before, in. Using data on the frequency of temporal occurrences of signals [2], we matched instances of them in text, associated with a direction where applicable.
Soft signals are also included. These are terms that are not necessarily temporal in the general sense, but do indicate temporal thinking in what politicians say. This list includes future-thinking terms e.g. our children, planning, the long term, and past-thinking terms, e.g. then-current, the great war.
The final indicator used is the tenses of verb groups. The simple, perfect and conditional past and future tenses are all used as indicators. Use of the present perfect tense sometimes indicates past thinking, and so this is also taken into account.
Having identified these various indicators of temporal thinking, we use them to identify phrases, by taking the sentence in which they occur, and then combine their meanings. This works by first finding the overall direction of soft indicators and of temporal expressions, and then using signals to see if the item talked about is actually described as being temporally elsewhere. For example, although planning for tomorrow is fairly future-thinking, before planning for tomorrow is less so. Negation through not is also taken into account. This gives the direction.
To give the degree of future thinking, the weights of relevant indicators are all combined. The result is a number, where bigger numbers mean temporally further away / higher confidence, zero means present, negative means past, and positive means future thinking. The weights used in the final application are as follows:
- Future tense: +0.65
- Past tense: -0.45
- Present perfect: -0.5
- Future timex: +1.0
- Past timex: -1.0
- Pre-2015 date: -1.0
- Pre-election date: -0.15
- Near future date: +0.5
- Far future date: +1.0
- Very far future date: +1.5
- Future temporal signal: +0.4
- Past temporal signal: -1.0
- Future soft indicator: +0.3
- Past soft indicator: +0.3
6. Visualisation
This section focuses on the ways in which the Political Futures Tracker turns the raw data collected and analysed in the previous phases into visualizations which allow us to quickly see how the topic and sentiment of online discussion shifts in real time. In the previous sections, we have explained how the data has been captured and then indexed and linked to an ontology containing information about candidates and former MPs, which allows us to formulate complex queries such as "Find all positive sentiment expressions about the “UK economy” theme in tweets written by Labour candidates for constituencies in Greater London", which can be used to produce interesting visualizations.
Building the visualizations for the Political Futures Tracker consists of two stages. First, queries are developed to extract the raw statistics data from the indexed documents. In the second phase, this raw data is used to drive interactive web based visualizations.
6.1 Exploding Queries
In general, visualizations are a good way to present statistics about the data. While a single query, such as the example above, returns interesting information, this kind of query is more for finding specific examples than for visualizing sentiment at a given time point or changes over time. It is easy to see though, how such queries could be generalised to gather statistics. For example we could issue two queries:
- Count all the positive sentiment expressions about the “UK economy” theme in tweets written by Labour candidates for constituencies in Greater London;
- Count all the negative sentiment expressions about the “UK economy” theme in tweets written by Labour candidates for constituencies in Greater London.
We could then use these to determine if the average sentiment is positive or negative. While this is now allowing us to gather statistics rather than examples, further generalization allows us to generate data covering more of the collected tweets and to assemble more information within a single visualization. Essentially, we take such a query and turn it into a template:
Count all the sentiment expressions about the theme in tweets written by party candidates for constituencies in region.
Each of these template slots can take on multiple values:
- sentiment: can be either positive or negative
- theme: we recognise 45 different political themes
- party: we focused on the seven main UK political parties
- region: the UK consists of 12 main regions (known as NUTS 1 regions)
In theory, we could run a query for every combination of values, which would give us 7,560 data points just for this one query. We refer to this as query explosion, as one query can produce a vast number of data points. In reality, many of the themes are not talked about often and so we have tended to focus on the top ten themes discussed over the specific time point.
Time is the other aspect of the data that has not yet been discussed. In the run up to the election, we were regularly looking at two forms of time periods. First, we looked at the last week or month which allowed us to see the main themes rise and fall as the different campaigns highlighted different topics. The same approach, albeit on a smaller time scale, was used during the televised debates, where we generated statistics for the last five minutes of the Twitter stream, to see how the public responded to the different questions and speakers. The main point here is that each visualization concerned data from a single time period. The second approach we used subdivided a time period into short segments to give a clearer picture of changes in data over time. These usually revolved around tracking the usage of a hashtag in the run up to a debate, and divided the day into 5-minute blocks. Obviously, the more time periods there are, the more queries that are required and the more data that is generated.
6.2 Building the Visualizations
Early in the project we produced a number of static graphs which helped to summarise quickly the data being produced. While these static graphs were useful, there is still a limit to the amount of data that can be displayed. Interactive visualizations are not only more interesting for people to use, but also allow a much larger volume of data to be presented quickly. We have produced a number of interactive visualizations which can be accessed and explored with just a web browser.
Developing rich interactive web based visualization is made easy by the large proliferation of JavaScript libraries designed specifically for the task. We used D3.js and Leaflet to build all the visualizations produced in this project. These libraries not only make it easy to display data in interesting ways, but also help to ensure that the data and the visualization are kept separate. This separation is very useful as it allows us to produce updated data rapidly (or as needed) without having to change the display code, allowing the visualizations to change in response to the data. This was especially important during the debates where the data is being regenerated every minute so that changes in topic sentiment could be easily visualized.
7. Summary
This report describes the final version of the tools developed by the Sheffield team in order to analyse and monitor political tweets leading up to the UK 2015 elections. The toolkit consists of an overall framework, containing data collection, analysis, indexing, search and visualisation components, and enables tweets to be monitored both offline and in almost real time. They provide a flexible system which can also be adapted and extended in future as necessary, for example to different domains or data.
References
- K. Bontcheva, L. Derczynski, A. Funk, M. A. Greenwood, D. Maynard, and N. Aswani. TwitIE: An Open-Source Information Extraction Pipeline for Microblog Text. In Proceedings of the International Conference on Recent Advances in Natural Language Processing. Association for Computational Linguistics, 2013.
- L. Derczynski and R. Gaizauskas. A Corpus-based Study of Temporal Signals. In Proceedings of the 6th Corpus Linguistics Conference, 2011.
- G. Gorrell, J. Petrak, K. Bontcheva, G. Emerson, and T. Declerck. Multilingual resources and evaluation of knowledge modelling - v2. Technical Report D2.3.2, Trendminer Project Deliverable, 2014.
- H. Llorens, L. Derczynski, R. J. Gaizauskas, and E. Saquete. TIMEN: An open temporal expression normalisation resource. In Proceedings of the Eighth International Conference on Language Resources and Evaluation (LREC), Istanbul, Turkey, pages 3044-3051, 2012.
- D. Maynard, K. Bontcheva, and D. Rout. Challenges in developing opinion mining tools for social media. In Proceedings of @NLP can u tag #usergeneratedcontent?! Workshop at LREC 2012, Turkey, 2012.
- D. Maynard and M. A. Greenwood. Who cares about sarcastic tweets? Investigating the impact of sarcasm on sentiment analysis. In Proceedings of LREC 2014, Reykjavik, Iceland, 2014.
- J. Pustejovsky, B. Ingria, R. Sauri, J. Castano, J. Littman, and R. Gaizauskas. The Specification Language TimeML. In The Language of Time: A Reader, pages 545–557. Oxford University Press, 2004.



