EXECUTIVE SUMMARY
This evaluation report assesses how effective hospital impact volunteering is at improving patient experience and well-being.
The beneficiaries
The recipients of the hospital impact volunteering services were patients from ten UK hospital trusts, a large number of whom were elderly and frail, and living with dementia.
The services they received
The services consisted of a variety of hospital impact volunteering roles such as mealtime assistants or dementia buddies aimed at directly improving patient experience and well-being.
The impact of the services
Can hospital impact volunteering help improve patients' experience and well-being?
Quick answer: Hospital impact volunteering shows promise as a way to improve patient experience, mood, anxiety levels, nutrition and hydration, while releasing nurse time to care.
Key results from the nine hospital trusts' evaluations:
- Thirty per cent of all outcomes measured produced a statistically significant positive result.
- The majority of hospitals found statistically significant positive results on patient mood, nutrition and hydration levels, and releasing time to care.
- Some hospitals found statistically significant positive results on patient experience and anxiety levels, while for others no effects were found.
- No hospitals found any effects on re-admissions, length of stay, delayed transfer of care and number of falls.
The table plots significant positive changes (SP), no changes (NC) and significant negative changes (SN).
| Outcome |
SP |
NC |
SN |
| Improved patient experience |
2 |
6 |
0 |
| Improved mood |
3 |
1 |
0 |
| Reduced readmissions |
0 |
4 |
0 |
| Reduced length of stay |
0 |
3 |
0 |
| Reduced anxiety levels |
2 |
2 |
0 |
| Improved nutrition levels |
4 |
2 |
0 |
| Improved hydration levels |
1 |
0 |
0 |
| Releasing time to care |
1 |
0 |
0 |
| Reduced delayed transfer of care |
0 |
1 |
0 |
| Decreased number of falls |
0 |
2 |
0 |
Fig. 1 The robustness of the results
Strengths: Given the early stage of development that many impact volunteer roles were in, we used relatively robust methodologies such as matched comparison group designs where possible. Also, the portfolio approach involving nine hospitals lends further credibility to the emerging evidence.
Weaknesses: The comparison designs do have limitations and, in some cases, we had to use less robust designs such as pre-post designs for reasons of feasibility. In addition, some of the measurement tools had not been tested for validity and reliability. However this evaluation's robustness is appropriate for interventions that are still under development.
Conclusion
Hospital impact volunteering shows promise as a way to maintain or improve patient experience and well-being outcomes and has the potential to relieve pressures on the healthcare system.
INTRODUCTION
This report details the evaluation of the Helping in Hospitals project.
The primary purpose of this report is to provide an accurate picture of hospital impact volunteers' impact on patients. The report is the final output of work carried out by The Social Innovation Partnership (TSIP) for the Helping in Hospitals project, funded by the Cabinet Office and the Department of Health, and managed by Nesta.
The report begins by introducing TSIP and the Helping in Hospitals project. It then describes the methodology used to measure the hospital impact volunteers' impact, before presenting and discussing the results of the research, making recommendations and offering a brief conclusion.
THE SOCIAL INNOVATION PARTNERSHIP
The Social Innovation Partnership (TSIP) is a trusted advisor to public, private and social sector organisations seeking to maximise their social impact. We believe that a strong and dynamic society will take shape when evidence and innovation sit at the heart of efforts to tackle our most persistent social challenges; when evidence is used to better understand what brings about social change, and innovation is used to find and test new solutions.
THE HELPING IN HOSPITALS PROGRAMME
Nesta is an innovation charity with a mission to help people and organisations bring great ideas to life. It is dedicated to supporting ideas that can help improve all our lives, with activities ranging from early-stage investment to in-depth research and practical programmes.
Nesta has worked with ten hospital trusts in England to support the creation of impact volunteering opportunities and, with TSIP's assistance, to look systematically at the impact of volunteers on patients, staff and trusts. The programme ran over 18 months in two cohorts. Firstly, six hospital trusts were funded by the Cabinet Office as part of its Centre for Social Action agenda. The Department of Health then funded a further four hospital trusts, taking a particular interest in the involvement of younger volunteers, and so building on its work with youth social action in health. The age group for this cohort was 16-25 years old.
For further details on the Helping in Hospitals programme, its origin, the different types of impact volunteering roles it included, and the wider project timelines, please refer to Nesta's Helping in Hospitals: a guide to high impact volunteering in hospitals
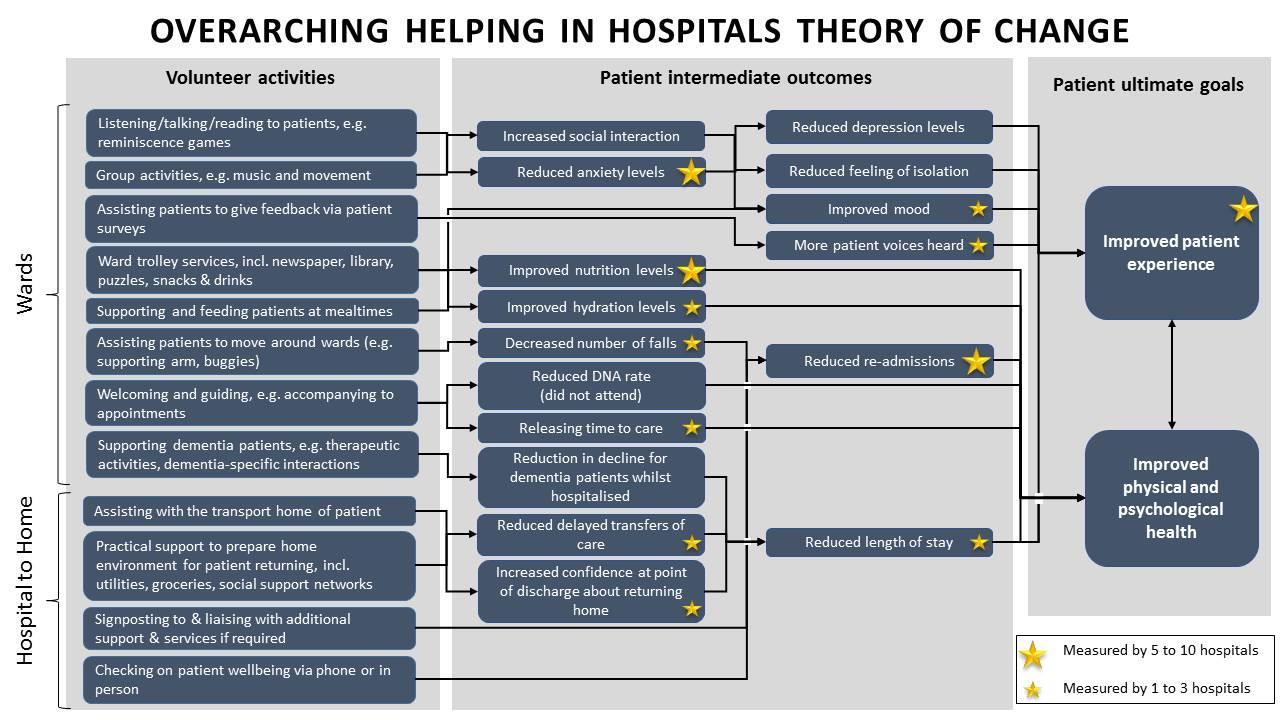
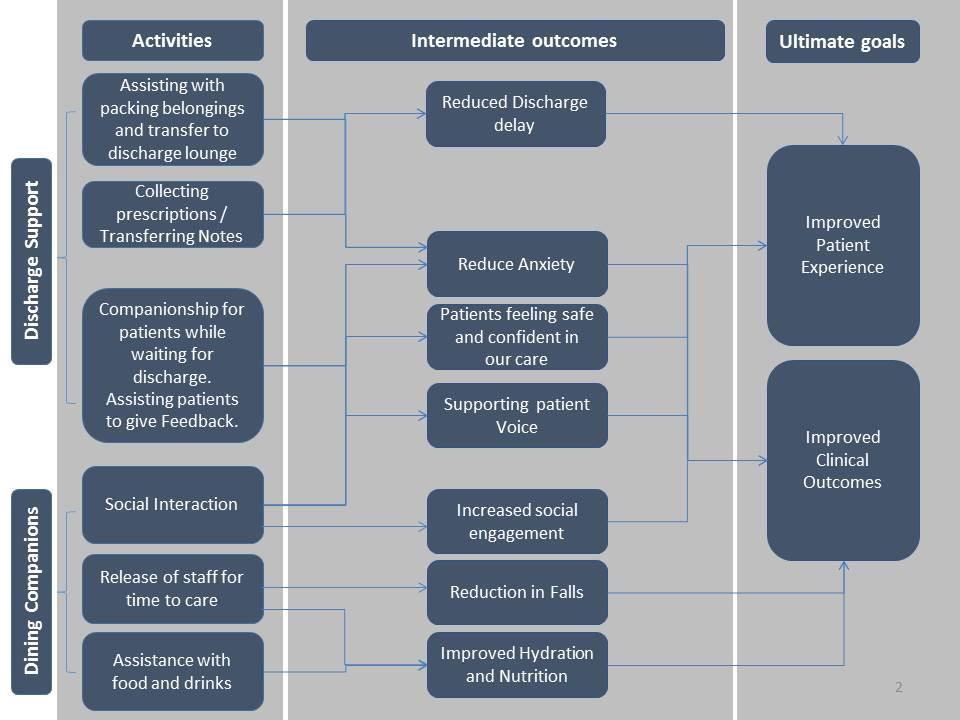
For a visual overview of the variety of volunteering services provided as part of the Helping in Hospitals programme and the impact these aim to have on patients, please see Appendix 1 in this report.
METHODS
The hospitals collected a variety of quantitative and comparative data to better understand the impact of volunteering services on patients' hospital experience and well-being.
RESEARCH QUESTION
The evaluation aimed to answer one question:
- Can hospital impact volunteering help to improve patients' experience and well-being?
KEY PRINCIPLES BEHIND OUR APPROACH
In trying to answer this research question, our work was driven by three key principles:
- Robustness: The primary aim was to measure the impact of hospital impact volunteering with as much accuracy as possible.
- Proportionality: It was important that the robustness of the evaluation was proportionate to the volunteering services' size and stage of development.
- Sustainability: The evaluation needed to be resource-efficient to avoid unnecessarily taking volunteering service and medical staff time away from patient care.
RESEARCH DESIGN
To answer the question, the research took the form of an impact evaluation, using quantitative data.
In all hospitals, we employed informally matched comparison group designs, where possible. This involved focusing impact volunteering on select beneficiary wards, while holding off impact volunteering on other wards until the research could establish its actual impact and benefits. Since many of the volunteering services had not expanded volunteer exposure to all wards at the start of the project, comparison groups were deemed to be ethical by all stakeholders.
The beneficiary and comparison groups typically consisted of separate wards that, according to the hospitals, were as similar to each other as possible in terms of size, patient demographics, and the types of conditions they cared for. In some cases, a patient survey question was used instead of having beneficiary and comparison groups on separate wards to determine whether a patient had had interactions with the impact volunteers or not.
For some outcomes, however, a comparison group was not feasible, and we used pre-post approaches instead.
The evaluation involved two separately funded hospital cohorts. It began with six Cabinet Office-funded hospital trusts in April 2014, and expanded to include four Department of Health-funded hospitals focused on young volunteers in April 2015 (see table below). We used Theories of Change to determine what outcomes should be measured for each hospital, while seeking to align outcome measurement as much as possible across hospitals. Data collection began in November 2014 and June 2015, respectively, and ended in December 2015 and March 2016, respectively (see Figure 1).
- Cabinet Office-funded hospital trusts
- Barts Health NHS Trust
- Cambridge University Hospitals (CUH) NHS Foundation Trust
- Derbyshire Community Health Services NHS Trust
- Great Western Hospitals NHS Foundation Trust
- Kingston Hospital NHS Foundation Trust
- Sheffield Teaching Hospitals NHS Foundation Trust
- Department of Health-funded hospital trusts
- The Princess Alexandra Hospital NHS Trust
- Royal Free London NHS Foundation Trust
- University Hospital Southampton NHS Foundation Trust
- Western Sussex Hospitals NHS Foundation Trust
Figure 1. Helping in Hospitals evaluation timeline
A flowchart detailing the timeline of the Helping in Hospitals evaluation, showing key milestones for both Cabinet Office-funded and Department of Health-funded hospital cohorts from 2014 to 2016.
2014
- April: TSIP designs outcomes framework for 6 hospitals (Helping in Hospitals) funded by Cabinet Office.
- October: 6 hospital evaluation plans are finalised.
- November: 6 hospitals start data collection.
2015
- April: TSIP adds an additional 4 hospitals (Young People Helping in Hospitals) funded by Department of Health.
- May: 4 hospital evaluation plans are finalised.
- June: 4 hospitals start data collection.
- December: 6 hospitals finish data collection.
- December: 1 hospital drops out.
2016
- March: 4 hospitals finish data collection.
- April/May: TSIP analyses data of 9 hospitals.
- May/June: TSIP reports evaluation results.
The evaluation used a variety of quantitative measurement tools to measure a diverse set of patient-centred outcomes, depending on what was appropriate for each outcome and what data were feasible for hospitals to collect. See Appendix 1 for the project-level Theory of Change and Table 2 (overleaf) for an overview of the key outcomes measured and main measurement tools employed.
| Outcome |
Tool |
| Improved patient experience # |
The Friends & Family Test (FFT): Routine question “How likely are you to recommend our ward to friends and family if they needed similar care or treatment?" |
| Improved mood # |
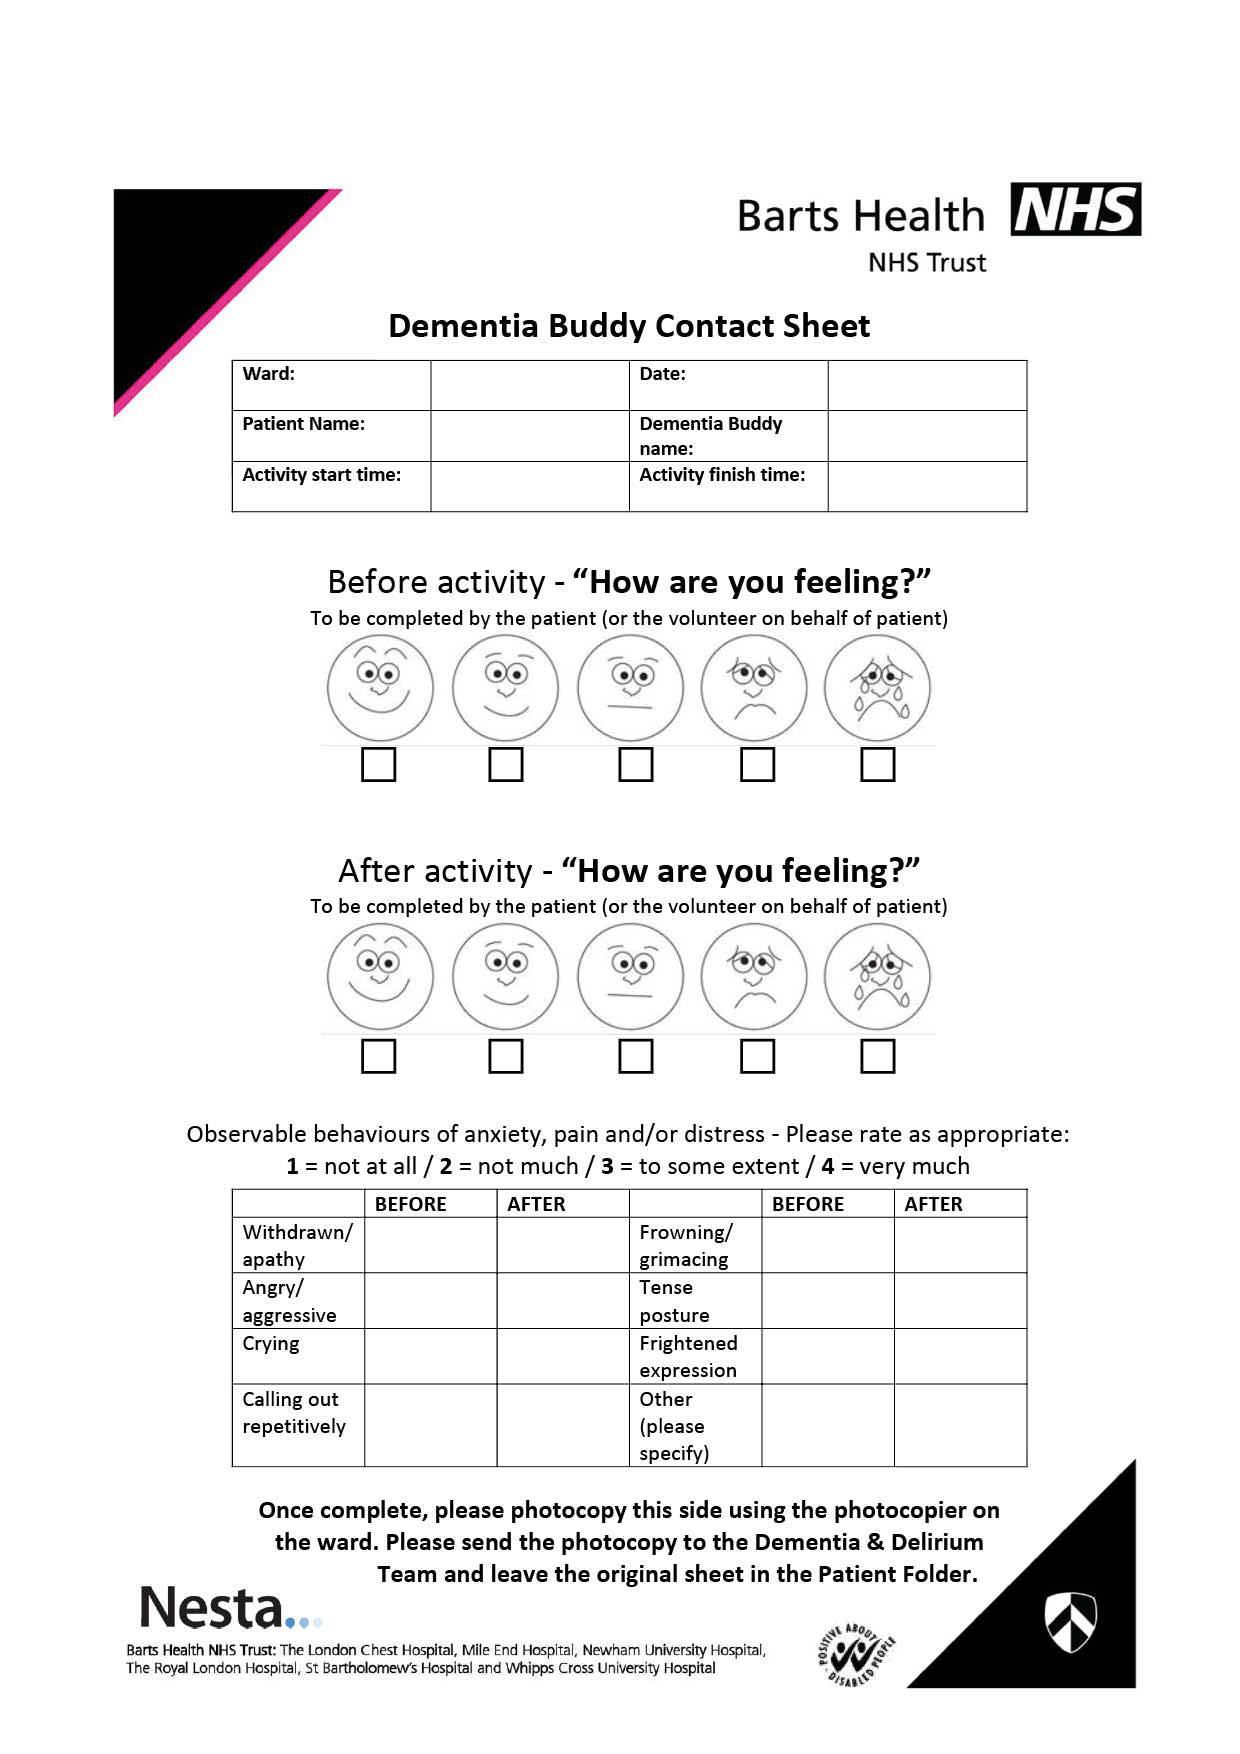
Smiley face pictorial scale: “Please circle the number you think best reflects your mood" |
| Reduced readmissions |
Readmission rates: Due to data limitations, a proxy of total readmissions, admissions and discharges data was used. |
| Reduced length of stay |
Routine Length of Stay data: Number of days of patient stay |
| Reduced anxiety levels # |
Anxiety surveys: “Do you feel you got enough emotional support from hospital staff during your stay?” or “Do you feel confident and safe in our care?" |
| Improved nutrition levels # |
Nutritional intake: Weight, calories and protein, or proportion of meal consumed. |
|
Mealtime experience proxy: “We would like you to think about your experience of food on the ward. Did you get enough help from staff to eat your meals?") |
| Improved hydration levels # |
Mealtime experience proxy: “Do you always get the help you need to drink?" |
| Releasing time to care |
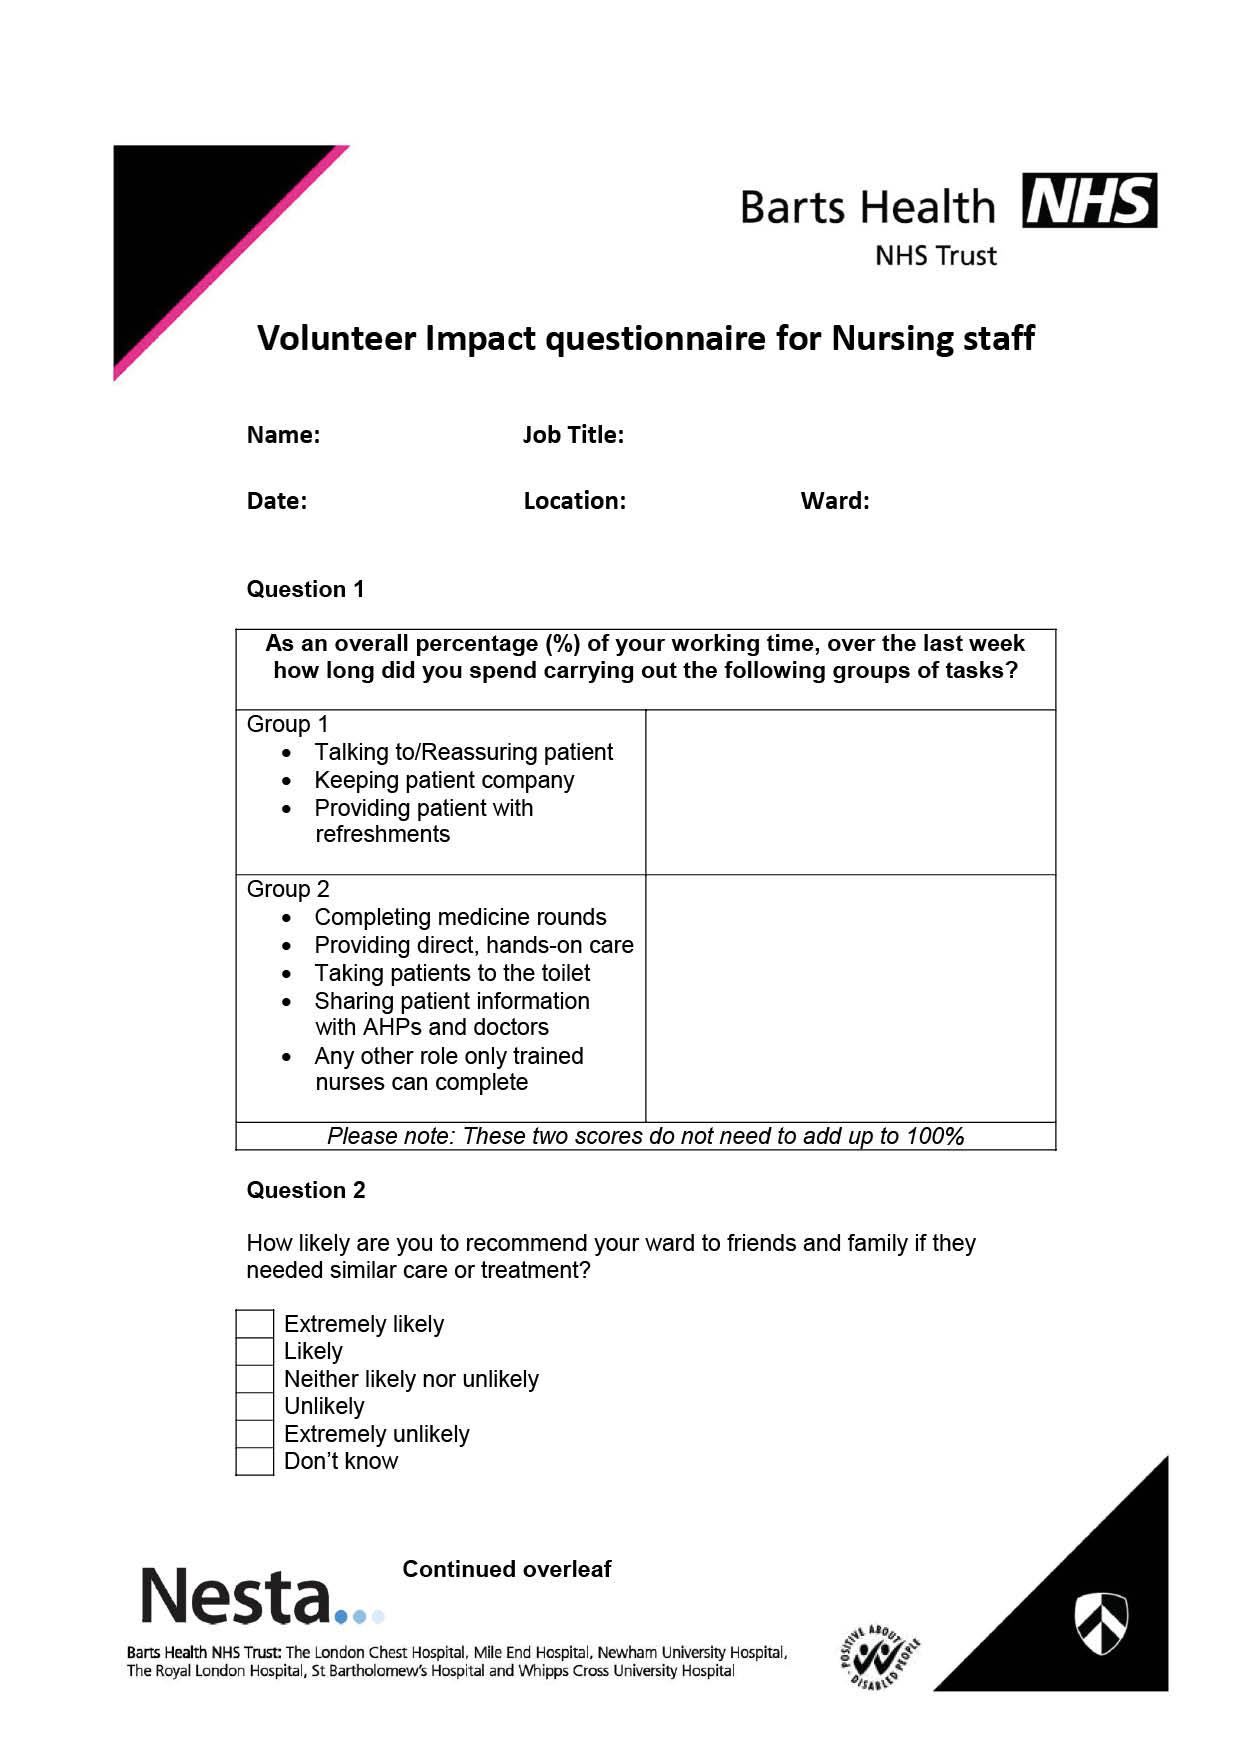
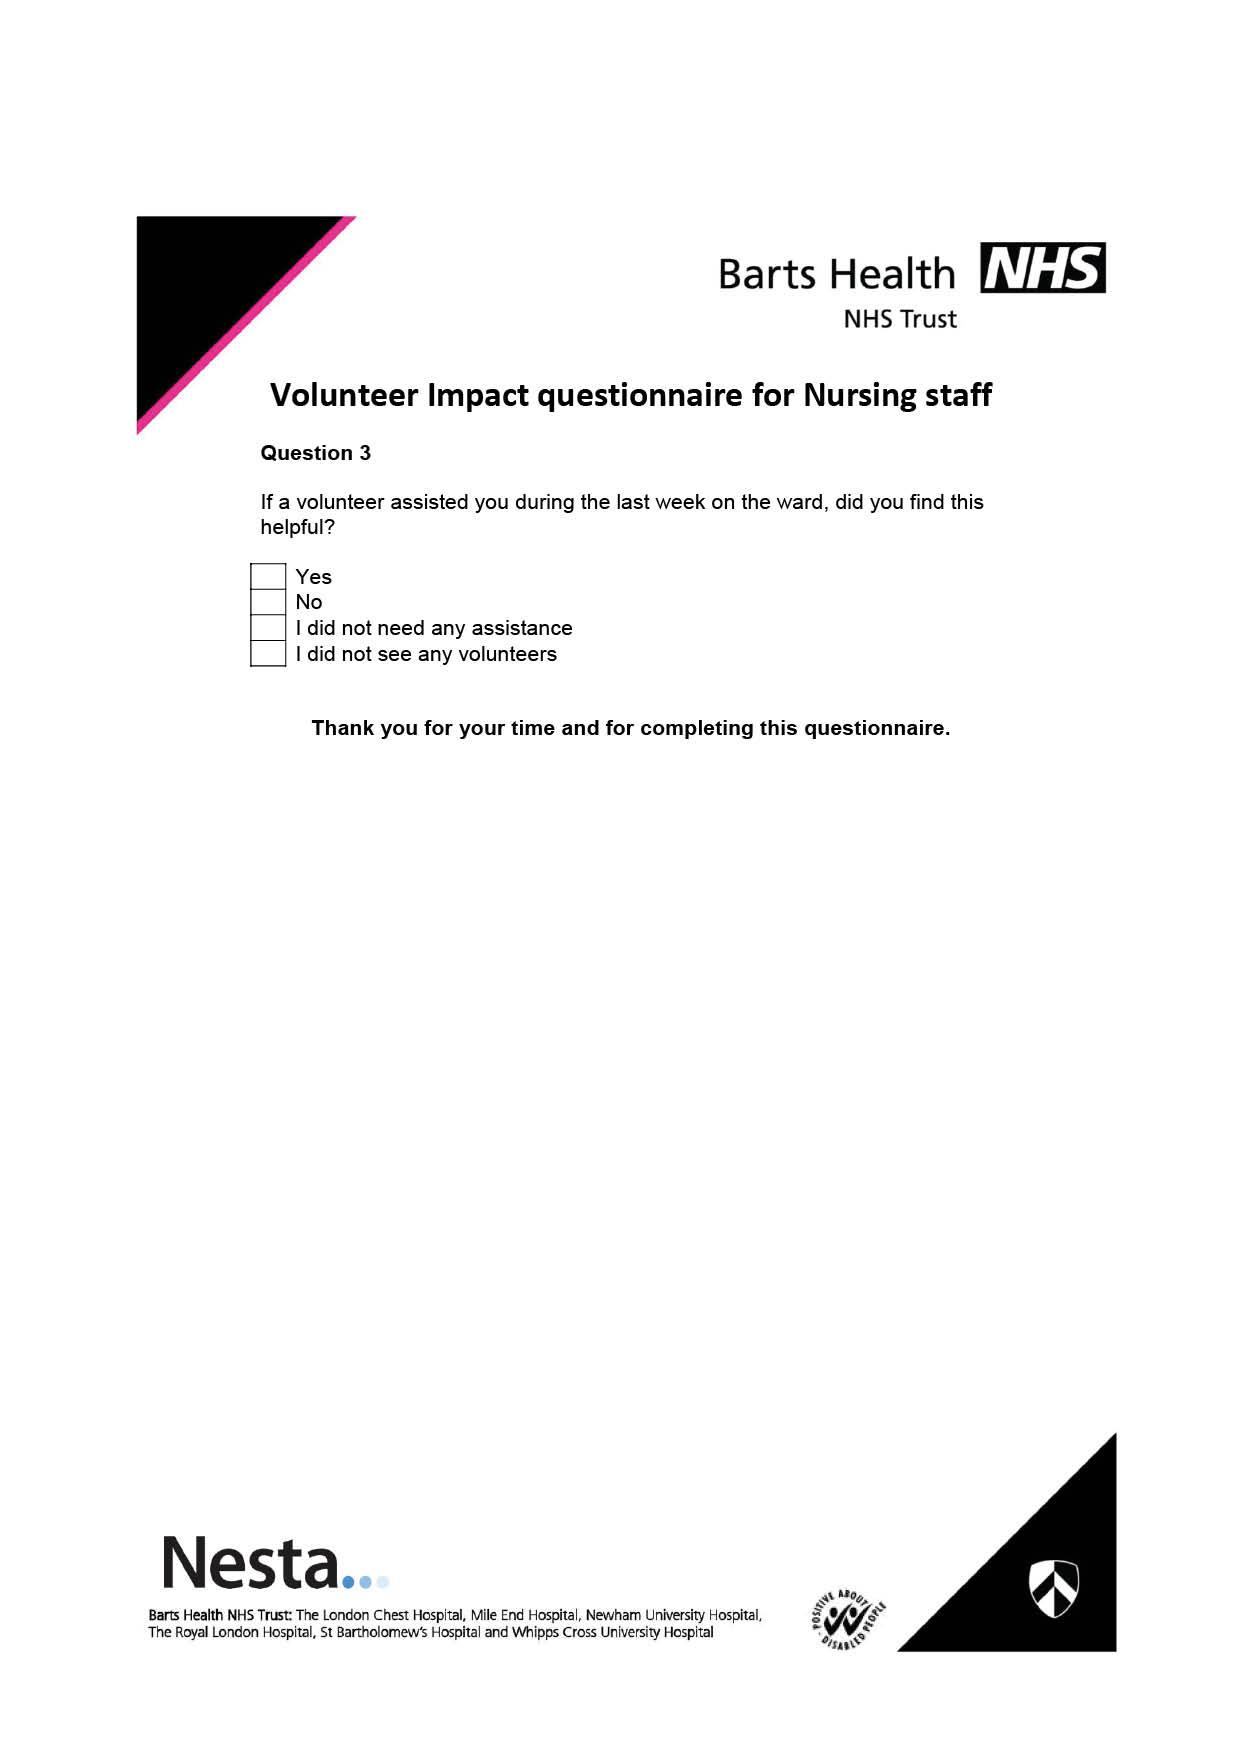
Nurse survey: “As an overall percentage (%) of your working time, over the last week how long did you spend carrying out the following groups of tasks?", distinguishing between skilled and unskilled tasks. “If a volunteer assisted you during the last week on the ward, did you find this helpful?" |
| Reduced delayed transfer of care |
Routine Delayed Transfer of Care (DTOC) data: Number of patients facing a DTOC |
| Decreased number of falls |
Routine falls data: Time, date, ward location and harm caused for each fall. |
| More patient voices heard |
Patient survey: Number of patient surveys or counting the number of patient complaints. |
Table 2. Measurement tools overview
# Data for these outcomes were in some cases collected by the volunteers themselves – see limitations section below.
Please refer to Appendix 4 for additional information about these tools.
Data collection process
Data collection differed by outcome and hospital, with our primary concern to optimise data quality while minimising disruption to service delivery. Each hospital volunteering service had an evaluation lead within their team to drive evaluation planning and coordinate data collection activities with other hospital staff. The evaluation leads often worked in collaboration with the hospitals' business intelligence teams and related research teams, where possible, to gain access to routine or administrative data and ensure data collection fitted smoothly alongside existing data collection activities. Once the data was collected, it was sent to TSIP for analysis. None of the data included confidential information and therefore data sharing was straightforward.
In addition to the impact data, we have gathered contextual information through focused conversations with each hospital trust to inform the interpretation of the results.
Data analysis
Depending on the outcome data available, we used one of the three below analysis approaches, in order of robustness:
- Difference-in-difference: Where a true baseline was available – for example, in cases where new impact volunteering roles were trialled – difference-in-difference analyses were used to determine whether the patient outcome changes in the beneficiary wards differed from the patient outcome changes in the comparison wards. This is the most robust approach.
- Beneficiary group vs comparison group: Where no true baseline was available due to pre-existing impact volunteering on the beneficiary wards, independent t-tests were used to determine whether impact volunteering has had an effect on patients in the beneficiary group relative to the comparison group. This is a less robust approach and results should be interpreted with caution.
- Before vs after intervention: Where no comparison group was available, dependent t-tests were used to determine whether patients' outcomes changed between before and after the impact volunteering interaction. This is the least robust approach and results should be interpreted with caution.
Participants
The evaluation initially included ten hospitals – six hospitals through Cabinet Office funding and four hospitals that focused on young volunteers through Department of Health funding. One of the four hospitals was unable to gather appropriate data for the project and it was therefore not included in the evaluation.
Data was collected predominantly on wards with a large proportion of elderly and frail patients, often with considerable prevalence of dementia. Since patients' average length of stay on the evaluation wards was less than 30 days, patients usually provided just one data point. The evaluation therefore involved a patient population with considerable turnover. The exceptions to this are the cases where patients were followed up with on a specific outcome as part of a pre-post design.
LIMITATIONS OF THE RESEARCH
The employed evaluation methodology has the following limitations:
- Imperfect counterfactual: While hospitals have done their best to identify optimal comparison wards, there is no guarantee that they were sufficiently comparable. Changes to wards after trial start sometimes affected the counterfactual's comparability. Randomisation was not feasible due to practical constraints (such as too low numbers of wards) and was deemed inappropriate by the volunteering services whose aim it was to support those patients most in need. In short, the differences between patient outcomes in beneficiary wards and comparison wards cannot solely be attributed to the impact volunteers, but instead other factors, such as patient demographics or differential staff pressures, may have influenced that difference in patient outcomes.
- No counterfactual: In some cases, no comparison group was feasible and we employed a pre-post design instead. This has the same drawbacks as the above, although more severe.
- No baseline: In some cases, where impact volunteers had already been active prior to the start of the project, no true baseline was available. The analysis therefore could not compare outcomes changing over time and instead simply compares beneficiary wards with comparison wards.
- Untested measurement tools: While some data (such as Length of Stay) are straightforward, other measurement approaches were not. The surveys in particular should ideally be tested for reliability and validity, which was not possible during the timeframe of the evaluation.
- Reach: For some outcomes (e.g. patient experience), data was collected from all patients on a given ward regardless of whether they had interacted with an impact volunteer or not. This was partially because of what was deemed feasible for data collection (e.g. FFT data is already routinely collected but does not often assess whether the patient actually had a volunteer interaction), and partially to include the effect of volunteers on the wider ward atmosphere, but may cause us to underestimate the effect of impact volunteering where less than a majority of volunteers had interactions with the volunteers.
- Contamination: In some cases, volunteers ended up supporting some comparison group patients and therefore likely diluted the observable impact in the data.
- Risk of response bias: Some data were collected directly by the volunteers, due to lack of a feasible alternative, and are therefore at risk of some bias as patients may have provided more positive responses than if the volunteer was not present.
RESULTS
Hospitals detect positive effects for patient experience, mood, anxiety levels, nutrition and hydration, and releasing nurse time to care.
CAN HOSPITAL IMPACT VOLUNTEERING HELP TO IMPROVE PATIENTS' EXPERIENCE AND WELL-BEING?
Portfolio-level results
Results from the nine hospital trusts' evaluations reveal the following:
- Thirty per cent of all outcomes measured produced a statistically significant positive result.
- Of those hospital trusts that measured patient mood, nutrition and hydration levels and releasing time to care, the majority found statistically significant positive results while for the remaining hospital trusts no effects were found.
- Of those hospital trusts that measured patient experience and anxiety levels, some of the hospital trusts found statistically significant positive results, while for others no effects were found.
- Of those hospital trusts that measured readmissions, length of stay, delayed transfer of care and number of falls, no effects were found.
- No hospital trusts found any statistically significant negative effects.
Table 3 (overleaf) provides an overview of the key results the nine hospital trusts produced for each of the core outcomes. It uses the following key:
- Dark green (SP): Statistically significant positive change
- Light green (NSP): Positive change but statistical significance test was not possible
- Yellow (NC): No statistically significant change, positive or negative
- Grey (blank): The outcome was not measured by this hospital
No outcomes showed a negative change that was statistically significant.
| Outcome | Original Helping in Hospitals cohort (Cabinet Office) | Young People cohort (DH) |
|:---------------------------------|:----------|:----------|:----------|:--------------|:----------|:----------|:----------|:--------------|:---------------|
| | Barts | Cambridge | Derbyshire| Great Western | Kingston | Sheffield | Royal Free| Southampton | Western Sussex |
| Improved patient experience | SP | NC | NSP | NC | NC | NC | SP | NC | NC |
| Improved mood | SP | | | | SP | SP | SP | NC | |
| Reduced readmissions | | | NC | NC | NC | NC | | | |
| Reduced length of stay | NC | | | NC | NC | | | | NC |
| Reduced anxiety levels | SP | NC | | | SP | | | | NC |
| Improved nutrition levels | | SP | | | SP | SP | SP | NC | NC |
| Improved hydration levels | | | | | | SP | | | |
| Releasing time to care | SP | | | | | | | | |
| Reduced delayed transfer of care | | | NC | | | | | | |
| Decreased number of falls | | | | NC | | | | | NC |
| More patient voices heard | | NSP | | | | | | | |
Table 3. Overview of results of the Helping in Hospitals evaluation
How did service delivery and data collection issues affect the evaluation?
The following information was gathered in conversation with the hospital trusts to better understand how service delivery and practical data collection issues may have affected the evaluation.
Service delivery factors:
- Volunteer management: Volunteers needed to be reliably present (where they are expected), present in sufficient concentration (rather than thinly spread), and well managed (sufficient oversight and allocated according to abilities), in order to have the best impact. Generally, large numbers of volunteers encouraged higher impact, but there was also a saturation level at which point increasing volunteer numbers did not necessarily result in an increase in impact.
- Referral issues: Increasing the number of patient referrals was one of the biggest problems – it slowed down the delivery of the service and meant fewer patients received volunteer support and consequently less data was available for the evaluation.
- Gathering momentum: Receiving PR and external attention tended to boost volunteering activity (e.g. higher recruitment numbers).
- Pressure on hospital beds: Hospital-wide pressures on length of stay meant patients may have been discharged before medically fit as there is insufficient support capacity. This may have made readmissions more likely.
- Pressure on staff: Staffing pressures frequently meant that less data were collected to ensure core services delivery.
HOSPITAL BY HOSPITAL RESULTS
This section covers the evaluation findings for each individual hospital, alongside a brief overview of the results, an explanation of the wider context affecting the evaluation, and a table with the summarised quantitative results.
The tables include each outcome for the relevant hospital; the average change in that outcome; the p-value, indicating whether the result is statistically significant or not; and the analysis approach used to measure it. The latter is numbered to indicate the robustness of the approach (1 being the most robust).
The tables use the following key similar to the above for the p-values:
- Dark green: Statistically significant positive change (starred)
- Yellow: No statistically significant change, positive or negative
No outcomes showed a negative change that was statistically significant.
The tables use the following key for the direction of change in each outcome:
- Dark green (p): Positive change
- Yellow (x): No change
- Red (n): Negative change
Caution: Only results with statistical significance are true effects, regardless of the direction of the change in the outcome the tables may indicate.
Cabinet Office-funded hospitals
1. Barts Health NHS Trust
- Impact volunteers had a statistically significant positive influence on mood and distress in dementia patients, patient and nurse satisfaction with volunteer support, and the time nurses spend on unskilled tasks. The positive impact on the dementia patients and nurse satisfaction matches the hospital trust's observation that dementia volunteers were well received by clinical staff due to the fact that the roles and measurement tools were very closely co-designed with the clinical Dementia and Delirium team. According to the trust, volunteers are meeting dementia nurses during their training and therefore gain more confidence to act as part of the dementia team. In addition, posters and staff guidance are used to remind staff how volunteers can support the trust and what support they need from trust staff, which may have contributed to nurse satisfaction with the volunteer support.
- No effects were found for overall patient experience, length of stay, nurses' satisfaction of the hospital's care, and time nurses spend on skilled tasks.
- Wider context: With regard to length of stay, Barts Health have a number of ongoing Length of Stay-reducing projects and did not expect to see much related impact from the volunteers on their own. Also, Length of Stay data can be deceiving in cases where a stay ends due to death, rather than successful discharge, so they need to be interpreted with caution. Lastly, pressures caused by being put under special measures in May 2015 resulted in less capacity for data collection and thus lower sample sizes.
| Outcome |
Outcome change |
p-value |
Analysis approach |
| Improved patient experience (FFT) - % of patients recommending this hospital's care |
-0.19% (n) |
0.191 |
1. Difference-in-difference |
| Improved mood in dementia patients (between 0-100%) |
20.00% (p) |
<0.001* |
3. Before vs after intervention |
| Reduced distress in dementia patients (between 7 and 32 points) |
-1.76 (p) |
<0.001* |
3. Before vs after intervention |
| Reduced length of stay (in days) |
-2.59 (p) |
0.009 |
1. Difference-in-difference |
| Improved patient satisfaction with volunteer support (% of patients satisfied) |
10.24% (p) |
0.010* |
2. Beneficiary group vs comparison group |
| Improved nursing staff satisfaction with volunteer support (% of nurses satisfied) |
59.12% (p) |
<0.001* |
2. Beneficiary group vs comparison group |
| Improved nursing staff experience (FFT) - % of nurses recommending this hospital's care |
-0.75% (n) |
0.771 |
2. Beneficiary group vs comparison group |
| Releasing time to care (% of nurse time spent on tasks that require a trained nurse) |
1.00% (p) |
0.541 |
2. Beneficiary group vs comparison group |
| Releasing time to care (% of nurse time spent on tasks that do not require a trained nurse) |
-4.00% (p) |
0.019* |
2. Beneficiary group vs comparison group |
Table 4. Quantitative impact results for Barts Health NHS Trust
2. Cambridge University Hospitals (CUH) NHS Foundation Trust
- Impact volunteers had a statistically significant positive influence on patient nutrition and a positive (non-significant) influence on number of patient voices heard. According to the hospital, mealtime training involved their senior dietician and was offered to all volunteers, both of which may have boosted their ability to improve patient nutrition levels. Furthermore, the hospital observed that having volunteers on the mobile patient survey team are particularly valuable to collect feedback from patients with communication difficulties, patients who are particularly frail and patients who have dementia. These volunteers may thus have contributed considerably in getting more patients' voices heard.
- No effects were found for overall patient experience and anxiety levels, though the latter suffers severely from ceiling effect (the outcome was already at the optimum at baseline).
- Wider context: Since data were collected for the same ward for both treatment and comparison (the difference being the days on which there were volunteers or not), the analysis may be obscured slightly due to the comparison group potentially having received some volunteering support on 'treatment' days, risking this evaluation to underestimate the effect of impact volunteering. In addition, being placed under special measures put extra pressure on the hospital and caused delays in the rollout of the mobile dementia volunteer role, and shortage of beds affected staff morale. The service therefore may not have reached its full potential.
| Outcome |
Outcome change |
p-value |
Analysis approach |
| Improved patient experience (FFT) - % of patients recommending this hospital's care |
1.61% (p) |
0.183 |
2. Beneficiary group vs comparison group |
| Improved patient nutrition (% of meal consumed) |
12.00% (p) |
< 0.001* |
2. Beneficiary group vs comparison group |
| Improved anxiety levels (% of patient requests responded to) |
0.00% (x) |
1.000 |
3. Before vs after intervention |
| More patient voices heard (number of patient surveys collected through the volunteers in addition to 4703 routine surveys) |
4067 (p) |
n/a |
n/a |
Table 5. Quantitative impact results for Cambridge University Hospitals (CUH) NHS Foundation Trust
- Impact volunteers had no observable statistically significant positive influence on patient outcomes, although patient experience was very positive (not significant). Anecdotal evidence from the hospital themselves suggests that closely matching patients with volunteers proved successful and patients felt excited about their visits from volunteers.
- No effects were found for patient confidence levels, well-being levels, readmissions, delayed transfer of care or length of stay.
- Wider context: Due to staff capacity limitations affecting the number of volunteers they could engage and train, and referrals they could arrange, the volunteering service may not have reached its potential. Consequently, fewer patients were supported and less data were available for some of the outcomes. In addition, the staff expressed some concern over the validity of the confidence and well-being survey, as patients frequently misunderstood its questions. The resulting data should therefore be viewed with some caution. Furthermore, some of the treatment wards tended to have a higher length of stay average and, combined with a few extreme outliers, this may have skewed the data. Lastly, the volunteering service discovered that it had little influence over how soon patients could be discharged (length of stay and delayed transfer of care), as this depended heavily on care packages that many patients required but that were outside the control of the volunteering service.
| Outcome |
Outcome change |
p-value |
Analysis approach |
| Improved patient experience (FFT) - % of patients recommending this hospital's care |
n/a (p) |
n/a |
n/a |
| Increased confidence at point of discharge (between 0 – 100%) |
-8.63% (n) |
0.305 |
2. Beneficiary group vs comparison group |
| Improved levels of well-being (between 0-100%) |
-9.47% (n) |
0.350 |
2. Beneficiary group vs comparison group |
| Reduced readmissions (% readmitted from total admissions) |
-0.03% (p) |
0.133 |
1. Difference-in-difference |
| Delayed transfer of care (% of patients facing a DTOC) |
n/a |
n/a |
n/a |
| Reduced length of stay (in days) |
-2.56 (p) |
0.166 |
1. Difference-in-difference |
Table 6. Quantitative impact results for Derbyshire Community Health Services NHS Trust
4. Great Western Hospitals NHS Foundation Trust
- No effects were found for overall patient experience, number of falls, readmissions or length of stay. The trust cautions that linking their volunteers' activities with these outcome is challenging (particularly for falls) due to the many other influencers on those outcomes.
- Wider context: Refurbishment made the treatment group ward more dementia-friendly. While this is beneficial to patients, it may also explain the increased length of stay trend on the treatment ward as it resulted in higher proportions of dementia patients on the ward who on average tend to have longer stays.
Table 7. Quantitative impact results for Great Western Hospitals NHS Foundation Trust
| Outcome |
Outcome change |
p-value |
Analysis approach |
| Improved patient experience (FFT) - % of patients recommending this hospital's care |
1.75% (p) |
0.539 |
2. Beneficiary group vs comparison group |
| Reduced number of falls (percentage of falls per number of beds on the ward) |
0.58% (p) |
0.910 |
2. Beneficiary group vs comparison group |
| Reduced readmissions (% readmitted from total discharges) |
-0.01% (p) |
0.874 |
1. Difference-in-difference |
| Reduced length of stay (in days) |
1.52 (n) |
0.203 |
1. Difference-in-difference |
5. Kingston Hospital NHS Foundation Trust
- Impact volunteers had a statistically significant positive influence on patient nutrition (patient experience), anxiety levels at discharge, and mood and well-being in dementia patients. According to the trust, volunteers received specific nutrition training and were involved in patients' meal choice which may have contributed to the patients' positive mealtime experience. Furthermore, volunteers benefited from supervised induction sessions involving volunteering team and clinical team supervisors to increase the general quality of the volunteers' support.
- No effects were found for overall patient experience, patient experience with regards to emotional support, readmissions and take-up of community services.
- Wider context: Hospital To Home-related outcomes saw particularly positive trends in the months immediately after the relevant volunteer training sessions, affecting patient readmissions and community services take-up. In addition, patients selected for the treatment group were often those most in need of support and were for this reason a more vulnerable population than the comparison group. The evaluation therefore may have underestimated the effects of the impact volunteers.
Table 8. Quantitative impact results for Kingston Hospital NHS Foundation Trust
| Outcome |
Outcome change |
p-value |
Analysis approach |
| Improved patient experience (FFT) - % of patients recommending this hospital's care |
1.11% (p) |
0.410 |
2. Beneficiary group vs comparison group |
| Improved patient experience (emotional support) - % of patients satisfied with the emotional support received |
0.52% (p) |
0.555 |
2. Beneficiary group vs comparison group |
| Improved nutrition (patient experience) - % of patients satisfied with the mealtime support received |
3.07% (p) |
0.008* |
2. Beneficiary group vs comparison group |
| Reduced readmissions (% readmitted from total discharges) |
-0.03% (p) |
0.683 |
1. Difference-in-difference |
| Reduced anxiety about discharge (from 1 to 10 points) |
2.17 (p) |
<0.001* |
3. Before vs after intervention |
| Increased take-up of community services (% of patients who had taken up services 6 weeks after discharge) |
3.46% (p) |
0.834 |
3. Before vs after intervention |
| Improved mood and well-being in dementia patients (from 1 to 10 points) |
1.89 (p) |
<0.001* |
3. Before vs after intervention |
6. Sheffield Teaching Hospitals NHS Foundation Trust
- Impact volunteers had a statistically significant positive influence on patient mood (social engagement aspect), mood after volunteer activities, satisfaction with eating support and satisfaction with drinking support. According to the trust, volunteers spent two weeks on the ward before their specific mealtime training to help them settle in and gain some independence and confidence. In addition, the nutrition role was advertised specifically to people with a keen interest in nursing or health care to ensure the roles were suitably filled. With regards to the mood-related outcomes, the trust observed that the specific activities volunteer role (using arts, games or music) were a welcome distraction, particularly for long-term patients, and therefore had a good chance of significantly improving patients' mood.
- No effects were found for overall patient experience, mood (distress aspect), readmissions and satisfaction with combined eating and drinking support. The latter was measured only during the beginning of the evaluation (between November 2014 and May 2015) and may not yet have captured any impact, as the nutrition role was changed and scaled in November 2014 and was only in full swing from April/May 2015, at which point nutrition and hydration were measured separately and did show significant impact (see above).
- Wider context: The trust's discharge lounge volunteer service was delayed considerably and may not have reached its full potential during the duration of the evaluation.
Table 9. Quantitative impact results for Sheffield Teaching Hospitals NHS Foundation Trust
| Outcome |
Outcome change |
p-value |
Analysis approach |
| Improved patient experience (FFT) - % of patients recommending this hospital's care |
0.43% (p) |
0.729 |
2. Beneficiary group vs comparison group |
| Improved nutrition and hydration (combined) – % of patients satisfied with eating and drinking support |
2.07% (p) |
0.669 |
2. Beneficiary group vs comparison group |
| Improved patient mood (levels of distress between 0 and 3 points) |
-0.08 (p) |
0.320 |
2. Beneficiary group vs comparison group |
| Improved patient mood (social engagement between 0 and 3 points) |
0.16 (p) |
0.030* |
2. Beneficiary group vs comparison group |
| Improved patient nutrition – eating support satisfaction (between 0 and 3 points) |
0.49 (p) |
< 0.001* |
2. Beneficiary group vs comparison group |
| Improved patient hydration – drinking support satisfaction (between 0 and 3 points) |
0.71 (p) |
< 0.001* |
2. Beneficiary group vs comparison group |
| Reduced readmissions (% readmitted from total discharges) |
1.04 (n) |
0.611 |
3. Before vs after intervention |
| Improved patient mood before and after volunteer activity (between 1-10 points) |
2.01 (p) |
<0.001* |
3. Before vs after intervention |
Department of Health-funded hospitals:
7. Royal Free London NHS Foundation Trust
- Young impact volunteers had a statistically significant positive influence on patient nutrition and experience finding their way around the hospital. A positive trend was also observed in the number of requests front of staff needed to deal with (non-significant).
- No effects were found for overall patient experience.
- Wider context: Their CQC visit in January 2016 caused considerable stress and tied up staff capacity on all levels. Among other things, this resulted in less data being collected for the evaluation.
Table 10. Quantitative impact results for Royal Free London NHS Foundation Trust
| Outcome |
Outcome change |
p-value |
Analysis approach |
| Improved patient experience (FFT) - % of patients recommending this hospital's care |
0.23 (p) |
0.431 |
1. Difference-in-difference |
| Decreased monthly number of requests made to front of house staff as a result of volunteers supporting front of house staff |
-10,449 (p) |
n/a |
n/a |
| Improved nutrition (% of meal consumed) |
18.46% (p) |
< 0.001* |
1. Difference-in-difference |
| Patient experience (finding their way around the hospital) – between 1 and 5 points |
0.52 (p) |
0.003* |
3. Before vs after intervention |
8. University Hospital Southampton NHS Foundation Trust
- No effects were found for overall patient experience, nutritional intake (both calories and protein levels), or mood.
- Wider context: Due to a major ward move, volunteering service delivery and related data collection were delayed and only took full effect from October 2015 onwards. The service therefore may not yet have reached its full potential. Also, the service discovered that some volunteers had been deployed to the comparison ward, thereby introducing a slight risk that the evaluation was underestimating the impact volunteers' effect on patients. In addition, the treatment ward may have a slightly younger and fitter population due to some of their patients being elective, affecting the comparability of the treatment and comparison group somewhat. Lastly, research staff shortages resulted in less data being collected.
- A larger study on nutrition is currently underway at the hospital and results are expected in August this year.
Table 11. Quantitative impact results for University Hospital Southampton NHS Foundation Trust
| Outcome |
Outcome change |
p-value |
Analysis approach |
| Improved patient experience (FFT) - % of patients recommending this hospital's care |
-0.07 (n) |
0.678 |
1. Difference-in-difference |
| Improved nutrition (calories intake at mealtime) |
-40.13 (n) |
0.582 |
1. Difference-in-difference |
| Improved nutrition (protein intake at mealtime) |
-2.19 (n) |
0.445 |
1. Difference-in-difference |
| Improved mood (between 1 – 5 points) |
-0.14 (n) |
0.348 |
1. Difference-in-difference |
9. Western Sussex Hospitals NHS Foundation Trust
- Young impact volunteers had no significant effects on overall patient experience, satisfaction with nutrition support, falls and anxiety levels. However, for anxiety, baseline levels were at maximum (100 per cent) and therefore no improvement was possible.
- Wider context: The service's discharge lounge volunteer role was delayed considerably as it was reviewed due to concerns that it was not sufficiently efficient when it was first rolled out. Its effectiveness therefore may not be detectable within the timeframe of the evaluation. In addition, the treatment group may consist of a slightly more vulnerable population as the dementia ward was included (for ethical reasons). Furthermore, staffing pressures were somewhat higher on treatment wards, particularly due to a ward expansion. In both treatment and comparison groups, these pressures may have had a negative effect on the data and reduced capacity for data collection. Furthermore, one of the treatment wards initially struggled to make time to work with the volunteers due to work pressures, and therefore recruiting volunteers for this team was a challenge. The team remained resistant for some time but had overcome this by the end of the project. Still, this may have led to an underestimation of the volunteers' impact across the project.
Table 12. Quantitative impact results for Western Sussex Hospitals NHS Foundation Trust
| Outcome |
Outcome change |
p-value |
Analysis approach |
| Improved patient experience (FFT) - % of patients recommending this hospital's care |
-1.49% (n) |
0.289 |
2. Beneficiary group vs comparison group |
| Improved patient nutrition (patient experience) - % of patients satisfied with the mealtime support received |
-1.86% (n) |
0.421 |
2. Beneficiary group vs comparison group |
| Reduced number of falls (percentage of falls per number of beds on the ward) |
2.5% (p) |
0.236 |
2. Beneficiary group vs comparison group |
| Reduced anxiety levels (% of patients feeling confident in the hospital's care) |
n/a |
n/a |
1. Difference-in-difference |
DISCUSSION
Hospital impact volunteering shows promise as a way to improve patient experience, mood, anxiety levels, nutrition and hydration, and release nurse time to care.
INTERPRETING THE RESULTS
This evaluation aimed to answer one key question:
Can hospital impact volunteering help improve patients' experience and well-being?
The evaluation of the Helping in Hospitals project indicates that hospital impact volunteering shows promise as a way to improve patients' experience and well-being. It detected statistically significant positive findings on thirty percent of all outcomes, including overall patient experience, mood, anxiety levels, nutrition and hydration, and releasing nurse time to care.
However, the results were mixed and some hospitals did not receive positive findings, for which there are a multitude of possible explanations, such as service delivery challenges and related staffing shortages, lack of sufficient data, difficulties with collecting data from the most vulnerable, bias affecting data collection and wider pressures on the healthcare system. Consequently, a further range of factors influence the measured patient outcomes and make isolating the impact of the volunteers extremely challenging.
Furthermore, flaws in the methodologies employed during the hospitals' evaluations need to be taken into account when interpreting the results (see full research limitations on page 8). In short, the comparative approaches used cannot allow us to completely exclude the potential for other factors (rather than the impact volunteers) to have influenced the measured outcomes. The measurement tools employed have not yet been tested, and therefore may not be as valid or as sensitive as they could be. Lastly, the practical realities of data collection may in some cases have caused us to under- or overestimate the impact volunteers' impact.
As a result, it is important to treat the results of this evaluation with the appropriate level of caution. The less robust a design is, the more at risk it is of overestimating impact, and the less confident we can be in the results. This evaluation reflects this as more positive results are found in the less robust designs.
However, considering the early stage of development of many of the impact volunteering roles evaluated here, and the ambitious evaluation approaches taken to measure them, the results are – on the whole - promising. Similar results were found across hospitals, strengthening the evidence produced by individual hospitals. In combination, they strongly suggest that impact volunteering has already shown significant effects on patient experience and well-being, and has the potential to bring the same effects to hospitals that have not yet observed such changes.
RECOMMENDATIONS
Based on the findings of this evaluation, we can make the following recommendations to service providers, researchers and funders/commissioners.
Recommendations for funders/commissioners
- Further invest in hospital impact volunteering as a way to improve patient experience and well-being, as well as to potentially relieve pressure on the healthcare system.
- Provide sufficient resources for the evaluation of hospital impact volunteering to further our understanding of what impact it can have for patients and other stakeholders, and to identify ways to further improve volunteering services. This will enable smarter policy decisions in the future.
Recommendations for service delivery
- Ensure that volunteers are reliably present, present in sufficient concentration, well managed and allocated according to their abilities, in order to have the best impact. Generally, large numbers of volunteers encourage higher impact, but there also is a saturation level at which point increasing volunteer numbers does not necessarily result in an increase in impact.
- Focus sufficiently on encouraging patient referrals and matching to avoid slowing down the delivery of volunteering roles, such as hospital to home or dementia patient activities.
- Use PR and external attention to boost volunteering activity.
- Keep monitoring key patient outcomes to ensure the sustainability of the service.
Recommendations for evaluation
- Review which outcomes hospital impact volunteers realistically can influence and focus your evaluation on those.
- Review and pilot measurement tools before rolling them out. Ensure they are valid (capture accurate data), reliable (collect consistent data) and appropriate (capture data even from vulnerable populations such as dementia patients).
- Conduct increasingly rigorous evaluations once the volunteering roles are fully developed and solidly implemented, in order to increase the certainty with which you can claim the effectiveness of the service.
CONCLUSION
Hospital impact volunteering shows promise as a way to maintain or improve patient experience and well-being outcomes and has the potential to relieve pressures on the healthcare system.
APPENDICES
Additional detail and resources from the evaluation of Helping in Hospitals
APPENDIX 1: HELPING IN HOSPITALS OVERARCHING THEORY OF CHANGE
The below Theory of Change diagram provides an overview of the variety of volunteering services provided as part of the Helping in Hospitals programme (on the left) and their collective impact on patients, both in terms of their ultimate goals (on the right) and the intermediate outcomes on which they depend (in the middle). The outcomes that were measured in the present evaluation are marked with a star. Those outcomes with small stars have been measured by one to three hospital trusts while outcomes with large stars have been measured by five to ten hospital trusts. The diagram thus provides a visual overview of the kind of evidence that was produced across the hospital trusts by the evaluation of the Helping in Hospitals programme.
APPENDIX 2: INDIVIDUAL HOSPITALS' THEORIES OF CHANGE
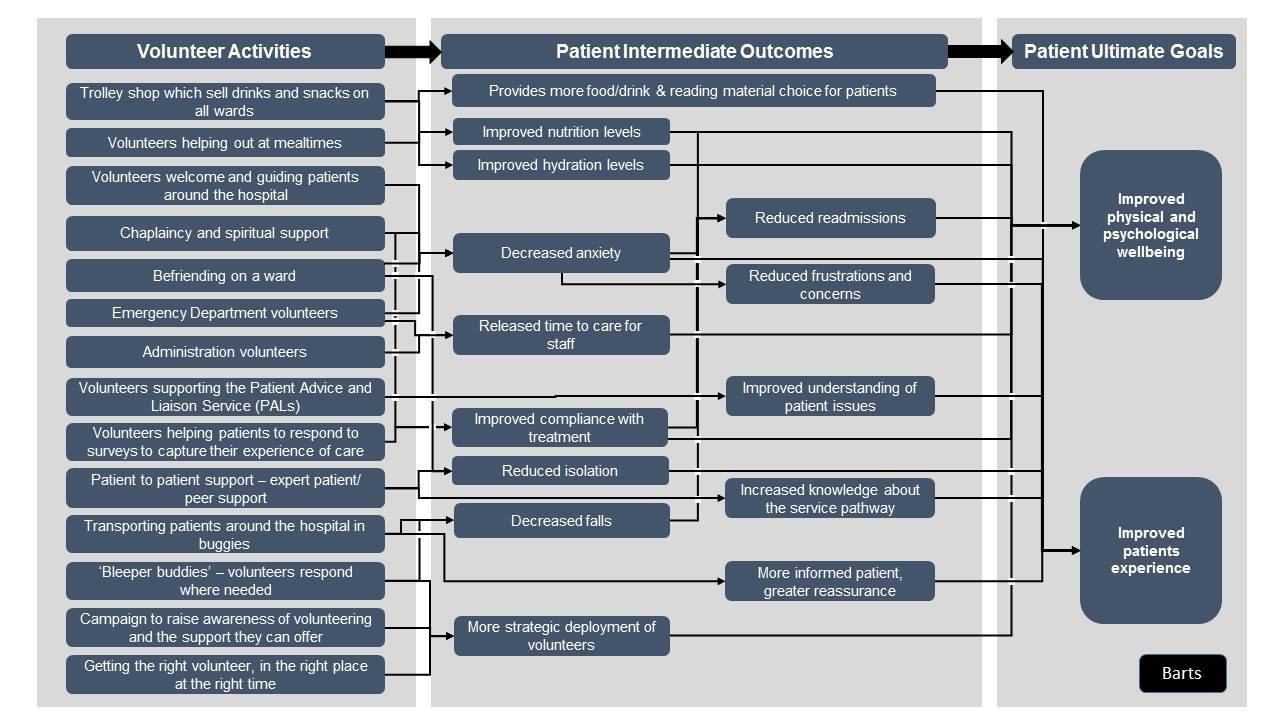
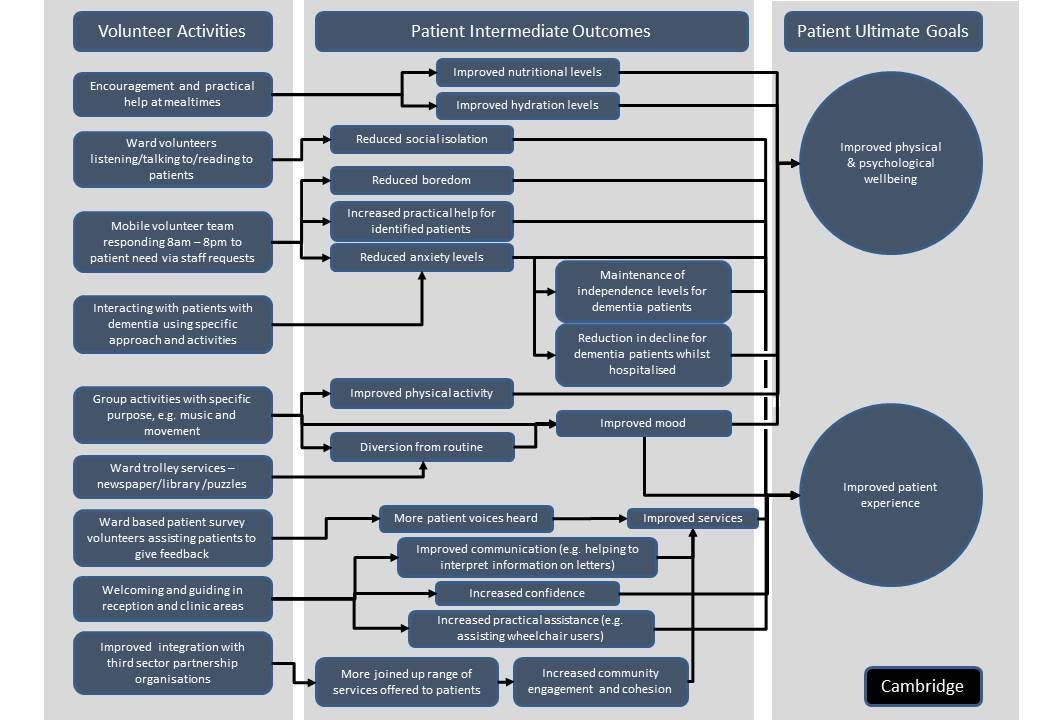
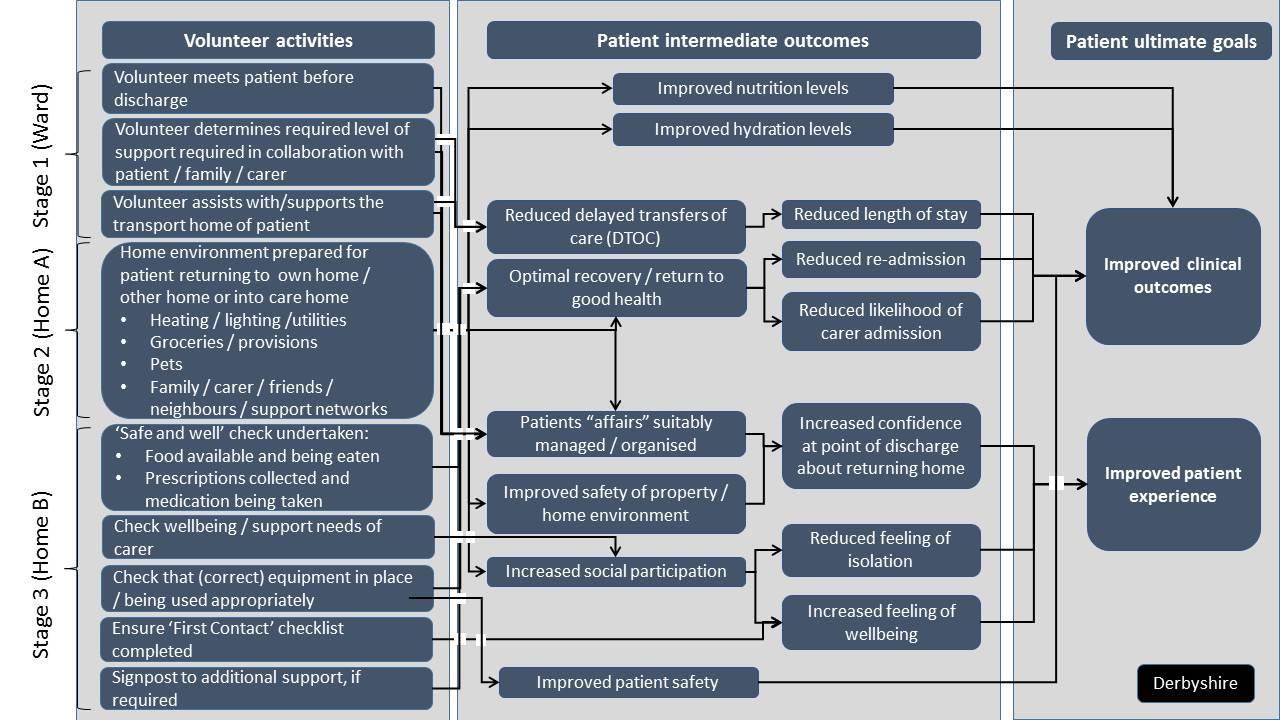
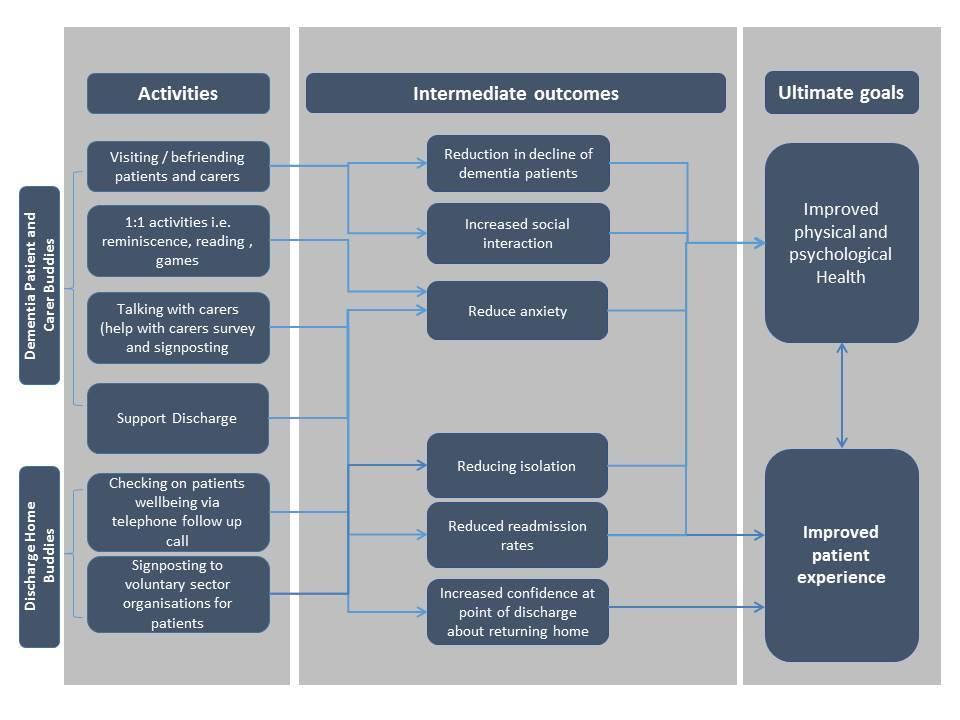
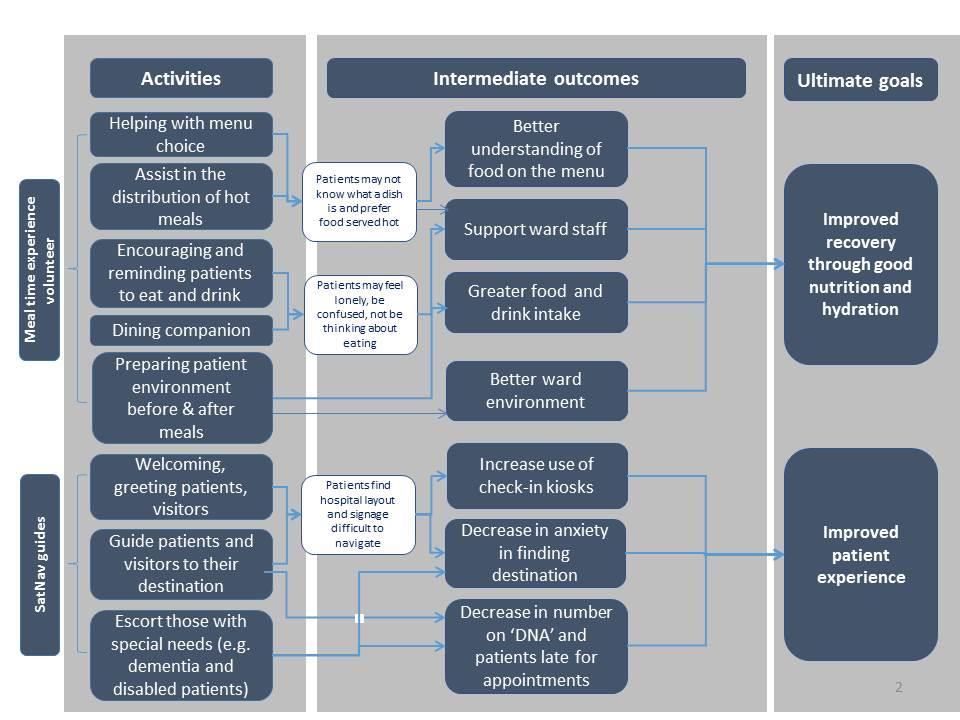
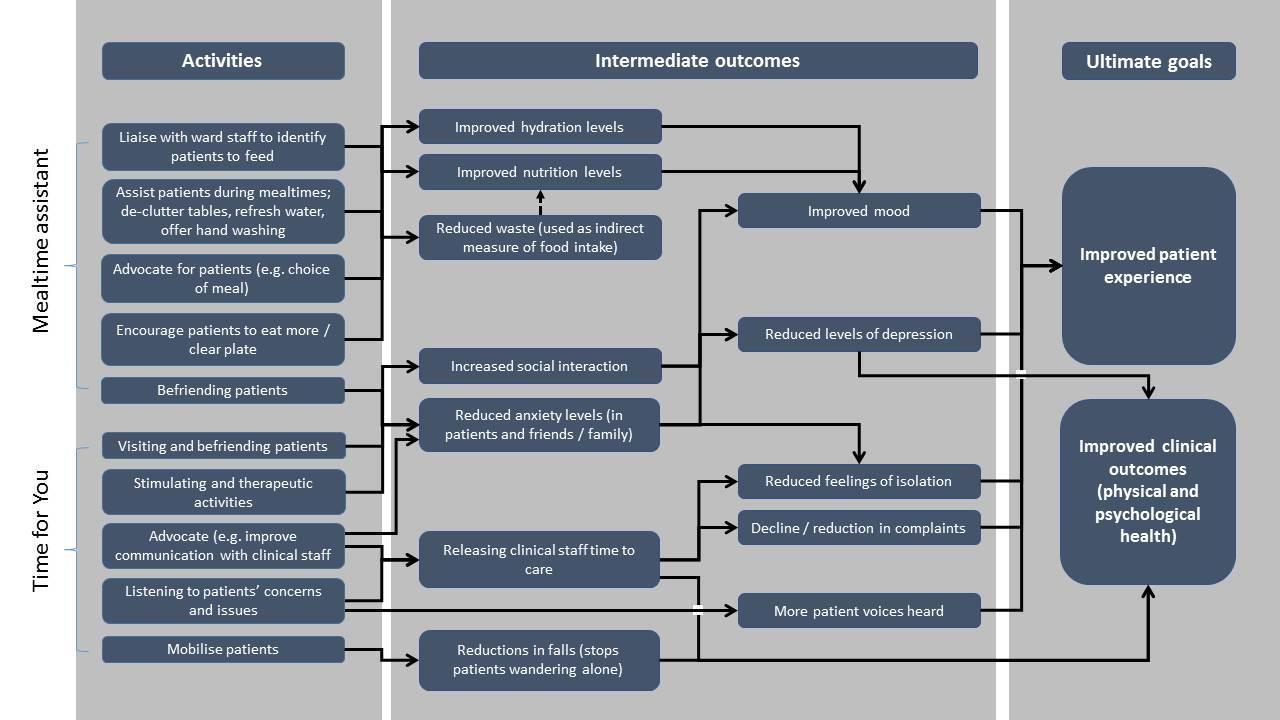
The following section provides the individual Theories of Change of the ten hospital trusts that were funded as part of the Helping in Hospitals programme. Similar to the overarching Theory of Change, each individual hospital trust Theory of Change provides an overview of the volunteering services provided as part of the Helping in Hospitals programme (on the left) and their impact on patients, both in terms of their ultimate goals (on the right) and the intermediate outcomes on which they depend (in the middle).
BARTS HEALTH NHS TRUST
CAMBRIDGE UNIVERSITY HOSPITALS NHS FOUNDATION TRUST
GREAT WESTERN HOSPITALS NHS FOUNDATION TRUST
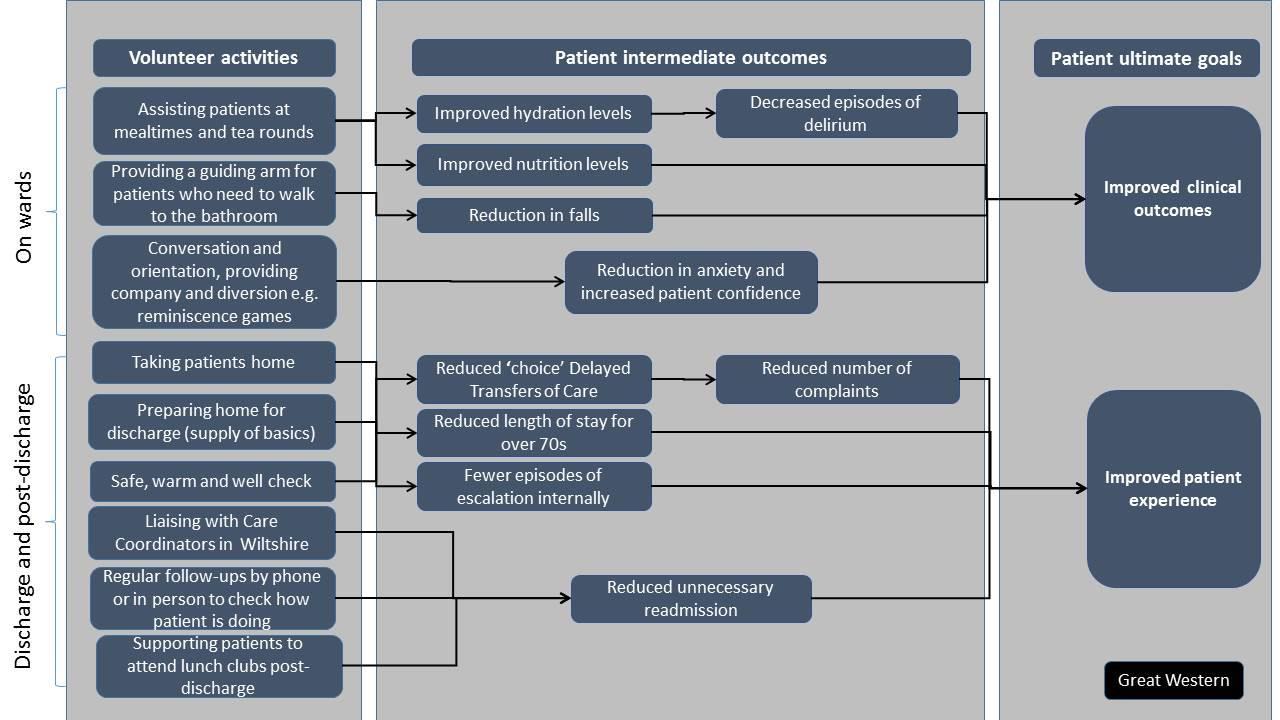
KINGSTON HOSPITAL NHS FOUNDATION TRUST
Flowchart illustrating volunteer activities, intermediate patient outcomes, and ultimate patient goals for Kingston Hospital NHS Foundation Trust.
Volunteer Activities:
* Hospital to Home Service (dementia): Pre-discharge visits, accompany patient home and immediate home re-induction, post discharge home visits/befriending phone calls, sign-posting to appropriate local voluntary sector services and community groups, practical support (e.g. shopping, packing, collecting from Pharmacy), Carer Support Plan Created.
* Dining Companions: Sit with patient during mealtimes, tasks that enabling eating & drinking (e.g. adapted cutlery).
* Hospital Rangers: Support patients before, during and after appointment using structured model, accompany patients to multiple services in a single visit (e.g. A&E and x-ray).
* Dementia Volunteering: Therapeutic 121 activities at bedside across care of the elderly wards, therapeutic group activities (e.g. Memory Lane Lunch Club).
Patient Intermediate Outcomes:
* Increased number of patients achieving estimated date of discharge.
* Reduced anxiety about discharge.
* Reduced emergency re-admissions.
* Increased take-up of Voluntary Sector Services in community.
* Increased number of patients leaving hospital earlier in day.
* Reduced Delayed Transfer of Care.
* Improved nutrition & hydration.
* Improved perceptions of mealtimes.
* Releasing time to care.
* Reduced fear & anxiety about outpatient appointments.
* Increased number of dementia patients engaging in personalised therapeutic activities.
* Reduced patient agitation.
* Improved patient mood & wellbeing.
Patient Ultimate Goals:
* Improved patient experience.
* Improved clinical outcomes.
SHEFFIELD TEACHING HOSPITALS NHS FOUNDATION TRUST
Flowchart illustrating volunteer activities, intermediate patient outcomes, and ultimate patient goals for Sheffield Teaching Hospitals NHS Foundation Trust.
Volunteer Activities:
* Supporting patients at mealtimes, feeding patients at mealtimes.
* Activity volunteering (e.g. reading, games, iPad).
* Arts volunteering (e.g. painting, music).
* On call volunteering (as and when needed, e.g. supporting unexpected clinic cancellations).
* Welcome volunteering (meet, greet, signposting).
* Hospital to home (post discharge) help, shopping, company.
* Hospital to home (pre discharge) meet patient on ward to plan and agree help at home.
Patient Intermediate Outcomes:
* Improved hydration levels.
* Improved nutrition levels.
* Improved social interaction.
* Increased sense of feeling welcome.
* Releasing staff time to care.
* Reduced DNA rate (did not attend).
* Reduced readmissions.
* Reduced social isolation.
* Reduced anxiety levels.
* Reduced length of stay.
* Decreased number of falls.
* Reduced depression levels.
* Improved mood.
Patient Ultimate Goals:
* Improved clinical outcomes.
* Improved patient experience.
THE PRINCESS ALEXANDRA HOSPITAL NHS TRUST
ROYAL FREE LONDON NHS FOUNDATION TRUST
UNIVERSITY HOSPITAL SOUTHAMPTON NHS FOUNDATION TRUST
WESTERN SUSSEX HOSPITALS NHS FOUNDATION TRUST
APPENDIX 3: ADDITIONAL DETAIL ON IMPACT RESULTS
This section provides additional detail on each of the hospital's evaluation results for those audiences that are interested. As relevant, it provides separate data on the treatment and comparison groups, on baseline and follow-up, including means, standard deviations (where relevant) and sample sizes.
1. Barts Health NHS Trust
| Outcome |
Patient group |
Baseline Mean |
Baseline Sample size |
Follow-up Mean |
Follow-up Sample size |
Diff-in-diff p-value |
| Improved patient experience (FFT) - % of patients recommending this hospital's care |
Treatment |
92.86% |
56 |
94.80% |
409 |
0.191 |
|
Comparison |
91.15% |
113 |
93.01% |
185 |
|
| Outcome |
Patient group |
Baseline Mean |
Baseline Sample size |
Follow-up Mean |
Follow-up Sample size |
t-test p-value |
| Improved mood in dementia patients (between 0-100%) |
Treatment |
68.00% |
58 |
88.00% |
58 |
< 0.001* |
| Reduced distress in dementia patients (between 7 and 32 points) |
Treatment |
10.14 |
58 |
8.38 |
58 |
<0.001* |
| Outcome |
Patient group |
Baseline Mean |
Baseline Standard deviation |
Baseline Sample size |
Follow-up Mean |
Follow-up Standard deviation |
Follow-up Sample size |
Diff-in-diff p-value |
| Reduced length of stay (in days) |
Treatment |
13.70 |
17.17 |
584 |
7.34 |
11.81 |
4132 |
0.009 |
|
Comparison |
10.95 |
19.03 |
853 |
7.19 |
12.09 |
4573 |
|
| Outcome |
Patient group |
Follow-up Mean |
Follow-up Sample size |
t-test p-value |
| Improved patient satisfaction with volunteer support (% of patients satisfied) |
Treatment |
98.84% |
86 |
0.010* |
|
Comparison |
88.60% |
35 |
|
| Improved nursing staff satisfaction with volunteer support (% of nurses satisfied) |
Treatment |
99.12% |
113 |
<0.001* |
|
Comparison |
40.00% |
10 |
|
| Improved nursing staff experience (FFT) - % of nurses recommending this hospital's care |
Treatment |
94.15% |
156 |
0.771 |
|
Comparison |
94.90% |
155 |
|
2. Cambridge University Hospital (CUH) NHS Foundation Trust
The two satisfaction with volunteer support outcomes refer specifically to people who have seen a volunteer (within any given treatment ward, volunteers would only interact with a proportion of patients, rarely all), which is why sample size is much lower in comparison group. Interestingly, it shows that volunteers are rated as less useful on comparison wards.
| Outcome |
Patient group |
Follow-up Mean |
Follow-up Standard deviation |
Follow-up Sample size |
t-test p-value |
| Releasing time to care (% of nurse time spent on tasks that require a trained nurse) |
Treatment |
67.00% |
0.14 |
158 |
0.541 |
|
Comparison |
66.00% |
0.15 |
157 |
|
| Releasing time to care (% of nurse time spent on tasks that do not require a trained nurse) |
Treatment |
33.00% |
0.14 |
158 |
0.019* |
|
Comparison |
37.00% |
0.16 |
157 |
|
| Outcome |
Patient group |
Follow-up Mean |
Follow-up Sample size |
t-test p-value |
| Improved patient experience (FFT) - % of patients recommending this hospital's care |
Treatment |
93.08% |
737 |
0.183 |
|
Comparison |
91.47% |
1656 |
|
| Outcome |
Patient group |
Follow-up Mean |
Follow-up Standard deviation |
Follow-up Sample size |
t-test p-value |
| Improved patient nutrition (% of meal consumed) |
Treatment |
76.00% |
0.27 |
158 |
< 0.001* |
|
Comparison |
64.00% |
0.35 |
205 |
|
| Outcome |
Patient group |
Baseline Mean |
Baseline Sample size |
Follow-up Mean |
Follow-up Sample size |
t-test p-value |
| Improved anxiety levels (% of patient requests responded to) |
Treatment |
100.00% |
46 |
100.00% |
94 |
1.000 |
The value in the mean columns represents the percentage of requests from patients that volunteers were able to respond to and consequently address any patient anxieties.
| Outcome |
Patient group |
Follow-up Sample size |
t-test p-value |
| More patient voices heard (number of patient surveys) |
Collected by volunteers |
4067 |
n/a |
|
Collected routinely |
4703 |
|
The hospital already collects large number of surveys from patients, but with the help of the iPad volunteers, 86% additional surveys were collected.
3. Derbyshire Community Health Services NHS Trust
| Outcome |
Patient group |
Follow-up Mean |
Follow-up Sample size |
t-test p-value |
| Improved patient experience (FFT) - % of patients recommending this hospital's care |
Treatment |
100.00% |
19 |
n/a |
| Increased confidence at point of discharge (between 0 – 100%) |
Treatment |
72.52% |
31 |
0.305 |
|
Comparison |
81.15% |
95 |
|
| Improved levels of well-being (between 0-100%) |
Treatment |
67.69% |
31 |
0.350 |
|
Comparison |
77.16% |
95 |
|
| Outcome |
Patient group |
Baseline Mean |
Baseline Sample size |
Follow-up Mean |
Follow-up Sample size |
Diff-in-diff p-value |
| Reduced readmissions (% readmitted from total admissions) |
Treatment |
5.20% |
247 |
1.96% |
458 |
0.133 |
|
Comparison |
1.38% |
360 |
0.66% |
603 |
|
| Delayed transfer of care (% of patients facing a DTOC) |
Treatment |
6.87% |
247 |
7.41% |
458 |
n/a* |
|
Comparison |
8.77% |
360 |
10.14% |
603 |
|
*It was not feasible to conduct a difference-in-difference analyses here.
| Outcome |
Patient group |
Baseline Mean |
Baseline Standard deviation |
Baseline Sample size |
Follow-up Mean |
Follow-up Standard deviation |
Follow-up Sample size |
Diff-in-diff p-value |
| Reduced length of stay (in days) |
Treatment |
25.47 |
29.36 |
186 |
21.22 |
17.68 |
467 |
0.166 |
|
Comparison |
19.40 |
19.57 |
281 |
19.06 |
17.27 |
618 |
|
4. Great Western Hospitals NHS Foundation Trust
| Outcome |
Patient group |
Follow-up Mean |
Follow-up Sample size |
t-test p-value |
| Improved patient experience (FFT) - % of patients recommending this hospital's care |
Treatment |
91.42% |
210 |
0.539 |
|
Comparison |
89.67% |
213 |
|
| Reduced number of falls (percentage of falls per number of beds on the ward) |
Treatment |
34.29% |
175 |
0.910 |
|
Comparison |
33.71% |
175 |
|
5. Kingston Hospital NHS Foundation Trust
| Outcome |
Patient group |
Baseline Mean |
Baseline Sample size |
Follow-up Mean |
Follow-up Sample size |
Diff-in-diff p-value |
| Reduced readmissions (% readmitted from total discharges) |
Treatment |
14.64% |
485 |
15.27% |
478 |
0.874 |
|
Comparison |
14.09% |
447 |
15.24% |
492 |
|
| Outcome |
Patient group |
Baseline Mean |
Baseline Standard deviation |
Baseline Sample size |
Follow-up Mean |
Follow-up Standard deviation |
Follow-up Sample size |
Diff-in-diff p-value |
| Reduced length of stay (in days) |
Treatment |
15.60 |
12.89 |
479 |
16.77 |
13.54 |
470 |
0.203 |
|
Comparison |
15.09 |
16.29 |
439 |
14.08 |
14.12 |
479 |
|
| Outcome |
Patient group |
Follow-up Mean |
Follow-up Sample size |
t-test p-value |
| Improved patient experience (FFT) - % of patients recommending this hospital's care |
Treatment |
92.27% |
552 |
0.410 |
|
Comparison |
91.16% |
1999 |
|
| Improved patient experience (emotional support) - % of patients satisfied with the emotional support received |
Treatment |
97.45% |
502 |
0.555 |
|
Comparison |
96.93% |
1312 |
|
| Improved nutrition (patient experience) - % of patients satisfied with the mealtime support received |
Treatment |
98.63% |
375 |
0.008* |
|
Comparison |
95.56% |
754 |
|
| Outcome |
Patient group |
Baseline Mean |
Baseline Sample size |
Follow-up Mean |
Follow-up Sample size |
Diff-in-diff p-value |
| Reduced readmissions (% readmitted from total discharges) |
Treatment |
13.33% |
30 |
10.46% |
86 |
0.683 |
|
Comparison |
10.37% |
5259 |
10.37% |
12736 |
|
| Outcome |
Patient group |
Baseline Mean |
Baseline Sample size |
Follow-up Mean |
Follow-up Sample size |
t-test p-value |
| Reduced anxiety about discharge (from 1 to 10 points) |
Treatment |
5.42 |
91 |
7.59 |
91 |
< 0.001* |
| Increased take-up of community services (% of patients who had taken up services 6 weeks after discharge) |
Treatment |
40.00% |
10 |
43.46% |
91 |
0.834 |
| Improved mood and well-being in dementia patients (from 1 to 10 points) |
Treatment |
5.25 |
626 |
7.14 |
626 |
< 0.001* |
6. Sheffield Teaching Hospitals NHS Foundation Trust
| Outcome |
Patient group |
Follow-up Mean |
Follow-up Sample size |
t-test p-value |
| Improved patient experience (FFT) - % of patients recommending this hospital's care |
Treatment |
94.24% |
743 |
0.729 |
|
Comparison |
93.81% |
673 |
|
| Improved nutrition and hydration (combined) - % of patients satisfied with eating and drinking support |
Treatment |
87.28% |
90 |
0.669 |
|
Comparison |
85.21% |
117 |
|
| Outcome |
Patient group |
Follow-up Mean |
Follow-up Standard deviation |
Follow-up Sample size |
t-test p-value |
| Improved patient mood (levels of distress between 0 and 3 points) |
Treatment |
0.72 |
0.92 |
176 |
0.320 |
|
Comparison |
0.80 |
0.97 |
750 |
|
| Improved patient mood (social engagement between 0 and 3 points) |
Treatment |
2.26 |
0.93 |
195 |
0.030* |
|
Comparison |
2.10 |
0.91 |
729 |
|
| Improved patient nutrition - eating support satisfaction (between 0 and 3 points) |
Treatment |
2.76 |
0.67 |
138 |
<0.001* |
|
Comparison |
2.27 |
1.15 |
487 |
|
| Improved patient hydration - drinking support satisfaction (between 0 and 3 points) |
Treatment |
2.65 |
0.75 |
102 |
<0.001* |
|
Comparison |
1.94 |
1.25 |
334 |
|
| Outcome |
Patient group |
Baseline Mean |
Baseline Sample size |
Follow-up Mean |
Follow-up Sample size |
t-test p-value |
| Reduced readmissions (% readmitted from total discharges) |
Treatment |
16.07% |
1201 |
17.11% |
450 |
0.611 |
| Improved patient mood before and after volunteer activity (between 1 - 10 points) |
Treatment |
6.26 |
70 |
8.27 |
70 |
<0.001* |
7. Royal Free London NHS Foundation Trust
| Outcome |
Patient group |
Baseline Mean |
Baseline Sample size |
Follow-up Mean |
Follow-up Sample size |
Diff-in-diff p-value |
| Improved patient experience (FFT) - % of patients recommending this hospital's care |
Treatment |
80.40% |
46 |
80.84% |
322 |
0.431 |
|
Comparison |
90.50% |
21 |
81.26% |
178 |
|
| Outcome |
Patient group |
Baseline Total |
Baseline Per month |
Follow-up Total |
Follow-up Per month |
t-test p-value |
| Decreased number of requests made to front of house staff* |
Both treatment and comparison |
14,500 |
14,500 |
24,304 |
4,051 |
n/a |
*as a result of volunteers supporting front of house staff
| Outcome |
Patient group |
Baseline Mean |
Baseline Standard deviation |
Baseline Sample size |
Follow-up Mean |
Follow-up Standard deviation |
Follow-up Sample size |
Diff-in-diff p-value |
| Improved nutrition (% of meal consumed) |
Treatment |
57.89% |
0.30 |
98 |
76.17% |
0.21 |
1412 |
< 0.001 |
|
Comparison |
52.70% |
0.29 |
102 |
53.51% |
0.24 |
4967 |
|
| Outcome |
Patient group |
Baseline Mean |
Baseline Standard deviation |
Baseline Sample size |
Follow-up Mean |
Follow-up Standard deviation |
Follow-up Sample size |
t-test p-value |
| Patient experience (finding their way around the hospital) - between 1 and 5 points |
Treatment |
3.52 |
1.01 |
27 |
4.04 |
0.86 |
338 |
0.003* |
8. University Hospital Southampton NHS Foundation Trust
| Outcome |
Patient group |
Baseline Mean |
Baseline Sample size |
Follow-up Mean |
Follow-up Sample size |
Diff-in-diff p-value |
| Improved patient experience (FFT) - % of patients recommending this hospital's care |
Treatment |
96.00% |
48 |
92.25% |
285 |
0.678 |
|
Comparison |
97.00% |
34 |
96.13% |
416 |
|
9. Western Sussex Hospitals NHS Foundation Trust
| Outcome |
Patient group |
Baseline Mean |
Baseline Standard deviation |
Baseline Sample size |
Follow-up Mean |
Follow-up Standard deviation |
Follow-up Sample size |
Diff-in-diff p-value |
| Improved nutrition (calories intake at mealtime) |
Treatment |
346.28 |
231.13 |
25 |
334.33 |
212.86 |
33 |
0.582 |
|
Comparison |
347.50 |
196.45 |
36 |
375.68 |
165.01 |
38 |
|
| Improved nutrition (protein intake at mealtime) |
Treatment |
13.13 |
8.22 |
25 |
10.95 |
6.87 |
33 |
0.445 |
|
Comparison |
14.93 |
9.23 |
36 |
14.95 |
8.06 |
38 |
|
| Improved mood (between 1 - 5 points) |
Treatment |
3.56 |
1.03 |
99 |
3.39 |
0.97 |
1187 |
0.348 |
|
Comparison |
3.42 |
2.21 |
118 |
3.22 |
1.06 |
1214 |
|
| Outcome |
Patient group |
Follow-up Mean |
Follow-up Sample size |
t-test p-value |
| Improved patient experience (FFT) - % of patients recommending this hospital's care |
Treatment |
89.42% |
855 |
0.289 |
|
Comparison |
90.91% |
929 |
|
| Improved patient nutrition (patient experience) - % of patients satisfied with the mealtime support received |
Treatment |
85.48% |
471 |
0.421 |
|
Comparison |
87.34% |
420 |
|
| Reduced number of falls (percentage of falls per number of beds on the ward) |
Treatment |
11.07% |
524 |
0.236 |
|
Comparison |
13.57% |
442 |
|
| Outcome |
Patient group |
Baseline Mean |
Baseline Sample size |
Follow-up Mean |
Follow-up Sample size |
Diff-in-diff p-value |
| Reduced anxiety levels (% of patients feeling confident in the hospital's care) |
Treatment |
100.00% |
12 |
98.70% |
327 |
n/a |
|
Comparison |
100.00% |
39 |
98.00% |
519 |
|
APPENDIX 4: MEASUREMENT TOOLS
Additional detail on measurement tools
Below is the full table with more detail on the measurement tools, including the full questions, answer options and their advantages and disadvantages. The full copies of these tools are available and are free to use.
| Outcome | Tool
| Content Type | Description |
| **Description of Service | Number of Services Provided/Recipients Reached | Type of Impact | Specific Outcomes/Metrics | Impact Achieved | falls |
| Other | | | | More patient voices heard | This can be measured easily by counting the number of patient surveys that include patient feedback, or by counting the number of patient complaints. | This can be measured easily by counting the number of patient surveys that include patient feedback, or by counting the number of patient complaints. |
List of tools:
- Derbyshire Community Health Services's confidence & well-being survey
- Derbyshire Community Health Services's FFT survey
- Kingston Hospital's anxiety survey
- Kingston Hospital's mood & well-being for dementia patients survey
- Cambridge University Hospital's nutritional intake form
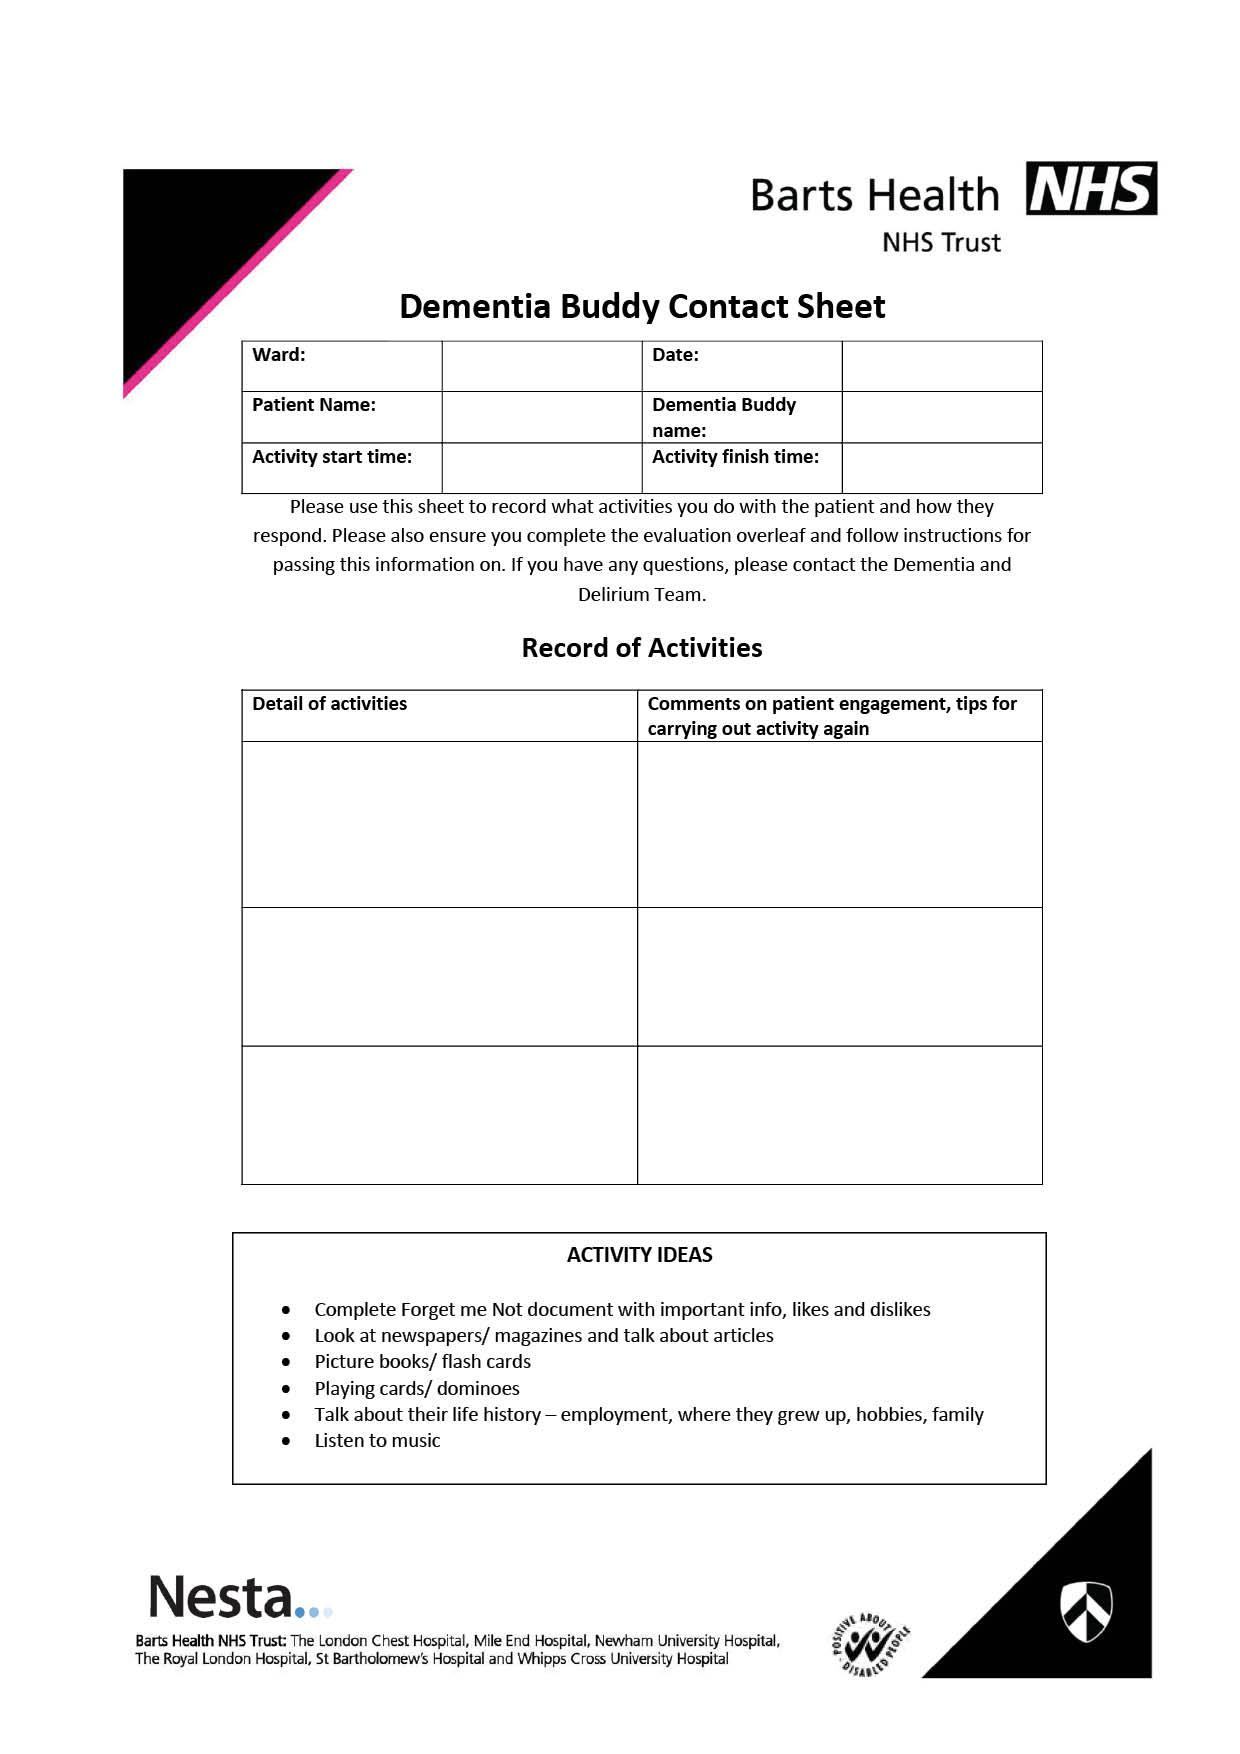
- Barts Health's Dementia mood & distress survey
- Barts Health's Releasing time to care survey & nurse FFT
The analysis revealed that the treatment and comparison groups were not sufficiently comparable in terms of average length of stay at baseline – before the volunteering was fully implemented (see page 19 for the difference between the two groups). The analysis and results are thus not sufficiently reliable. The analysis model is not appropriate given that the trends of the treatment and control group data are not parallel in the baseline period. Therefore, even though this result is technically speaking statistically significant, it cannot be accepted as a true positive effect.
Insufficient variability and sample size to conduct a valid difference-in-difference analysis
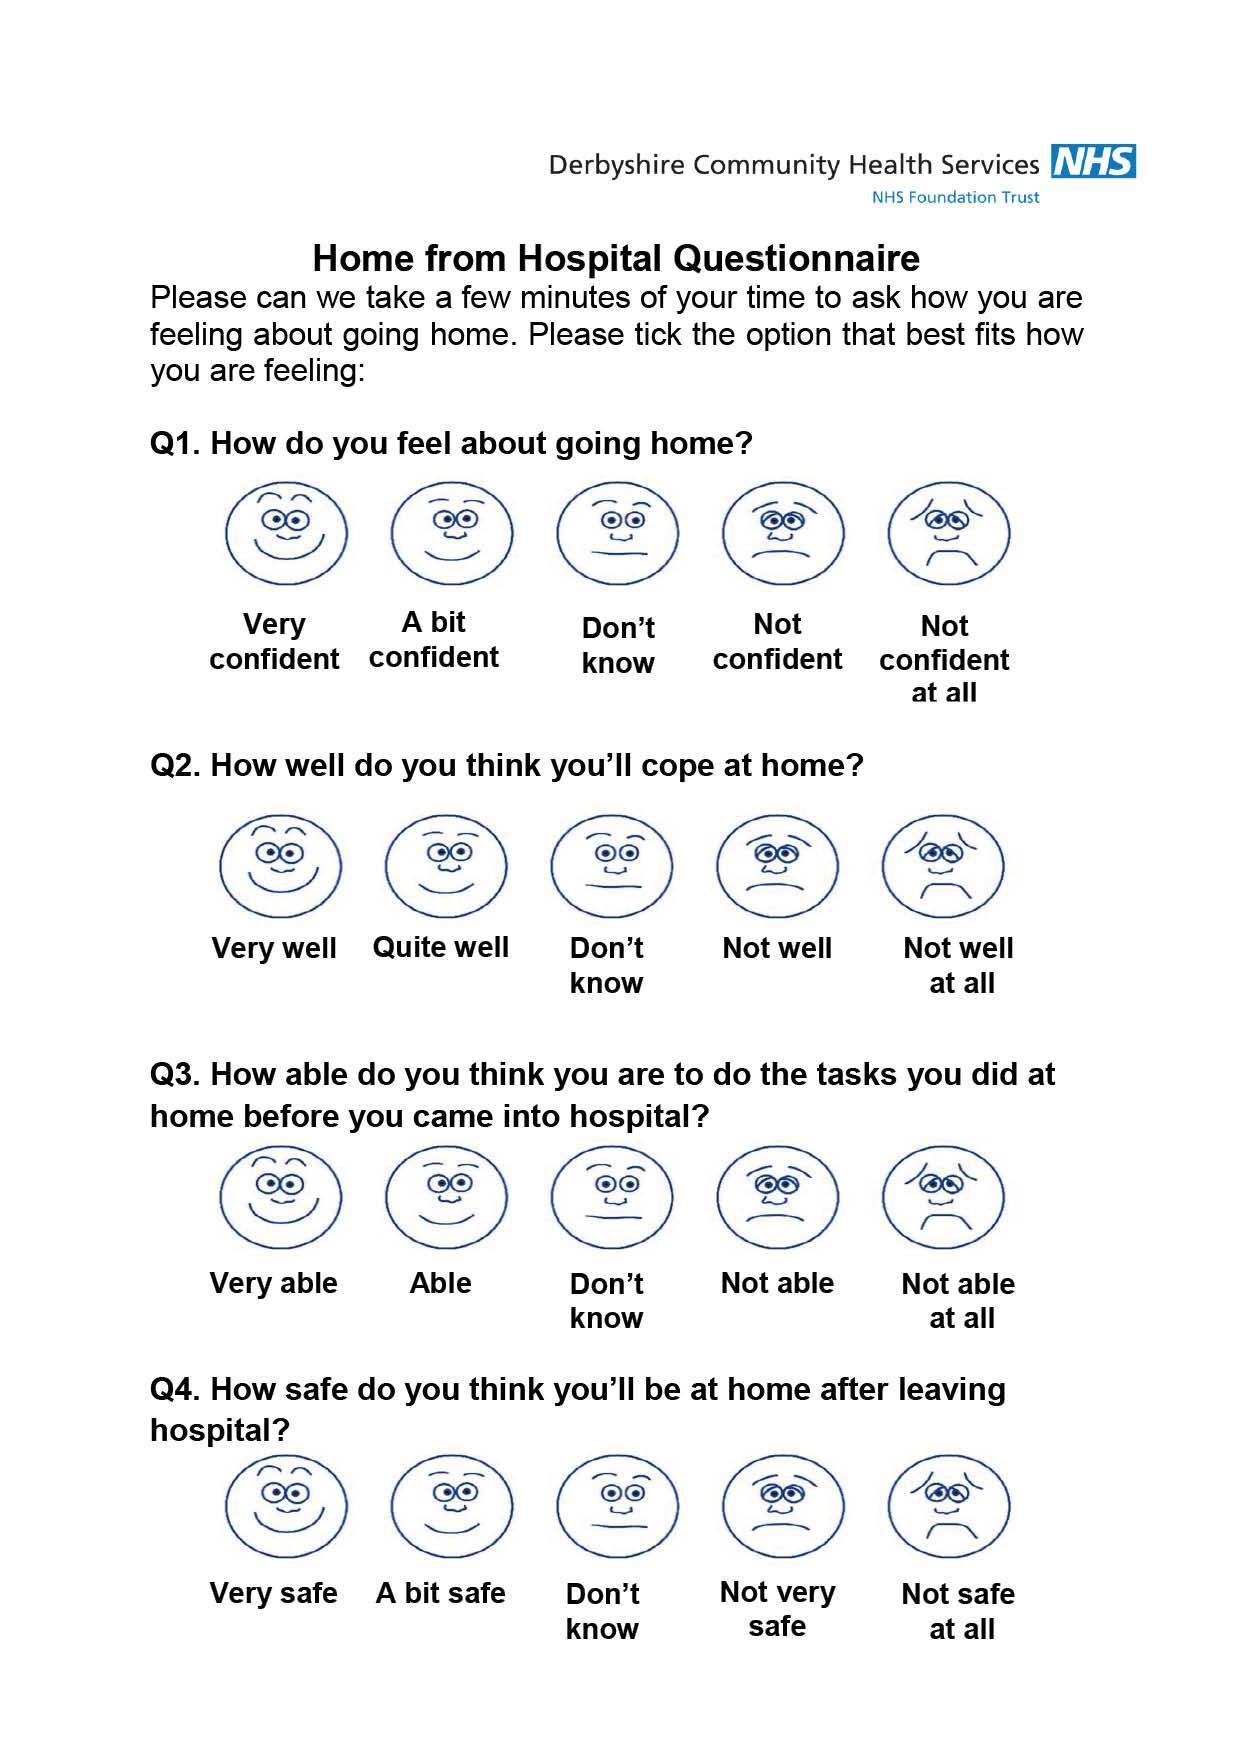
Derbyshire Community Health Services's confidence & well-being survey
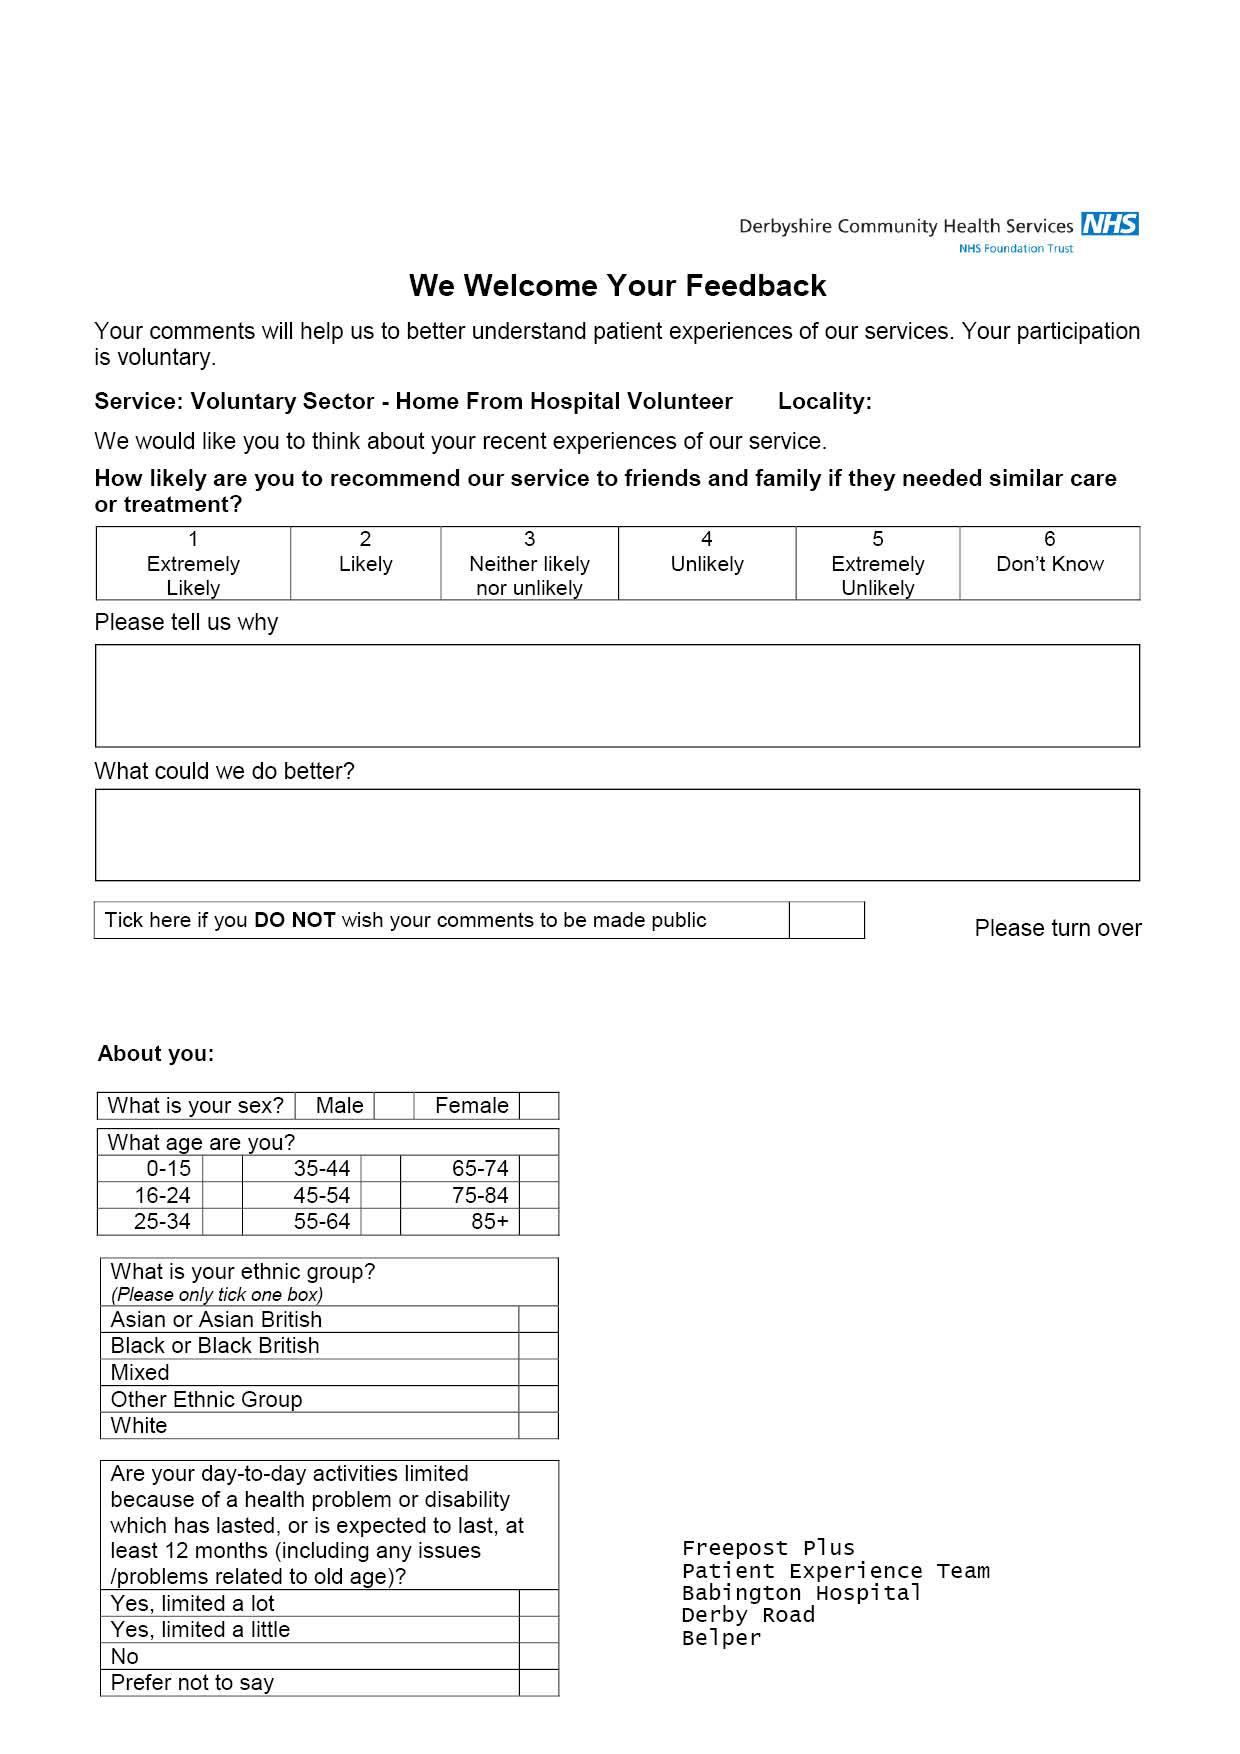
Derbyshire Community Health Services's FFT survey
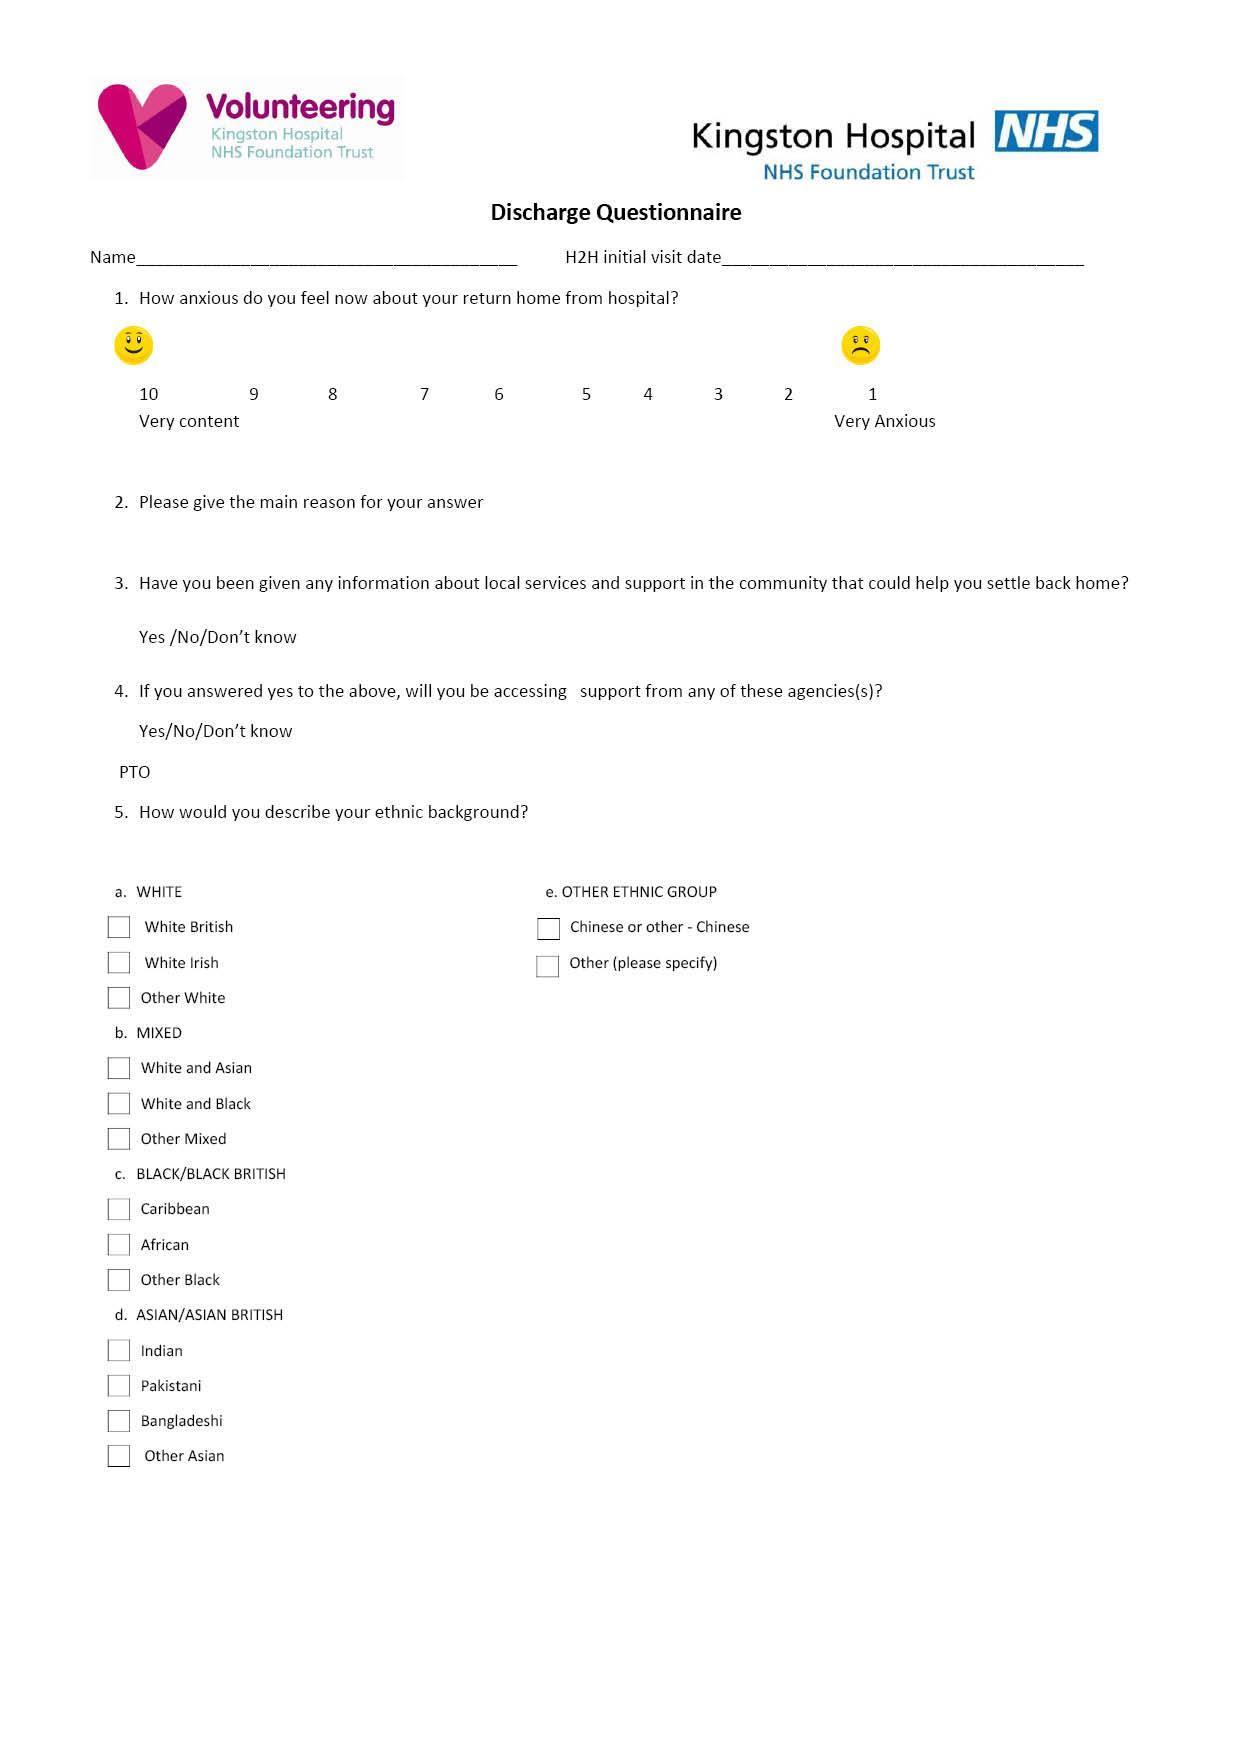
Kingston Hospital's anxiety survey
Kingston Hospital's mood & well-being for dementia patients survey
Therapeutic Activity Record – Bedside Activities
| Date: |
Role (please circle): |
Patient Name: |
Activity Completed: |
| Your Name: |
Nurse/HCA/Volunteer/Student |
Ward Name: |
|
| Additional Comments About Activity: |
|
Does the patient have suspected or confirmed dementia? Yes/No |
Time Doing Activity (min): |
Mood and Wellbeing
Patient Mood Before Activity:
Please indicate the patient's mood before the activity on a scale of 10 to 1:
* 10: Very Content
* 1: Very Uncontent
Your Mood Before Activity:
Please indicate your mood before the activity on a scale of 10 to 1:
* 10: Very Content
* 1: Very Uncontent
Patient Mood After Activity:
Please indicate the patient's mood after the activity on a scale of 10 to 1:
* 10: Very Content
* 1: Very Uncontent
Your Mood After Activity:
Please indicate your mood after the activity on a scale of 10 to 1:
* 10: Very Content
* 1: Very Uncontent
Thanks for completing the Therapeutic Activity Record Form! Please Return to [specify].
Questions or Help Required? Please contact Therapeutic Activities Program Lead (email address)
Cambridge University Hospital's nutritional intake form
MEALTIME VOLUNTEERING IMPACT MEASUREMENT (PILOT)
DATE: ____ OBSERVER: ______
| Bed Number: |
Amount eaten: |
Volunteer input: |
Comments: |
|
None |
YES/NO |
Encouragement: |
| Male/female: |
A few mouthfuls |
|
|
|
About a quarter |
|
Practical: |
|
About half |
|
|
| Bed/chair: |
About three quarters |
|
|
|
All |
|
Observations: |
| Position: |
|
|
|
| Bed Number: |
Amount eaten: |
Volunteer input: |
Comments: |
|
None |
YES/NO |
Encouragement: |
| Male/female: |
A few mouthfuls |
|
|
|
About a quarter |
|
Practical: |
|
About half |
|
|
| Bed/chair: |
About three quarters |
|
|
|
All |
|
Observations: |
| Position: |
|
|
|
Barts Health's Dementia mood & distress survey
Nesta...
Barts Health NHS Trust: The London Chest Hospital, Mile End Hospital, Newham University Hospital,
The Royal London Hospital, St Bartholomew's Hospital and Whipps Cross University Hospital
Barts Health's Dementia mood & distress survey
Nesta...
Barts Health NHS Trust: The London Chest Hospital, Mile End Hospital, Newham University Hospital,
The Royal London Hospital, St Bartholomew's Hospital and Whipps Cross University Hospital
Barts Health's Releasing time to care survey & nurse FFT
Nesta..
Barts Health NHS Trust: The London Chest Hospital, Mile End Hospital, Newham University Hospital,
The Royal London Hospital, St Bartholomew's Hospital and Whipps Cross University Hospital
Barts Health's Releasing time to care survey & nurse FFT
Nesta..
Barts Health NHS Trust: The London Chest Hospital, Mile End Hospital, Newham University Hospital,
The Royal London Hospital, St Bartholomew's Hospital and Whipps Cross University Hospital
GET IN TOUCH
Text and content copyright © 2016 TSIP
All rights reserved.