About Nesta
We are Nesta, the UK's innovation agency for social good. We design, test and scale solutions to society's biggest problems. Our three missions are to give every child a fair start, help people live healthy lives and create a sustainable future where the economy works for both people and the planet.
For over 20 years, we have worked to support, encourage and inspire innovation.
We work in three roles: as an innovation partner working with frontline organisations to design and test new solutions, as a venture builder supporting new and early stage businesses and as a system shaper creating the conditions for innovation. Harnessing the rigour of science and the creativity of design, we work relentlessly to change millions of lives for the better.
Find out more at nesta.org.uk
If you'd like this publication in an alternative format such as Braille or large print please contact us at [email protected]
Authors
Helen Wales, Rachel Wilcock, Emily Bicks, Adeola Otubusen, Zhen Rao and Louise Bazalgette.
Acknowledgements
The Nesta team would like to thank all the local authority staff who participated in this project. We appreciate that it was a substantial time commitment assembling information for the survey, as well as participating in the interview. We are really grateful for your willingness to engage with this pilot study.
Introduction
Nesta's fairer start mission
Our fairer start mission is to narrow the outcome gap between children growing up in disadvantage and the national average. In England, we use the early years foundation stage profile (EYFSP), which is completed at the end of the reception year of school, to measure children's progress. In 2022, 61.2% of children in England reached ‘a good level of development' (GLD) according to the EYFSP, whereas only 48.1% of children eligible for free school meals reached this government benchmark (Orso and Wilcock 2022).
To help close this gap between disadvantaged children and the national average, we need to better understand how we can support children and caregivers in poorer families in the early years (between pregnancy and their first year of school), to help prevent inequalities in children's outcomes from emerging.
Why we developed this pilot project
We developed this pilot project because, while children on free school meals in England are on average less likely to be on track with their development, this is not uniform across the country. For example, in 2019, only 54% of children eligible for free school meals in England reached a good level of development (compared with 71.8% of all children). However, in Hackney, 69% of children on free school meals reached a GLD, and in Newham 71% of children on free school meals reached a GLD (Wilcock and Mateos-Garcia, 2022 Wilcock & Mateos-Garcia, 2022). We asked ourselves: what might these local authorities (LAs) be doing to help drive these results?
In this project, we are trying to find out what LAs where more children on free school meals reach a GLD in their EYSFP are doing differently from others.
The fundamental question is: why do LAs with similar demographics and circumstances have different results in the EYFSP?
Design of this pilot project
Objectives of the work
Through this pilot project, we wanted to understand more about the factors that affect different levels of progress in the early years, especially those influenced by local public services.
Outcomes for children in the reception year of school vary considerably across LAs in England and between neighbourhoods within LAs. We know that context matters, and that children in some areas facing disadvantage achieve good outcomes against the odds.
We would have liked to survey all LAs in England, to learn more about their policies and practices (including the services on offer to families and how they work to coordinate systems of support). Analysis of the findings of a survey of 152 LAs might enable us to correlate different practices (or sets of practices) with children's outcomes.
However, before attempting a piece of research of this level of ambition, requiring participation from LAs at such a large scale, we thought it would be important to run a pilot project to test out how feasible it would be to gather key information about early years services from LAs. The pilot project had two key elements.
- Clustering LAs: an innovative approach to data analysis to identify 'clusters' of similar LAs and identify within each cluster the range of performance we're seeing in relation to the proportion of children on free school meals who are reaching a GLD in their EYFSP.
- Field work with LAs: piloting a survey and interview with a smaller sample of LAs to gather data about their early years services, practices and activities.
Through the pilot, we would set out to learn:
- how we could gather the information that we wanted to find out (for example, through a combination of survey and interviews)
- how successfully LA early years service leaders were able to engage with our survey questions and interview, including levels of participation and completion of the requested information
- whether it would be feasible to further roll out our data collection tools to a larger number of LAs, or whether a substantial change to the data collection methods would be needed
- whether we could gather any initial insights into what aspects of LA provision could be driving children's outcomes, which could be investigated further by our team.
What we did
Clustering LAs and identifying our survey sample
To inform our decisions about sampling LAs to invite to participate in our pilot, we began by creating clusters of similar LAs. We wanted to identify groups of LAs that are similar in socioeconomic profile, so that we could then compare the proportion of children reaching a GLD in their EYFSP within each of these groups. The data we included in this clustering included socioeconomic conditions but also a wider range of factors.
We combined a wide range of publicly available datasets to understand more about the common features that are associated with early years and school readiness outcomes, and to create seven clusters of similar LAs. We have previously published a summary of this approach to clustering (Wilcock and Mateos-Garcia, 2022).
We then used the 2019 EYFSP assessment as our outcome measure and looked at the percentage of children who are eligible for free school meals who reached a GLD for each LA. Within each cluster, we divided LAs into five tiers of performance, according to the proportion of children on free school meals in that LA reaching a GLD.
For the purpose of the pilot we decided that we would aim to recruit 30 LAs; about a fifth of all LAs in England. This would be a large enough sample to allow us to test our data collection tools among LAs of varying profiles, but also realistic to deliver within short timescales so that we could learn from the pilot and then adapt our approach prior to further roll-out.
We decided to develop a sample that would include:
- representation of LAs in all seven clusters
- representation of LAs distributed across the spectrum of performance in their cluster.
Where possible, we planned to mainly recruit higher performers (in the top 20% of their cluster according to the outcomes of children on free school meals in the EYFSP), middle performers (in the middle 20%) and lower performers (in the bottom 20% for their cluster). However, given the timeframes of the pilot study, we intended to also draw on our existing networks to help boost recruitment. The chart below shows how this worked out in practice.
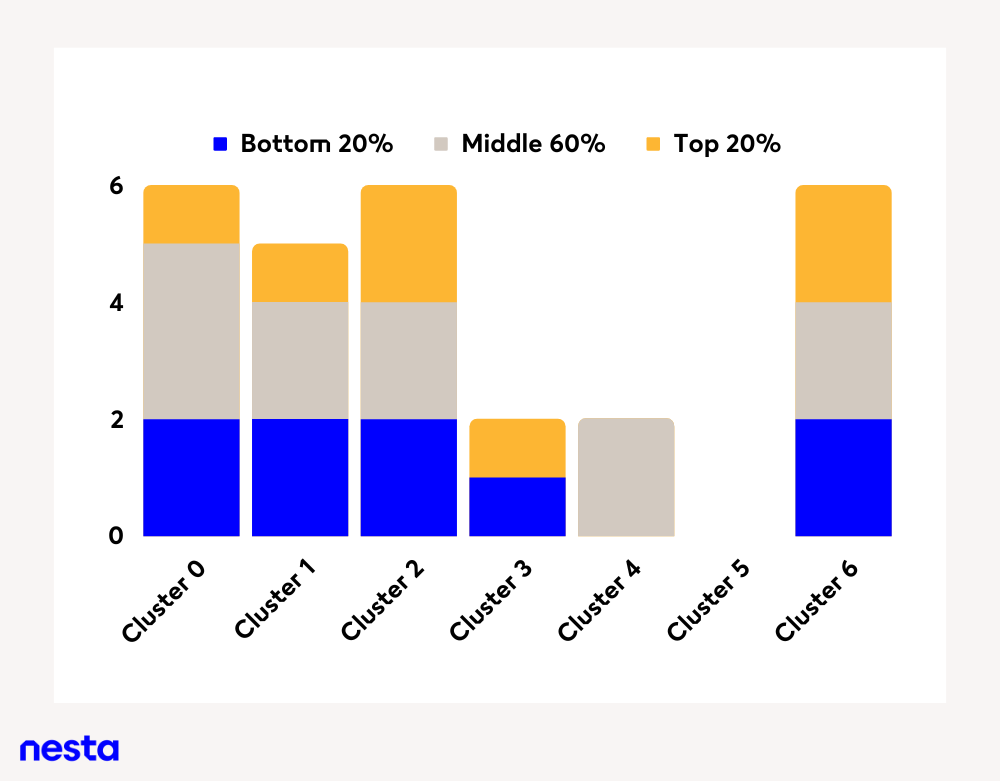
Figure 1. Comparison of LAs we interviewed and surveyed across the cluster groups. The yellow bars are the LAs which sat in the top 20% in their cluster (they had the largest percentage of children on free school meals reaching a GLD relative to their cluster). The blue bars represent the LAs which sat in the bottom 20% of their cluster (so, they had the smallest percentage of children on free school meals reaching a GLD relative to their cluster). The grey bars are the LAs which sat in between these two extremes. The majority of the "middle 60%" are LAs which were around the average for their cluster in terms of percentage of children on free school meals reaching a GLD. The clusters are as follows: cluster 0 – high deprivation, low life expectancies, cluster 1 – cardiovascular disease prevalence and high number of children in low income families, cluster 2 – low deprivation, high life expectancies, cluster 3 – London, higher pollution, cluster 4 – ageing population, cluster 5 – higher hospital admissions, higher crime rate, cluster 6 – low deprivation, working age population.
We worked with LA representatives and sector experts to develop a detailed interview and survey framework to explore:
- the policies, practice and activities in key early years service areas
- LA representatives' views about the practices, policies and local factors that make the biggest difference to children's outcomes in their area.
We focused on seven key areas of early years services:
- parenting and the home learning environment
- the Healthy Child Programme
- infant mental health and perinatal mental health
- speech, language and communication
- quality in early childhood education and care
- data, assessment and integrated working
- the funded two-year-old early education entitlement (FEEE).
We then commissioned the Australian Council for Educational Research (ACER) to be our fieldwork partner for the pilot phase. ACER led the recruitment of LAs and the delivery of the field work, including a survey and interview with each participating LA. It successfully recruited 27 LAs to participate in the pilot, with interview participants representing a range of local service roles (such as service managers, strategic leads, commissioners, frontline practitioners) and located in a range of the different early years services that we wanted to explore. LAs selected which staff would participate in the research. Some LAs nominated one interviewee and others put forward a group of colleagues.
ACER then transcribed and coded the data it gathered from the interviews to create a detailed dataset describing LAs' early years services, policies and practices.
LAs' engagement with the survey and interview questions
Once ACER had completed the field work and created the dataset, Nesta's data scientists undertook initial analysis to explore the completeness of the data.
We asked a total of 104 questions, including the survey and interview combined. Perhaps not surprisingly, LAs did not answer all of these questions. On average, LAs answered 81% of the survey questions (note that many of these questions include sub-questions that may have not all been answered) and they gave, on average, 45 responses to the interview questions, which were extracted from the transcripts during the coding process. For example, in answer to the question “What do you think are the key things your LA does that make a difference in relation to parenting support and support for the Home Learning Environment?”, some LAs gave detailed responses that were then coded by ACER into distinct categories such as “Programmes - Bookstart” or “Cross service - multi-agency working”. However, some LAs were not able to answer the question as the representatives in the interview did not have knowledge of the parenting support offered, and so no relevant response was coded. It should be noted that more than one answer may be coded to each question. For example, there are four early years parenting programmes included in response to one interview question. These were all coded separately.
Initial findings from the pilot
Exploratory analysis linking LA practice with children's outcomes
The ultimate goal of this pilot was to test an approach to collecting a holistic dataset on early years policies and practices. We collected a rich dataset through this process and conducted an initial analysis to explore if any trends were emerging in the sample. We found there was tremendous variety in the challenges reported by the 27 LAs in our pilot and the policies and practices used to address them. This finding, combined with the small sample size, made it impossible to confidently establish any correlation between specific practices and early years outcomes. Instead, we focused our analysis on identifying commonalities and differences in the way LAs implement early years practices that could help generate testable research questions to explore in the future.
What we learned about LA early years practice
As the survey and interview were very detailed, we haven't yet been able to complete the analysis of all the responses we received. We have prioritised questions that had higher response rates and have included here a selection of the findings we think will be most useful and interesting for the early years sector. We have focused on four of the service areas covered in the survey and interview: the healthy child programme; parenting and the home learning environment; data, assessment and integrated working; and the funded two-year-old early education entitlement (FEEE).
A) Healthy child programme
In the survey, we asked LAs who provides the health visiting services in their area. Of the 27 participating LAs, 25 answered this question and we learned that:
- 16 LAs (64% of respondents) commission their health visiting from the public sector
- 6 LAs (24%) deliver health visiting in-house
- 2 LAs (8%) commission health visiting from the voluntary sector
- 1 LA (4%) commissioned health visiting from the private sector.
In the interview, we asked LAs what they thought were the key things their LA does that make a difference in relation to the healthy child programme. Their answers were coded and grouped into thematic categories, shown in figure 2 below.
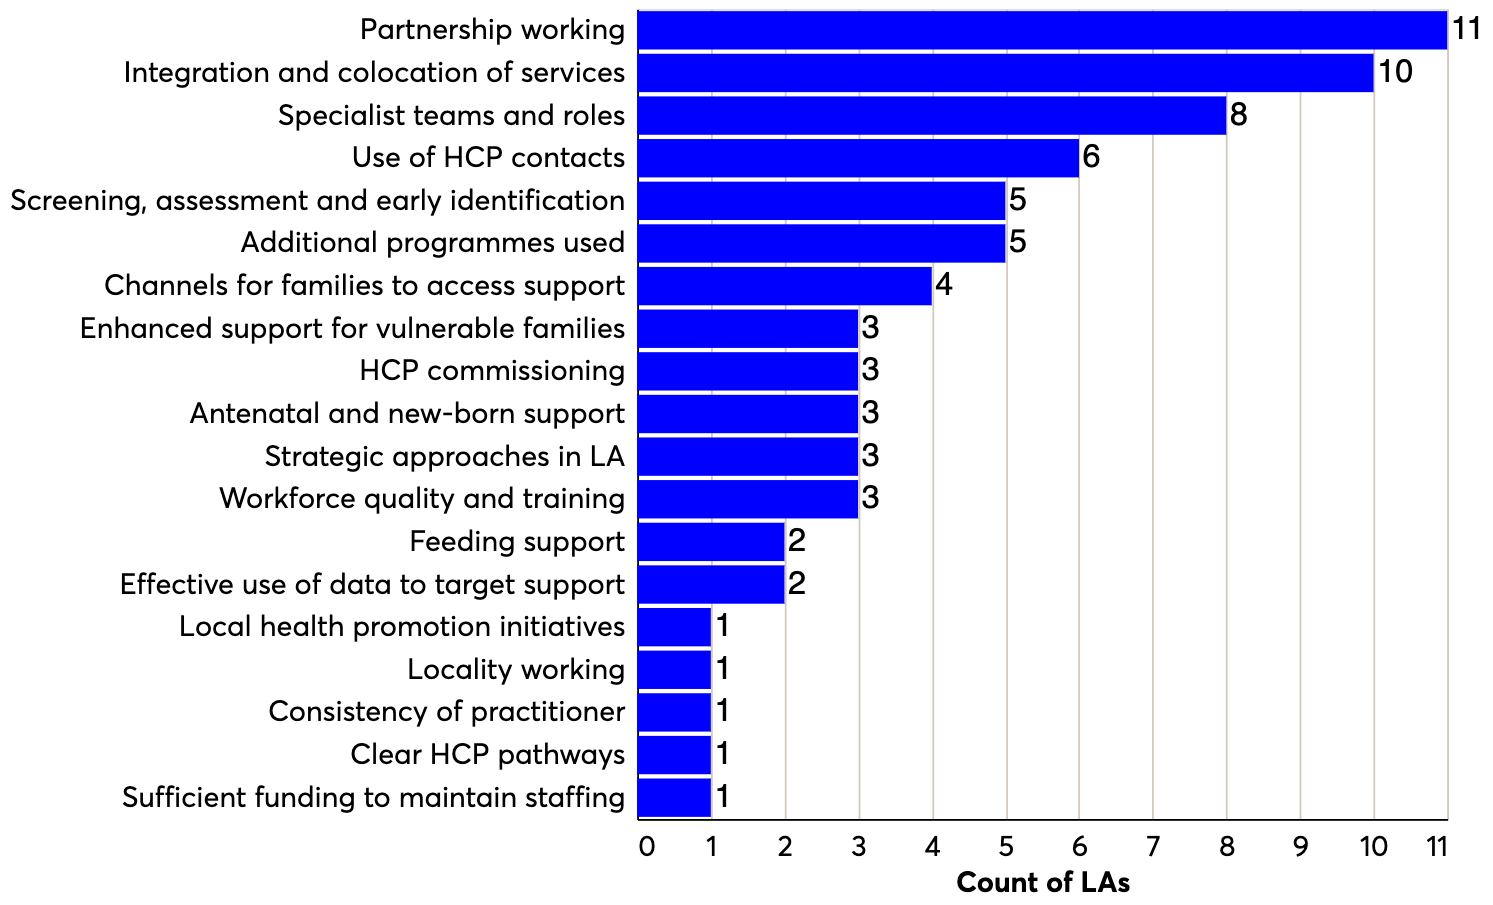
Figure 2. What do you think are the key things your LA does that make a difference in relation to the healthy child programme?
As this graph shows, examples of partnership working were frequently mentioned by LAs as being important to the successful delivery of the healthy child programme. Some of the examples given included:
- joint working with midwifery, antenatal services, infant mental health services or children's centres
- a strong relationship between the HCP provider and partners
- good coordination with the voluntary sector, such as on infant feeding
- co-delivery of parenting courses between the NHS and the LA
- engagement and coordination with early years providers, including on the two-year-old review.
Respondents also frequently mentioned the importance of co-locating and integrating services. Practices captured in this category included having integrated care pathways, integrated management structures and cross-service working to conduct the Integrated Review.
In the survey, we also asked LAs specifically about the two-year-old review as this is an important opportunity to understand children's developmental progress and identify their needs. When we asked LAs about the proportion of families who do not attend a booked appointment, we found a mixed picture (see figure 3 below).
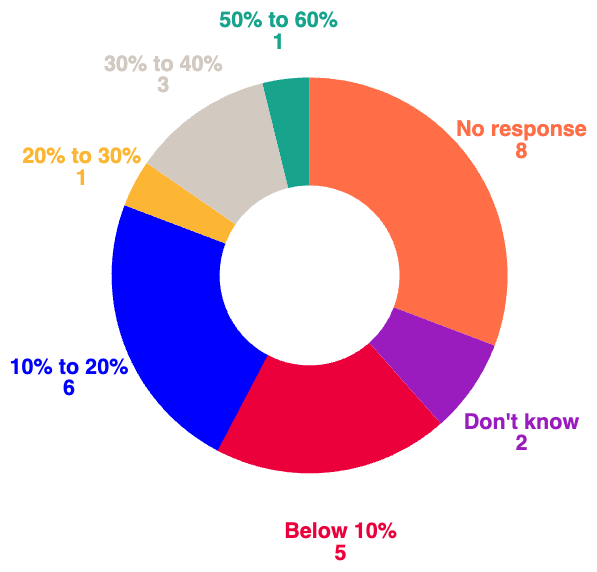
Figure 3. What is the proportion of families who do not attend a booked appointment?
We also found that a large proportion of the LAs who responded (12 out of 20 respondents) did not routinely collect data on why parents do not attend their two-year-old review appointment (see figure 4). This could be a missed opportunity to better understand the barriers to parents accessing this important universal service.
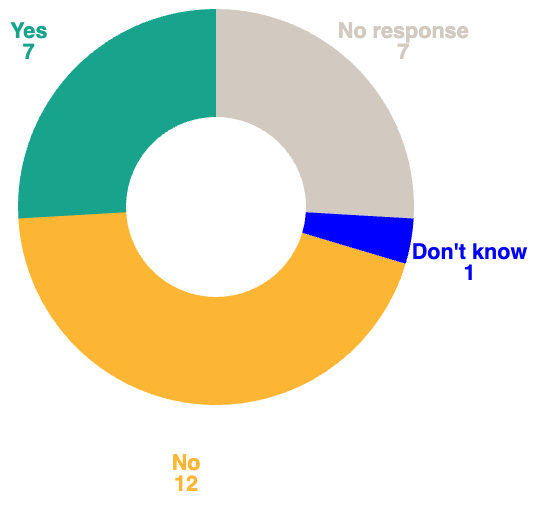
Figure 4. Does your LA routinely collect data on why parents do not attend?
In the interview, we asked participants to tell us about contextual factors that make it challenging to deliver the healthy child programme (see figure 5 below). Of the 25 LAs who responded to this question, 14 (56%) mentioned workforce recruitment and retention as a key challenge. The next most common response (deprivation and poverty) was mentioned by only five LAs.
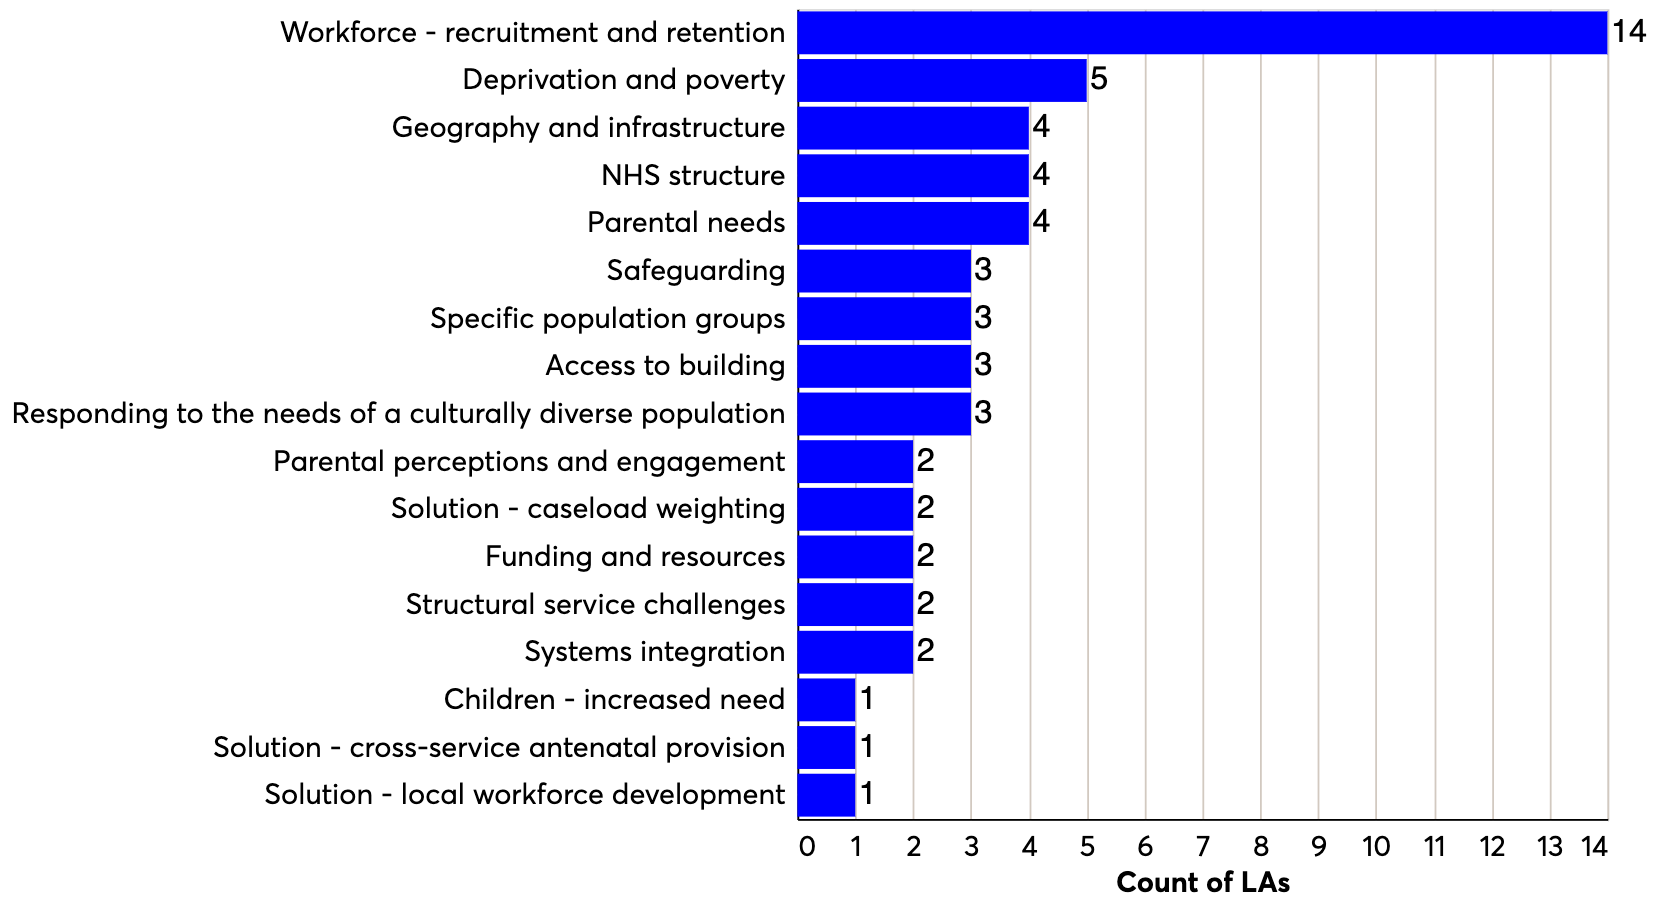
Figure 5. Are there any contextual factors that make this area of work particularly challenging or simply make a difference to needs in your LA?
B) Parenting and the home learning environment
We also asked participants a series of questions about the support their LA provides for parenting and the home learning environment.
We identified 18 different parenting interventions (from sources including the Early Intervention Foundation (EIF) Guidebook and the Parent Infant Foundation's list of recommended interventions in the Securing Healthy Lives report) and asked LAs to select from a drop-down list whether they had offered this programme to parents of children aged up to five years old within the last three years. Figure 6 below shows the responses from the 25 LAs who responded to this question. Solihull approach and Incredible Years were selected most frequently (each delivered in 15 of the 25 LAs), followed by Triple P (11 LAs) and Family Nurse Partnership (10 LAs).
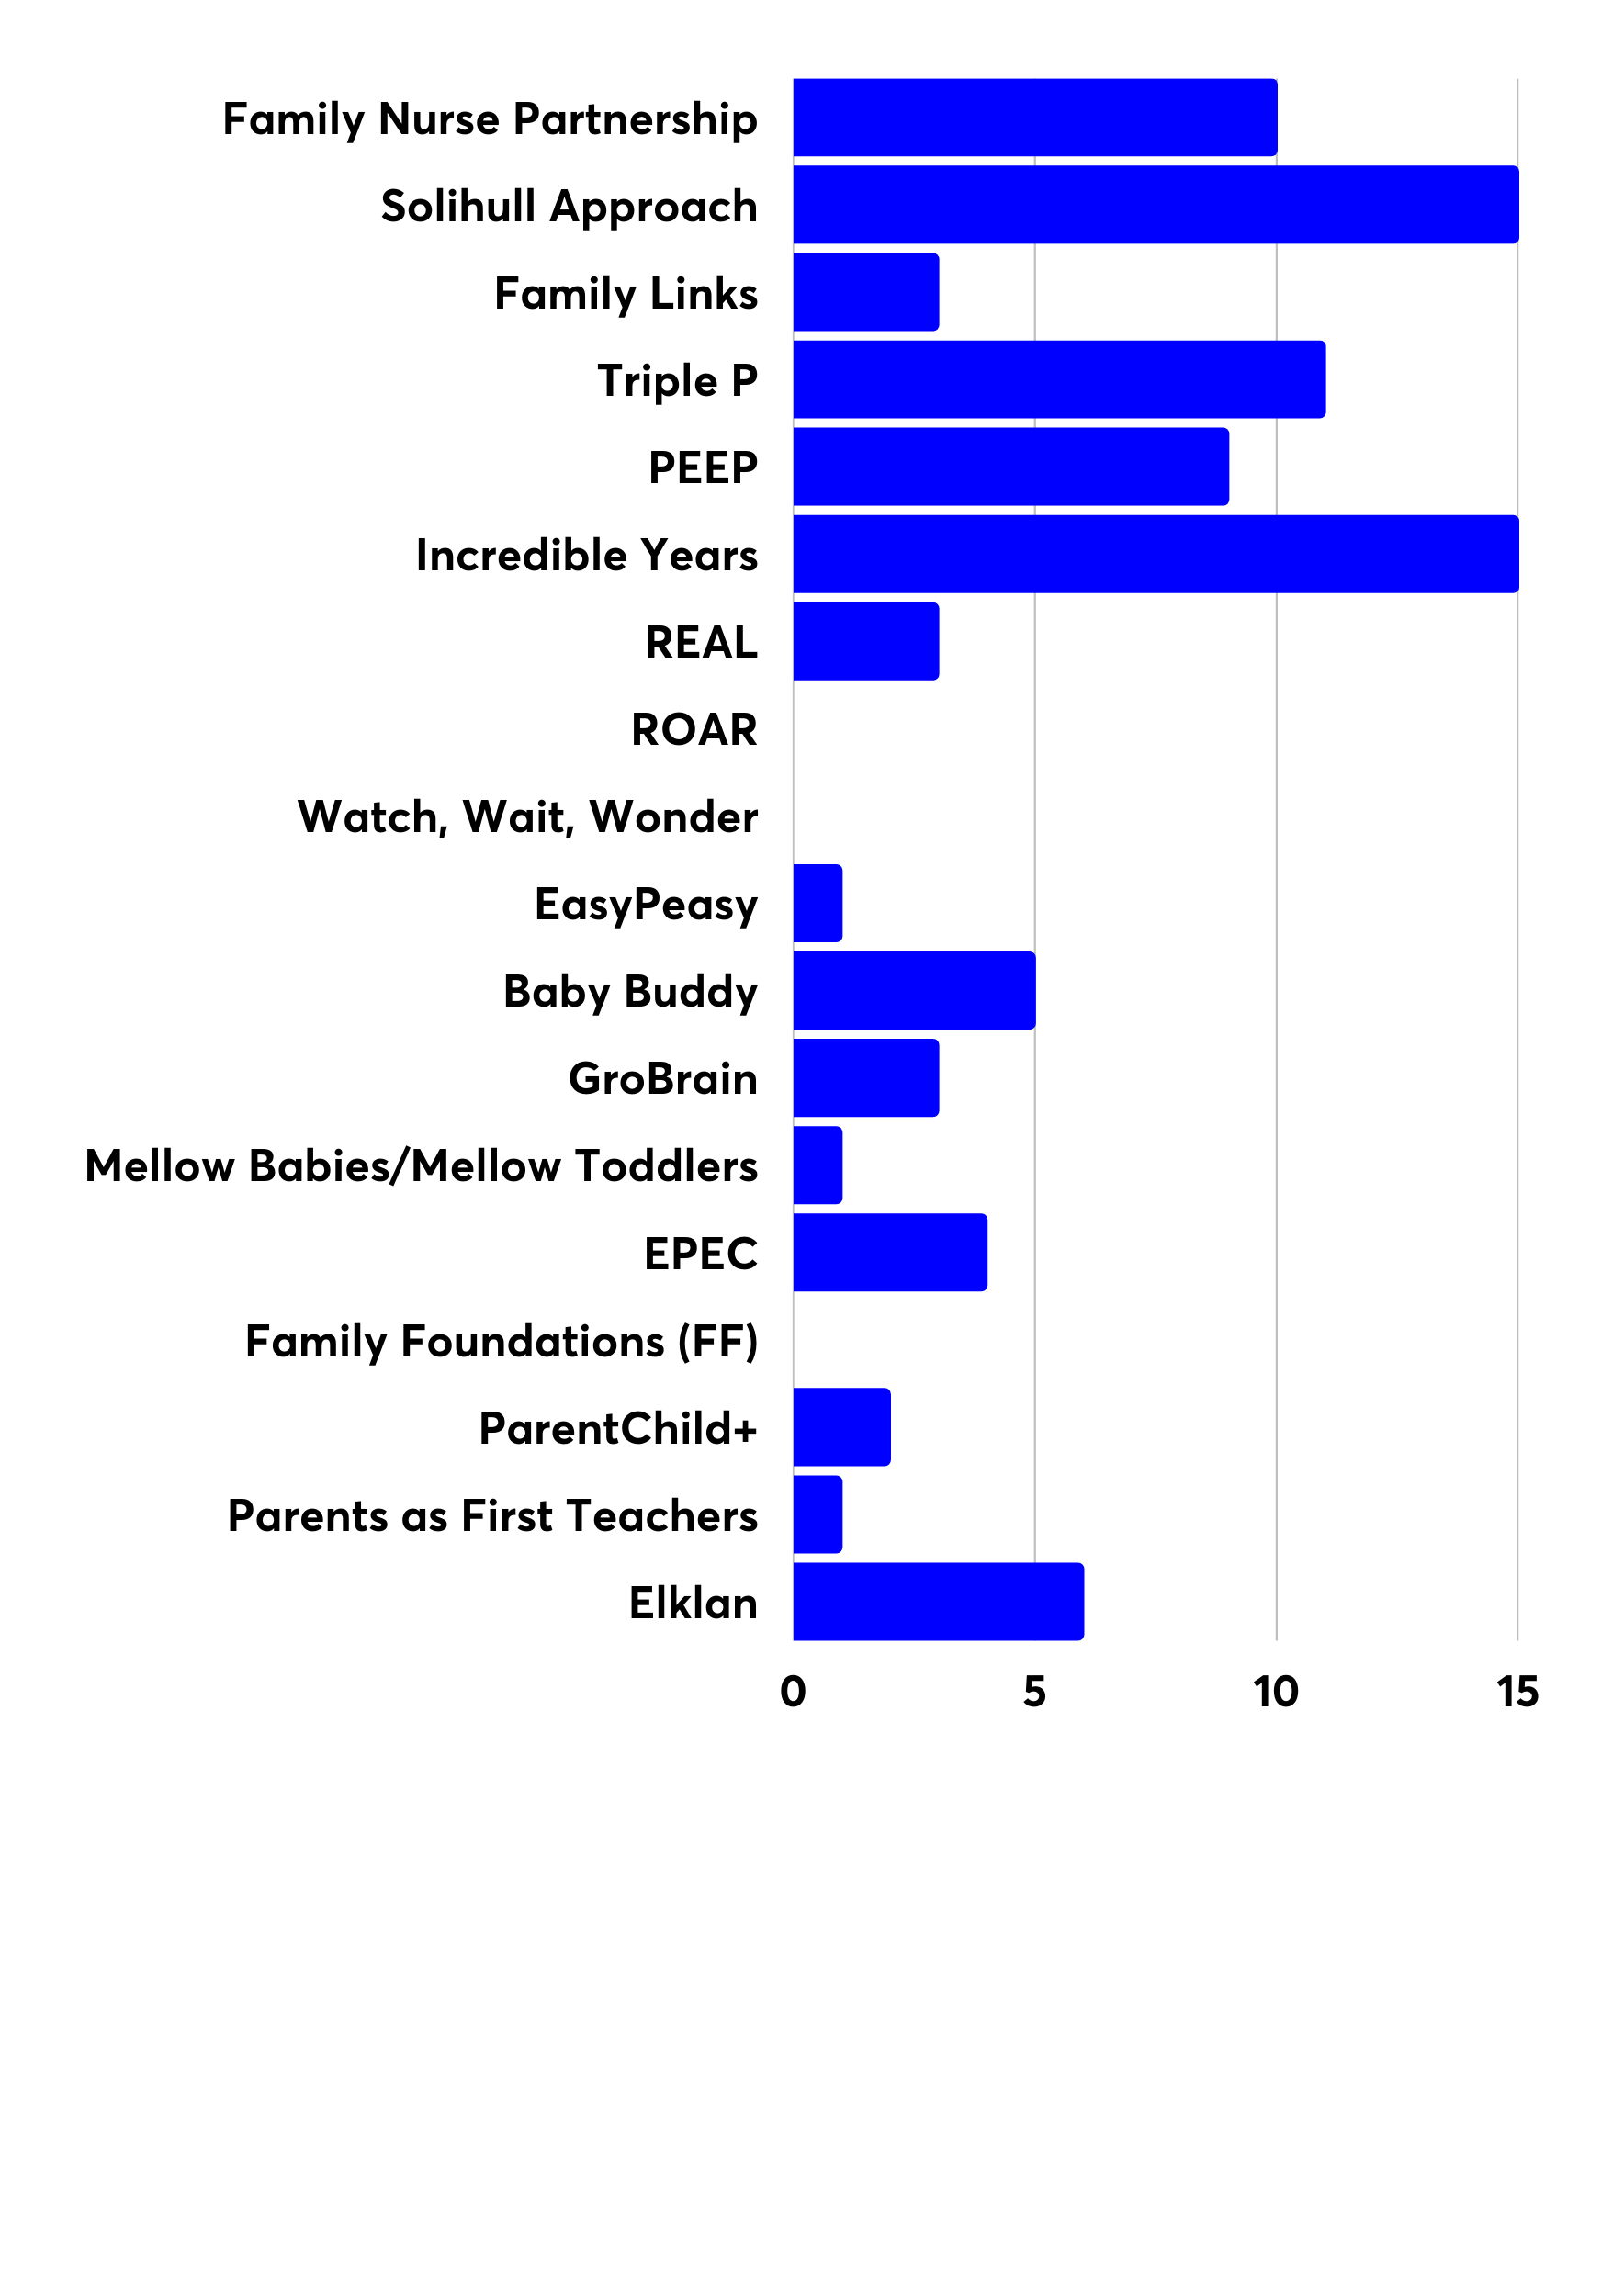
Figure 6. This chart shows the collated responses from all LAs who responded to the question, 'What parenting programmes have been available to parents (between pregnancy to age five) within the last three years?' based on the items in the drop-down list in the survey.
We collated these responses to identify how many parenting programmes had been delivered in each local area over the last three years (see figure 7).
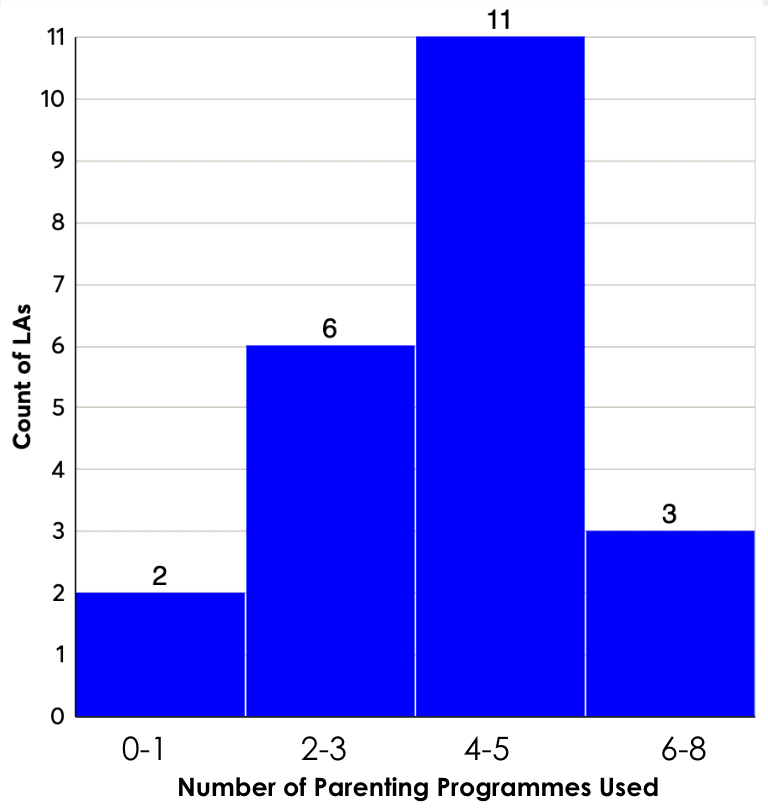
Figure 7. This chart shows the number of parenting programmes delivered by LAs during the last three years
As this chart shows, between one and eight of the selected programmes were delivered in each LA area, with four or five programmes being the most common number. However, this only reflects the programmes that we specifically asked them about. When we asked participants in the interview about the key things their LA does that make a difference in relation to parenting support and support for the home learning environment, they spontaneously mentioned 64 different parenting programmes and interventions.
When we asked LAs to tell us which of the 18 identified interventions were the most impactful parenting interventions delivered in their area, we received very varied responses (see figure 8). Family Nurse Partnership and Triple P were identified most frequently with four votes each, followed by the Solihull Approach with three votes. It would be interesting to find out more about what informed these judgements about what constitutes an impactful programme.
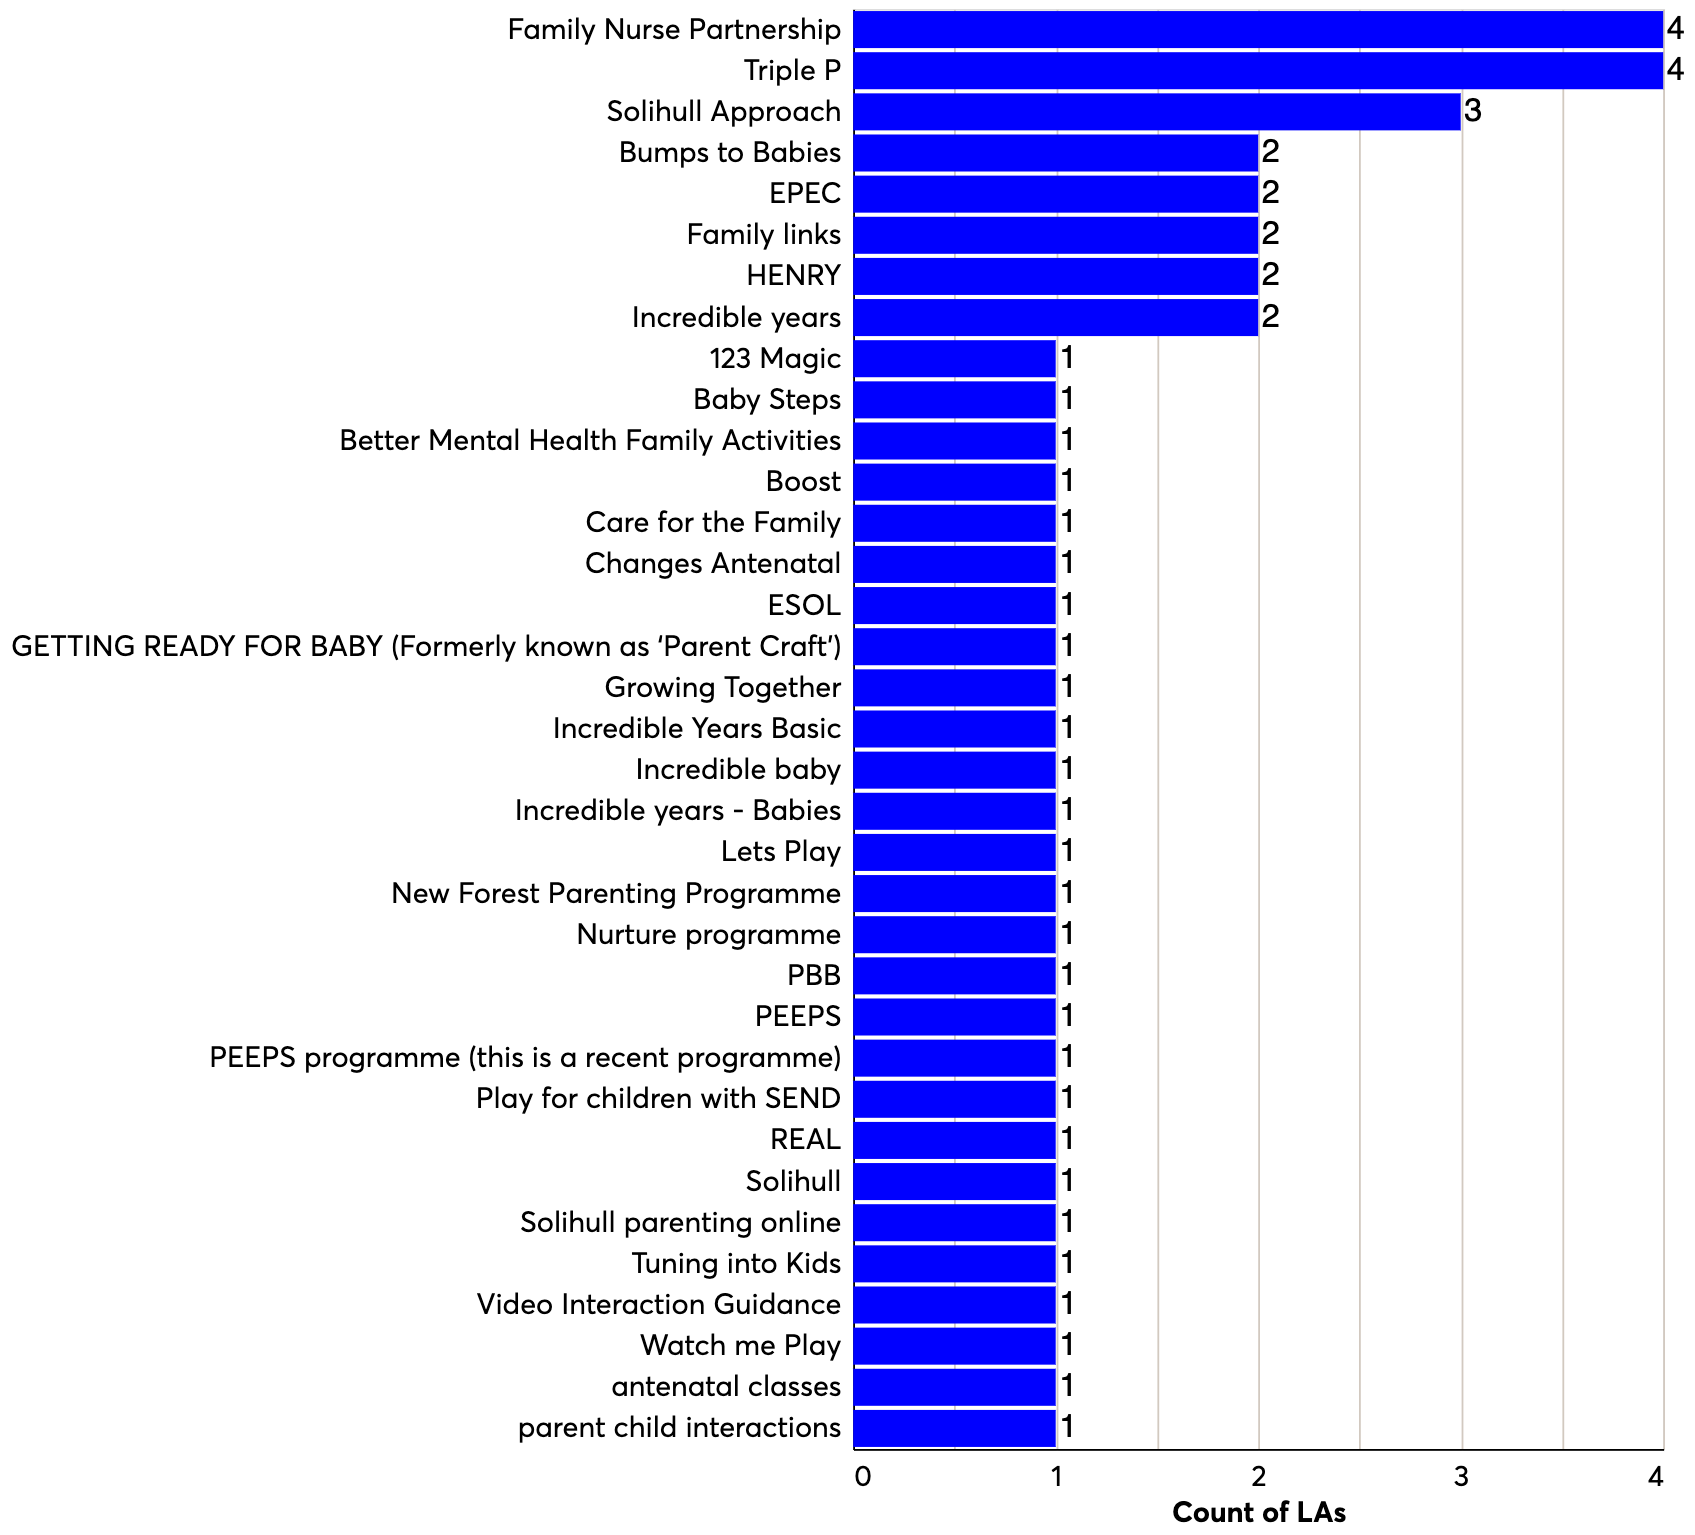
Figure 8. What are the three most impactful interventions in your area?
We also asked participants a series of questions about how they implement parenting support programmes in their local area (see figure 9). Out of the 27 participating LAs, 20 responded to this section, and some LAs did not answer every question. As these charts show, the majority of respondents said that they follow programmes as closely as possible based on the guidance, and they also make adaptations to suit families.
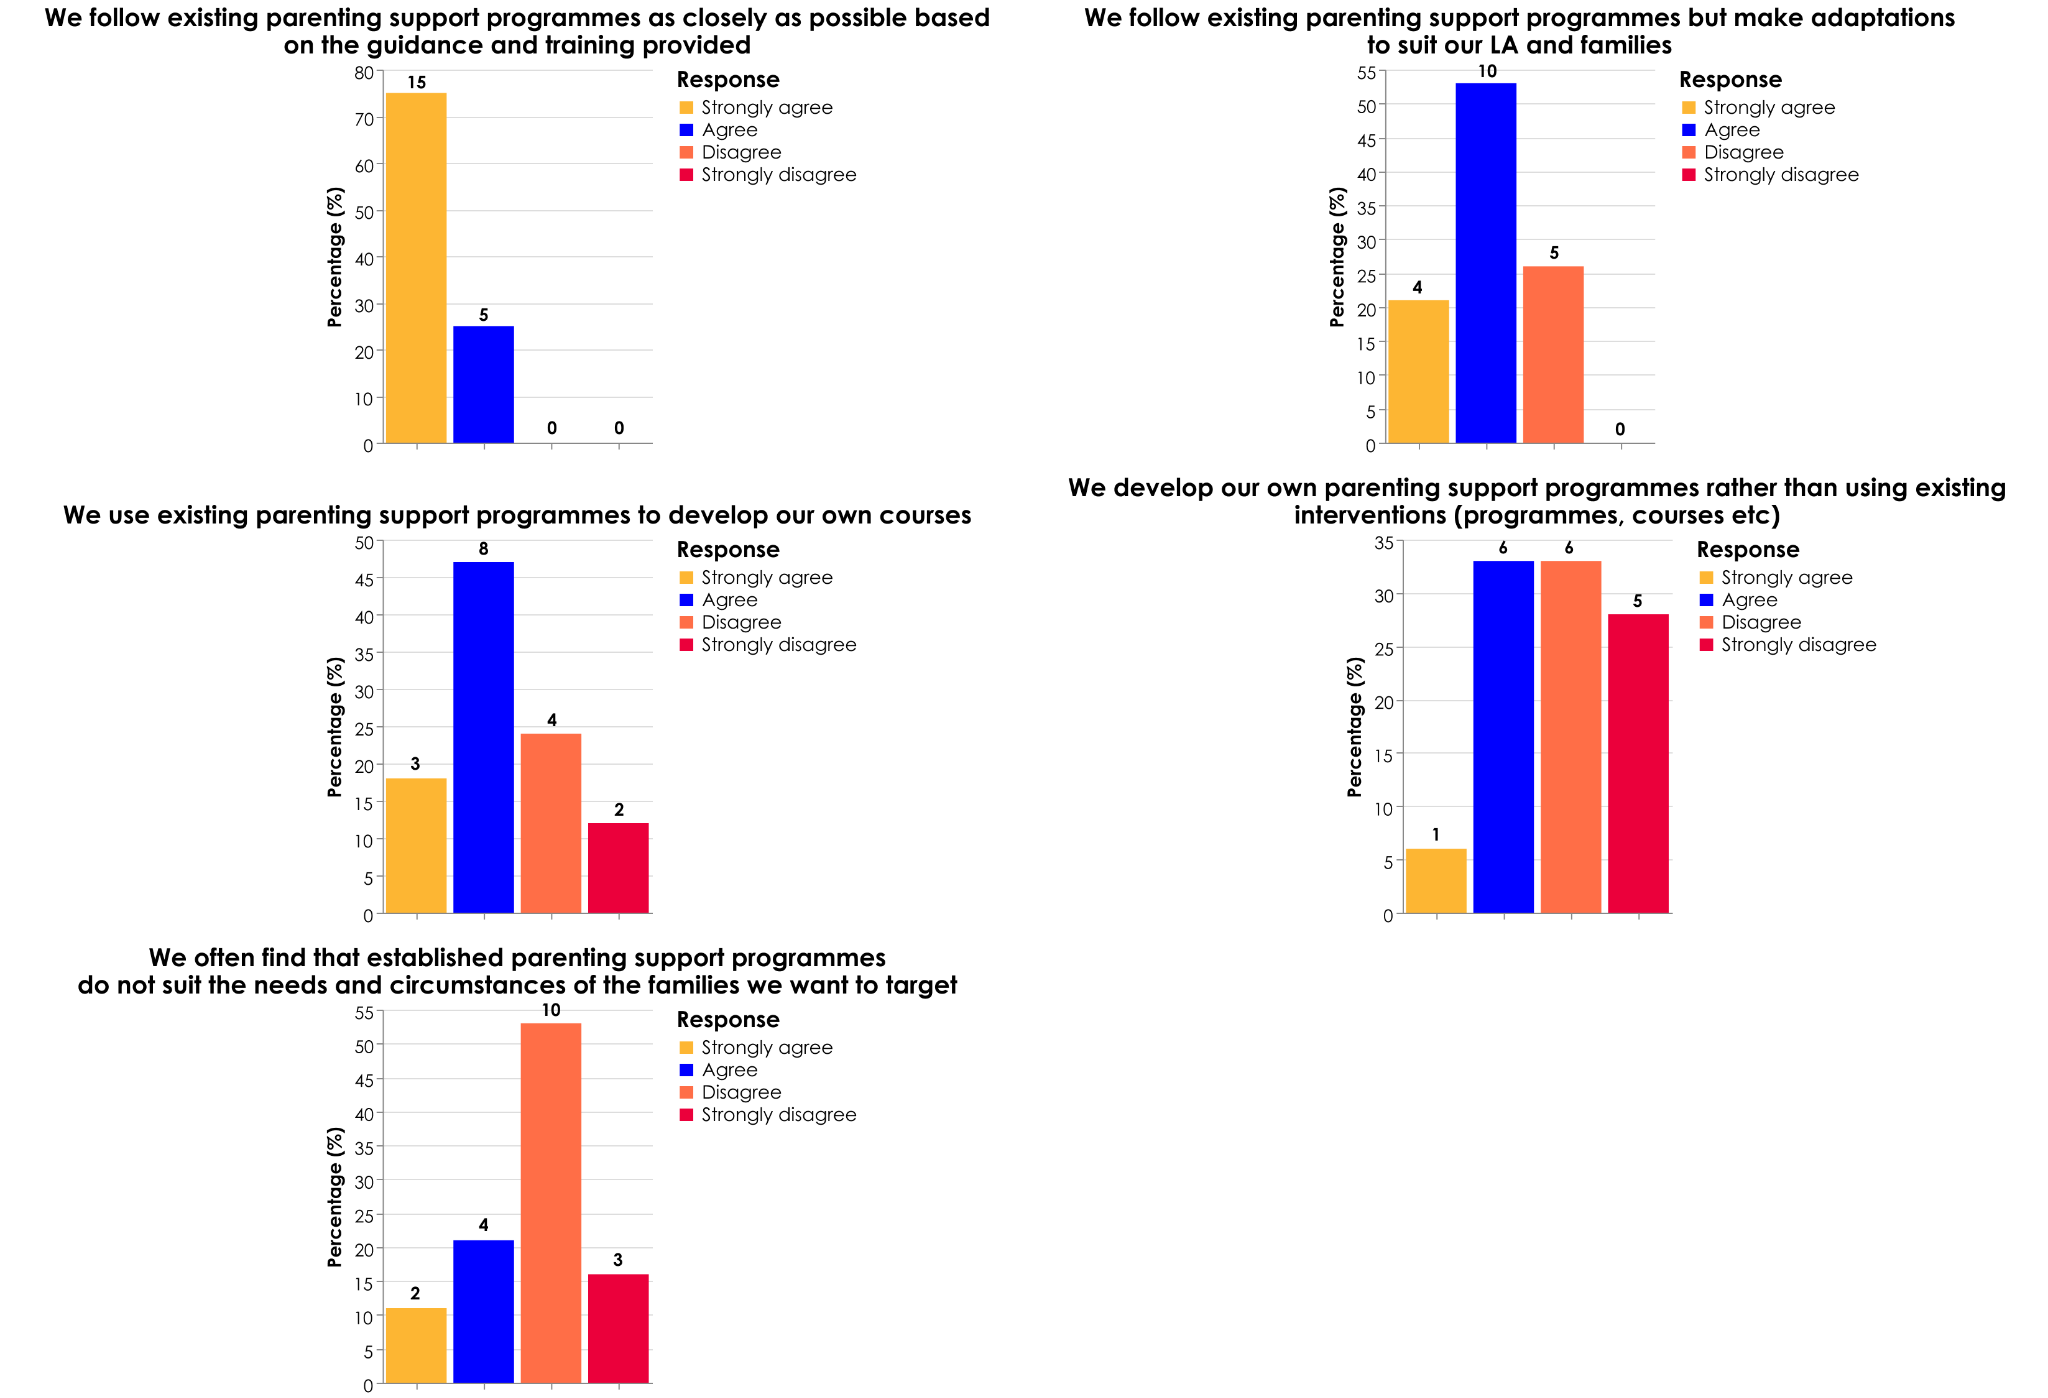
Figure 9. To what extent do you agree with the following statements based on approaches used in your local authority?
We also asked participants about the key things their LA does that make a difference in relation to parenting support and support for the home learning environment. We had a wide range of responses, with more than 125 different data codes generated through the interviews. We grouped these individual responses into categories (see figure 10).
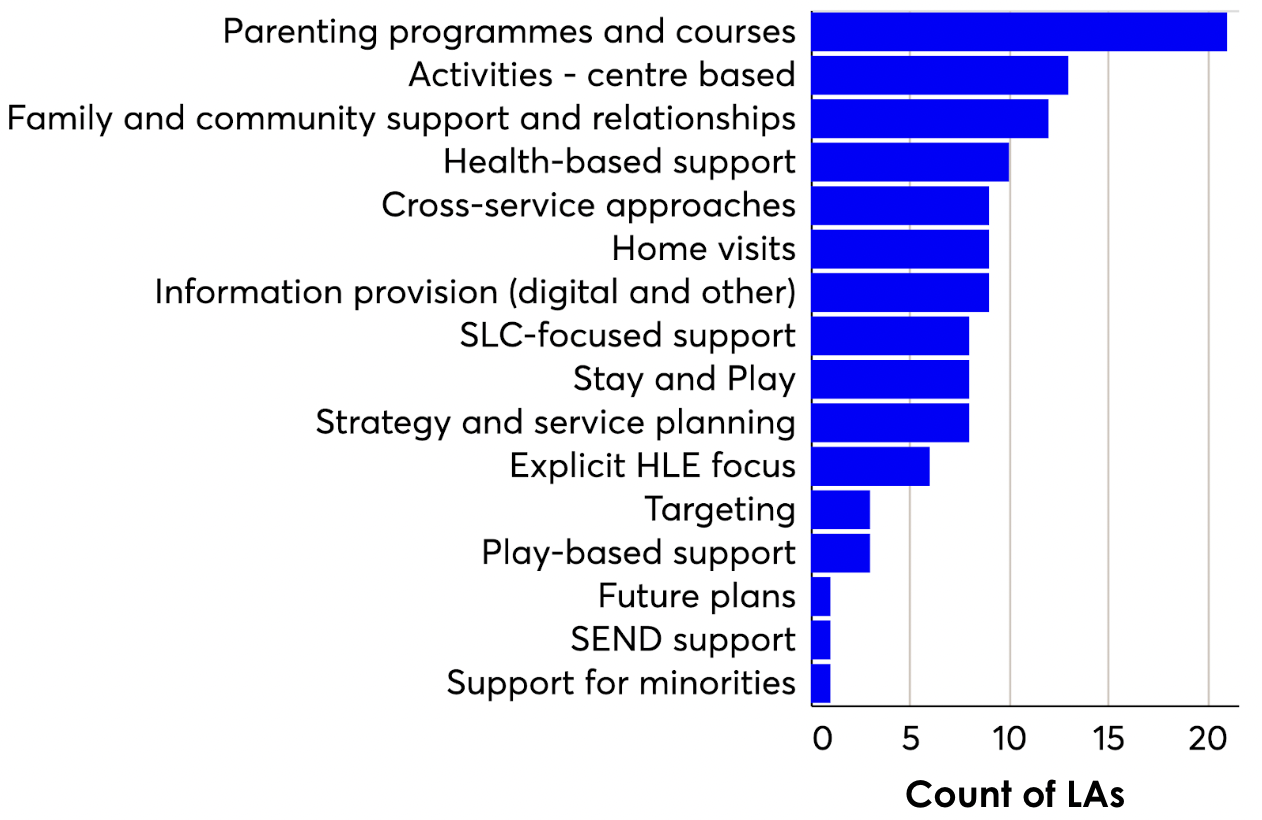
Figure 10. This chart shows groupings for activities that LAs mentioned in response to the question, 'What do you think are the key things your LA does that make a difference in relation to parenting support and support for the home learning environment?'.
The most common set of responses referenced parenting programmes on offer locally. In total, 64 programmes were mentioned. The most commonly mentioned were Bookstart and the Solihull Approach, each mentioned by six LAs. Half the LAs who responded also talked about the importance of building good relationships between families, communities, practitioners and services. These responses indicated that LA professionals think a wide range of factors contribute to effective parenting support, which includes but is not limited to structured parenting programmes.
C) The funded two-year-old early education entitlement (FEEE)
In the survey, we asked LAs to respond to a series of statements about the two-year-old FEEE and what had changed over the last three years. The results from these survey questions are shown in figure 11 below.
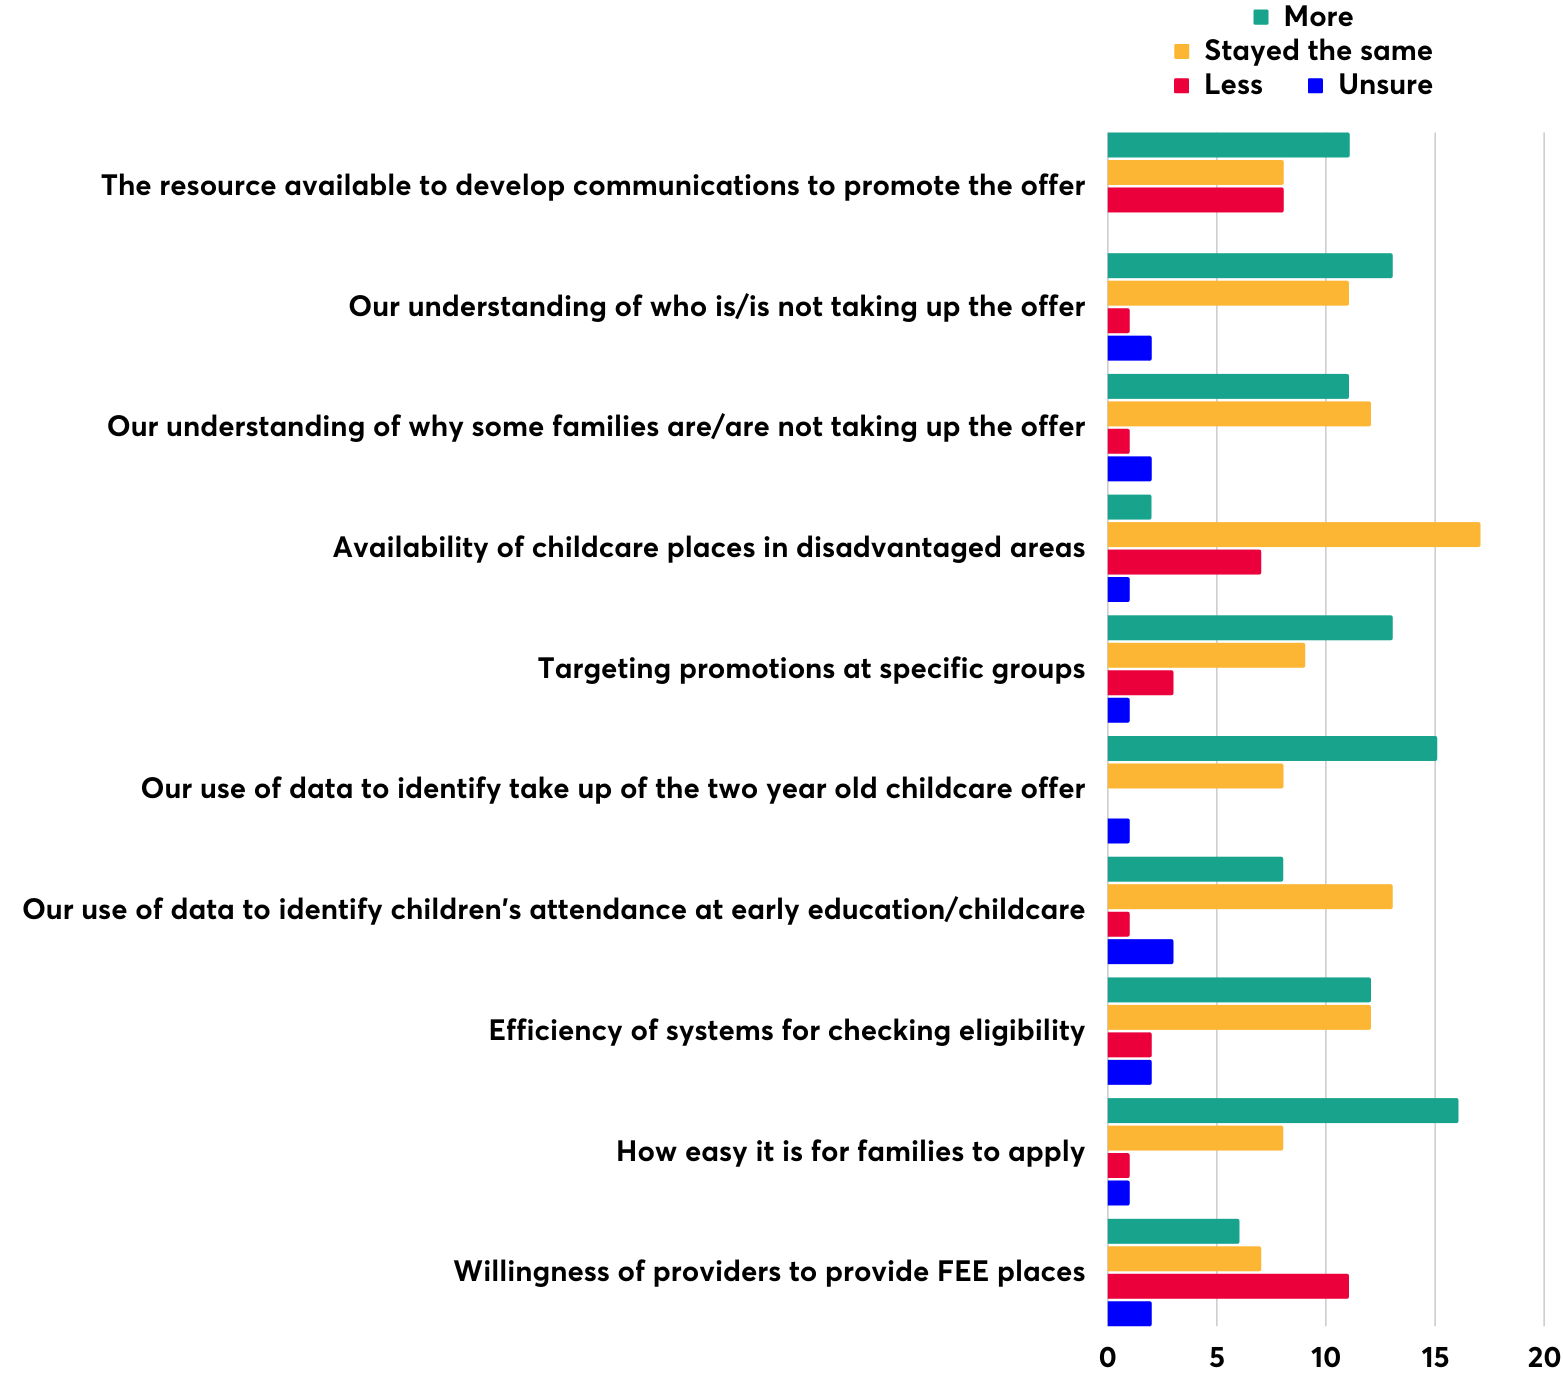
Figure 11. This chart shows the collated responses from all LAs who responded to the question 'Thinking about the two-year-old FEEE offer, how have the following changed over the last three years? This chart shows responses from 25 survey respondents.
Effective communication of the two-year-old FEEE offer is important to promote it to parents. Take-up by eligible families remains a challenge; following the pandemic, take-up dropped to a low of 62% but last year it recovered to pre-pandemic levels of 72% (DfE, 2022). While this is a substantial improvement, 28% of eligible children in England are still missing out – this is around 53,000 eligible children.
The majority of LAs who responded said that the resource available for promoting the FEEE in their area had increased (12 out of 25, 44%). However, just under a third of LAs (8, 30%) either reported that resource had stayed stable or had reduced. In these local areas where resource available has reduced, it may be a challenge to effectively promote the offer to eligible families. Nesta has a free toolkit aimed at helping local areas to promote the FEEE.
The majority of LAs (16, 59%) said it is now easier for families to apply for the offer. Systems for checking eligibility have either improved or stayed the same (12, 44%). There are also positive trends in relation to data use, including increased use of data to monitor take-up and improvements in targeting promotions at specific groups. However, while there has been an increase in understanding of who is taking up the offer, the change in LAs' understanding of why some families are/are not taking up the offer has not progressed to the same extent.
The survey results also reflect challenges in some areas with the provision of childcare places. While the majority of respondents said that the availability of childcare places in disadvantaged areas has remained stable, a large minority report that there are fewer places available. Around half of respondents also said that providers have become less willing to provide places for children entitled to the two-year-old FEEE. These problems with supply add to the challenge facing LAs seeking to increase families' take-up of the offer.
D) Use of early years assessments and data
In the survey, we asked LAs about how they use a variety of early years assessment tools. We identified eight tools and asked whether these tools are used either universally/in a targeted way/in some early years settings/or not at all. The results are shown in figure 12 below; 25 LAs responded to this survey question. Please note that the first eight assessment tools shown in this chart were pre-set options and the final six assessment tools shown were added by LAs in a free-text box.
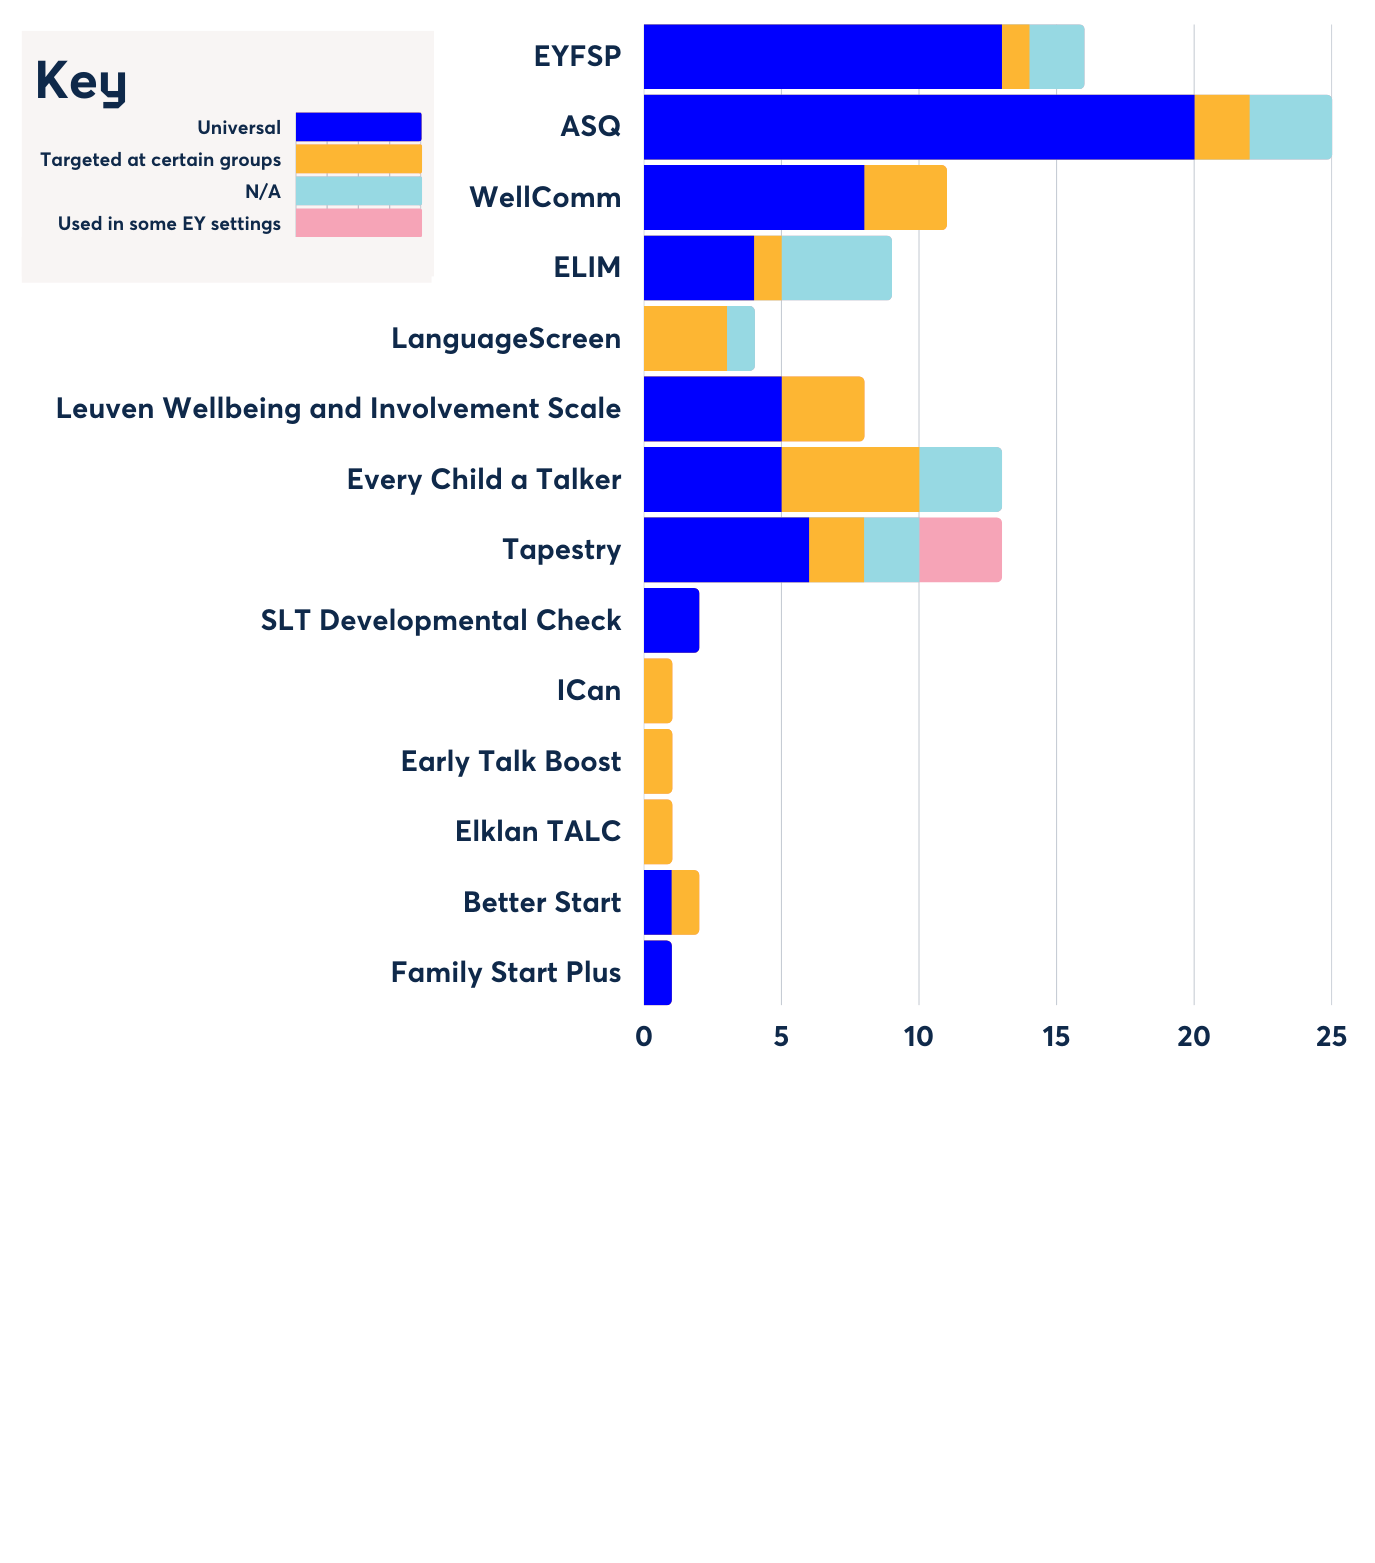
Figure 12. This chart shows 24 LAs' answer to the question: what are the main assessment tools used to assess outcomes?
The responses here reflect a wide variety of practices in relation to how assessment tools are being used. Perhaps surprisingly given their mandated status, the ASQ and EYFSP were not identified as being used universally in all local areas. It was also interesting to see that the WellComm (a non-statutory assessment tool) was being used in 11 local areas; universally in eight areas and in a targeted way in an additional three areas.
We also asked survey respondents specifically about how they use assessments for speech language and communication (see figure 13 below). Please note that responses about the use of specific tools may differ slightly from the chart shown above. This may reflect the different ways the questions were worded, as well as potentially different perspectives, if staff with different remits locally completed this part of the survey. Overall, we found that assessment tools focused on speech, language and communication were more likely to be used in a targeted way than at a universal level.
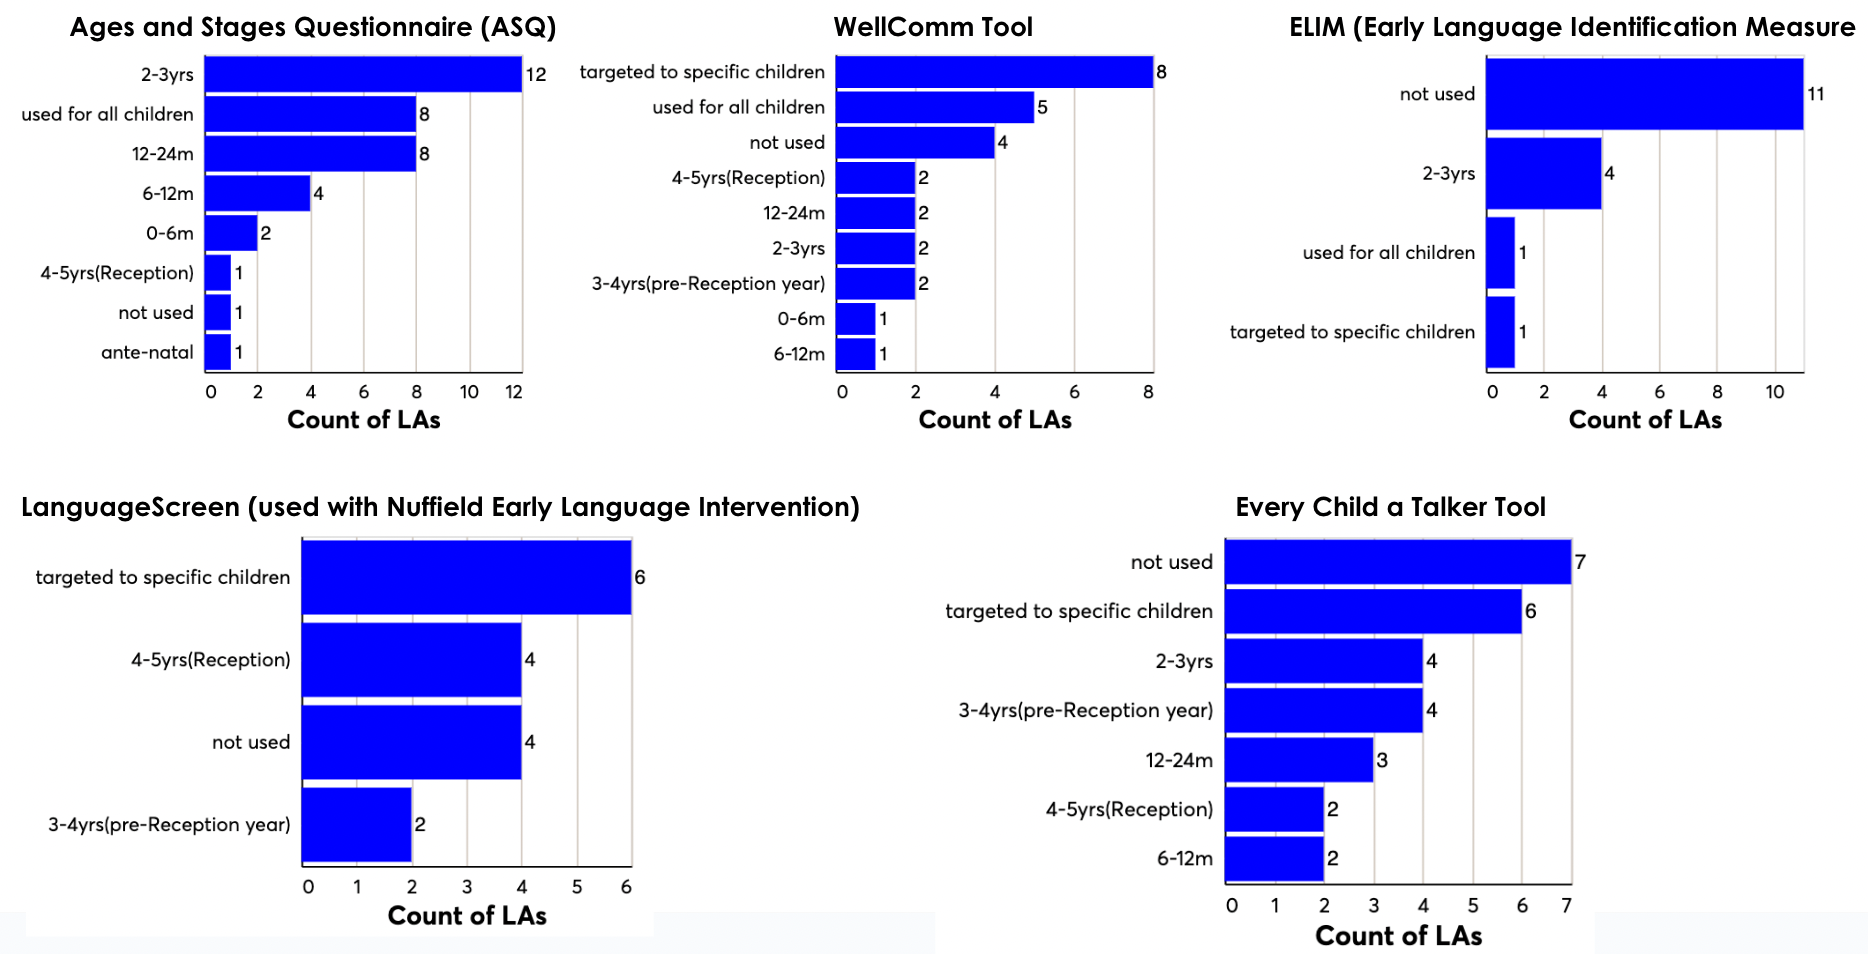
Figure 13: This chart shows the LAs' answer to the question: how are each of these speech, language and communication assessments used?
The chart below (figure 14) summarises the number of assessment tools that are used by LAs overall. It is interesting to see a wide range of practice here, with the number of tools in use ranging from zero to nine. The most common number of assessment tools in use was two to three.
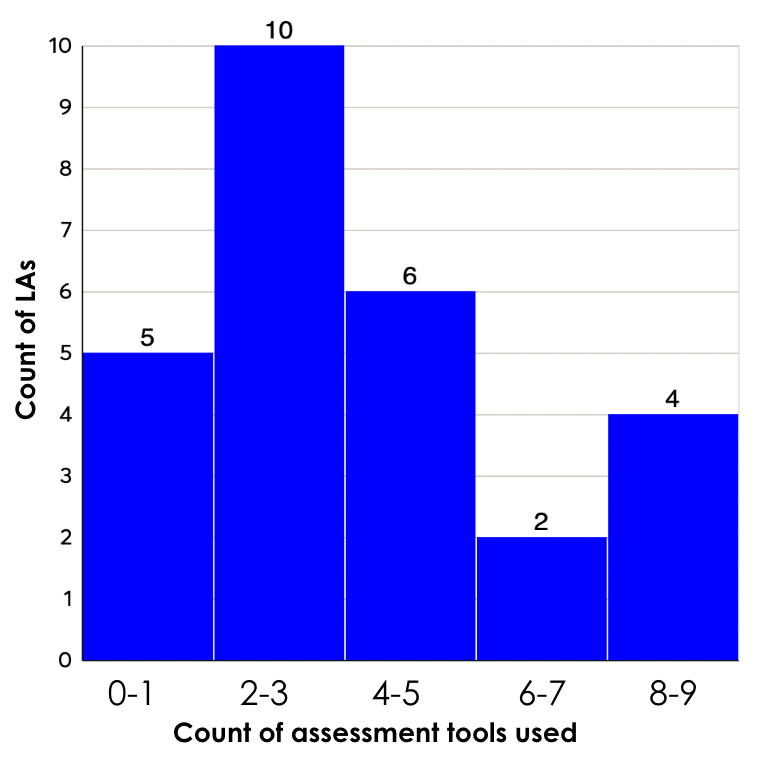
Figure 14. Number of assessment tools used by LAs
In the interview, we asked LAs what they think are the key things they do that make a difference in relation to assessment, data and information sharing and integrated working. A summary of their answers is shown below (figure 15).
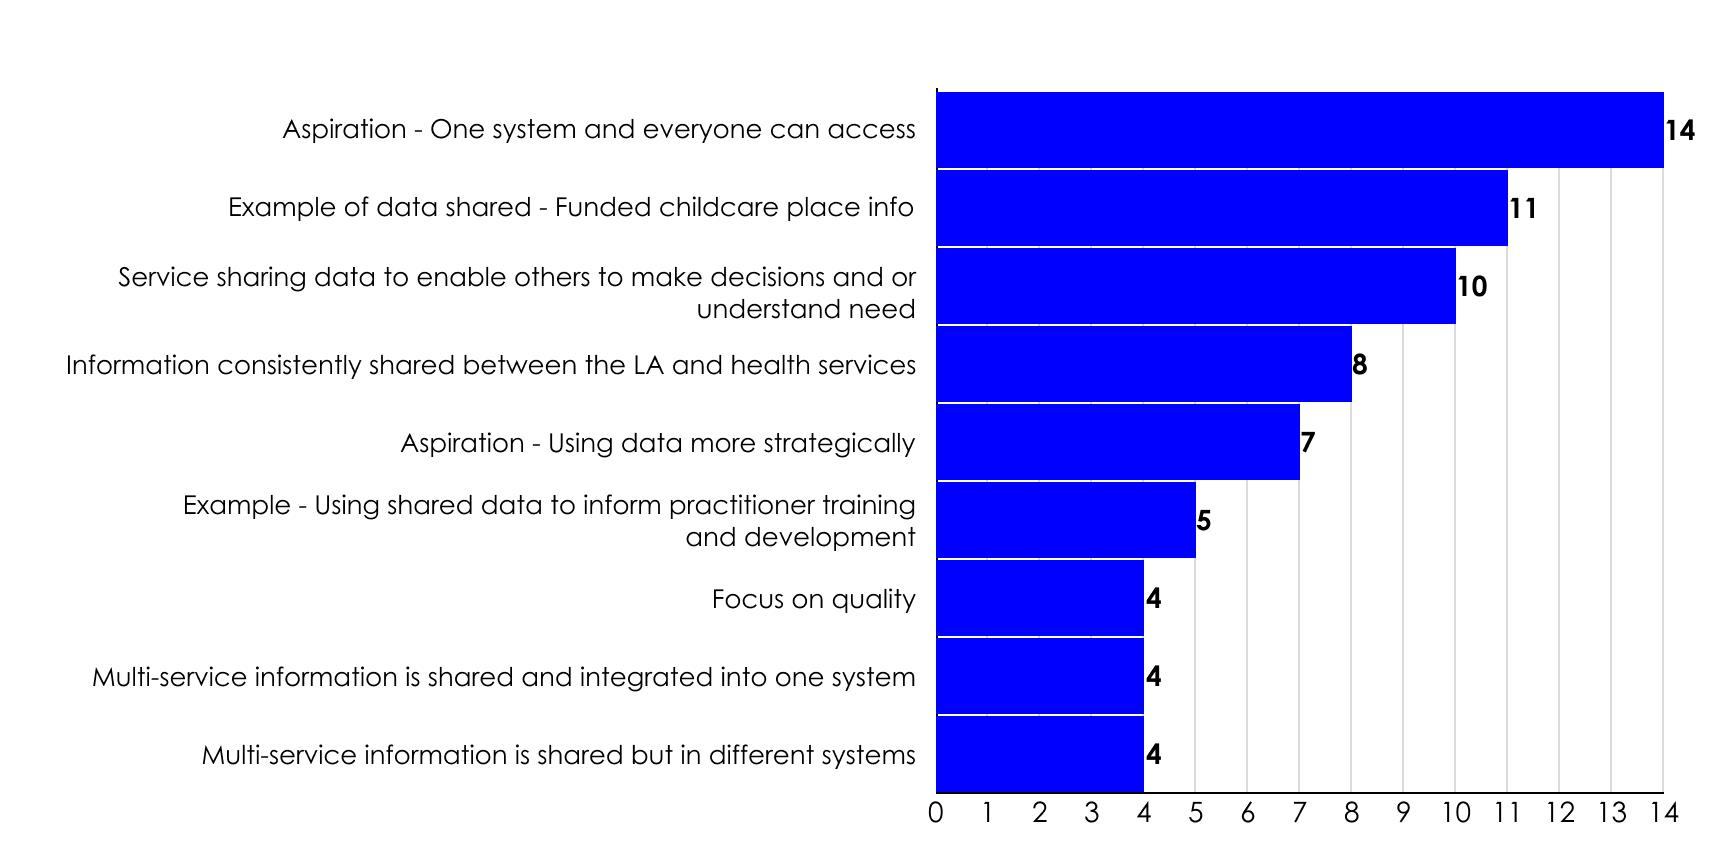
Figure 15. This chart shows 25 LAs' responses to the interview question: 'What do you think are the key things that your LA does that make a difference in relation to assessment data and information sharing and integrated working? Only responses shared by at least four LAs are shown.
Their responses told us that they think good data and information sharing and integrated working include joined-up and accessible systems with data shared across services. Good data use supports them to understand child and family needs and make better decisions. It has clear, practical applications, for example to support the implementation of funded childcare or to enable effective planning of practitioner training and development.
LAs mentioned the importance of information sharing with health and other services, including the police. They are experimenting with child identification numbers, the use of dashboards and new assessments with integrated data sharing built into the planning process. Co-location, partnership working and integrated management structures were also mentioned as enabling factors when it comes to effective assessment, data sharing and integrated working.
We also asked LAs about the extent to which a specific set of practices in relation to the use of data was embedded in their area. The results are shown in figure 16 below.
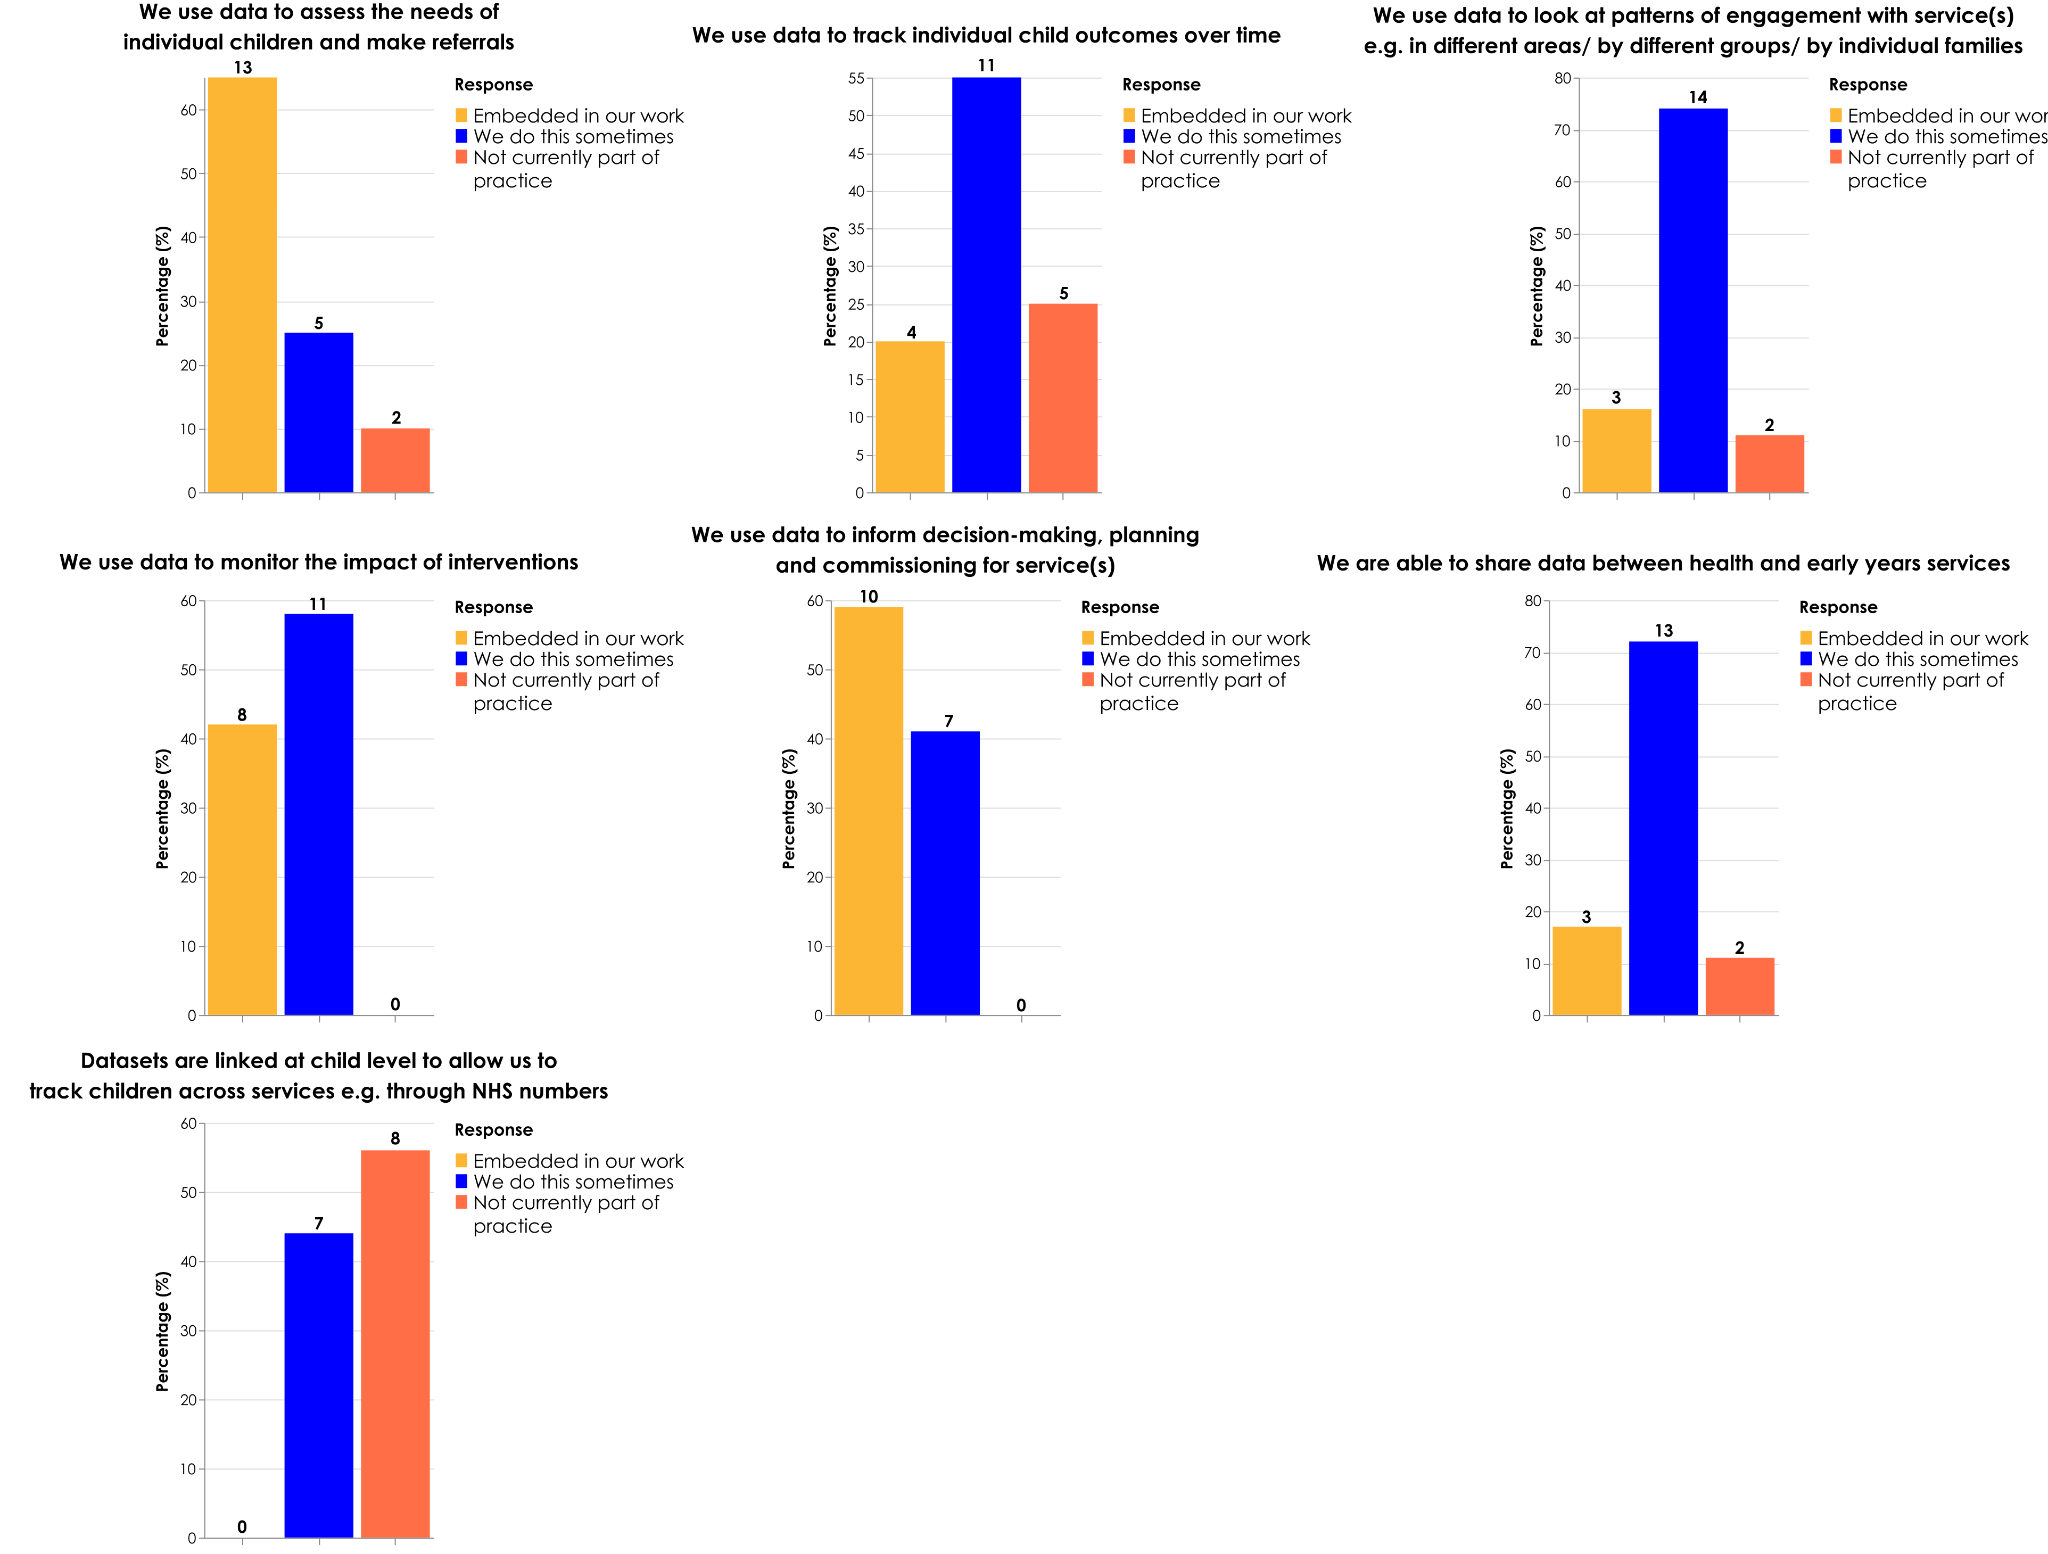
Figure 16. This chart shows LAs' responses to questions about the extent to which data practices are embedded in their area
As well as analysing findings for the sample as a whole, we also looked specifically at the responses by four ‘high performing' LAs, which were in the top 20% of performance in their cluster for children on free school meals reaching a GLD. We compared their answers to this question with the other 16 LAs who responded.
We found that a higher proportion of high performing LAs seem to use data regularly in their work for a variety of purposes than the other LAs in the sample. The four high performing LAs in our sample were more likely than other LAs to report that data was embedded in their work, especially in relation to using data to:
- assess the needs of individual children and make referrals
- track individual child outcomes over time
- look at patterns of engagement with service(s)
- monitor the impact of interventions
- inform decision-making, planning and commissioning for service(s).
Discussion
Variation in LA early years practice
This pilot study has demonstrated the incredible variation in early years practice in LAs. Just in our sample of 27 LAs there were:
- 212 different challenges identified across all aspects of early years
- 63 different parenting programmes offered
- 34 different training programmes offered for practitioners involved in the Healthy Child Programme
- 14 different assessment tools used, which could be delivered in up to 9 different ways.
While the sample size remains small, we hope that these findings will be useful for LAs to reflect on, allowing comparison between their own early years practices and those other local areas.
Limitations
While the dataset created through this project is extensive and covers a large number of types of practice, there are some limitations.
We were able to recruit a broad range of LAs to participate in the pilot, including a range of types of LA (reflecting six of the seven clusters) and different levels of performance in relation to the EYFSP GLD outcome measure for children on free school meals.
However, with the relatively small sample size of 27 LAs and not all LAs responding to every question, our exploration of the connection between specific practices (such as how they use data or which parenting programmes they have implemented) and performance must remain tentative.
The responses in the interviews, in particular, represent a snapshot of practice as reported by the LA staff who participated. Different LAs took different approaches to how they participated in the research; some asked a range of professionals to contribute, while others relied on an individual representative to compile information about a range of different service areas. We are only able to analyse the data we have available and the quality, comprehensiveness and accuracy of responses may vary depending on how much time people had to contribute.
Decision not to progress to further roll-out of these data collection methods
This pilot study has explored an ambitious approach to using different kinds of data to understand the relationship between local services and early educational outcomes for children from economically disadvantaged backgrounds.
At the outset of the pilot, we aspired to roll out this study nationally to all LAs. This would have allowed us to gather a large enough study sample that it may have been possible to identify trends linking LAs' practices with their relative performance (for children on free school meals in the EYFSP) within their cluster of similar LAs.
However, the purpose of the pilot was to test our proposed data collection methods to see if they would be feasible for wider roll-out. Through this study, we learned that the complexity of the survey, the amount of time it took for LAs to complete and the low completion rates mean it is not feasible for wider roll-out at this stage. While our study partner ACER did a fantastic job of recruiting LAs to participate, we do not think it is realistic or advisable to attempt to engage the additional 125 English LAs to complete the survey in its current form.
Next steps
Nesta's fairer start team has already shared individualised reports from the pilot phase with the LAs who participated. In coming months, we plan to use the data we have already gathered to develop and publish case studies of higher performing LAs. We would also like to conduct further qualitative analysis of the detailed interview data to learn more about the topics and themes discussed.
This work will provide important fuel as we develop our fairer start mission and seek to develop scalable solutions that really make a difference to closing the disadvantage gap. We'll draw on it as we develop work focused on building parents' capabilities, especially to develop impactful interventions for children aged 0-2 that support early language development. It will help us develop our data and detection work, which will focus on early identification of need and impactful targeting of resources, alongside better use of data across early years services and systems. We'll also use it to inform our work on evidence-based policy, which includes work focused on the early childhood education and care workforce in England.
We want to better understand the potential for using the large amount of data we have collected in the pilot phase before progressing to any further fieldwork at a wider scale. This includes working with LAs to understand what has been and would be useful to them, and exploring applications of this research to support other work in the early years sector.
If you see potential for applying this research to your own work, please get in touch with the fairer start team.
58 Victoria Embankment
London EC4Y 0DS
+44 (0)20 7438 2500
[email protected]
@nesta_uk
nesta.uk
www.nesta.org.uk
ISBN: 978-1-916699-05-2
Nesta is a registered charity in England and Wales with company number 7706036 and charity number 1144091. Registered as a charity in Scotland number SC042833. Registered office: 58 Victoria Embankment, London EC4Y 0DS.