Peter Goodridge
Jonathan Haskel
Gavin Wallis
Nesta Working Paper No. 14/07
August 2014
www.nesta.org.uk/wp14-07
Abstract
This paper provides an update of the NESTA Innovation Index for 2014, and tries to calculate some facts for the "knowledge economy". Building on the work of Corrado, Hulten and Sichel (CHS, 2005,9), using new data sets and a new micro survey, we (1) document UK intangible investment and (2) see how it contributes to economic growth. Regarding investment in knowledge/intangibles, we find (a) this is now 44% greater than tangible investment, in 2011, £127bn and £88bn respectively; (b) R&D is about 13% of total intangible investment, software 19%, design 10%, training and organizational capital both 20%; (d) the most intangible-intensive industry is the information and communications industry, where intangible investment is 19% of value added and (e) compared to the National Accounts, treating additional intangible expenditures as investment raises market sector value added growth in the 1990s and the early 2000s, but lowers growth in the late 2000s. Regarding the contribution to growth, for 2005-11, (a) intangible capital deepening accounts for 14% of labour productivity growth, against computer hardware, 8%; (b) TFP over the period was negative at -0.9% pa.; (c) capitalising R&D adds 0.05% to input growth and 0.02% to output growth. On industries, manufacturing accounts for 35% of intangible capital deepening in the UK market sector, information and communication accounts for 17%, and financial services accounts for 14%.
JEL Classification: 047, E22, E01
Keywords: Innovation, productivity growth, intangibles
We are very grateful for financial support from NESTA and UKIRC. New estimates of own-account intangible investment were produced using the Secure Data Service at the UK Data Archive. This work contains statistical data from ONS which is crown copyright and reproduced with the permission of the controller HMSO and Queen's Printer for Scotland. The use of the ONS statistical data in this work does not imply the endorsement of the ONS in relation to the interpretation or analysis of the statistical data. The views expressed in this paper are those of the authors and do not necessarily reflect those of affiliated institutions. Corresponding Author: Jonathan Haskel, Imperial College Business School, Imperial College, London, SW7 2AZ; [email protected].
The Nesta Working Paper Series is intended to make available early results of research undertaken or supported by Nesta and its partners in order to elicit comments and suggestions for revisions and to encourage discussion and further debate prior to publication (ISSN 2050-9820). Year 2014 by the author(s). Short sections of text, tables and figures may be reproduced without explicit permission provided that full credit is given to the source. The views expressed in this working paper are those of the author(s) and do not necessarily represent those of Nesta.
1. Executive Summary
This report presents an update of the NESTA Innovation Index for the period 1990 to 2011. The aim is to better understand the contribution of innovation to productivity growth in the UK market sector including the contribution of individual industries to the market sector aggregate. In doing so we apply an approach that is consistent with National Accounts methods of measuring output, income and investment. Innovation is estimated by calculating the contributions of a wider range of assets to growth in GDP in a more complete, but National Accounts consistent, framework, that avoids double-counting.
The report makes three contributions. First, we set out our approach and results on innovation accounting, namely our best estimate of how much firms are spending on knowledge. Second, we set out our approach and present results using a growth-accounting based innovation index, namely our best estimate of how much all forms of knowledge contribute to growth. Third, we provide new estimates of growth in the UK economy over the period 1990-2011, restated by adding in to the official National Accounts investments in knowledge assets normally counted as intermediate purchases by firms. Treating these inputs as investment has the effect of raising the level of GDP and changing growth rates over the period relative to those in the National Accounts. We do this for (a) the whole market sector and (b) for nine disaggregated industries.
Knowledge takes different forms, so quantifying it is not straightforward. In this framework we measure (a) investment in intangible assets to approximate the knowledge stock created by firms (b) consider improvements in the knowledge held by workers in the labour force thanks largely to their qualifications and experience and (c) since knowledge can leak across firms (in the way that tangible capital cannot), we also consider freely-available knowledge.
We define our innovation index as the growth in output – that is, value-added created by new products and services, processes and ways of working over and above the contributions of physical capital and labour input. Therefore, the widest definition of our index includes the shares of growth which can be attributed to knowledge investment in the market sector, to improvement in human capital due to education and the building of experience, and to Total Factor Productivity (TFP) which measures spillovers and other unmeasured knowledge inputs to firms (as well as measurement error). Other variants of the index include the joint contributions to growth of TFP and knowledge capital.
This report builds on previous work on intangible asset spending and growth. It continues the research programme set out in Corrado, Hulten and Sichel (CHS, 2005, 6) and van Ark and Hulten (2007) and incorporates some of the previous work for the UK, including Giorgio Marrano, Haskel and Wallis (2007) and the additional industry detail used in previous papers for NESTA (e.g. Goodridge Haskel and Wallis 2012).
Following that approach, the intangible assets that we measure are software, design, product development in financial services and artistic creation, and investment in brands, firm-specific human capital and organisations. Relative to our last report the following is new:
1. improved estimates of intangible spending
We update all our estimates of intangible investment using the latest data, incorporating revisions to the back-series. The main changes are to data on artistic originals and own-account software. Data for artistic originals are new estimates introduced in Blue Book 2013, based on the data and methodology of our own estimates, as reported in Goodridge (2014). Data for own-account software have also been revised, with a change to the method to better account for net operating surplus in own-account software production. In practice, this means that previous estimates are marked up by a factor of 1.15.
Although not new, we note that we have undertaken two runs of the Investment in Intangible Assets survey, asking firms for data on intangible spending and life lengths of intangible assets. This enables us to cross-check our spending and deprecation results against micro data. We find our deprecation assumptions to be largely in line with micro evidence, as is our spending data for software, R&D, marketing and training. More research is necessary to better measure design and spending on organisational capital.
2. industry-level data to better understand the industry contributions to market sector innovation
Again we provide data at the industry level, consistently aggregated to the market sector, so that we can work out the contributions of each industry to overall growth and innovation. This year we have moved to the latest industrial classification (SIC 2007). We therefore have a new industry breakdown, and one that produces interesting results since the new classification allows us to focus on creative industries in a way that was not possible before, with the new industry “Information and Communication” approximately aligning with what many describe as the creative industries.
3. Up-to-date official estimates to build market sector GDP, hours, tangible investment and labour skill composition.
We use the latest Blue Book data from ONS (Blue Book 2013), with data up to 2012, and detailed input-output data up to 2011. We also use the latest ONS investment data to produce estimates of capital services and we use the ONS data for quality-adjusted labour input (QALI).
As in EUKLEMS, our definition of the UK market sector excludes the public sector, private delivery of public services such as education and health, and the real estate sector. We exclude real estate as the majority of sector output is made up of actual and imputed rents. Since dwellings are not part of the productive capital stock, we must also exclude the output generated from dwellings, so that the output and capital input data are consistent. This is standard practice in growth accounting exercises.
4. New estimates for the price of intangible assets
In past work we have largely approximated the price of intangible assets using an implied deflator for UK value-added. Exceptions to this were assets such as software, where official deflators exist. For this report we make use of new deflators for almost all intangible assets, largely based on the experimental set of Services Producer Price Indices (SPPIs) produced by the ONS. Specifically: for architectural and engineering design we use the SPPI for the related industry, “Technical testing and analysis"; for advertising we use the SPPI for "Advertising Placement"; for market research we use the SPPI for “Market Research"; for organisational capital we use the SPPI for “Business and Management Services"; for training we use the SPPI for “Adult Education"; for R&D we use the US price index produced by the BEA; and for software, mineral exploration and artistic originals, we use deflators supplied by the ONS. The only remaining assets for which we do not have a specific deflator are financial product innovation and non-scientific R&D, and we deflate each with the implied UK value-added deflator.
5. Tax adjustment of rental prices for growth accounting.
We also update a full set of tax-adjustment factors for both tangible and intangible assets, and so incorporate better estimation of rental prices, capital income shares and the contributions of capital deepening in our dataset. Specifically on intangibles, this adjustment is particularly important for R&D as the R&D tax credit introduced in 2002 had a large impact on the cost of capital which our data reflects. Appropriate tax adjustment factors for mineral exploration and purchased software are also incorporated.
6. Data from ONS, up to 2011, to build industry-level estimates of value added, hours, tangible investment and labour skill composition.
We also undertake value-added growth accounting at the industry level, to understand the contributions of individual industries to the UK market sector. We then aggregate this up to the market sector level.
With this in mind, our major findings are as follows:
1. Investment in knowledge.
UK investment in intangible or knowledge assets has been greater than that for tangible assets since the early 2000's. In 2011 it stood at £127bn, as opposed to £88bn tangible investment. Of that intangible spend training by firms accounts for £25bn, organisational capital for £26bn, design £13bn, software £24bn and scientific R&D £16bn.
The industry that is most intensive in intangible spend is information and communication, which invests 19% of their value added on intangibles. This industry is a new addition to the Standard Industrial Classification (SIC 2007) and consists of numerous knowledge-intensive and creative activities that were previously scattered around the SIC, such as: publishing; software and other computer services; motion picture, video and television production; music and sound recording; broadcasting and telecommunications services. This has been the most intangible-intensive industry over the entire length of our dataset (1997 to 2011). Since 2003, the second most intangible intensive industry has been manufacturing. In the years 1999 to 20002, financial services was the second most intangible-intensive industry in our data, reflecting strength in software investment in those years and in that industry. Since then however, intangible investment has fallen from around 18% to 13% as a share of value-added.
The least intangible-intensive industries in our dataset are 'agriculture; mining and utilities' and construction, where intangible investments are around 6% of industry value-added.
Relative to the official estimates in the National Accounts, the effect of treating additional intangible expenditure as capital spending is to raise market sector gross value added (MGVA) growth in the 1990s and early 2000s, and reduce growth in the late 2000s.
2. Innovation in the market sector
Beginning with some background, if we ignore all intangibles, previous work showed that labour productivity growth was steady through the 1990s. However, using the latest National Accounts data and excluding all intangibles shows a slowdown during the 1990s. Labour productivity growth was 3.4% p.a. in 1990-95 and 3.2% p.a. in 1995-2000. Labour productivity growth slowed down further in the early 2000s to 2.8%pa, and again in the late 2000s, to just 0.6%pa.
When we include all intangibles, the growth rates change but the pattern is similar. Labour productivity growth was 3.3% pa in 1990-95, slowing to 2.9% pa in 1995-2000, to 2.5% pa in 2000-05, and to just 0.4% pa in 2005-11. Of the 2005-11 growth in value added per hour of 0.4% p.a., we have the following contributions:
- Intangible capital deepening: 0.05% p.a.
- Total factor productivity, that is, learning from knowledge spillovers and feely available knowledge (plus other mismeasured factors such as factor utilisation): -0.9% p.a.
- Improved general worker human capital due to formal qualifications, age and experience changes: 0.5% p.a.
If we define innovation as the contribution of knowledge capital and TFP, then innovation contributed to growth in output per person-hour in the UK by 0.05%+(-0.90%) = -0.84% (due to rounding) in 2005-11. If we define innovation more widely, that is the contribution of knowledge capital, TFP and general human capital, we have that innovation contributed to growth in output per person-hour 0.05% + (-0.90%) +0.49% = -0.35% p.a. in 2005-11. It is clear that the overall negative contribution is due to negative TFP growth. This is a very widely studied puzzle that we comment on below.
3. Innovation in industries and their contribution to the overall market sector
At the industry level, over the period 2000 to 2011, manufacturing (1.3% pa) and information & communication (1% pa) have the highest TFP based on industry real value-added. Over the whole period industry TFP was also positive in professional and administrative services (0.2% pa) (previously business services in SIC 03). Value-added based TFP in all other industries was negative on average over the period studied.
In terms of the contribution of intangible capital deepening, in absolute terms the largest contributions were in information & communication (0.8% pa), manufacturing (0.7% pa) and financial services (0.5% pa). In terms of contribution to industry labour productivity, the largest contributions were in personal and recreational services (893% of labour productivity, since growth in value-added was just 0.03% pa over the period), construction (28%), information & communication (27%), financial services (26%) and manufacturing (22%). Thus the industries which made the largest contribution to aggregate market sector intangible capital deepening were manufacturing (35%), information & communication (18%) and financial services (14%), where the contribution depends on the income share for intangible capital in industry value-added and the share of industry value-added in market sector value-added.
To emphasise the relative importance of these industries, we note that manufacturing contributes 35% of intangible capital deepening compared to a share of just 15% in market sector hours worked. Similarly, information & communication and financial services contribute 18% and 14% respectively, compared to respective shares of just 6% and 5% in aggregate hours worked.
In previous reports we have also presented the contribution of industry TFP to the aggregate. However, in this report, such a calculation is less meaningful since market sector TFP is negative over the period studied. We are however able to estimate the contribution of innovation, defined as the contributions of intangible capital deepening, labour composition and TFP, as the aggregate sum of these contributions is positive.
The contribution of each industry to market sector innovation depends upon the industry contributions and the industry weight in value-added. When we estimate the industry contributions we find that manufacturing is particularly important. Defining the contribution of innovation as above, manufacturing accounts for 99% of innovation in the UK market sector. We also find important contributions from information & communication (47%), professional & administrative services (30%) and financial services (18%). Clearly these contributions sum to more than 100%, therefore some other industries make negative contributions, particularly agriculture, mining and utilities which contributes -63% of UK innovation.
2. Introduction
What drives growth in increasingly knowledge-intensive economies? The sources of growth are of course an enduring subject of interest for academics and policy-makers alike, and since at least Solow (1956), have been studied in a growth accounting framework. Whilst this gives the proximate sources, namely capital deepening, skills and total factor productivity, and not the ultimate sources (e.g. legal framework) it is, most are agreed, an important first step in marshalling data and uncovering stylized facts that other frameworks might explain.
The productivity consequences of the ICT revolution have been studied in a growth accounting framework by many authors in many countries (see e.g. Timmer, O'Mahony, van Ark and Inklaar 2010, Jorgenson et al, 2007). But hanging over this literature is an early suggestion, Brynjolfsson and Hitt (2000) for example, that investment in computer hardware needed complementary investments in knowledge assets, such as software and business processes, to reap productivity advantages. This re-awakened interest in the application of the sources of growth framework to information and knowledge-intensive economies. For free knowledge (e.g. from universities or the internet), the framework is quite clear: if competitive assumptions hold, total factor productivity growth (TFPG) measures the growth contribution of knowledge that is costless to obtain and implement.
However, there are two points illustrated nicely by Tufano's (1998) description of a typical financial product innovation. He states it requires
“an investment of $50,000 to $5 million, which includes (a) payments for legal, accounting, regulatory, and tax advice, (b) time spent educating issuers, investors, and traders, (c) investments in computer systems for pricing and trading, and (d) capital and personnel commitments to support market-making.”
First, in this example knowledge is not costless to obtain or commercialise and so cannot be relegated to TFPG. Second, a long-established literature adds R&D to the growth accounting framework. But, some industries e.g. finance and retailing, do no (measured) R&D. Thus one needs to consider knowledge investment besides R&D: this example suggests training, marketing and organisational investments for example. Thus our objective in this paper is to better measure growth and its sources for the UK economy where: (a) knowledge development and implementation is not costless, and (b) R&D is not the only knowledge investment.
To do this, this paper implements the framework set out in the widely-cited papers by Corrado, Hulten and Sichel (2005, 9, CHS). Whilst CHS builds upon the methods of capitalising tangible assets, and intangible assets such as software which are now capitalised in National Accounts, it was the first paper to broaden the approach to a fuller range of intangible or knowledge assets. Thus it fits with the range of innovation investments mentioned above.
More specifically, we seek to do two things in this paper. First, we seek to measure investment in intangible assets at an aggregate and industry level. This part of the paper takes no stand on growth accounting. We believe it of interest for it tries to document knowledge investment in industries where measured R&D is apparently very low, such as finance and retailing. Current data can document the physical, software and human capital deepening in these industries (and also R&D, when capitalised in the National Accounts later this year). However, this paper tries to ask and answer whether we are missing significant investment in knowledge or ideas in these sectors.
Second, we use these data to perform a sources-of-growth analysis for the UK using the CHS framework. Whilst one might have reservations about the assumptions required for growth accounting, see below, we believe this is also of interest. The main reason is that it enables us to investigate a number of questions that could either not be addressed without these data, or all relegated to the residual. First, as CHS stress, the capitalisation of knowledge changes the measures of both inputs and outputs. Insofar as it changes outputs, it alters the labour productivity picture for an economy. Thus we can ask: what was the productivity performance in the late 1990s when the UK economy was investing heavily in intangible assets during the early stages of the internet boom? Second, we can then ask: how was that performance accounted for by contributions of labour, tangible capital, intangible capital and the residual? Here we can describe how sources of growth will differ when R&D is capitalised and how other knowledge contributes and alters TFP. Third, we also ask and try to answer this question at industry level. So we can ask, for example, how much productivity in non-R&D intensive sectors, such as retail and financial services, was accounted for by other intangibles or was it mostly TFPG?
In implementing the CHS framework, we proceed as follows, going, we believe, a bit beyond their work for the US. First, we gather data on the intangible assets that CHS suggest, but by industry. (Fukao et al (2009) and van Rooijen-Horsten, van den Bergen and Tanriseven (2008) do this for Japan and Holland, but they do not do growth accounting to derive the contributions of the industries to the total).
Second, we update some of the methods of CHS. For example, much intangible spend, like R&D, is own-account. CHS had no own-account estimates for design or for financial services. We apply the National Accounts software method to estimate such own-account spending, using interviews with design and financial companies to identify occupations and time use and thereby derive intangible spend from wage data. We have also improved estimates of investment in artistic originals (Goodridge, 2014) and those new estimates have been incorporated into the National Accounts. In addition, there is almost no information on the depreciation of intangible assets. Thus, for previous compilations of the NESTA Innovation Index, we have conducted two runs of a survey, of each around 1,000 companies, on intangible spend and the life lengths of that spend, by asset, to gather data on depreciation. We also test the robustness of our results to other estimates of the price of intangible assets. In the case of R&D we experiment with the US BEA deflator as well as a UK value-added deflator, and for software we experiment with both the UK and US deflators.
Third, we provide (value-added based) growth accounting results by industry aggregated consistently to the UK market sector. Thus we can examine the contributions of different industries to overall growth. This then speaks to the question of, for example, how much manufacturing versus financial services contributed to overall TFP growth or UK innovation, as well as providing information on the contribution of the UK creative industries which are largely contained in the new industry (to the SIC) of information & communication.
On specifically UK data, our work is mostly closely related to the industry-level work (Basu, Fernald et al. 2004). They incorporated software as a productive asset and looked at productivity and TFPG in 28 industries 1990 to 2000. They did not have data however on other intangible assets and so whilst they were able to document software and hardware spending across industries, they were not able to look at other co-investments in innovation. As will be clear however, we rely heavily on their important work on measuring software and also tangible assets, now embodied in official UK data collection. Likewise, our work is also closely related to EUKLEMS (O'Mahony and Timmer, 2009). Their dataset includes software, and we extend their framework with additional intangibles, explicitly setting out the industry/market sector aggregation.
Whilst growth accounting is an internally consistent method for analysing productivity growth there are of course limits to the analysis that caveat our work. First, in the absence of independent measures of the return to capital we are compelled to assume constant returns to scale and perfect competition to measure the output elasticities of capital residually from the cost share of labour. A consistent framework for growth and innovation accounting with these assumptions relaxed is outside the scope of this current paper. But we hope that readers sceptical of the growth accounting assumptions would still find of interest the findings on knowledge investment and how their addition to the growth accounting framework changes the usual findings (which turns out to be quite considerably). We also hope that readers likewise sceptical of capitalising the full range of intangibles will find our work on R&D, which is to be officially capitalised later this year in Blue Book 2014, of interest.
Second, like other work in this area, we are of course limited in what we can do by data uncertainty. Measures of intangible assets are clearly difficult to obtain, especially for the own-account part of organisational capital. Deflators for intangibles are as yet uncertain. Our industry data covers nine broad industries in the UK market sector since finer detail on intangible spend is very hard to obtain.
We have two sets of findings (a) on knowledge spending and (b) implications for growth. On knowledge spending, first, investment in long-lived knowledge, which creates intangible assets, now exceeds tangible investment, at around, in 2011, £127bn and £88bn respectively. R&D is about 13% of such spend. Organisational investments, training and software are the largest categories of intangible investment, and are particularly important in services. The effect on market sector gross value added (MGVA) of treating additional intangible expenditure (not already recorded in the national accounts) as investment is to raise MGVA growth in the 1990s and the early 2000s, but reduce it in the late 2000s.
On the implications for growth, for 2005-11, the most recent period with data available, intangible capital deepening accounts for 14% of labour productivity growth, a larger contribution than computer hardware (8%). Other tangibles (buildings, vehicles, plant) accounted for 181% of productivity growth (since their contribution was 0.72%pa but labour productivity growth was just 0.4% pa). Due to the general slowdown in TFP in the 2000s, followed by the collapse in 2008 and 2009, and the lack of recovery in TFP since, TFP makes a strong negative contribution at minus 0.9% pa. These findings are quite robust to variations in depreciation and assumptions on intangible measures. Capitalized R&D accounts for about 10% of LPG.
Regarding industries, the main finding here is the importance of information & communication (which aligns quite closely with what are usually described as the “creative industries") and manufacturing. In terms of intangible capital deepening, these two industries alone, which together account for just 21% of hours worked, account for 54% of aggregate intangible capital deepening. These two industries were also by far the two strongest performers in terms of TFP, which was on average 1.3% pa in manufacturing and 1% pa in information and communication. Aside from professional & administrative services (0.2% pa), TFP in all other industries was negative over the period 2000 to 2011. Unfortunately, since aggregate market sector TFP was negative over the period, we are unable to present the industry TFP contributions as a share of the market sector total. But, in terms of industry contributions to overall market sector innovation (defined as the contributions from intangible capital deepening, labour composition and TFP), our results again emphasise the importance of manufacturing and information & communication, which together account for 146% of UK market sector innovation.
The rest of this paper proceeds as follows. Section 3 sets out a formal model, section 4 our data collection, section 5 our results on innovation accounting, section 6 our market sector growth accounting, section 7 our industry-level growth accounting and section 8 concludes.
In this paper we undertake growth accounting for the UK market sector. But we are also interested in how industries contribute to the overall changes. In past work we have conducted our industry work on a gross output basis. Due to problems of data availability, in this report we work on a value-added basis at the industry-level. At industry level, a value added production function exists under restrictive assumptions. What is the relation between the industry components of growth and the whole market sector?
Using value-added, the output of intermediate goods, and their use as an input, drops out of the output identity. Or put another way, intermediate inputs are not included in a value-added production function. Suppose there is one unit of capital and labour (respectively K and L) which produce (value-added) output Vⱼ in industry j. That capital asset might or might not be intangible capital. Thus for each industry, we have the following value-added defined
Aln TFPⱼ = ∆ln Vⱼ - vₖ,ⱼ∆ln Kⱼ - vₗ,ⱼ∆ln Lⱼ (1)
Where the terms in “v” are shares of factor costs in industry nominal value-added, averaged over two periods. For the economy as a whole, the definition of economy wide ∆lnTFP based on value added is the same, that is:
∆lnTFP = ∆lnV – vₖ∆ln K – vₗ∆ln L (2)
Where the “v” terms here, that are not subscripted by “j”, are shares of K and L payments in economy wide nominal value added. Now we define the relation between industry value-added and market sector value-added, which is that changes in aggregate real value added are a weighted sum of changes in industry real value added:
∆lnV = ∑ⱼwⱼ∆lnVⱼ, wⱼ = PⱼVⱼ / ∑ⱼ(PⱼVⱼ), w̄ⱼ = 0.5(wⱼ,ₜ + wⱼ,ₜ₋₁) (3)
We are now in position to write down our desired relationship, that is the relation between economy-wide real value added growth and its industry contributions
∆lnV = (∑ⱼw̄ⱼv̄ₖ,ⱼ∆ln Kⱼ) + (∑ⱼw̄ⱼv̄ₗ,ⱼ∆ln Lⱼ) + ∑ⱼw̄ⱼ∆lnTFPⱼ (4)
Which says that the contributions of Kⱼ and Lⱼ to whole-economy value added growth depend upon the share of Vⱼ in total V (wⱼ) and the shares of K and L in industry value-added. Which is equivalent to saying that the contributions of Kⱼ and Lⱼ depend on their share in aggregate value-added. The contribution of ∆lnTFPⱼ also depends on the share of Vⱼ in total V (wⱼ).
Finally, in reality we do not of course have one capital and labour unit, but many. These are then aggregated across different types: for labour, see below, we use, education, age (experience), and gender; for capital, different types of both tangible assets and intangible assets. Denoting the capital and labour types k and l we have following industry and aggregate variables for each type where industry is defined as industry j and the aggregate variables are unsubscripted:
Aln K = ∑WkAln Kk, capital type k
k
Δln L = ∑WlΔln Ll, labour type l
Wk = PkKk/∑(PkKk), Wl = PlLl/∑PlLl, Kk = ∑Kjk, Ll = ∑Ljl
j
j
wl = 0.5(wt + wt-1) (5)
In our results we document the following. First, we set out the value-added growth accounting results for each industry, (1). Second, we take these data and set out the contributions for each industry to the growth of aggregate value added, (4). Third, we sum up the contributions across industries to the decomposition of aggregate (market sector) value-added, (2). In each case we carry out the decomposition with and without intangibles, and for the market sector also using a National Accounts model only including intangibles already capitalised in the SNA.
Before proceeding to the data, some further theory remarks on the measurement of capital. As pointed out by e.g. Jorgenson and Griliches (1967) the conceptually correct measure of capital in this productivity context is the flow of capital services. This raises a number of measurement problems set out, for example, in the OECD productivity handbook (2004). We estimate the now standard measure as follows. First, we build a real capital stock via the perpetual inventory method whereby for any capital asset k, the stock of that assets evolves according to
Kk,t = Ikt+(1-δt)Kkt-1 (6)
Where I is real investment over the relevant period and δ the geometric rate of depreciation. Real tangible investment comes from nominal tangible investment deflated by an investment price index. Second, that investment price is converted into a rental price using the Hall-Jorgenson relation, where we assume an economy-wide net rate of return such that the capital rental price times the capital stock equals the total economy-wide operating surplus (on all of this, see for example, Oulton and Wallis (2014) and Oulton and Srinivasan, (2003).
4. Data
4.1 Time period
For the industry analysis, since we work with value-added we use the official ONS data up to 2011. For intangibles, our industry level data is available 1997-2011 since this is when Input-Output (IO) tables are consistently available from. Data for the whole market sector is available going back to 1980 up to 2011. Thus we work with two data sets: (1) market sector, 1980-2011, consistent with National Accounts 2013, and (2) industry level 1997-2011, based on the same data.
4.2 Industries
For our industry work, we aggregate to nine broad industries described in Table 1. The choice of the nine industries is dictated by the availability of the intangible data, some of which are only available at these aggregated levels.
Table 1: Definition of nine industries
| # |
Sectors |
SIC(2007) code |
NACE1 sections |
| 1 |
Agriculture, Mining and Utilities (AgMinUtil) |
1-9 & 35-39 |
A Agriculture, forestry and fishing
B Mining and quarrying
D Electricity, Gas, Steam and Air Conditioning Supply
E Water Supply, Sewerage, Waste Management and Remediation Activities |
| 2 |
Manufacturing (Mfr) |
10-33 |
C Manufacturing |
| 3 |
Construction (Constr) |
41-43 |
F Construction |
| 4 |
Wholesale and Retail Trade, Accomodation and Food (RtAcc) |
45-47 & 55-56 |
G Wholesale and Retail Trade; Repair of Motor Vehicles and Motorcycles
I Accomodation and Food Service Activities |
| 5 |
Transportation and Storage (Tran) |
49-53 |
H Transportation and Storage |
| 6 |
Information and Communication (InfoCom) |
58-63 |
J Information and Communication |
| 7 |
Financial Services (FinSvc) |
64-66 |
K Financial and Insurance Activities |
| 8 |
Professional and Administrative Services (ProfAdmin) |
69-82 |
M Professional, Scientific and Technical Activities
N Administrative and Support Service Activities
R Arts, Entertainment and Recreation
S Other Service Activities |
| 9 |
Recreational and Personal Services (PersSvc) |
90-98 |
T Activities of Households as Employers; Undifferentiated Goods and Services Producing Activities of Households for Own Use |
Note to table: We break the market sector down into 9 broad industries based on SIC07, as reported above. In previous work we used an 8-industry definition based on SIC03.
4.3 Outputs and tangible and labour inputs.
Our industry definitions now based on SIC07 therefore differ from previous reports which were based on SIC03. First, we have introduced some additional detail working with nine industries rather than eight, separating transportation from retail/wholesale. Second, the revision to the SIC has resulted in an improved breakdown of the service sector. In particular it allows us to comment on the information & communications industry, which includes publishing, software, motion picture, video and television production, broadcasting, telecommunications, software and information services, thus approximately aligning with the "creative industries".
We measure output for the market sector, defined here as industries A to K, MN and R to T, which is consistent with EUKLEMS, that is excluding real estate, public administration & defence, education and health. Note this differs from the ONS official market sector definition, which excludes some of the publicly-provided services in R (galleries and libraries for instance), and includes the private delivery of education, health and social care. We also use disaggregated real value added data for this industry definition.
For the years where industry level data is available (from 1997), the data are bottom-up, that is derived at the industry level and aggregated subsequently. Aggregation of nominal variables is by simple addition. Aggregates of real variables are a share-weighted superlative index for changes, benchmarked in levels to 2010 nominal data. For market sector variables, data are backcast further using data from previous compilations of the Innovation Index (e.g. Goodridge, Haskel and Wallis, 2012), which were similarly aggregated from industry values but based on SIC03.
EUKLEMS also provides growth accounting data, but since we have expanded the amount of capital and changed value added we do our own growth accounting. For labour composition and hours worked we use the ONS Quality-adjusted labour input (QALI) data. We also use ONS data for industry Gross Value Added at current basic prices and the corresponding price and volume indices. Data on labour income, that is compensation of employees plus a proportion of mixed (self-employed) income, are from the ONS. Capital compensation is estimated residually as nominal gross value-added less total labour compensation. We shall of course amend capital compensation to incorporate compensation for intangible capital assets.
4.4 Labour services
The tangible capital variables are based on Oulton and Wallis (2014). Their estimates combine the latest ONS investment series and price deflators, which only go back to 1997, with historic series to estimate UK capital stock and capital services growth since the 1950s. The tangible capital data distinguishes four asset types, which are: buildings, computer hardware, (non-computer) plant & machinery, and vehicles. We excluded dwellings (they are not capital for firm productivity analysis). We also incorporate appropriate tax adjustment factors for all assets, tangible and intangible, based on Wallis (2012).
The labour services data are for 1993-2011 and are based on ONS person-hours by industry. The ONS use these data along with LFS microdata to estimate composition-adjusted person hours, where the adjustment uses wage bill shares for composition groups for age, education and gender. Person hours are annual person-hours, with persons including the employed, self-employed and those with two jobs. Data are grossed up using population weights. The market sector series is aggregated from industry data using industry shares of labour compensation. Since the data begin in 1993, we backcast our labour input data using EUKLEMS.
4.5 Labour and capital shares
The Compensation of Employees (COE) data are consistent with the labour services data. Mixed income is allocated to labour and capital according to the ratio of labour payments to MGVA excluding mixed income, as used in the ONS publication of QALI. Gross operating surplus (GOS) is always computed as MGVA less COE so that GOS +COE =MGVA by construction.
4.6 Details of measurement of intangible Assets
CHS (2006) distinguish three classes of intangible assets:
- computerised information; software and databases
- innovative property; (scientific & non-scientific) R&D, design (including architectural and engineering design), product development in the financial industry, exploration of minerals and production of artistic originals.
- economic competencies. firm investment in reputation, human and organisational capital.
Our intangible data update industry-level data reported in Gill and Haskel (2008). Own account investment is allocated to the industry wherein the investment is carried out. Purchased is allocated to industries via the input output tables. Particular industry categories (e.g. product development in finance, exploration of minerals, copyright) are allocated to that industry.
4.6.1 Computerised information
Computerised information comprises computer software, both purchased and own-account, and computerized databases. This category is already capitalised and thus we use these data, by industry, as described by Chesson and Chamberlin (2006). Purchased software data are based on company investment surveys and own-account based on the wage bill of employees in computer software occupations, adjusted downwards for the fraction of time spent on creating new software (as opposed to, say routine maintenance) and then upwards for associated overhead costs (a method we use for design below).
4.6.2 Innovative property
For business Scientific R&D we use expenditure data by industry derived from the Business Enterprise R&D survey (BERD). To avoid double counting of R&D and software investment, we subtract R&D spending in “computer and related activities" (SIC 62) from R&D spending since this is already included in the software investment data. Since BERD also includes physical capital investments we convert those investments into a capital compensation term, using the resulting physical capital stocks for the R&D sector and the user cost relation . The BERD breakdown also includes R&D performed in the R&D services industry. We allocate that spend out to purchasing industries using information from the IO tables.
4.6.3 Economic competencies
Like computerised information, mineral exploration, and production of artistic originals (copyright for short) are already capitalised in National Accounts. Data for mineral exploration here are simply data for Gross Fixed Capital Formation (GFCF) from the ONS, valued at cost (ONS National Accounts, 2008) and explicitly not included in R&D. Data for copyright are new estimates recently included in the national accounts, based on our own estimates produced with the co-operation of ONS and the Intellectual Property Office. The production of artistic originals covers, “original films, sound recordings, manuscripts, tapes etc, on which musical and drama performances, TV and radio programmes, and literary and artistic output are recorded."
The measurement methodology for New product development costs in the financial industry follows that of own account software above (and therefore replaces the CHS assumption of 20 per cent of intermediate consumption by the financial services industry). This new method reduces this category substantially. Further details are in Haskel and Pesole (2009) but a brief outline is as follows. First, we interviewed a number of financial firms to try to identify the job titles of workers who were responsible for product development. Second, we compared these titles with the available occupational and wage data from the Annual Survey on Hours and Earnings (ASHE). The occupational classification most aligned with the job titles was 'economists, statisticians and researchers'. Third, we asked our interviewees how much time was spent by these occupations on developing new products that would last more than a year. Some firms based their estimates on time sheets that staff filled out. Fourth, we asked firms about the associated overhead costs with such workers. Armed with these estimates, we went to the occupational data in the ASHE and derived a time series of earnings for those particular occupations in financial intermediation. Own-account investment in product development is therefore the wage bill, times a mark-up for other costs (capital, overheads etc.), times the fraction of time those occupations spend on building long-term projects. All this comes to around 0.52% of gross output in 2005 (note that reported R&D in BERD is 0.01% of gross output).
For new architectural and engineering design we again updated the CHS method (that used output of the design industry). To measure better such spending, we used the software method for own-account, and purchased data, by industry, are taken from the supply-use tables, see details in Galindo-Rueda et al (2011). Our estimates for purchased design as contained in this report exclude purchases of design by the industry itself (‘Professional, Scientific and Technical Services', SIC69t74), since some of these purchases will certainly include outsourcing and subcontracting arrangements which would be double-counting. The choice of occupations and the time allocation are, as in financial services, taken from interviews with a number of design firms. Interestingly, almost all of the design firms we interviewed have time sheets for their employees which break out their time into administration, design and client interaction/pitching for new business (almost all firms target, for example, that junior designers spend little time on administration and senior more time on pitching). Finally, R&D in social sciences and humanities is estimated as twice the turnover of SIC72.2 "Research and experimental development on social sciences and humanities", where the doubling is assumed to capture own-account spending. This is a small number.
Advertising expenditure and market research is estimated from the IO Tables by summing intermediate consumption on “Advertising and market research services” (product group 73) for each industry. We again exclude purchases of services by the industry itself ('Professional, Scientific and Technical Services', SIC69t74), since some of these purchases will include outsourcing and subcontracting arrangements which would be double-counting. These estimates are then separated into their respective components using data from the Annual Business Survey (ABS) and the Annual Business Inquiry (ABI) for preceding years. Estimates for market research are then doubled to capture own-account spend.
Firm-specific human capital, that is training provided by firms, was estimated as follows. Whilst there are a number of surveys (such as the Labour Force Survey) who ask binary questions (such as whether the worker received training around the Census date), to the best of our knowledge there is only one survey on company training spending, namely the National Employer Skills Survey (NESS), from which we use the microdata stored at the UK Data Archive available for 2007 and 2009. We also have aggregate expenditure data published by the UK Commission for Employment and Skills (UKCES) for 2005 and 2011, as well as for 1988 (from an unpublished paper kindly supplied by John Barber). The key feature of the survey, like the US Survey of Employer-provided Training (SEPT) used in CHS, is that it asks for direct employer spending on training (e.g. in house training centres, courses bought in etc.) and indirect costs via the opportunity cost of the employee's time whilst spend training and therefore not in current production. This opportunity cost turns out to be about equal to the former.
One question is whether all such surveyed training creates a lasting asset or is some of it short-lived. We lack detailed knowledge on this, but the NESS does ask what proportion of training spend is on Health and Safety or Induction Training. In the past we have subtracted spending on Health and Safety training, which was around 10% of total spend. These data have a component for both Health and Safety and Induction training, and we note that in the production industries this is between 30 and 40 per cent of the total. Since it seems reasonable that Health and Safety training may have more impact on firm productivity in the production industries compared to say Business Services, and that Induction training in production may be more likely to include training on job-specific skills, we decided to include this component for production but exclude it in the service sector. Whilst this subtraction lowers the level of training spending, it turns out to have little impact on the contribution of training to growth . A second question is the extent to which such training financed by the firm might be incident on the worker, in the sense of reducing worker pay relative to what it might have been without training, unobserved by the data gatherer. O'Mahony and Peng (2010) use the fraction of time that training is reported to be outside working hours, arguing that such a fraction is borne by the worker. Our data is all for training in working hours.
Finally, our data on investment in organisational structure relies on purchased management consulting and own-account time-spend. On purchased, we have consulted the Management Consultancy Association (MCA), who provide a series that covers around 70% of the industry. We therefore apply an adjustment to account for the rest of the industry, and apportion total purchases to industries according to shares of purchases of product 70 (services of head offices; management consulting services) as recorded in the IO tables. On own-account, we estimate investment as 20% of managerial wages, where managers are defined via occupational definitions. We test the robustness of the 20% figure below.
4.7 Prices and depreciation
Rates of depreciation and the prices of intangible assets are less well established. The R&D literature appears to have settled on a depreciation rate of around 15-20%, and OECD recommend 33% for software. Solovechik (2010) has a range of 5% to 30% for artistic originals, depending on the particular asset in question. To shed light on this and the deprecation of other assets, in our intangible assets survey we asked for life lengths for various intangibles (Awano, Franklin, Haskel and Kastrinaki, 2009). The responses we obtained were close to the assumed depreciation rates in CHS, depending on the assumptions one makes about declining balance depreciation. Thus we use 33% for software, 60% for advertising and market research, 40% for training and organisational investments, and 20% for R&D. Once again, we shall explore the robustness of our results to depreciation, but note in passing that our assets are assumed to depreciate very fast and so are not very sensitive to deprecation rates, unless one assumes much slower rates, in which case intangibles are even more important than suggested here.
On prices, in past work we have made extensive use of the implied GDP deflator. The price of intangibles is an area where very little is known, aside from some very exploratory work by the BEA and Corrado, Goodridge and Haskel (2011). These papers attempt to derive price deflators for knowledge from the price behaviour of knowledge intensive industries and the productivity of knowledge producing industries. Two observations suggest that using the GDP deflator overstates the price deflator for knowledge, and so understates the impact of knowledge on the economy. First, many knowledge-intensive prices have been falling relative to GDP. Second, the advent of the internet and computers would seem to be a potential large rise in the capability of innovators to innovate, which would again suggest a lowering of the price of knowledge, in contrast to the rise in prices implied by the GDP deflator. Thus use of the GDP deflator could understate the importance of intangible assets.
Therefore in this work we have made use of new price data and which we believe is an improvement on past compilations of the Innovation Index. The asset price deflators for software, mineral exploration and artistic originals are the ONS deflators used in the VICS system (own-account and purchased) . For R&D, an official UK deflator for R&D is not yet developed so we use the US index developed by the BEA. For other intangibles we make use of the experimental set of Services Producer Price Indices (SPPIs) produced by the ONS.
4.8 Relation of intangible approach to other approaches
Specifically, for architectural and engineering design we use the SPPI for the related industry, "Technical testing and analysis", for advertising we use the SPPI for "Advertising Placement", for market research we use the SPPI for “Market Research", for organisational capital we use the SPPI for “Business and Management Services”, and for training we use the SPPI for “Adult Education”. These deflators typically rise less quickly than an implied GDP deflator. However, they typically only extend back to the mid-2000s and so only effect the measurement of real investment and capital services in later years. Data for earlier years remain based on the implied value-added deflator. The only remaining assets for which we do not have a specific deflator are financial product innovation and non-scientific R&D, and we deflate each with the implied UK value-added deflator.
Haskel et al (2009, 2010) discusses how this work relates to the definition of innovation and the Frascati and Oslo manuals. It is clearly consistent with the work on IT and economic growth, see, for example, Jorgenson, Ho and Stiroh (2007), the capitalisation of software and the forthcoming capitalisation of R&D in national accounts, both of which are part of the process of recognizing spending on intangibles as building a (knowledge) capital stock. Van Ark and Hulten (2007) point out that with an expanded view of capital following the CHS argument innovation “...would appear in several forms in the sources of growth framework: through the explicit breakout of IT capital formation, through the addition of intangible capital to both the input and output sides of the source of growth equation, through the inclusion of human capital formation in the form of changes in labor “quality,” and through the “multifactor productivity” (MFP) residual” For shorthand, we refer to the “innovation” contribution as the sum of the intangible contribution, TFP and labour composition, but take no stand on this: we provide other components for the reader.
4.9 Accuracy of intangible measures
The following points are worth making. First, data on minerals, copyright, software and R&D are taken from official sources. Second, data on workplace training are taken from successive waves of an official government survey, weighted using ONS sampling weights. Once again one might worry that such data are subject to biases and the like but this does look like the best source currently available.
Third, data on design, finance and investment in organisational capital are calculated using the software method for own-account spending, but the IO tables for bought-in spend in the case of design. The use of the IO tables at least ensures the bought in data are consistent with the Blue Book. The use of the own account software method means that we have to identify the occupations who undertake knowledge investment, the time fraction they spend on it and additional overhead costs in doing so. For design and financial services we have followed the software method by undertaking interviews with firms to try to obtain data on these measures. Such interviews are of course just a start but our estimates are based then on these data points. For own-account organisational change we use an assumed fraction of time spent (20%) by managers on organisational development. We have been unable to improve on this estimate in interviews and so this remains a subject for future work: below we test for robustness to this assumption.
To examine all further, we undertook two further studies. First, we used survey data kindly supplied by Stephen Roper and described in detail in Barnett (2009). These data ask around 1,500 firms about their spending on software, branding, R&D, design and organisational capital. The firms are sampled from service and hi-tech manufacturing industries. Comparison of the proportions of spend on the intangible assets with those proportions in our manufacturing and business (professional & administrative) services gives similar answers.
Second, we have undertaken two waves of our own survey of firms. The results of the first survey are fully documented in Awano et al (2009). In terms of the spending numbers here, that micro study found spending on R&D, software, marketing and training to be in line with the macro-based numbers in this report. However, the implied spending on design and organisational capital were very much lower in the survey. This again suggests that these investment data require further work.
5 Results
5.1 Market sector investment over time: tangible and intangible
Figure 1 presents market sector nominal total tangible and intangible investment data. Since 2001, intangible investment has exceeded tangible. The 2008 recession is marked with a vertical line. Note that during and after the recession, intangible investment fell by less than tangible investment. In 2008-09 tangible investment fell sharply whilst although intangible investment does fall it is nowhere near as steeply. Part of the effect in the case of tangibles may be due to the sharp increase that took place from around 2005, part of which may have been an 'Olympic effect' from associated infrastructure investment. However, depreciation rates for intangible assets are significantly faster than those for tangibles. Thus a relatively small slowdown in intangible investment turns out to generate a similar fall in capital stock as a steep fall in tangible spend, so the changes in resulting capital services are similar. Since the recession, the profile of intangible investment is relatively flat.
Figure 1: Market sector tangible and intangible investment, £bn, 1990-2011
Intangible and Tangible Investment
(Chart showing Intangible Investment and Tangible Investment trends from 1990-2010 in £bn, with a shaded recession period)
Source: ONS data for tangibles, this paper for intangibles. All data in current prices
Table 2 shows investment by intangible asset for 1990, 1995, 2000, 2005, 2010 and 2011 with tangible investment also included for comparison. The intangible categories with the highest investment figures are organisational capital, training and software, with each category making up around 20% of intangible investment in 2011. At around £25bn, investment in each of these three asset categories is almost as high as total investment in plant and machinery, and each is around 4 times higher than investment in IT hardware. For information we also report MGVA excluding intangibles, with national accounts intangibles and with all CHS intangibles.
| Asset |
1990 |
1995 |
2000 |
2005 |
2010 |
2011 |
| Purchased Software |
2.5 |
5.2 |
7.3 |
10.4 |
10.4 |
11.0 |
| Own-Account Software |
4.8 |
5.8 |
9.9 |
11.9 |
12.9 |
13.2 |
| Total Software |
7.3 |
11.0 |
17.2 |
22.3 |
23.4 |
24.3 |
| R&D |
7.3 |
8.3 |
10.7 |
12.7 |
14.8 |
15.9 |
| Design |
6.7 |
7.0 |
9.5 |
11.6 |
12.8 |
12.9 |
| Non-scientific R&D |
0.2 |
0.3 |
0.4 |
0.3 |
0.9 |
0.9 |
| Mineral Exploration |
1.6 |
1.1 |
0.5 |
0.7 |
0.6 |
0.8 |
| Financial Innovation |
0.3 |
0.4 |
0.7 |
0.9 |
1.6 |
1.8 |
| Artistic Originals |
1.9 |
3.0 |
4.9 |
7.0 |
5.7 |
5.8 |
| Total Innovative Property |
18.1 |
20.1 |
26.7 |
33.2 |
36.3 |
38.1 |
| Advertising |
3.8 |
5.5 |
8.6 |
8.8 |
10.3 |
10.3 |
| Market Research |
1.0 |
1.3 |
1.7 |
2.8 |
3.2 |
3.7 |
| Total Branding |
4.8 |
6.7 |
10.2 |
11.7 |
13.5 |
14.0 |
| Own-Account Organisational Capital |
5.0 |
10.0 |
14.7 |
19.7 |
22.8 |
20.7 |
| Purchased Organisational Capital |
0.8 |
1.7 |
3.3 |
6.0 |
4.3 |
4.8 |
| Total Organisational Capital |
5.9 |
11.7 |
18.1 |
25.7 |
27.0 |
25.5 |
| Training |
11.8 |
14.4 |
19.9 |
25.2 |
27.4 |
25.0 |
| Total Economic Competencies |
22.5 |
32.8 |
48.2 |
62.6 |
67.9 |
64.5 |
| TOTAL INTANGIBLES |
47.9 |
63.9 |
92.1 |
118.1 |
127.6 |
126.8 |
| Buildings |
27.0 |
22.1 |
38.0 |
52.8 |
44.9 |
47.4 |
| Plant & Machinery (excl IT) |
25.7 |
28.4 |
37.3 |
30.2 |
30.4 |
30.4 |
| Vehicles |
9.0 |
9.4 |
9.1 |
10.9 |
13.6 |
4.4 |
| IT Hardware |
5.1 |
6.6 |
9.4 |
6.3 |
5.4 |
5.6 |
| TOTAL TANGIBLES |
66.9 |
66.5 |
93.8 |
100.1 |
94.4 |
87.9 |
| MSGVA |
|
|
|
|
|
|
| without intangibles |
393.2 |
484.4 |
629.5 |
801.1 |
915.1 |
927.4 |
| with NA intangibles |
404.1 |
499.5 |
652.0 |
831.1 |
944.8 |
958.3 |
| with all CHS intangibles |
441.1 |
548.3 |
721.5 |
919.2 |
1042.7 |
1054.3 |
Note to table. Data are investment figures, in £bns, current prices: italicized data are sub-totals for broader asset definitions. MSGVA is presented with no intangibles capitalized; with only NA intangibles capitalized (software, mineral exploration and artistic originals); and with all CHS intangibles capitalized. Market Sector refers to sectors A to K, MN, R to U, thus excluding real estate. Source: ONS data for tangibles, this paper for intangibles.
Above it was pointed out that intangible and tangible investment have behaved differently since the recession. Table 2 also shows that within intangible investment, different assets have behaved differently. The following chart looks more closely at investment in the three broad categories of computerised information, innovative property and economic competencies, in the 2000s and since the recession.
Figure 2: Nominal Intangible Investment, by asset category, £bns, 2005-2011
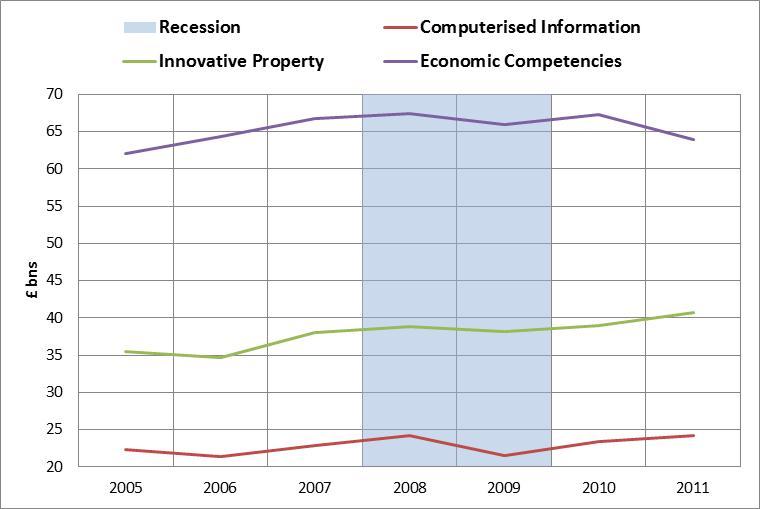
Note to figure: all data in current prices. Blue bars mark recession
The figure shows that in the depths of the recession in 2009, investment in all three categories fell. The fall was strongest in computerised information, which fell from £24.2bn in 2008, to £21.5bn in 2009. In the same years, investment in innovative property fell from £36.1bn to £35.5bn, and investment in economic competencies fell from £68bn to £66.3bn. As the chart shows, since the recession, investment in computerised information has risen, as has investment in innovative property, with the latter driven by growth in scientific R&D. Investment in economic competencies has however fallen, driven by declines in investment in organisational capital and workforce training.
In Figure 3 we report tangible and intangible investment as shares of MSGVA, where output has been adjusted for the capitalisation of all intangibles. There are three main points to note. First note the steady consistent decline in investment across all assets in market sector investment as a share of value-added, falling from approximately 26% in 2000 to 20% in 2011. Looking at data from before the recent recession, the aggregate share stood at 24% in 2007.
Second, within total investment, tangible investment as a share of MSGVA has fallen very sharply. After the recession in the early 1990s, tangible investment recovered to 14% of value-added in 1998, and then declined to 10-11% of MSGVA in the years 2003-07, and has since declined to 8% in 2011.
Figure 3: Market Sector tangible and intangible investment as a share of (adjusted) MSGVA, 1990-2011
Investment intensities
(Line graph showing "intan_GVA", "tan_GVA", and "totinv_GVA" as a share of Adjusted GVA from 1990-2010, with a shaded recession period)
Note to figure: MSGVA adjusted for a capitalisation of all CHS intangibles for all three series'. Intangible investment data also incorporates all CHS intangibles. The start of the recession in 2008 is marked with a vertical line.
Third, intangible investment as a share of value-added rose steadily throughout the 1990s, peaking at almost 14% in 2001. Over the 2000s however, the intangible investment share has been flat and has even declined slightly, so that it stands at 12% in 2011. It is worth noting that although the decline in tangible investment is somewhat compensated by the steady profile of intangible investments, assets in the latter category tend to have much higher depreciation rates than tangible investments, with implications for the level and growth of the UK market sector aggregate stock.
The 1990s and 2000s have also seen significant changes to the composition of tangible investment. Figure 4 presents the share of nominal tangible investment accounted for by each asset. Most tangible investment is made up of investments in buildings and plant & machinery. Having been quite similar in the late 1990s and early 2000s, from the mid-2000s the shares for each asset diverge, with a huge run-up in investment in buildings during the commercial property boom. Buildings went from 32% of tangible investment in 1996, to
57% in 2007. In contrast, the share of investment devoted to plant & machinery declined, from 43% of tangible investment in 1996, to 28% in 2006. During and after the financial crisis, the share of investment accounted for by buildings fell back to 48% in 2010, but has since risen and stood at 54% in 2011. Investments in vehicles has fallen sharply since the recession, falling from 14% of tangible investment in 2010 to just 5% in 2011.
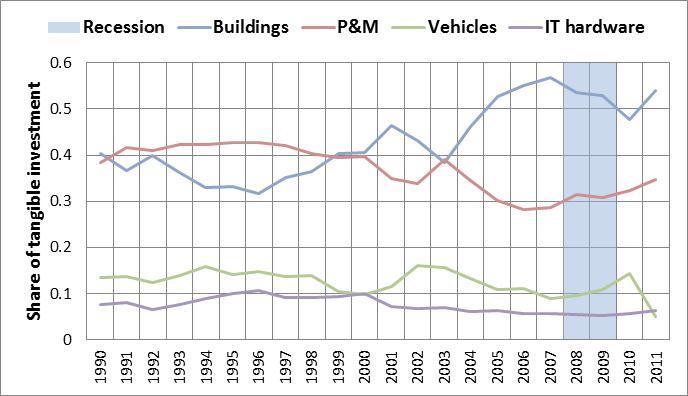
Note to figure: Share of total nominal tangible investment for each asset. Only tangible assets, therefore software excluded. Investment shares sum to 100%. Recession marked by blue bar. Source: ONS data
### 5.2 Industry intangible investment {: #section-5-2 }
Table 3 reports tangible and intangible investment by industry in 2011. In the UK market sector, the ratio of intangible to tangible investment is 1.4:1. Industries where the ratio is higher are, in the following order: financial services (5.1:1); manufacturing (3.1:1); information & communication (2.6:1); professional and administrative services (2.3:1); and construction (1.7:1). In particular, finance, manufacturing and information & communication all invest very strongly in intangibles relative to tangibles. It is interesting to note in passing that this raises important questions on how to classify manufacturing since it is undertaking a very good deal of intangible activity (manufacturing intangible investment is 17% of value added in 2011 for example).
Table 4 is based on the same data as that presented in Table 3 but presents a breakdown by both asset and industry for 2011. It shows the prevalence of R&D investment in manufacturing; design and training in construction; software, training and organisational investments in distribution; software and artistic originals in information & communication; software and organisational investments in finance; and training in professional & administrative services.
<div class="table-container" markdown="1">
| Year | Agriculture Mining and Utilities Tangible | Agriculture Mining and Utilities Intangible | Manufacturing Tangible | Manufacturing Intangible | Construction Tangible | Construction Intangible | Wholesale & Retail Trade; Accomodation & Food Service Activities Tangible | Wholesale & Retail Trade; Accomodation & Food Service Activities Intangible | Transportation and Storage Tangible | Transportation and Storage Intangible | Information and Communication Tangible | Information and Communication Intangible | Financial Services Tangible | Financial Services Intangible | Professional and Administrative Services Tangible | Professional and Administrative Services Intangible | Recreational and Personal Services Tangible | Recreational and Personal Services Intangible | Market Sector (A-K, MN & R-T) Tangible | Market Sector (A-K, MN & R-T) Intangible |
|:-----|:----------------------------------------|:------------------------------------------|:-----------------------|:-------------------------|:----------------------|:------------------------|:------------------------------------------------------------------------|:----------------------------------------------------------------------------|:--------------------------|:--------------------------|:-----------------------------|:-------------------------------|:------------------------|:--------------------------|:------------------------------------------|:--------------------------------------------|:----------------------------------|:------------------------------------|:----------------------------------------|:------------------------------------------|
| 1997 | 14.80 | 4.09 | 16.12 | 22.58 | 2.33 | 3.33 | 13.02 | 11.67 | 8.02 | 3.16 | 10.84 | 8.85 | 3.38 | 7.52 | 7.71 | 9.48 | 4.06 | 2.47 | 80.27 | 73.17 |
| 1998 | 16.43 | 4.02 | 15.85 | 24.25 | 2.19 | 3.51 | 15.31 | 13.12 | 7.85 | 3.16 | 12.17 | 10.15 | 5.42 | 8.34 | 11.53 | 10.73 | 4.34 | 2.77 | 91.09 | 80.07 |
| 1999 | 15.51 | 3.67 | 13.88 | 25.40 | 3.29 | 3.89 | 14.04 | 14.92 | 7.84 | 3.56 | 15.52 | 12.19 | 4.81 | 9.60 | 11.25 | 12.19 | 5.55 | 3.25 | 91.70 | 88.67 |
| 2000 | 13.32 | 3.52 | 13.68 | 25.38 | 4.17 | 4.09 | 14.73 | 14.91 | 9.50 | 3.55 | 16.65 | 13.40 | 4.70 | 10.84 | 11.65 | 12.96 | 5.42 | 3.41 | 93.82 | 92.06 |
| 2001 | 13.91 | 3.87 | 10.51 | 26.59 | 5.64 | 4.60 | 14.21 | 16.73 | 10.25 | 4.02 | 13.74 | 15.28 | 4.30 | 12.09 | 10.90 | 15.20 | 4.56 | 3.74 | 88.03 | 102.11 |
| 2002 | 15.15 | 4.02 | 9.44 | 26.70 | 6.98 | 5.00 | 14.75 | 17.62 | 14.83 | 4.21 | 10.69 | 16.36 | 4.48 | 12.27 | 11.41 | 15.56 | 4.28 | 3.98 | 92.01 | 105.71 |
| 2003 | 14.02 | 4.54 | 9.27 | 26.71 | 6.90 | 5.49 | 12.45 | 19.12 | 13.89 | 4.65 | 10.37 | 17.31 | 3.81 | 12.91 | 10.96 | 16.68 | 4.25 | 4.28 | 85.93 | 111.67 |
| 2004 | 12.78 | 4.35 | 9.32 | 26.97 | 4.27 | 5.85 | 21.03 | 19.62 | 12.94 | 4.54 | 9.11 | 18.94 | 3.83 | 12.42 | 10.76 | 16.79 | 8.53 | 4.53 | 92.56 | 114.03 |
| 2005 | 14.23 | 4.66 | 9.57 | 27.51 | 4.34 | 6.22 | 22.41 | 19.70 | 12.29 | 4.67 | 9.11 | 19.16 | 5.58 | 13.44 | 12.03 | 18.18 | 10.55 | 4.60 | 100.11 | 118.14 |
| 2006 | 16.90 | 4.69 | 8.78 | 27.41 | 4.91 | 6.75 | 22.51 | 20.32 | 13.51 | 4.91 | 8.06 | 18.01 | 5.41 | 13.46 | 13.36 | 18.15 | 8.81 | 4.90 | 102.24 | 118.61 |
| 2007 | 21.23 | 4.95 | 10.03 | 28.18 | 6.08 | 7.45 | 26.23 | 21.55 | 13.57 | 5.00 | 8.79 | 19.07 | 6.04 | 15.21 | 15.23 | 19.27 | 9.21 | 4.78 | 116.41 | 125.46 |
| 2008 | 20.84 | 4.71 | 10.80 | 29.10 | 5.76 | 7.56 | 23.33 | 22.15 | 14.74 | 5.39 | 8.38 | 19.50 | 5.79 | 15.34 | 13.15 | 19.45 | 8.99 | 5.11 | 111.79 | 128.31 |
| 2009 | 21.62 | 4.82 | 9.00 | 27.81 | 4.00 | 6.77 | 18.13 | 21.35 | 14.47 | 5.37 | 6.50 | 18.25 | 3.05 | 14.76 | 9.09 | 19.16 | 6.18 | 5.03 | 92.04 | 123.32 |
| 2010 | 21.09 | 5.15 | 9.27 | 28.48 | 4.04 | 6.76 | 18.33 | 21.95 | 16.31 | 5.62 | 6.73 | 18.64 | 3.09 | 15.99 | 9.46 | 19.71 | 6.04 | 5.28 | 94.35 | 127.60 |
| 2011 | 21.34 | 5.29 | 9.24 | 28.73 | 3.81 | 6.31 | 18.08 | 21.65 | 10.83 | 5.57 | 6.81 | 18.05 | 3.15 | 16.23 | 8.47 | 19.70 | 6.20 | 5.32 | 87.93 | 126.85 |
</div>
Source: authors' calculations using ONS data for tangibles and methods in this paper for intangibles.
<div class="table-container" markdown="1">
| Industry | Software (purchased & own-account) | Scientific R&D | Arch & Eng Design (purchased & own-account) | Artistic Originals | Mineral Exploration | Financial Product Innovation | Non-scientific R&D | Branding (Advertising and Market Research) | Training | Organisational Capital (purchased & own-account) |
|:----------------------------------------|:-----------------------------------|:---------------|:---------------------------------------------|:-------------------|:--------------------|:-----------------------------|:-------------------|:-------------------------------------------|:---------|:-------------------------------------------|
| Agriculture, Mining and Utilities | 1.4 | 0.5 | 0.7 | 0.0 | 0.8 | 0.0 | 0.0 | 0.5 | 1.0 | 0.5 |
| Manufacturing | 3.7 | 13.2 | 3.2 | 0.0 | 0.0 | 0.0 | 0.0 | 2.3 | 3.1 | 3.3 |
| Construction | 0.4 | 0.1 | 1.8 | 0.0 | 0.0 | 0.0 | 0.0 | 0.3 | 2.2 | 1.5 |
| Wholesale and Retail Trade, Accomodation and Food | 4.2 | 0.3 | 1.7 | 0.0 | 0.0 | 0.0 | 0.0 | 2.9 | 7.0 | 5.6 |
| Transportation and Storage | 1.1 | 0.1 | 0.7 | 0.0 | 0.0 | 0.0 | 0.0 | 1.3 | 1.3 | 1.0 |
| Information and Communication | 4.7 | 1.1 | 1.5 | 5.3 | 0.0 | 0.0 | 0.0 | 2.2 | 1.3 | 2.0 |
| Financial Services | 3.7 | 0.1 | 1.1 | 0.0 | 0.0 | 1.8 | 0.0 | 3.1 | 0.7 | 5.7 |
| Professional and Administrative Services | 3.9 | 0.6 | 1.7 | 0.0 | 0.0 | 0.0 | 0.9 | 0.9 | 6.6 | 5.0 |
| Recreational and Personal Services | 1.0 | 0.0 | 0.4 | 0.6 | 0.0 | 0.0 | 0.0 | 0.5 | 2.0 | 0.8 |
</div>
Source: authors' calculations.
Figure 5 shows the ratios of total investment in all intangible categories to industry value added (where industry value added equals conventional value added plus additional intangible investment not officially capitalised). Note the consistently very high level in information and communication, and also the initial very high level in financial services due to the software boom in the late 1990s, especially in the run up to Y2K. Since then, information & communication and manufacturing are the most intangible investment intensive, at 19% and 17% of industry-value-added respectively in 2011.
<div class="chart-description" markdown="1">**Figure 5: Ratio of investment to (adjusted) value-added ratios, by industry (1997-2011)**
Line graph showing Total intangible investment as a share of VA, % from 1995-2010 for various industries (Ag, Mining, Util; Constr'n; T'port; Fin Svcs; Rec/Pers Svcs; Mfring; Retail, Food; Info & Comm; Prof/Admin Svcs).
</div>
Note to figure: Industry value-added has been adjusted to account for the capitalisation of intangible assets
Which particular intangible assets are most important in which industries? Table 5 shows the asset share of total intangible spending by industry (in 2011, the shares are very stable over time). Starting with manufacturing, the largest share of all intangible spending is innovative property (57%), with software 13%. Innovative property is also important in information & communication, where it accounts for 43% of intangible spending, and software 26%. Note that innovative property in this industry includes the creation of new artistic originals in film, television, music, literary and miscellaneous works. Compare with professional & administrative services, where innovative property accounts for only 16% whereas “ecom" (training, branding and organization building) accounts for 64%, whilst software is 20%.
Similarly, in trade & accommodation, software and, in particular, economic competencies are much more important than innovative property.
To shed light on the importance of non-R&D spend outside manufacturing, the lower panel sets out some detail on selected individual measures. As the top line shows, R&D accounts, in manufacturing, for 46% of all intangible spend, but a trivial amount in all services with the exception of information & communications. Training, line 2, accounts for 11% in manufacturing, 32% in distribution & food, and 4% in finance, but 33% in professional & administrative services. Investment in organisational capital, line 3, is 11% in manufacturing, 26% in distribution and a considerable 35% in finance. Finally, branding is almost twice as important in distribution and finance as in manufacturing. Thus we can conclude that the “non-R&D" intangible spend, outside manufacturing, is mostly due to software, training, organisational capital and branding.
<div class="table-container" markdown="1">
| Shares | AgMinUtil | Mfr | Constr | RtAcc | Tran | InfoCom | FinSvc | ProfAdmin | PersSvc |
|:-------|:----------|:----|:-------|:------|:-----|:--------|:-------|:----------|:--------|
| soft | 0.27 | 0.13 | 0.06 | 0.19 | 0.21 | 0.26 | 0.23 | 0.20 | 0.19 |
| innop | 0.37 | 0.57 | 0.29 | 0.09 | 0.14 | 0.43 | 0.19 | 0.16 | 0.20 |
| ecom | 0.36 | 0.30 | 0.65 | 0.71 | 0.66 | 0.31 | 0.58 | 0.64 | 0.61 |
| | 100% | 100% | 100% | 100% | 100% | 100% | 100% | 100% | 100% |
| **Individual Assets:** | | | | | | | | | |
| R&D | 0.09 | 0.46 | 0.01 | 0.01 | 0.01 | 0.06 | 0.00 | 0.03 | 0.00 |
| Training | 0.18 | 0.11 | 0.35 | 0.32 | 0.23 | 0.07 | 0.04 | 0.33 | 0.37 |
| Organisational | 0.09 | 0.11 | 0.25 | 0.26 | 0.18 | 0.11 | 0.35 | 0.26 | 0.14 |
| Branding | 0.09 | 0.08 | 0.05 | 0.13 | 0.24 | 0.12 | 0.19 | 0.05 | 0.10 |
</div>
Notes to table: “Soft” is Software; “ecom” is economic competencies; “innop” is Innovative Property. Where: economic competencies are advertising & market research, training and organisational investment and innovative property is R&D, mineral exploration and copyright creation, design, financial product development and social science research. All data are shares of total investment: upper panel sums to 100% since categories are exhaustive, lower panel shows a sample of individual assets that are part of the asset groups in the upper panel.
## 6 Growth accounting results: market sector {: #section-6 }
### 6.1 Growth accounting results for the market economy {: #section-6-1 }
Our growth accounting results are set out in Table 6 (Panel 1). Consider Table 6 which reads as follows. The first column is labour productivity growth in per hour terms. Column 2 is the contribution of labour services per hour, namely growth in labour services per hour (i.e. labour composition) times the share of labour in MGVA. Column 3 is growth in computer capital services times the share of payments for computer services in MGVA. Column 4 is growth in other tangible capital services (buildings, plant, vehicles) times share in MGVA. Column 5 is growth in intangible capital services times share in MGVA. Column 6 is growth in TFP, namely column 1 minus the sum of columns 2 to 5. Column 7 is the share of labour payments in MGVA. Columns 8 to 11 are the shares of particular contributions, shown in the table heading, to form alternative versions of the 'innovation index'.
Consider first the top panel of data, which reports the contributions to growth in a framework that does not include intangibles. LPG steadily declined over the first three periods (1990 to 2005) before collapsing in the final period (2005 to 2011).[^23] The contribution of labour quality, column 2, rose in the late 1990s, before falling back in the early 2000s. However, the latest period shows a dramatic rise in the contribution of labour composition, to 0.56% pa in 2005-11. As noted in Franklin and Mistry (2013), labour composition has improved quite dramatically since the recession, with firms upskilling, that is increasing the hours of their more skilled and/or experienced workers, and reducing the hours of the less skilled/experienced. In particular, there has been strong growth in the hours worked, and the share of hours worked, by workers with higher education qualifications over the period 2007 to 2012. At the same time, hours worked by workers with low levels of education has fallen (Franklin and Mistry, 2013).[^24] Since it is education that predominantly drives the QALI data, labour composition has risen strongly.
Computer capital input grew quickly in the late 1990s, but fell in the 2000s, and more so in the late 2000s so that it stood at just 0.04% pa in 2005-11. The opposite profile occurs for other tangibles (buildings, plant and vehicles). That contribution declined in the late 1990s, then rose in the early 2000s and again in the late 2000s, contributing 0.94% pa of LPG in the latter period, almost double growth in labour productivity itself.[^25] Overall, the total contribution of tangible capital fell in the 1990s (1.27% pa in 1990-95 and 1.06 % pa in 1995-2000), and fell further to 0.94% pa in 2000-05 and 0.97% pa in 2005-11. Thus the overall TFP record was one of strong growth in the early 1990s (2.01% pa), falling back in the late 1990s (1.81% pa) and again in the early 2000s (1.72% pa), and a strong decline in TFP in the late 2000s (-0.97% pa), largely due to the collapse in TFP during and since the recent recession.
Consider now the second set of results in panel 1, where we include intangibles officially capitalized in the SNA, namely software, mineral exploration, and artistic originals, where software is by far the biggest category. Their inclusion reduces output growth in the 1990s and early 2000s, and has virtually no impact in the late 2000s. Other contributions are also changed due to the changes in factor and asset income shares, and TFP growth is lowered substantially for all except the most recent period, where it is increased.
The third set of results in panel 1 add in R&D as a capitalized asset, and thus provides a guide as to the impact of the upcoming capitalisation of R&D on the UK productivity picture. As we have previously argued, scientific R&D is actually a small component of the total investment in knowledge undertaken by firms. Therefore the impact of capitalizing R&D is small, adding between -0.04 to +0.02% p.a. to labour productivity growth depending on the period considered. Capitalising R&D also raises the contribution of intangibles, by 0.01 to 0.07% pa, and reduces TFP by similar absolute amounts. We note that here scientific R&D is deflated using the price index developed by the US BEA. Deflating R&D with a UK value-added price index, as we have done in previous work, means that R&D has slightly less impact on measures of output, input and TFP.
The fourth set of results are for a decomposition that incorporates all intangibles identified by CHS. Relative to the national accounts model, their inclusion raises output growth in the 1990s and the early 2000s, especially the late 1990s, but reduces it in the late 2000s. The reason is that real intangible investment grew at a faster rate than measured output in the earlier periods, but at a slower rate than measured output in the more recent period. The contribution of labour quality, column 2, falls due to the fall in the labour share, since we have expanded the amount of measured capital. The contribution of tangible capital, columns 3 and 4, also falls as the inclusion of intangibles alters the factor income shares of these inputs. In column 5 we see the contribution of the intangible inputs; stronger in the 1990s and early 2000s, but very low in 2005 to 2011, a period of very weak output growth and even weaker growth in real intangible investment. Thus the overall TFPG record in column 6 is strong growth in the early 1990s, weakening somewhat in the late 1990s and early 2000s, followed by strong decline in the late 2000s.
<div class="table-container" markdown="1">
| Year | DinV/H | s Din(L/H) | s Din(K/H) cmp | s Din (K/H) othtan | s Din(K/H) intan | Din TFP | Memo: SLAB | InnIndex1 (6/1) | InnIndex2 (5+6)/1 | InnIndex3 (2+5+6)/1 | InnIndex4 (5+6) |
|:-----|:-------|:-----------|:---------------|:-------------------|:-----------------|:--------|:-----------|:----------------|:------------------|:--------------------|:----------------|
| **1) Baseline Results: With and without intangibles** | | | | | | | | | | | |
| **Without all intangibles** | | | | | | | | | | | |
| 1990-95 | 3.43% | 0.16% | 0.23% | 1.04% | | 2.01% | 0.66 | 0.58 | 0.58 | 0.63 | 2.01% |
| 1995-00 | 3.16% | 0.29% | 0.42% | 0.64% | | 1.81% | 0.65 | 0.57 | 0.57 | 0.66 | 1.81% |
| 2000-05 | 2.85% | 0.19% | 0.14% | 0.80% | | 1.72% | 0.69 | 0.60 | 0.60 | 0.67 | 1.72% |
| 2005-11 | 0.56% | 0.56% | 0.04% | 0.93% | | -0.97% | 0.67 | -1.74 | -1.74 | -0.73 | -0.97% |
| **With National Accounts Intangibles: software, mineral exploration and artistic originals** | | | | | | | | | | | |
| 1990-95 | 3.16% | 0.15% | 0.23% | 1.02% | 0.22% | 1.55% | 0.64 | 0.49 | 0.56 | 0.61 | 1.76% |
| 1995-00 | 2.74% | 0.28% | 0.40% | 0.62% | 0.26% | 1.18% | 0.63 | 0.43 | 0.52 | 0.63 | 1.44% |
| 2000-05 | 2.48% | 0.18% | 0.13% | 0.76% | 0.33% | 1.08% | 0.66 | 0.44 | 0.57 | 0.64 | 1.41% |
| 2005-11 | 0.57% | 0.54% | 0.03% | 0.86% | 0.03% | -0.89% | 0.65 | -1.56 | -1.50 | -0.56 | -0.86% |
| **With National Accounts Intangibles plus R&D** | | | | | | | | | | | |
| 1990-95 | 3.12% | 0.15% | 0.22% | 1.00% | 0.29% | 1.47% | 0.63 | 0.47 | 0.56 | 0.61 | 1.75% |
| 1995-00 | 2.73% | 0.28% | 0.40% | 0.61% | 0.27% | 1.18% | 0.62 | 0.43 | 0.53 | 0.63 | 1.45% |
| 2000-05 | 2.48% | 0.18% | 0.13% | 0.74% | 0.37% | 1.07% | 0.65 | 0.43 | 0.58 | 0.65 | 1.43% |
| 2005-11 | 0.59% | 0.53% | 0.03% | 0.83% | 0.08% | -0.88% | 0.64 | -1.48 | -1.36 | -0.46 | -0.81% |
| **With All CHS Intangibles** | | | | | | | | | | | |
| 1990-95 | 3.26% | 0.14% | 0.21% | 0.95% | 0.68% | 1.29% | 0.59 | 0.39 | 0.60 | 0.65 | 1.97% |
| 1995-00 | 2.89% | 0.26% | 0.36% | 0.55% | 0.63% | 1.08% | 0.57 | 0.37 | 0.59 | 0.68 | 1.72% |
| 2000-05 | 2.51% | 0.16% | 0.12% | 0.65% | 0.65% | 0.93% | 0.60 | 0.37 | 0.63 | 0.69 | 1.57% |
| 2005-11 | 0.40% | 0.49% | 0.03% | 0.72% | 0.05% | -0.90% | 0.59 | -2.25 | -2.12 | -0.89 | -0.84% |
| **2) Altering Depreciation rates** | | | | | | | | | | | |
| **With All CHS Intangibles: Halve intangible depreciation rates** | | | | | | | | | | | |
| 1990-95 | 3.26% | 0.14% | 0.21% | 1.00% | 0.67% | 1.24% | 0.59 | 0.38 | 0.59 | 0.63 | 1.91% |
| 1995-00 | 2.89% | 0.26% | 0.37% | 0.56% | 0.63% | 1.08% | 0.57 | 0.37 | 0.59 | 0.68 | 1.71% |
| 2000-05 | 2.51% | 0.16% | 0.12% | 0.65% | 0.74% | 0.84% | 0.60 | 0.33 | 0.63 | 0.69 | 1.57% |
| 2005-11 | 0.40% | 0.49% | 0.03% | 0.69% | 0.29% | -1.10% | 0.59 | -2.77 | -2.04 | -0.81 | -0.81% |
| **With All CHS Intangibles: Double intangible depreciation rates** | | | | | | | | | | | |
| 1990-95 | 3.26% | 0.14% | 0.21% | 0.91% | 0.65% | 1.35% | 0.59 | 0.42 | 0.61 | 0.66 | 2.00% |
| 1995-00 | 2.89% | 0.26% | 0.36% | 0.55% | 0.64% | 1.09% | 0.57 | 0.38 | 0.60 | 0.68 | 1.72% |
| 2000-05 | 2.51% | 0.16% | 0.12% | 0.66% | 0.56% | 1.00% | 0.60 | 0.40 | 0.63 | 0.69 | 1.57% |
| 2005-11 | 0.40% | 0.49% | 0.03% | 0.75% | -0.10% | -0.78% | 0.59 | -1.95 | -2.20 | -0.97 | -0.88% |
| **3) Excluding 75% of Organisational own-account** | | | | | | | | | | | |
| **With All CHS Intangibles: Conversion factor for own-account organisational capital = 0.25** | | | | | | | | | | | |
| 1990-95 | 3.16% | 0.14% | 0.21% | 0.95% | 0.56% | 1.30% | 0.59 | 0.41 | 0.59 | 0.63 | 1.85% |
| 1995-00 | 2.85% | 0.26% | 0.37% | 0.56% | 0.55% | 1.11% | 0.58 | 0.39 | 0.58 | 0.67 | 1.66% |
| 2000-05 | 2.48% | 0.16% | 0.12% | 0.67% | 0.57% | 0.96% | 0.61 | 0.39 | 0.62 | 0.68 | 1.53% |
| 2005-11 | 0.43% | 0.50% | 0.03% | 0.74% | 0.04% | -0.88% | 0.60 | -2.04 | -1.95 | -0.79 | -0.84% |
| **4) Without Tax adjustment factors for tangible and intangible capital** | | | | | | | | | | | |
| **With All CHS Intangibles: TAF=1** | | | | | | | | | | | |
| 1990-95 | 3.26% | 0.14% | 0.19% | 0.93% | 0.70% | 1.29% | 0.59 | 0.40 | 0.61 | 0.65 | 1.99% |
| 1995-00 | 2.89% | 0.26% | 0.34% | 0.55% | 0.65% | 1.09% | 0.57 | 0.38 | 0.60 | 0.69 | 1.75% |
| 2000-05 | 2.51% | 0.16% | 0.11% | 0.64% | 0.66% | 0.93% | 0.60 | 0.37 | 0.63 | 0.70 | 1.59% |
| 2005-11 | 0.40% | 0.49% | 0.03% | 0.69% | 0.06% | -0.87% | 0.59 | -2.18 | -2.03 | -0.80 | -0.81% |
</div>
Notes to table. Data are average growth rates per year for intervals shown, calculated as changes in natural logs. Contributions are Tornqvist indices. First column is labour productivity growth in per hour terms. Column 2 is the contribution of labour services per hour, namely growth in labour services per hour times share of labour in MGVA. Column 3 is growth in computer capital services times share in MGVA. Column 4 is growth in other tangible capital services (buildings, plant, vehicles) times share in MGVA. Column 5 is growth in intangible capital services times share in MGVA. Column 6 is TFP, namely column 1 minus the sum of columns 2 to 5. Column 7 is the share of labour payments in MGVA. Columns 8-11 are alternative version of the innovation index
Our Innovation Index is shown in columns 8 to 11. Columns 8 to 10 set out the shares of LPG of various components and column 11 presents the total contribution of private intangible capital and TFP combined. What are the main findings? First, the inclusion of all other CHS intangibles lowers TFPG as a share of LPG. Consider column 8 in the upper panel. TFPG as a share of LPG is over 19 percentage points less with intangibles compared to without intangibles. Second, the contribution of the “knowledge economy” to LPG is very significant, whether measured as column 9 or 10. Looking at column 9 of the lower panel, TFPG and intangible capital deepening are between 59-63% of LPG in the 1990s and early 2000s. Column 10 adds the contribution of labour quality taking the figure to around 65-69% in the 1990s and early 2000s.
In the late 2000s, the large negative contribution from TFP makes the Innovation Index more difficult to interpret. In that period, the large negative contribution from TFP and only a small positive contribution from intangible capital deepening results in a negative contribution from innovation, which is far larger in absolute terms than LPG. For that period then, consider columns 2 and 5 which present the contributions of labour quality and intangible capital deepening. The data show that in the latest period, the contribution of intangibles fell, but the contribution of labour composition rose, suggesting overall a lowering of the contribution of innovation in the UK market sector.
### 6.2 Measurement of growth {: #section-6-2 }
Before going on to discuss some robustness checks on our growth-accounting, it is worth saying a little more on the measurement of growth. As Table 6 shows, whether or not intangibles are capitalised can have a significant impact on measured growth in output and labour productivity. In particular, relative to the national accounts, including the additional CHS intangibles raises output growth in the 1990s and early 2000s and reduces it in the late 2000s. To explain why this is so, consider two measures of output: V (as measured in the national accounts); and Q where all additional CHS intangibles are capitalised.
V_t = AF(L_t, K_t)
Q_t = AF(L_t, K_t, R_t)
V = C + I
Q = C + I + N
(7)
Measured output (V) is thus a function of services from labour (L) and measured capital (K)[^26] with the technological shift parameter, A. In a model where all intangibles are capitalised, adjusted output (Q) is a function of services from labour, measured capital and additional intangible capital (R).

Measured output is the sum of final consumption expenditure (C) and measured investment (I). Adjusted output includes additional intangible investment (N). Therefore we can write the relation between measured output growth and adjusted output growth as:
ΔlnQ_t = (1-s^(Q,N)_t)ΔlnV_t + s^(Q,N)_tΔlnN_t
ΔlnQ_t = ΔlnV_t + s^(Q,N)_t(ΔlnN_t – ΔlnV_t)
(8)
Therefore if ΔlnN_t > ΔlnV_t, measured growth will understate true output growth, ΔlnQ_t, and vice versa. The term s^(Q,N)_t(ΔlnN_t – ΔlnV_t) is therefore an estimate of the bias to measured output if intangibles are not treated as capital. The following chart presents a time-series for this term.

<div class="chart-description" markdown="1">**Figure 6: Bias to measured output growth**

Line graph showing bias to measured output growth (% p.a.) from 1990-2010, with recession periods marked by vertical lines.
</div>

Note to figure: Bias to measured output growth when additional CHS intangibles are not capitalised. If the term is positive, measured growth is underestimated due to the omission of intangibles. If it is negative, measured growth is overestimated. Recession marked with vertical lines.

As can be seen, the bias term tended to be positive through the 1990s and early 2000s, meaning that measured growth in GDP understated true growth. This mismeasurement was as much as 0.49% in 1990, and was 0.39% and 0.44% in 1998 and 1999 respectively. In general, post-2003 and in the years leading up to and during the recession, output growth was overestimated, by 0.17% in 2006, 0.13% in 2007 and by 0.27% in 2008 the first year of the recession, but underestimated by 0.27% in 2009, the second year of the recession. Since the recession, output growth has been overestimated, by 0.21% in 2010 and a large 0.52% in 2011, because although real intangible investment has grown, it has grown slowly and even slower than measured output.[^27]

### 6.3 Growth accounting: further details and robustness checks {: #section-6-3 }

As we have seen, we necessarily make a number of assumptions when implementing the growth accounting exercise. How robust are our findings to key assumptions? This is shown in the rest of Table 6. Panel 2 tests the robustness of the results to changes in intangible depreciation rates, where we first halve and then double the geometric rates for intangible capital. Halving the depreciation rates has little impact in the 1990s, but causes the contribution of intangibles to rise in the 2000s as would be expected. The difference simply reflects the intangible investment boom that took place in the late 1990s forming much of the stock. The effect in the 1990s is therefore small as the intangible stock itself is small. The changes in the contributions more or less directly affect ΔlnTFP, so that, if for example, intangibles depreciated half as fast as we have assumed, ΔlnTFP falls from -0.90%pa to -1.10%pa in 2005-11. Doubling the depreciation rates reduces the contribution of intangibles in the 2000s and similarly increases the contribution of ΔlnTFP.

Since estimation of own account organizational capital is particularly uncertain, panel 3 reduces such spending by 75% (that is, managers are assumed to spend 5% of their time building organizational capital, as opposed to 20% in the baseline estimates). In this case in 2005-11 the contribution of intangible capital falls from 0.05%pa to 0.04% pa and ΔlnTFP rises from -0.90%pa to -0.88%pa.[^28] For 2000-05, the comparable figures show a fall in the intangibles contribution from 0.66% pa to 0.59% pa, and a rise in ΔlnTFP from 0.93% pa to 0.97% pa.

One way of looking at the robustness of these results is to calculate the fraction of overall ΔlnV/H accounted for by intangibles, ΔlnTFP and ΔlnL/H under the various different scenarios. It is in fact quite robust giving similar results in each of the models. With intangibles, the fractions for just TFP (column 8) fall, but once we take account of the intangibles contribution (column 10) the fraction is raised. But the interesting thing to note is that these fractions are almost identical with the experiments on depreciation and organizational capital. Thus the inclusion of the full range of intangibles lowers the share of the contribution of ΔlnTFP, but consistently raises the share of the summed contributions of ΔlnTFP plus intangible capital deepening plus labour composition.

In panel 4 we look at the impact of incorporating tax adjustment factors for all tangible and intangible assets, by excluding those factors and comparing the results with the (fourth set of) baseline estimates in panel 1. Looking first at the contributions for tangibles, in the case of computers, applying a tax adjustment factor incorporating the impact of capital allowances and corporation tax increases the contribution of capital deepening in that asset in all periods except the latest period where there is no effect. For other tangibles (plant & machinery, buildings and vehicles) the contribution is also either increased or unaffected in all periods. Incorporation of tax adjustment factors reduces the contribution of intangible capital deepening.

The reasoning for these changes is as follows. Incorporation of tax adjustment factors results in better estimation of asset rental prices and the cost of capital since they account for both the rate of corporation tax plus any asset-specific capital depreciation allowances that firms are allowed to expense for tax purposes. The intent of those allowances is to reduce the cost of capital to firms, and their size varies by asset. However, since the impact of corporation tax still outweighs such allowances, the incorporation of adjustment factors increases the rental prices and relative factor incomes for tangible assets compared to the counterfactual where there is no adjustment for taxation of capital. In the case of intangibles, there is also an allowance for purchased software, the R&D tax credit, and tax relief on mineral exploration and the production of film originals. The R&D tax credit is generous to the extent that the allowance outweighs the impact of corporation tax, reducing the tax adjustment factor to less than one. For all other intangibles no capital allowances are available but firms are able to expense their expenditures leaving the cost of capital unaffected by the presence of corporation tax. In other words, the tax adjustment factors are equal to 1 for those other intangibles. The result is that tax adjustment factors increase the rental prices, factor income shares and therefore the contributions of capital deepening in tangibles relative to most intangibles and the growth accounting decomposition is more accurate due to improvements to the estimation of asset-level capital compensation and rental prices.

### 6.4 Annual Contributions and the impact of recession {: #section-6-4 }

All tables above are based on annual averages. For completeness we also provide a full annual decomposition below. We stress however that annual TFP estimates are inherently volatile, and care should be taken in interpreting annual movements in unsmoothed annual estimates of TFP or the Innovation Index. Also note that in years when TFP and/or LPG are negative, care should be taken in interpreting estimates of the Innovation Index. Also note that annual changes in the contributions reflect changes in ex-post rental prices, due to the inability to accurately observe the utilisation of capital.

The data show the fall in labour productivity that occurred in 2008 and the collapse in 2009. Rises in the labour income share since the recession (column 7), combined with rises in the

---

### Footnotes

[^23]: This is in contrast to previous work (Goodridge, Haskel and Wallis, 2012) where LPG was steady in the 1990s. Growth in real value-added in the late 1990s has been revised down since that previous report.
[^24]: Similarly, since the recession, the hours of younger (less experienced) workers have also declined by more than the middle, and older, cohorts.
[^25]: The estimated high contribution for other tangibles partly reflects: a) the slower depreciation rates of buildings, plant and vehicles compared to IT hardware, which means that the slowdown in investment has had less impact on growth in capital services; and b) that the methodology implicitly assumes no change in the utilisation of capital. In reality, utilisation has likely fallen in the later period so that the contribution is over-estimated.
[^26]: Where measured capital in the national accounts does include some forms of intangible capital, namely software, mineral exploration and artistic originals. R&D will be added to intangible assets capitalised in the UK accounts in Blue Book 2014.
[^27]: Note that this goes against what was reported in Goodridge, Haskel and Wallis (2013). In that paper we assumed that after the recession all intangible investment grew at the same rate as scientific R&D. As shown in Figure 2, while investment in innovative property grew (largely made up of scientific R&D), investment in economic competencies declined. Our assumption therefore turned out to be incorrect.
[^28]: We also looked at year by year changes and in particular the impact of the recession. In 2008, there was a decline of -1.36% in adjusted growth in value-added, and smaller contributions from capital deepening than the previous year. Measured TFP falls by -2.24%. It is likely however that in very severe recessions we do not measure the actual fall in capital that likely comes about due to premature scrapping and underutilisation and since TFP is a residual, this renders TFP negative. Thus we should be careful about interpreting year-to-year movements in the innovation index.
wagebill share of experienced and skilled worked resulted in a strong contribution from
labour composition (column 2) during and after the recession. The rise in composition during
the recession, combined with the strong contribution of other tangible capital, results in large
negative estimates for the TFP residual in 2008 and 2009.
Table 7: Annual Decomposition, ‘National Accounts model' compared to ‘All CHS intangibles'
| DlnV/H |
s Din(L/H) |
s Din (K/H) cmp |
sDln(K/H) othtan |
s Din(K/H) intan |
Din TFP |
Memo: sLAB |
InnIndex1 |
InnIndex2 |
InnIndex3 |
InnIndex4 |
| National Acc's Intangibles: software; mineral exploration; artistic originals |
|
|
|
|
|
|
6/1 |
(5+6)/1 |
(2+5+6)/1 |
(5+6) |
| 1991 |
2.14% |
-0.12% |
0.30% |
2.51% |
0.33% |
-0.88% |
0.65 |
-0.41 |
-0.26 |
-0.31 |
| 1992 |
3.97% |
0.51% |
0.08% |
1.79% |
0.23% |
1.35% |
0.66 |
0.34 |
0.40 |
0.53 |
| 1993 |
4.36% |
0.01% |
0.18% |
0.92% |
0.12% |
3.13% |
0.65 |
0.72 |
0.74 |
0.75 |
| 1994 |
3.77% |
0.10% |
0.21% |
-0.13% |
0.15% |
3.44% |
0.63 |
0.91 |
0.95 |
0.98 |
| 1995 |
1.55% |
0.26% |
0.35% |
-0.01% |
0.25% |
0.71% |
0.62 |
0.45 |
0.61 |
0.78 |
| 1996 |
2.61% |
0.20% |
0.39% |
0.40% |
0.26% |
1.36% |
0.61 |
0.52 |
0.62 |
0.70 |
| 1997 |
2.87% |
0.08% |
0.36% |
0.64% |
0.27% |
1.52% |
0.60 |
0.53 |
0.62 |
0.65 |
| 1998 |
1.79% |
0.45% |
0.43% |
0.57% |
0.24% |
0.10% |
0.62 |
0.06 |
0.19 |
0.44 |
| 1999 |
2.47% |
0.34% |
0.36% |
0.75% |
0.32% |
0.70% |
0.64 |
0.28 |
0.41 |
0.55 |
| 2000 |
3.96% |
0.33% |
0.47% |
0.73% |
0.20% |
2.23% |
0.66 |
0.56 |
0.61 |
0.70 |
| 2001 |
1.31% |
0.01% |
0.16% |
0.37% |
0.37% |
0.40% |
0.67 |
0.30 |
0.58 |
0.59 |
| 2002 |
2.67% |
0.25% |
0.15% |
1.21% |
0.33% |
0.73% |
0.67 |
0.27 |
0.39 |
0.49 |
| 2003 |
3.80% |
0.47% |
0.12% |
0.90% |
0.46% |
1.85% |
0.66 |
0.49 |
0.61 |
0.73 |
| 2004 |
3.30% |
-0.25% |
0.12% |
0.93% |
0.40% |
2.11% |
0.65 |
0.64 |
0.76 |
0.68 |
| 2005 |
1.33% |
0.42% |
0.12% |
0.36% |
0.10% |
0.33% |
0.65 |
0.25 |
0.32 |
0.63 |
| 2006 |
2.51% |
0.25% |
0.06% |
0.73% |
-0.03% |
1.50% |
0.65 |
0.60 |
0.59 |
0.68 |
| 2007 |
2.92% |
0.43% |
0.10% |
0.80% |
0.04% |
1.55% |
0.65 |
0.53 |
0.54 |
0.69 |
| 2008 |
-0.43% |
0.30% |
0.05% |
1.23% |
0.12% |
-2.14% |
0.64 |
4.93 |
4.66 |
3.96 |
| 2009 |
-4.38% |
0.81% |
-0.03% |
1.67% |
0.04% |
-6.88% |
0.65 |
1.57 |
1.56 |
1.38 |
| 2010 |
2.09% |
0.79% |
-0.01% |
0.69% |
0.01% |
0.60% |
0.65 |
0.29 |
0.30 |
0.67 |
| 2011 |
0.73% |
0.66% |
0.02% |
0.03% |
0.01% |
0.00% |
0.66 |
0.00 |
0.02 |
0.92 |
| All CHS Intangibles |
|
|
|
|
|
|
|
|
|
|
| 1991 |
2.17% |
-0.11% |
0.28% |
2.33% |
1.03% |
-1.36% |
0.59 |
-0.62 |
-0.15 |
-0.20 |
| 1992 |
4.16% |
0.46% |
0.08% |
1.68% |
0.85% |
1.09% |
0.60 |
0.26 |
0.47 |
0.58 |
| 1993 |
4.56% |
0.01% |
0.17% |
0.87% |
0.60% |
2.92% |
0.59 |
0.64 |
0.77 |
0.77 |
| 1994 |
3.67% |
0.09% |
0.19% |
-0.12% |
0.39% |
3.11% |
0.58 |
0.85 |
0.95 |
0.98 |
| 1995 |
1.74% |
0.24% |
0.32% |
-0.01% |
0.54% |
0.66% |
0.57 |
0.38 |
0.69 |
0.82 |
| 1996 |
2.33% |
0.18% |
0.36% |
0.35% |
0.42% |
1.03% |
0.56 |
0.44 |
0.62 |
0.70 |
| 1997 |
3.12% |
0.07% |
0.32% |
0.57% |
0.58% |
1.57% |
0.55 |
0.50 |
0.69 |
0.71 |
| 1998 |
2.15% |
0.41% |
0.39% |
0.51% |
0.58% |
0.26% |
0.56 |
0.12 |
0.39 |
0.58 |
| 1999 |
2.94% |
0.31% |
0.33% |
0.68% |
0.90% |
0.72% |
0.58 |
0.25 |
0.55 |
0.66 |
| 2000 |
3.91% |
0.30% |
0.42% |
0.65% |
0.69% |
1.84% |
0.59 |
0.47 |
0.65 |
0.72 |
| 2001 |
1.70% |
0.01% |
0.15% |
0.32% |
0.85% |
0.38% |
0.61 |
0.22 |
0.72 |
0.72 |
| 2002 |
2.72% |
0.23% |
0.13% |
1.06% |
0.85% |
0.45% |
0.60 |
0.16 |
0.48 |
0.56 |
| 2003 |
3.55% |
0.42% |
0.11% |
0.79% |
0.76% |
1.48% |
0.60 |
0.42 |
0.63 |
0.75 |
| 2004 |
2.95% |
-0.23% |
0.10% |
0.79% |
0.55% |
1.73% |
0.59 |
0.59 |
0.77 |
0.70 |
| 2005 |
1.62% |
0.38% |
0.11% |
0.30% |
0.22% |
0.60% |
0.59 |
0.37 |
0.51 |
0.75 |
| 2006 |
2.32% |
0.22% |
0.05% |
0.61% |
0.19% |
1.25% |
0.58 |
0.54 |
0.62 |
0.71 |
| 2007 |
2.78% |
0.39% |
0.09% |
0.66% |
0.14% |
1.49% |
0.58 |
0.54 |
0.59 |
0.73 |
| 2008 |
-0.69% |
0.27% |
0.04% |
1.04% |
0.19% |
-2.24% |
0.58 |
3.23 |
2.96 |
2.56 |
| 2009 |
-4.12% |
0.73% |
-0.02% |
1.41% |
0.26% |
-6.49% |
0.59 |
1.58 |
1.51 |
1.34 |
| 2010 |
1.89% |
0.72% |
-0.01% |
0.58% |
-0.11% |
0.71% |
0.59 |
0.38 |
0.32 |
0.70 |
| 2011 |
0.20% |
0.60% |
0.02% |
0.01% |
-0.34% |
-0.09% |
0.60 |
-0.46 |
-2.11 |
0.82 |
The above table is presented as a decomposition of labour productivity, with all terms
expressed in terms of per hour worked. Obviously the recent recession has been associated
with a strong fall in hours worked. Therefore to better understand how the raw capital
services data is behaving, the following table is a decomposition of growth in value-added,
unadjusted for hours worked. The contribution of labour (column 2) therefore includes the
volume of hours worked plus the impact of labour quality or composition.
Table 8: Decomposition of output and the recession
| DinV |
s Din(L) |
s Din(K) cmp |
s Din(K) buildings |
s Din(K) plant |
sDln(K) vehicles |
s Din(K) rd |
sDin(K) oth intan |
DinTFP |
Memo: sLAB |
| All CHS Intangibles |
|
|
|
|
|
|
|
|
|
| 2006 |
2.79% |
0.50% |
0.06% |
0.60% |
0.15% |
-0.02% |
0.03% |
0.23% |
1.25% |
| 2007 |
3.93% |
1.07% |
0.10% |
0.74% |
0.27% |
-0.05% |
0.05% |
0.27% |
1.49% |
| 2008 |
-1.36% |
-0.11% |
0.04% |
0.64% |
0.27% |
-0.04% |
0.04% |
0.05% |
-2.24% |
| 2009 |
-8.04% |
-1.57% |
-0.05% |
0.45% |
0.05% |
-0.09% |
0.03% |
-0.36% |
-6.49% |
| 2010 |
1.60% |
0.54% |
-0.01% |
0.42% |
0.06% |
0.03% |
0.02% |
-0.17% |
0.71% |
| 2011 |
0.91% |
1.02% |
0.03% |
0.44% |
0.03% |
-0.28% |
0.03% |
-0.26% |
-0.09% |
The data show that the UK market sector suffered a massive 8% fall in value-added in 2009.
Strong falls in market sector investment were enough to cause estimates of growth in capital
services from computers to turn negative in 2009 and 2010, whilst that from vehicles has been
negative in all years since 2006 except 2010. The contribution from plant and machinery is
also much lower from 2009. The exception to this pattern is buildings. Whilst the
contribution for buildings does drop in 2009, it remains positive and substantial, reflecting
their slower rate of depreciation and the size of the existing stock. This means that a much
sharper and more sustained fall in investment is required to generate a fall in the capital stock.
On intangibles, Table 8 also shows the contribution of R&D isolated from other intangibles.
The contribution from other intangible capital services has been negative since 2009.
However, the contribution of R&D has held up and remained relatively steady, reflecting the
strength of R&D investment during and after the recession, in contrast to investments in
economic competencies such as training and organisational capital.
6.5 Contributions of individual intangible assets
Contributions of each tangible and intangible asset are set out in Table 9. The table shows
that, in the most recent period, much of the contribution of capital deepening was in buildings,
reflecting the slow depreciation rate of this asset so that the collapse in investment has not had
so much impact on growth in the stock. The depreciation rates for other assets, particularly
intangibles but also computers and plant for instance, are much higher. The contribution of
those assets in the most recent period has therefore been much reduced compared to earlier
years.
Of the intangibles, data for the most recent period show the contributions to have been
relatively weak, but the largest contributions came from software and R&D. Looking at
earlier periods, column 7 shows that software has been an important driver of growth, with a
contribution of 0.26% pa in the early 2000s. The contribution from organisational capital
(column 14) has also been strong, at 0.17% pa in both the late 1990s and early 2000s.
Columns 8 and 9 show small negative contributions from mineral exploration and artistic
originals in the latest period. Columns 10 and 11 show fairly consistent contributions from
design and R&D, at quite similar levels (note R&D in this table is a broad definition that
includes R&D in financial services and social sciences, as well as scientific R&D). In
columns 12 to 13, we show the contributions of branding and training. The latter makes a
significant negative contribution in the most recent period, reflecting the weakness in
investment in training in recent years. The contribution of branding has also fallen in the
2000s.
Table 9: Contributions of individual assets: Detailed breakdown
| DlnV/H |
s Din(L/H) |
s Din (K/H) cmp |
s Din (K/H) buildings |
s Din (K/H) P&M |
s Din (K/H) vehicles |
s Din (K/H) software |
s Din (K/H) min |
s Din (K/H) cop |
s Din (K/H) aed |
s Din (K/H) rd |
s Din (K/H) brand |
s Din (K/H) train |
s Din (K/H) org |
Din TFP |
Memo: sLAB |
| 1990-95 |
3.26% |
0.14% |
0.21% |
0.41% |
0.52% |
0.03% |
0.18% |
0.00% |
0.02% |
0.06% |
0.07% |
0.05% |
0.10% |
0.20% |
1.29% |
| 1995-00 |
2.89% |
0.26% |
0.36% |
0.25% |
0.30% |
0.00% |
0.22% |
-0.02% |
0.03% |
0.04% |
0.02% |
0.09% |
0.08% |
0.17% |
1.08% |
| 2000-05 |
2.51% |
0.16% |
0.12% |
0.33% |
0.25% |
0.07% |
0.26% |
-0.01% |
0.05% |
0.03% |
0.04% |
0.03% |
0.09% |
0.17% |
0.93% |
| 2005-11 |
0.40% |
0.49% |
0.03% |
0.61% |
0.18% |
-0.07% |
0.04% |
-0.01% |
-0.01% |
0.02% |
0.04% |
0.01% |
-0.07% |
0.00% |
-0.90% |
Notes to table. Data are average growth rates per year for intervals shown. First column is labour productivity growth in per hour terms. Column 2 is the contribution of
labour services per hour, namely growth in labour services per hour times share of labour in MGVA. Column 3 is growth in computer capital services per hour times share in
MGVA. Column 4 is growth in capital services from buildings per hour times share in MGVA. Column 5 is growth in capital services from plant & machinery (excluding
IT hardware) per hour times share in MGVA. Column 6 is growth in capital services from vehicles per hour times share in MGVA. Column 7 is growth in software capital
services per hour times share in MGVA. Column 8 is growth in capital services from mineral exploration per hour times share in MGVA. Column 9 is growth in capital
services from copyright (artistic originals) per hour times share in MGVA. Column 10 is capital services from design per hour times share in MGVA. Column 11 is growth in
broadly defined R&D (including non-scientific R&D and financial product development) capital services per hour times share in MGVA. Column 12 is capital services from
branding (advertising and market research) per hour times share in MGVA. Column 13 is capital services from firm-level training per hour times share in MGVA. Column
14 is organisational capital services per hour times share in MGVA. Column 15 is TFP, namely column 1 minus the sum of columns 2 to 14. Column 16 is the share of
labour payments in MGVA.
6.6 Impact of alternative deflators for intangible assets
Whilst a great deal has been done to improve estimates of investment in knowledge assets,
less has been done on estimation of their prices. Such estimation is difficult as a feature of
these assets is that they are rarely acquired via market transactions. Indeed one of the benefits
of ownership is the sole right or access to knowledge unavailable to market competitors.
Therefore much investment takes place in-house, and no market price can be recorded. For
this reason the standard approach for deflating investment in most intangible assets has been
to use a value-added deflator, implicitly assuming that their prices closely follow a weighted
average of prices in the rest of the economy.
In this report we make use of Experimental Service Producer Price Indices (SPPIs) produced
by the ONS to estimate changes in the price of intangibles, which we believe is an
improvement on past compilations of the Innovation Index. Specifically, for architectural and
engineering design we use the SPPI for the related industry, “Technical testing and analysis",
for advertising we use the SPPI for “Advertising Placement”, for market research we use the
SPPI for "Market Research", for organisational capital we use the SPPI for "Business and
Management Services”, and for training we use the SPPI for “Adult Education”. However,
these price indices only extend back to the mid-2000s. Therefore in terms of their impact on
our growth-accounting estimates, they only affect results for the latest period, 2005-11. Since
these price indices typically rise slightly slower than a value-added price index, estimated real
intangible investment therefore grows slightly faster than it otherwise would. The only
remaining assets for which we do not have a specific deflator are financial product innovation
and non-scientific R&D, and we deflate each with the implied UK value-added deflator.
For software, mineral exploration and artistic originals we use the deflators from the ONS
VICS system. In the case of purchased software, the index is based on the hedonic price index
produced by the BEA. The own-account index is based on the reported wages of software
writers with an adjustment for assumed growth in productivity. For R&D, an official UK
deflator for R&D is not yet developed so we use the US index developed by the BEA.
Software and R&D are the two types of intangible assets that receive most attention.
Therefore we test the robustness of our deflators for each of these assets, with the results set
out in the table below.
Specifically, we try deflating R&D with the implied UK value-added deflator to see what
affect that has on the estimated contribution to growth (panel 2). We also deflate own-
account software, using the UK purchased software deflator (panel 3). The own-account
software deflator is based on the wages of software professionals with a small downward
adjustment based on labour productivity growth in the wider service sector. However if
productivity in the creation of own-account software has been rising faster than productivity
in the wider service sector, then the software asset price index will over-estimate price
changes and underestimate growth in real investment and software capital services. If
productivity in own-account software creation is similar to that in the production of software
for general sale, which seems a reasonable assumption, then the purchased deflator may be a
more appropriate price index. Finally, we also estimate the contribution of software using the
US BEA deflators for purchased and own-account (panel 4).
Table 10: Alternative deflators for intangible assets
| DlnV/H |
s Din(L/H) |
s Din (K/H) cmp |
s Din(K/H) othtan |
s Din(K/H) software |
s Din(K/H) innov less rd |
s Din(K/H) rd |
s Din(K/H) ec comp |
Din TFP |
Memo: sLAB |
| 1) Baseline |
|
|
|
|
|
|
|
|
|
| All CHS Intangibles |
|
|
|
|
|
|
|
|
|
| 1990-95 |
3.26% |
0.14% |
0.21% |
0.95% |
0.18% |
0.09% |
0.07% |
0.35% |
1.29% |
| 1995-00 |
2.89% |
0.26% |
0.36% |
0.55% |
0.22% |
0.06% |
0.02% |
0.33% |
1.08% |
| 2000-05 |
2.51% |
0.16% |
0.12% |
0.65% |
0.26% |
0.07% |
0.04% |
0.28% |
0.93% |
| 2005-11 |
0.40% |
0.49% |
0.03% |
0.72% |
0.04% |
0.03% |
0.04% |
-0.06% |
-0.90% |
| 2) Using UK value-added deflator for R&D |
|
|
|
|
|
|
|
|
|
| All CHS Intangibles |
|
|
|
|
|
|
|
|
|
| 1990-95 |
3.26% |
0.14% |
0.21% |
0.95% |
0.18% |
0.09% |
0.05% |
0.35% |
1.31% |
| 1995-00 |
2.92% |
0.26% |
0.36% |
0.55% |
0.22% |
0.06% |
0.03% |
0.33% |
1.10% |
| 2000-05 |
2.50% |
0.16% |
0.12% |
0.65% |
0.26% |
0.07% |
0.04% |
0.28% |
0.91% |
| 2005-11 |
0.40% |
0.49% |
0.03% |
0.72% |
0.04% |
0.03% |
0.04% |
-0.06% |
-0.90% |
| 3) Using UK purchased software deflator for own-account software |
|
|
|
|
|
|
|
|
|
| All CHS Intangibles |
|
|
|
|
|
|
|
|
|
| 1990-95 |
3.26% |
0.14% |
0.21% |
0.95% |
0.27% |
0.09% |
0.07% |
0.35% |
1.19% |
| 1995-00 |
2.89% |
0.26% |
0.36% |
0.55% |
0.29% |
0.06% |
0.02% |
0.33% |
1.02% |
| 2000-05 |
2.51% |
0.16% |
0.12% |
0.65% |
0.31% |
0.07% |
0.04% |
0.28% |
0.87% |
| 2005-11 |
0.40% |
0.49% |
0.03% |
0.72% |
0.07% |
0.03% |
0.04% |
-0.06% |
-0.92% |
| 4) Using US (BEA) software deflators for purchased and own-account software |
|
|
|
|
|
|
|
|
|
| All CHS Intangibles |
|
|
|
|
|
|
|
|
|
| 1990-95 |
3.26% |
0.14% |
0.21% |
0.95% |
0.27% |
0.09% |
0.07% |
0.35% |
1.20% |
| 1995-00 |
2.89% |
0.26% |
0.36% |
0.55% |
0.28% |
0.06% |
0.02% |
0.33% |
1.03% |
| 2000-05 |
2.51% |
0.16% |
0.12% |
0.65% |
0.26% |
0.07% |
0.04% |
0.28% |
0.92% |
| 2005-11 |
0.40% |
0.49% |
0.03% |
0.72% |
0.07% |
0.03% |
0.04% |
-0.06% |
-0.92% |
Note to table. Panel 1 are baseline estimates as presented previously. Panel 2 uses the implied UK
value-added price index to deflate R&D. Panel 3 uses the deflator for purchased software to also
deflate own-account, with the implicit assumption being that productivity in the creation of own-
account software is similar to that in the software industry itself. Panel 4 uses official US BEA
deflators for purchased and own-account software, where the latter incudes a productivity adjustment
based on the purchased software data.
On R&D, comparing panel 2 with panel 1 shows that using a value-added deflator instead of
the BEA deflator reduces the contribution of R&D by 0.02 pppa in the early 1990s and
increases it by 0.01 pppa in the late 1990s. There is no effect on the estimated contribution in
the 2000s. On software, comparing panel 3 with panel 1 shows that deflating own-account
software with the UK purchased software deflator (VICS) has a significant impact on the
estimated contribution, raising the contribution by between 0.03 and 0.09 pppa in all periods.
The implications from panel 4 are similar, with use of the US deflators raising the
contribution by 0 to 0.09 pppa in all periods. These results suggest that, due to the size of
investment in this asset category, estimating an appropriate price index for software
investment is a first-order issue, particularly for own-account software.
6.7 Comparison with previous estimates
This report is an update on previous work, including estimates of the Innovation Index funded
by NESTA. The following table compares the results in this report with those in the previous
compilation of the NESTA Innovation Index (Goodridge, Haskel and Wallis, 2012). The
results differ for a number of reasons. In short there have been changes to:
- estimated growth in labour services due to the updating of population grossing
weights in the LFS,
- (tangible and intangible) capital deepening. Tangible capital deepening in particular
has been revised up due to revisions to ONS asset price deflators and nominal
investment shares, as well as revisions to Gross Operating Surplus,
- estimated growth in measured output which has been revised down in the late 1990s
in particular,
- estimated rentals due to updated deflators, and
- our market sector definition (we previously excluded actual and imputed rents from
dwellings, we now exclude the real estate sector in line with the methodology used in
EUKLEMS).
As a result of these changes, relative to the last report our data show weaker growth in labour
productivity in the 1990s; weaker growth in labour composition in the early 1990s; stronger
growth in tangible capital deepening in the early 1990s and also the 2000s, and weaker
growth in intangible capital deepening in the late 1990s and stronger growth in the 2000s.
TFP is estimated as weaker in all periods relative to the previous report, but particularly in the
late 1990s. The increase in the contribution of tangible capital deepening is largely because
of ONS revisions to nominal and real investment. The large reduction in estimated TFP in the
late 1990s is predominantly due to ONS revisions to real output growth in that period.
Table 11: Comparison with previous results
| DInV/H |
sDln(L/H) |
s Din(K/H) tang |
s Din (K/H) intang |
DInTFP |
| NESTA (2014) All CHS Intangibles, (SIC07: A-K, MN, R-T) |
|
|
|
|
| 1990-95 |
3.26% |
0.14% |
1.16% |
0.68% |
| 1995-00 |
2.89% |
0.26% |
0.92% |
0.63% |
| 2000-09 |
1.43% |
0.27% |
0.86% |
0.44% |
| NESTA (2012) All CHS Intangibles, (SIC03: A-K & OP) |
|
|
|
|
| 1990-95 |
3.36% |
0.21% |
1.09% |
0.68% |
| 1995-00 |
3.57% |
0.26% |
1.04% |
0.73% |
| 2000-09 |
1.43% |
0.27% |
0.79% |
0.38% |
Note to table. For comparison, data are based on the same periods. The top panel are our most recent
results.
7 Growth accounting results: industry-level
Our industry growth accounting is feasible between 2000-11. Thus we start with comparing
our aggregated results with those based on data for the total market sector to check the two
are closely comparable. Then we look more closely industry by industry. In past work we
have conducted our industry analysis using EUKLEMS and worked on a gross output basis.
The latest update of EUKLEMS however does not include data on real gross output and
intermediate inputs. We therefore work with the ONS industry data on a value-added basis.
7.1 Comparing industry and market sector data
Table 12 sets out our results. The top row shows our market sector estimates, with
intangibles, 2000-11. The second row shows results for 2000-11 using the aggregated
industry data, where we aggregate industry contributions according to the industry share in
nominal value-added. AlnV/H is 10 percentage points higher using the aggregated industry
data.
7.2 Results by industry
To build up the industry contributions to these overall figures we start with the industry-by-
industry results in Table 13. These are on a value-added basis: we show how they relate to
the whole economy value-added level below.
Table 12: Growth accounting: comparison of ONS market sector and weighted Market Sector Aggregates, 2000-11
| ALPG |
Total |
Computers |
Other tang |
Intangibles |
Labour Composition |
DInTFP |
| DlnV/H |
sDln(K/H) |
sDln(K/H) cmp |
sDln(K/H) othtan |
sDln(K/H) intan |
sDln(L/H) |
DInTFP |
| Market Sector data, with all CHS intangibles |
1.36% |
1.08% |
0.07% |
0.69% |
0.32% |
0.34% |
| Aggregated Industry data, with all CHS intangibles |
1.46% |
1.37% |
0.08% |
0.90% |
0.38% |
0.42% |
Note: All figures are average annual percentages. The contribution of an output or input is the growth rate weighted by the corresponding average share. Columns are
annual average change in natural logs of: column 1, real value added per hour, column 2, contribution of total capital (which is the sum of the next three columns), column 3,
contribution of IT hardware capital, column 4, contribution of other non-IT tangible capital, column 5, contribution of intangibles, column 6, contribution of labour services
per person hour, column 7, TFP, being column 1 less the sum of columns 2 to 6. Row 1 is based on ONS data with the capitalisation of intangibles for the market sector.
Row 2 is ONS industry data, with intangibles, 2000-11, aggregated to the market sector. In each the market sector is defined using our definition of SIC(2007) A-K, MN, R-
T. Source: authors' calculations
Table 13: Industry level value-added growth accounting, 2000-2011, including intangibles
| Industry |
DlnV/H |
sDln(K/H) |
sDln(K/H)IT |
sDln(K/H)othtan |
sDln(K/H)intan |
sDln(L/H) |
DInTFP |
| 2000-11 |
|
|
|
|
|
|
|
| AgMinUtil |
-3.53 |
0.50 |
0.11 |
0.51 |
-0.11 |
0.18 |
-4.22 |
| Mfr |
3.27 |
1.46 |
0.08 |
0.66 |
0.72 |
0.47 |
1.34 |
| Constr |
1.11 |
1.87 |
0.05 |
1.51 |
0.31 |
0.06 |
-0.82 |
| RtAcc |
1.52 |
1.47 |
0.07 |
1.15 |
0.24 |
0.37 |
-0.32 |
| Tran |
0.00 |
1.31 |
0.07 |
1.02 |
0.22 |
0.21 |
-1.53 |
| InfoCom |
2.79 |
1.20 |
0.04 |
0.40 |
0.76 |
0.64 |
0.96 |
| FinSvc |
2.12 |
1.50 |
0.21 |
0.74 |
0.55 |
0.74 |
-0.12 |
| ProfAdmin |
1.68 |
1.02 |
0.03 |
0.77 |
0.22 |
0.46 |
0.20 |
| PersSvc |
0.03 |
2.39 |
0.20 |
1.93 |
0.26 |
0.40 |
-2.76 |
Note: All figures are average annual percentages. The contribution of an output or input is the growth rate weighted by the corresponding average share. Columns are annual
average changes in natural logs of: column 1, real value-added per hour, column 2, contribution of total capital (which is the sum of the next three columns), column 3,
contribution of IT hardware capital, column 4, contribution of other non-IT tangible capital, column 5, contribution of intangibles, column 6, contribution of labour services
per person hour, column 7, TFP, being column 1 less the sum of columns 2 and 6. Note also that Health & Safety and induction training are excluded from the investment
figures used for the above calculation in the case of the service sector but not in the production sector. Source: authors' calculations
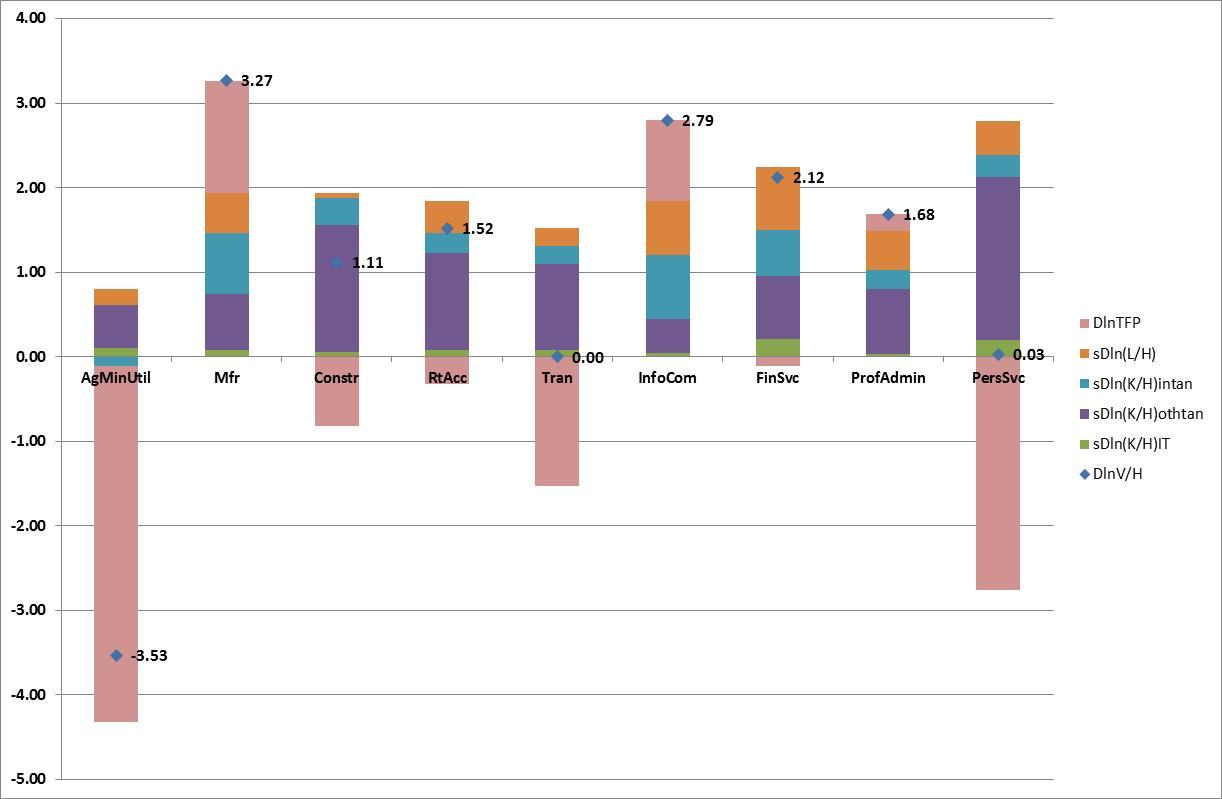
Note to figure: Data as presented in Table 13. Data are annual average growth rates for 2000-11. All CHS intangibles capitalised. Labelled data points are industry growth
in real value-added per hour. Stacked bars are contributions from labour composition and capital deepening (for broad asset definitions), all expressed in terms of per hour
worked, and TFP.
We just report the results including all intangibles. Column 1 shows ∆lnV/H, average growth
in value-added per employee-hour. It is strongly negative in Agriculture; Mining and Utilities
at -3.53% pa, zero in Transportation and Storage, and marginally positive at 0.03% pa in
Recreational and Personal Services. In all other industries, LPG is positive, particularly in
manufacturing (3.27% pa), information and communication (2.79% pa) and financial services
(2.12% pa).
Column 2 shows total capital deepening per employee-hour, being positive in all industries
but lowest in Agriculture, Mining and Utilities and highest in Recreational and Personal
Services. Columns 3, 4 and 5 shed further light on this. The contribution of computer
hardware is strongest in financial services, and also recreational and personal services. In
most other industries it is relatively weak. The contribution of other tangibles (buildings,
vehicles etc.) is strongest in recreational and personal services, which includes a lot of
infrastructure capital which was also boosted during the Olympics. On intangibles, the
contribution is negative in agriculture; mining and utilities. The strongest contributions are in
information & communication and manufacturing, followed by finance, which are all
knowledge-intensive industries.
Column 6 presents the contribution of labour composition. It is positive in all industries but
we note that it is weak in construction and very strong in both financial services and
information & communication.
Finally, column 7 presents industry TFP. The depth of the recession means that it is measured
as negative in all but three industries. The three industries where TFP is positive are
manufacturing (1.34% pa), information and communication (0.96% pa) and professional &
administrative services (0.20% pa). The industries where negative TFP is largest in absolute
terms are agriculture, mining & utilities (-4.22% pa), recreational & personal services (-2.76%
pa) and transportation & storage (-1.53% pa).
To say a little bit more about the industries in general, the industries that stand out in terms of
their LPG and TFP performance, and also their use of intangible capital, are manufacturing,
information & communication, and to a lesser extent, professional & administrative and
financial services. Strong productivity growth in manufacturing is a typical finding, but the
latest revision to the SIC also allows us to observe the strong performance of information &
communication, which aligns closely with what are typically described as the “creative
industries".
On the strong negative TFP observed in recreational & personal services, it is worth noting a
few points about that sector. First, as is well-known, measurement of prices and quantities in
the service sector is notoriously difficult, and so real output and TFP may not be well
estimated. Second, this industry also includes a significant amount of non-market activity. It
also includes a lot of 'cultural' activity which is in fact heavily subsidised, including
museums, galleries and theatres. These features raise numerous issues for the measurement
of output. However, despite suspicions on the accuracy of the real output and TFP measures
for this sector, we felt it important to include as it does house some important investors in UK
knowledge assets, such as those in creative and performing arts. Given that this is a
significant industry in size in terms of both nominal value-added and employment, and
includes activity where the UK is considered to have a comparative advantage, improving
measurement of its output is a first order issue.
So the overall picture of intangibles at the industry level is as follows. In manufacturing,
labour productivity is high, particularly with a lot of labour shedding. About 41% of that
LPG is due to TFPG, with 22% due to intangible growth and 14% due to labour quality. Or
put another way, in manufacturing, around (41+22+14=)78% of growth in labour productivity
can be explained by growth in knowledge or innovation. In information & communication,
labour productivity growth is slightly lower, as is TFP. In that sector, 34% of LPG can be
explained by TFP, 27% by intangible capital deepening, and 23% by labour quality, so that
overall (34+27+23=)84% of growth is explained by innovation. So, to compare these two
innovative sectors, relatively speaking, growth in information & communication is more
driven by growth in intangible capital and labour quality, whilst growth in manufacturing is
more driven by TFP (which could of course reflect within-industry spillovers of intangible
investment). Of the other sectors, it is worth noting that 26% of LPG in finance comes from
intangible capital deepening, with 35% from labour quality and a negative contribution from
TFP (of course growth in real output and TFP in this sector was heavily impacted by the
financial crisis). Also, in construction, 28% of LPG comes from investment in intangibles,
such as in architectural and engineering design. Figure 7 presents the same data but in
graphical form.
7.3 Contributions of individual industries overall performance
Finally, the appendix shows the impact of adding intangibles, which is that ∆lnV/H and
∆lnTFP are both lower than without intangibles. Thus for example, without intangibles one
would conclude ∆lnTFP=-0.12% instead of -0.34% here with.
Table 14: Industry contributions to growth in aggregate value added, capital deepening, labour quality and TFP (growth rates and contributions are %pa per employee hour, 2000-11)
| Industry |
VA weight |
DlnVA/H |
Contrib to agg va/h |
Cap weight |
Contrib to agg K/H |
Contrib to IT dlnK/H |
Contrib to agg non-IT dlnK/H |
Contrib to agg Intan/H |
Lab weight |
Contrib to agg lab qual per hr |
DlnTFP |
Contrib to agg TFP |
Memo: % total hrs |
| Agriculture, Mining & Utilities |
0.07 |
-3.53 |
-0.25 |
0.05 |
0.04 |
0.01 |
0.04 |
-0.01 |
0.02 |
0.01 |
-4.22 |
-0.30 |
4% |
| Manufacturing |
0.18 |
3.27 |
0.60 |
0.07 |
0.27 |
0.02 |
0.12 |
0.13 |
0.11 |
0.08 |
1.34 |
0.25 |
15% |
| Construction |
0.09 |
1.11 |
0.09 |
0.04 |
0.16 |
0.00 |
0.13 |
0.03 |
0.05 |
0.01 |
-0.82 |
-0.08 |
11% |
| Wholesale & Retail Trade, Accommodation & Food |
0.19 |
1.52 |
0.30 |
0.07 |
0.29 |
0.01 |
0.22 |
0.05 |
0.13 |
0.07 |
-0.32 |
-0.06 |
26% |
| Transportation & Storage |
0.06 |
0.00 |
0.00 |
0.02 |
0.08 |
0.00 |
0.06 |
0.01 |
0.05 |
0.01 |
-1.53 |
-0.09 |
7% |
| Information & Communication |
0.09 |
2.79 |
0.26 |
0.04 |
0.11 |
0.00 |
0.04 |
0.07 |
0.05 |
0.06 |
0.96 |
0.09 |
6% |
| Financial Services |
0.11 |
2.12 |
0.19 |
0.06 |
0.16 |
0.02 |
0.08 |
0.05 |
0.05 |
0.09 |
-0.12 |
-0.05 |
5% |
| Professional & Administrative Services |
0.16 |
1.68 |
0.26 |
0.05 |
0.16 |
0.00 |
0.12 |
0.03 |
0.10 |
0.07 |
0.20 |
0.03 |
20% |
| Recreational & Personal Services |
0.04 |
0.03 |
0.00 |
0.02 |
0.11 |
0.01 |
0.09 |
0.01 |
0.03 |
0.02 |
-2.76 |
-0.12 |
6% |
| Sum |
1.00 |
|
1.46 |
|
1.37 |
0.08 |
0.90 |
0.38 |
|
0.42 |
|
-0.34 |
100% |
| %ages of summed contributions |
|
|
|
|
|
|
|
|
|
|
|
|
Memo: % total hrs (8+10+12) |
| Agriculture, Mining & Utilities |
|
|
-17% |
|
3% |
9% |
4% |
-2% |
|
3% |
|
|
-63% |
| Manufacturing |
|
|
41% |
|
20% |
18% |
13% |
35% |
|
19% |
|
|
99% |
| Construction |
|
|
6% |
|
12% |
6% |
15% |
7% |
|
1% |
|
|
-10% |
| Wholesale & Retail Trade, Accommodation & Food |
|
|
21% |
|
21% |
17% |
25% |
12% |
|
17% |
|
|
13% |
| Transportation & Storage |
|
|
0% |
|
6% |
6% |
7% |
4% |
|
3% |
|
|
-15% |
| Information & Communication |
|
|
18% |
|
8% |
5% |
4% |
18% |
|
14% |
|
|
47% |
| Financial Services |
|
|
13% |
|
11% |
25% |
9% |
14% |
|
21% |
|
|
18% |
| Professional & Administrative Services |
|
|
18% |
|
12% |
5% |
13% |
9% |
|
18% |
|
|
30% |
| Recreational & Personal Services |
|
|
0% |
|
8% |
10% |
9% |
3% |
|
4% |
|
|
-20% |
| Sum |
|
|
100% |
|
100% |
100% |
100% |
100% |
|
100% |
|
|
100% |
Note: All figures are annual averages. Weights depend on the industry share in aggregate value-added and the input share in industry value-added. Contributions are the product of the weights and the input growth averaged over years. Employment is the share of the industry's hours worked over total hours worked by persons engaged. Column 5 is the sum of columns 6, 7, 8. Source: authors' calculations
In the left panel, columns 1, 2 and 3 show respectively the industry weights in market sector value added, average AlnV/H and the contribution to aggregate LPG (which is not quite the product of columns 1 and 2, since the average of a product is not the product of two averages). In the final row, the weights on value added sum to unity and the sum of contributions is the market-sector total as shown in row 2 of table 12 above. The middle panels show the capital and labour contributions which again sum to the market sector total. The right panel shows industry AlnTFP and each industries contribution to the aggregate. Finally, as a memo item, column 13 shows actual hours worked as a fraction of the total. The lower panel shows the contributions as a proportion of the total.
What do we learn about the economy from this table? Let us start by considering manufacturing. As the top panel shows, column 1, its value added weight in the market sector is 18%, although column 13 shows the employment share is 15% (note these are higher than the shares in the whole economy which are the weights usually quoted). Column 5 shows that the contribution of manufacturing capital deepening to aggregate capital deepening is 0.27%pa, which is, lower panel, 20% of the total. Column 8 shows that the contribution of intangibles in manufacturing is significant: 35% (see lower panel) of the total intangible contribution. Column 10 shows the contribution of labour quality, 19%, and column 12 shows the industry made the largest contribution to TFP, of 0.25% pa, with aggregate TFP estimated negative at -0.34% pa. Thus manufacturing, accounting for 18% of value added and 15% of employment, accounts for 35% of total intangible capital deepening and made by far the largest contribution to aggregate AlnTFP. The importance of intangible investment in manufacturing of course suggests that a significant component of the activity of firms allocated to manufacturing in the SIC is the production of knowledge assets, which might be regarded as producing a service.
What of other industries? The other large contribution of capital deepening is from the distributive trades, which contributed 21% of aggregate capital deepening. Within this, the industry contributed 17% of IT capital deepening, 25% of other tangible capital deepening, and 12% of intangible capital deepening. On intangible capital deepening, 18% is from information and communication and 14% from financial services. Overall therefore, manufacturing, information & communication and financial services together account for more than two-thirds of intangible capital deepening (these sectors make up only a quarter of hours worked). Note that the employment shares for information & communication and financial services are just 6% and 5% respectively.
On AlnTFP, as noted the largest contribution comes from manufacturing. Although TFP in information & communication is also high, its weight in value-added is half that in manufacturing, so its contribution to the aggregate is much smaller.
Finally, one might summarise these results by asking what industries account for the contribution of innovation to AlnV/H? If we define innovation as the contributions of AlnTFP+s∆lnK/H(intang)+s△lnL/H to the total, we see that manufacturing accounts for 99%, information & communication 47%, professional & administrative services 30%, finance 18%, and distribution 13%.. All other industries make a negative contribution, with the largest negative contribution being in agriculture; mining & utilities (-63%).
This same data is also presented in graphical form below which highlights the contribution of manufacturing to total UK market sector innovation.
Figure 8: Industry contributions to UK market sector innovation, 2000-11
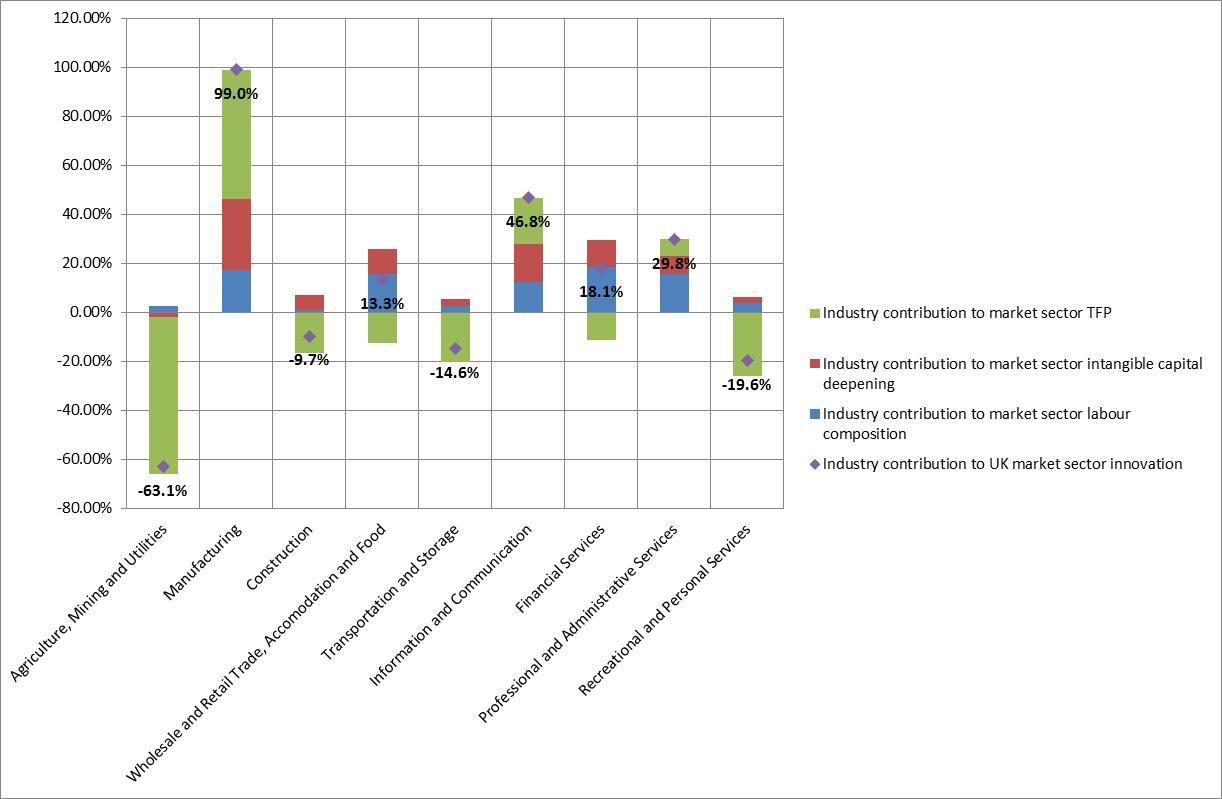
Note to figure: data as presented in Table 14. All figures are weighted annual averages. Contributions are the product of the weights and the input growth averaged over years, where input growth is in per hour terms.
One important question, we believe, is to ask how these results compare to those without intangibles? The results without intangibles are set out in the appendix, but we just note here that without intangibles, AlnTFP in financial services is estimated positive at 0.32% pa compared to -0.12% pa with. Similarly, in manufacturing, AlnTFP is 1.78% pa without, and 1.34% with. In information & communication, it is 2.25% pa without and 0.96% pa with. So in these knowledge-intensive industries, the exclusion of intangibles means that AlnTFP is very much overstated.
8 Conclusions
This paper provides an update of the NESTA Innovation Index, combining a number of threads of recent work on the rise of the knowledge economy. First, analysis of ICT suggested that computers need complementary investment in organizations, human capital and reputation. Second, a growing perception that the knowledge economy is becoming increasingly important has led to the treating of software and R&D (upcoming) in the national accounts as investment. To study the questions that arise we have used the CHS framework, extended its measurement method somewhat using new data sets and a new micro survey, and implemented it on UK data for all intangibles in addition to R&D and software. We have documented intangible investment in the UK and tried to see how it contributes to economic growth. We find the following.
1. Investment in knowledge.
- Investment in knowledge, which we call intangible assets, is now greater than investment in tangible assets, at around, in 2011, £127bn and £88bn respectively, 12% and 8% of (adjusted) MSGVA, quantifying the UK move to a knowledge-based economy.
- In 2011, R&D was about 13% of total intangible investment, software 19%, design 10%, and the largest categories training and organizational capital (both 20%).
- The most intangible-intensive industry is information & communication (intangible investment as a proportion of value added =19%), closely followed by manufacturing (=17%). Financial services invests around 5:1 on intangibles:tangibles. In manufacturing and information & communication, that ratio is around 3:1.
- Relative to the national accounts, the effect of treating additional intangible expenditure as investment is to raise growth in market sector value added in the 1990s and early 2000s (the internet investment boom), but lower it in the late 2000s.
2. Contribution to growth, 2005-11.
- For the most recent period of 2005-2011, intangible capital deepening accounts for 14% of growth in market sector value added per hour (AlnV/H), a larger contribution than IT tangibles (computer hardware) (8%). The late 2000s have seen a strong negative contribution from AlnTFP, driven by large declines in the 2008-9 recession.
- With (without) intangibles AlnV/H is 0.4%pa (0.56%pa) and AlnTFP is -- 0.90%pa (-0.97%pa). Thus, for this latest period, adding intangibles to growth accounting raises AlnTFP and lowers AlnV/H. Note that the latest period therefore stands out, as in previous periods we typically find the reverse.
- Capitalising R&D relative to the current practice of capitalizing software (plus mineral exploration and artistic originals) adds 0.05% to input growth and increases AlnTFP by 0.01%. AlnV/H increases by 0.02%.
3. Contribution by industries to growth.
The main finding here is the importance of manufacturing and information& communication, which together account for 146% of innovation in the UK market sector (many industries make a negative contribution, hence a figure greater than 100%), measured as intangible capital deepening plus TFP plus labour quality. This is due to a combination of their high intangible investment (together 54% of total intangible contribution) and TFP, even though each are comparatively small sectors in terms of employment share (manufacturing has a share of 17% of market sector hours worked, whilst the share for information & communication is just 6%).
In future work, we hope to improve the measures of all variables. We also wish to explore policy and the total contributions of various assets by looking for spillovers. So, for example, it is quite conceivable that R&D spillovers will greatly amplify the contribution of R&D.
References
Acheson, J (2011), “Quality-adjusted labour input: new quarterly estimates for 1993 to 2009 and annual estimates from 1970", Economic and Labour Market Review, Palgrave Macmillan Journals, vol. 5(4), pages 22-46, April
Awano, G., Franklin, M., Haskel, J., and Kastrinaki, Z, (2010). "Measuring investment in intangible assets in the UK: results from a new survey," Economic and Labour Market Review, Palgrave Macmillan Journals, vol. 4(7), pages 66-71, July.
Barnett (2009), UK Intangible Investment: Evidence from the Innovation Index Survey
Basu, S., J. G. Fernald, et al. (2004). "The case of the missing productivity growth, or does information technology explain why productivity accelerated in the United States but not in the United Kingdom?" Nber Macroeconomics Annual 2003 18: 9-+.
Brynjolfsson, E. and L. M. Hitt (2000). "Beyond computation: Information technology, organizational transformation and business performance." Journal of Economic Perspectives 14(4): 23-48.
Clayton, T., Dal Borgo, M. and Haskel, J. (2008), An Innovation Index Based on Knowledge Capital Investment: Definition and Results for the UK Market Sector, Draft Report for NESTA Innovation Index 2008 Summer ProjectBarnett, 209,
Clayton, T., Dal Borgo, M., and Haskel, J., (2008), “An Innovation Index Based on Knowledge Capital Investment: Definition and Results for the UK Market Sector", Report for NESTA, http://www.coinvest.org.uk/bin/view/CoInvest/CoinvestInnovIndex
Corrado, C. A., Hulten, C. R. and Sichel, D. E. (2005). Measuring Capital and Technology: An Expanded Framework. In Measuring Capital in the New Economy, Vol. 65 (Eds, Corrado, C. A., Haltiwanger, J. C. and Sichel, D. E.). Chicago: The University of Chicago Press
Corrado, C., Hulten, C. and Sichel, D. (2009). “Intangible Capital and US Economic Growth". The Review of Income and Wealth, (55:3), pp. 661-685.
Domar, E. D. (1961). On the Measurement of Technological Change. The Economic Journal 71, 709-729.
EU KLEMS Database, March 2008, see Marcel Timmer, Mary O'Mahony & Bart van Ark, The EU KLEMS Growth and Productivity Accounts: An Overview, University of Groningen & University of Birmingham; downloadable at http://www.euklems.net
Fukao, K., T. Miyagawa, et al. (2009). "Intangible Investment in Japan: Measurement and Contribution to Economic Growth." Review of Income and Wealth 55(3): 717-736.
Galindo Rueda, F., Haskel, J., and Pesole, A., (2008), “How much does the UK spend on Design", working paper, http://www.ceriba.org.uk.
Jorgenson, D,. Ho, M, Samuels, J. Stiroh, K., (2007), “Industry Origins of the American Productivity Resurgence, Economic Systems Research, Vol. 19, No. 3, September 2007, pp. 229-252.
Franklin, M. and Mistry, P. (2013), Quality-adjusted Labour Input: Estimates to 2011 and First Estimates to 2012, http://www.ons.gov.uk/ons/dcp171766_317119.pdf
Gill, V, and Haskel, J, (2008), “Industry-level Expenditure on Intangible Assets in the UK”, working paper, http://www.coinvest.org.uk/bin/view/CoInvest/CoinvestGilHaspaper
Goodridge, P (2014), “Film, Television & Radio, Books, Music and Art: Estimating UK Investment in Artistic Originals", https://spiral.imperial.ac.uk:8443/bitstream/10044/1/12918/2/Goodridge%202014-02.pdf
Goodridge, P., Haskel, J. and Wallis, G. (2012). “UK Innovation Index: productivity and growth in UK industries",
Goodridge, P., Haskel, J. and Wallis, G. (2012). “The Contribution of the Internet and Telecommunications Capital to UK Market Sector Growth”, available on request.
Goodridge, P., Haskel, J. and Wallis, G. (2013). “Can intangible investment explain the UK productivity puzzle?”, National Institute Economic Review, No, 224, May 2013
Hulten, C.R. (1978), "Growth Accounting with Intermediate Inputs," Review of Economic Studies,. 45, October 1978, 511-518.
Hulten, C R. (2001). “Total Factor Productivity: A Short Biography." In Studies in Income and Wealth Volume 65, New Developments in Productivity Analysis, Chicago: The University of Chicago Press.Jorgenson, D. W., (2007). Productivity. Cambridge, Mass.: MIT Press.
Jona-Lasinio, C., Iommi, M. and Roth, F. (2009). “Intangible Capital and Innovations: Drivers of Growth and Location in the EU”. INNODRIVE, Deliverable No. 15, WP9.
Jorgenson, Dale W. and Zvi Griliches, "The Explanation of Productivity Change," Review of Economic Studies, 34, July 1967, 349-83.
Jorgenson, D. W., Ho, M. S., Samuels, J. D. and Stiroh, K. J. (2007). Industry Origins of the American Productivity Resurgence. Economic Systems Research, Taylor and Francis Journals 19, 229-252.
Marrano, M. G., Haskel, J. and Wallis, G. (2009). What Happened to the Knowledge Economy? ICT, Intangible Investment and Britain's Productivity Record Revisited. The Review of Income and Wealth Series 55, Number 3, September.
O'Mahony, M. and M.P. Timmer (2009), “Output, Input and Productivity Measures at the Industry Level: the EU KLEMS Database", Economic Journal, 119(538), pp. F374-F403
O'Mahony, M., and Peng, L, (2010), Workforce Training, Intangible Investments and Productivity in Europe: Evidence from EU KLEMS and the EU LFS”, Working Paper.
OECD (2002), Oslo Manual: Guidelines for Collecting and Interpreting Innovation Data, 3rd Edition, http://www.oecd.org/document/23/0,3343,en_2649_34273_35595607_1_1_1_37417,00.html
Office for National Statistics, “Annual Survey of Hours and Earnings, 1997-2011: Secure Data Service Access [computer file]. Colchester, Essex: UK Data Archive [distributor], April 2013. SN:6689"
Office for National Statitics, "National Employers Skills Survey: Secure Data Service Access [computer file]. Colchester, Essex: UK Data Archive [distributor], June 2011. SN:6705"
Oulton, N. and Wallis G. (2014). "An Integrated Set of Estimates of Capital Stocks and Services for the United Kingdom: 19501-2013" Paper for the 33rd General Conference of the IARIW, Rotterdam, August 24-30, 2014
Oulton, N and Srinivasan. S., (2003), “Capital Stocks, Capital Services, and Depreciation: An Integrated Framework,” Bank of England Working Paper, No. 192.
Timmer, M.P., M. O'Mahony, B. van Ark and R. Inklaar (2010), Economic Growth in Europe, Cambridge University Press.
Tufan,o, P., (1998), “"Financial Innovation and First-Mover Advantages," Journal of Financial Economics 25 (1989), 213-240
van Ark, B. and Hulten, C. (2007). “Innovation, Intangibles and Economic Growth: Towards a Comprehensive Accounting of the Knowledge Economy". Yearbook on Productivity 2007, Statistics Sweden, pp. 127-146.
van Rooijen-Horsten, M., van den Bergen, D. and Tanriseven, M. (2008). Intangible Capital in the Netherlands: A Benchmark. Available at http://www.cbs.nl/NR/rdonlyres/DE0167DE-BFB8-4EA1-A55C-FF0A5AFCBA32/0/200801x10pub.pdf
Wallis, G. (2012) "Essays in Understanding Investment". http://discovery.ucl.ac.uk/1369637/1/GW_Thesis.pdf
Appendix Table 1: Excluding intangibles, industry contributions to growth in aggregate value added, capital deepening, labour quality and TFP (growth rates and contributions are %pa per employee hour)
| Industry |
VA weight |
DlnVA/H |
Contrib to agg va/h |
Cap weight |
Contrib to agg K/H |
Contrib to IT dlnK/H |
Contrib to agg non-IT dlnK/H |
Contrib to agg Intan/H |
Lab weight |
Contrib to agg lab qual per hr |
DlnTFP |
Contrib to agg TFP |
Memo: % total hrs |
| Agriculture, Mining & Utilities |
0.08 |
-3.83 |
-0.29 |
0.05 |
0.06 |
0.01 |
0.05 |
|
0.02 |
0.01 |
-4.72 |
-0.36 |
4% |
| Manufacturing |
0.17 |
3.20 |
0.55 |
0.04 |
0.15 |
0.02 |
0.13 |
|
0.13 |
0.09 |
1.78 |
0.31 |
15% |
| Construction |
0.09 |
1.16 |
0.10 |
0.03 |
0.17 |
0.01 |
0.16 |
|
0.06 |
0.01 |
-0.72 |
-0.07 |
11% |
| Wholesale & Retail Trade, Accommodation & Food |
0.20 |
1.58 |
0.32 |
0.05 |
0.27 |
0.02 |
0.25 |
|
0.14 |
0.08 |
-0.18 |
-0.03 |
26% |
| Transportation & Storage |
0.07 |
-0.19 |
-0.01 |
0.01 |
0.07 |
0.01 |
0.07 |
|
0.05 |
0.01 |
-1.50 |
-0.10 |
7% |
| Information & Communication |
0.08 |
3.49 |
0.29 |
0.02 |
0.04 |
0.00 |
0.03 |
|
0.06 |
0.07 |
2.25 |
0.19 |
6% |
| Financial Services |
0.11 |
2.37 |
0.20 |
0.05 |
0.13 |
0.03 |
0.11 |
|
0.06 |
0.10 |
0.32 |
-0.03 |
5% |
| Professional & Administrative Services |
0.16 |
1.96 |
0.31 |
0.04 |
0.15 |
0.00 |
0.14 |
|
0.12 |
0.08 |
0.50 |
0.08 |
20% |
| Recreational & Personal Services |
0.04 |
-0.06 |
0.00 |
0.01 |
0.10 |
0.01 |
0.09 |
|
0.03 |
0.02 |
-2.78 |
-0.12 |
6% |
| Sum |
1.00 |
|
1.48 |
|
1.12 |
0.10 |
1.03 |
|
|
0.48 |
|
-0.12 |
100% |
| %ages of summed contributions |
|
|
|
|
|
|
|
|
|
|
|
|
Memo: % total hrs (8+10+12) |
| Agriculture, Mining & Utilities |
|
|
-19% |
|
5% |
9% |
5% |
|
|
3% |
|
|
-96% |
| Manufacturing |
|
|
37% |
|
13% |
18% |
13% |
|
|
19% |
|
|
114% |
| Construction |
|
|
7% |
|
15% |
6% |
16% |
|
|
1% |
|
|
-19% |
| Wholesale & Retail Trade, Accommodation & Food |
|
|
22% |
|
24% |
17% |
24% |
|
|
17% |
|
|
15% |
| Transportation & Storage |
|
|
-1% |
|
6% |
6% |
6% |
|
|
3% |
|
|
-23% |
| Information & Communication |
|
|
20% |
|
3% |
4% |
3% |
|
|
14% |
|
|
71% |
| Financial Services |
|
|
14% |
|
12% |
26% |
10% |
|
|
21% |
|
|
21% |
| Professional & Administrative Services |
|
|
21% |
|
13% |
5% |
14% |
|
|
18% |
|
|
46% |
| Recreational & Personal Services |
|
|
0% |
|
9% |
10% |
9% |
|
|
4% |
|
|
-29% |
| Sum |
|
|
100% |
|
100% |
100% |
100% |
|
|
100% |
|
|
100% |
Note: See notes to Table 14. All figures are annual averages. Weights depend on the industry share in aggregate value-added and the input share in industry value-added. Contributions are the product of the weights and the input growth averaged over years. Employment is the share of the industry's hours worked over total hours worked by persons engaged. Column 5 is the sum of columns 6 and 7. Column 8 blank since no intangibles are included. Source: authors' calculations
Appendix 2: Industry contributions to market sector growth: 2000-05 and 2005-11
In the main text we note that, in this report, industry contributions to market sector innovation are more difficult to interpret due to TFP being estimated as negative over the period studied (2000-2011). Therefore, in this Appendix, we break out the industry data into two periods: 2000-05 and 2005-11. This also allows us to comment on the observed slowdown in TFP, usually termed 'the productivity puzzle', and in particular, which industries have contributed to that slowdown.
In Appendix Table 2A we present industry contributions for the period 2000 to 2005. We note the following:
- Aggregate market sector TFP is estimated as 0.57% pa
- Within that, we have the following contributions from industries:
- Manufacturing: 0.41% pa
- Financial Services: 0.17% pa
- Information & Communication: 0.12% pa
- Wholesale & Retail; Food & Accommodation: 0.12% pa
In Appendix Table 2B we present the same contributions for the period 2005 to 2011. We note:
- Aggregate market sector TFP is estimated as -1.09% pa
- Within that:
- Manufacturing: 0.11% pa
- Financial Services: -0.24% pa
- Information & Communication: 0.07% pa
- Wholesale & Retail; Food & Accommodation: -0.21% pa
These numbers document the slowdown in TFP at the aggregate and industry level. In Appendix Table 2C we estimate the decline in the TFP contribution for each industry, and so estimate the contribution of each industry to the slowdown. Column 4 of that table shows that, of the aggregate TFP slowdown of 1.66% pa:
- Financial Services contributed 25%
- Wholesale & Retail; Food & Accommodation contributed 20%
- Agriculture, Mining, Utilities contributed 19%
- Manufacturing contributed 18%
- Information & Communication contributed just 3%
Therefore one-quarter of the slowdown in TFP can be explained by financial services and the impact of the financial crisis in that industry. One-fifth can be explained by the distributive trades, a sector which also has a weight of one-fifth in value-added. Another fifth can be explained by the slowdown in Agriculture, Mining and Utilities. We note that TFP in that sector is affected by output from North Sea Oil which has slowed in recent years. Perhaps surprisingly, even though manufacturing TFP has remained positive, it has slowed substantially and so that sector also contributes more than one-sixth of the slowdown. Finally we note that Information & Communication makes a very small contribution to the TFP slowdown, highlighting the strength of productivity in this industry over the period studied.
Appendix Table 2A: Including intangibles, industry contributions to growth in aggregate value added, capital deepening, labour quality and TFP (growth rates and contributions are %pa per employee hour): 2000-2005
| Industry |
VA weight |
DlnVA/H |
Contrib to agg va/h |
Cap weight |
Contrib to agg K/H |
Contrib to IT dlnK/H |
Contrib to agg non-IT dlnK/H |
Contrib to agg Intan/H |
Lab weight |
Contrib to agg lab qual per hr |
DlnTFP |
Contrib to agg TFP |
Memo: % total hrs |
| Agriculture, Mining & Utilities |
0.07 |
0.00 |
0.01 |
0.05 |
0.13 |
0.02 |
0.11 |
0.01 |
0.02 |
0.01 |
-1.85 |
-0.13 |
4% |
| Manufacturing |
0.19 |
4.67 |
0.90 |
0.07 |
0.41 |
0.03 |
0.16 |
0.22 |
0.12 |
0.08 |
2.14 |
0.41 |
17% |
| Construction |
0.09 |
1.40 |
0.11 |
0.04 |
0.18 |
0.01 |
0.14 |
0.03 |
0.05 |
0.00 |
-0.68 |
-0.06 |
10% |
| Wholesale & Retail Trade, Accommodation & Food |
0.20 |
2.51 |
0.50 |
0.07 |
0.33 |
0.03 |
0.22 |
0.09 |
0.13 |
0.05 |
0.60 |
0.12 |
27% |
| Transportation & Storage |
0.06 |
1.46 |
0.09 |
0.02 |
0.10 |
0.01 |
0.08 |
0.02 |
0.05 |
0.00 |
-0.05 |
-0.01 |
7% |
| Information & Communication |
0.09 |
4.20 |
0.40 |
0.04 |
0.23 |
0.01 |
0.07 |
0.15 |
0.05 |
0.06 |
1.21 |
0.12 |
6% |
| Financial Services |
0.09 |
4.47 |
0.42 |
0.05 |
0.20 |
0.04 |
0.07 |
0.09 |
0.05 |
0.05 |
1.71 |
0.17 |
5% |
| Professional & Administrative Services |
0.15 |
2.11 |
0.33 |
0.05 |
0.21 |
0.01 |
0.13 |
0.08 |
0.10 |
0.04 |
0.47 |
0.07 |
19% |
| Recreational & Personal Services |
0.04 |
0.83 |
0.04 |
0.02 |
0.15 |
0.02 |
0.11 |
0.02 |
0.03 |
0.01 |
-2.75 |
-0.12 |
6% |
| Sum |
1.00 |
|
2.80 |
|
1.94 |
0.15 |
1.08 |
0.70 |
|
0.29 |
|
0.57 |
100% |
| %ages of summed contributions |
|
|
|
|
|
|
|
|
|
|
|
|
Memo: % total hrs (8+12)/(S8+S12) |
(8+10+12) |
| Agriculture, Mining & Utilities |
|
|
0% |
|
7% |
10% |
10% |
1% |
|
3% |
|
-22% |
4% |
-7% |
| Manufacturing |
|
|
32% |
|
21% |
19% |
15% |
31% |
|
29% |
|
71% |
17% |
45% |
| Construction |
|
|
4% |
|
9% |
4% |
13% |
4% |
|
0% |
|
-11% |
10% |
-2% |
| Wholesale & Retail Trade, Accommodation & Food |
|
|
18% |
|
17% |
17% |
20% |
12% |
|
17% |
|
21% |
27% |
16% |
| Transportation & Storage |
|
|
3% |
|
5% |
6% |
7% |
2% |
|
-1% |
|
-1% |
7% |
0% |
| Information & Communication |
|
|
14% |
|
12% |
5% |
6% |
21% |
|
19% |
|
20% |
6% |
21% |
| Financial Services |
|
|
15% |
|
11% |
23% |
7% |
13% |
|
17% |
|
30% |
5% |
20% |
| Professional & Administrative Services |
|
|
12% |
|
11% |
4% |
12% |
11% |
|
13% |
|
13% |
19% |
12% |
| Recreational & Personal Services |
|
|
1% |
|
8% |
13% |
10% |
3% |
|
3% |
|
-21% |
6% |
-6% |
| Sum |
|
|
100% |
|
100% |
100% |
100% |
100% |
|
100% |
|
100% |
100% |
100% |
Note: See notes to Table 14. All figures are annual averages. Weights depend on the industry share in aggregate value-added and the input share in industry value-added. Contributions are the product of the weights and the input growth averaged over years. Employment is the share of the industry's hours worked over total hours worked by persons engaged. Column 5 is the sum of columns 6 and 7. Column 8 blank since no intangibles are included. Source: authors' calculations
Appendix Table 2B: Including intangibles, industry contributions to growth in aggregate value added, capital deepening, labour quality and TFP (growth rates and contributions are %pa per employee hour): 2005-2011
| Industry |
VA weight |
DlnVA/H |
Contrib to agg va/h |
Cap weight |
Contrib to agg K/H |
Contrib to IT dlnK/H |
Contrib to agg non-IT dlnK/H |
Contrib to agg Intan/H |
Lab weight |
Contrib to agg lab qual per hr |
DlnTFP |
Contrib to agg TFP |
Memo: % total hrs |
| Agriculture, Mining & Utilities |
0.07 |
-6.47 |
-0.46 |
0.05 |
-0.04 |
0.00 |
-0.02 |
-0.02 |
0.02 |
0.02 |
-6.19 |
-0.44 |
4% |
| Manufacturing |
0.16 |
2.10 |
0.34 |
0.06 |
0.15 |
0.00 |
0.08 |
0.06 |
0.10 |
0.08 |
0.67 |
0.11 |
14% |
| Construction |
0.09 |
0.87 |
0.07 |
0.04 |
0.15 |
0.00 |
0.12 |
0.03 |
0.05 |
0.01 |
-0.93 |
-0.09 |
11% |
| Wholesale & Retail Trade, Accommodation & Food |
0.19 |
0.69 |
0.13 |
0.07 |
0.25 |
0.01 |
0.23 |
0.02 |
0.12 |
0.09 |
-1.09 |
-0.21 |
26% |
| Transportation & Storage |
0.06 |
-1.22 |
-0.07 |
0.02 |
0.07 |
0.00 |
0.06 |
0.01 |
0.04 |
0.03 |
-2.76 |
-0.17 |
7% |
| Information & Communication |
0.09 |
1.62 |
0.15 |
0.04 |
0.02 |
0.00 |
0.01 |
0.00 |
0.05 |
0.06 |
0.75 |
0.07 |
6% |
| Financial Services |
0.13 |
0.17 |
-0.01 |
0.07 |
0.12 |
0.01 |
0.09 |
0.02 |
0.06 |
0.12 |
-1.63 |
-0.24 |
5% |
| Professional & Administrative Services |
0.16 |
1.33 |
0.21 |
0.06 |
0.11 |
0.00 |
0.11 |
0.00 |
0.11 |
0.10 |
-0.03 |
0.00 |
21% |
| Recreational & Personal Services |
0.04 |
-0.63 |
-0.03 |
0.02 |
0.07 |
0.00 |
0.07 |
0.00 |
0.03 |
0.03 |
-2.76 |
-0.12 |
6% |
| Sum |
1.00 |
|
0.34 |
|
0.90 |
0.03 |
0.76 |
0.12 |
|
0.53 |
|
-1.09 |
100% |
| %ages of summed contributions |
|
|
|
|
|
|
|
|
|
|
|
|
Memo: % total hrs |
| Agriculture, Mining & Utilities |
|
|
-138% |
|
-4% |
4% |
-2% |
-16% |
|
3% |
|
|
4% |
| Manufacturing |
|
|
102% |
|
17% |
15% |
11% |
54% |
|
15% |
|
|
14% |
| Construction |
|
|
21% |
|
17% |
12% |
17% |
22% |
|
2% |
|
|
11% |
| Wholesale & Retail Trade, Accommodation & Food |
|
|
40% |
|
28% |
18% |
30% |
13% |
|
17% |
|
|
26% |
| Transportation & Storage |
|
|
-22% |
|
7% |
4% |
7% |
9% |
|
5% |
|
|
7% |
| Information & Communication |
|
|
43% |
|
2% |
5% |
2% |
4% |
|
12% |
|
|
6% |
| Financial Services |
|
|
-2% |
|
13% |
33% |
12% |
14% |
|
22% |
|
|
5% |
| Professional & Administrative Services |
|
|
63% |
|
13% |
11% |
15% |
-2% |
|
20% |
|
|
21% |
| Recreational & Personal Services |
|
|
-8% |
|
8% |
-1% |
9% |
1% |
|
5% |
|
|
6% |
| Sum |
|
|
100% |
|
100% |
100% |
100% |
100% |
|
100% |
|
|
100% |
Note: See notes to Table 14. All figures are annual averages. Weights depend on the industry share in aggregate value-added and the input share in industry value-added. Contributions are the product of the weights and the input growth averaged over years. Employment is the share of the industry's hours worked over total hours worked by persons engaged. Column 5 is the sum of columns 6 and 7. Column 8 blank since no intangibles are included. Source: authors' calculations
Appendix Table 2C: Including intangibles, industry contributions to growth in TFP
| Industry |
Industry contribution to ΔlnTFP: 2000-05 |
Industry contribution to ΔlnTFP: 2005-11 |
ΔlnTFP: Slowdown |
Contribution to ΔlnTFP slowdown |
| Agriculture, Mining and Utilities |
-0.13 |
-0.44 |
0.32 |
19% |
| Manufacturing |
0.41 |
0.11 |
0.29 |
18% |
| Construction |
-0.06 |
-0.09 |
0.03 |
2% |
| Wholesale and Retail Trade, Accomodation and Food |
0.12 |
-0.21 |
0.33 |
20% |
| Transportation and Storage |
-0.01 |
-0.17 |
0.16 |
10% |
| Information and Communication |
0.12 |
0.07 |
0.05 |
3% |
| Financial Services |
0.17 |
-0.24 |
0.41 |
25% |
| Professional and Administrative Services |
0.07 |
0.00 |
0.08 |
5% |
| Recreational and Personal Services |
-0.12 |
-0.12 |
0.00 |
0% |
| Market Sector |
0.57 |
-1.09 |
1.66 |
100% |
Notes: Column 1 is the industry contribution to aggregate TFP in 2000-05, that is industry (value-added based) TFP times the industry share in value-added. Column 2 is the industry contribution to aggregate TFP in 2005-11. Column 3 is the slowdown in the industry TFP contribution, that is, Column 2 minus Column 1. Column 4 is the industry contribution to the market sector slowdown, that is, the industry figure in Column 3 as a share of the aggregate slowdown (final row, Column 3).
Appendix 3: Annual growth-accounting results by industry
For completeness the following table presents annual growth-accounting results by industry. We stress that care should be taken in interpreting annual changes in contributions and the innovation index, but feel such data are useful for understanding the period averages presented in the main text.
| Industry |
Year |
DlnV/H |
sDln(K/H) |
sDln(K/H)IT |
sDln(K/H)othtan |
sDln(K/H)intan |
sDln(L/H) |
DlnTFP |
| AgMinUtil |
2001 |
5.08 |
4.90 |
0.32 |
4.42 |
0.17 |
0.34 |
-0.17 |
|
2002 |
4.67 |
3.40 |
0.29 |
2.96 |
0.15 |
0.50 |
0.78 |
|
2003 |
-1.99 |
1.73 |
0.23 |
1.33 |
0.17 |
0.48 |
-4.20 |
|
2004 |
-2.32 |
1.39 |
0.15 |
0.98 |
0.26 |
0.00 |
-3.71 |
|
2005 |
-5.44 |
-2.78 |
0.10 |
-2.51 |
-0.37 |
-0.71 |
-1.94 |
|
2006 |
-4.48 |
0.14 |
0.09 |
0.12 |
-0.08 |
0.43 |
-5.04 |
|
2007 |
-0.53 |
2.40 |
0.18 |
2.15 |
0.07 |
0.28 |
-3.22 |
|
2008 |
-6.08 |
-0.50 |
0.06 |
-0.28 |
-0.28 |
0.01 |
-5.58 |
|
2009 |
-13.43 |
-2.32 |
-0.06 |
-1.68 |
-0.57 |
-0.22 |
-10.89 |
|
2010 |
-7.60 |
-3.33 |
-0.07 |
-2.65 |
-0.61 |
0.51 |
-4.78 |
|
2011 |
-6.73 |
0.53 |
-0.10 |
0.76 |
-0.14 |
0.35 |
-7.62 |
| Industry |
Year |
DlnV/H |
sDln(K/H) |
sDln(K/H)IT |
sDln(K/H)othtan |
sDln(K/H)intan |
sDln(L/H) |
DlnTFP |
| Mfr |
2001 |
3.70 |
2.31 |
0.31 |
0.80 |
1.20 |
0.10 |
1.29 |
|
2002 |
3.93 |
2.48 |
0.14 |
0.99 |
1.36 |
0.43 |
1.01 |
|
2003 |
5.70 |
2.54 |
0.11 |
1.10 |
1.33 |
0.78 |
2.39 |
|
2004 |
6.26 |
1.75 |
0.08 |
0.72 |
0.95 |
0.28 |
4.22 |
|
2005 |
3.77 |
1.39 |
0.06 |
0.59 |
0.74 |
0.62 |
1.76 |
|
2006 |
3.91 |
0.80 |
0.02 |
0.33 |
0.46 |
0.17 |
2.94 |
|
2007 |
3.57 |
0.91 |
0.04 |
0.48 |
0.39 |
0.36 |
2.31 |
|
2008 |
1.67 |
1.66 |
0.05 |
0.91 |
0.70 |
1.05 |
-1.04 |
|
2009 |
-2.09 |
2.54 |
0.02 |
1.36 |
1.16 |
0.07 |
-4.70 |
|
2010 |
3.96 |
-0.17 |
-0.01 |
0.01 |
-0.17 |
0.81 |
3.32 |
|
2011 |
1.55 |
-0.14 |
0.04 |
-0.05 |
-0.14 |
0.51 |
1.19 |
| Industry |
Year |
DlnV/H |
sDln(K/H) |
sDln(K/H)IT |
sDln(K/H)othtan |
sDln(K/H)intan |
sDln(L/H) |
DlnTFP |
| Constr |
2001 |
0.39 |
2.21 |
0.03 |
1.91 |
0.27 |
0.03 |
-1.85 |
|
2002 |
4.81 |
3.47 |
0.12 |
2.91 |
0.44 |
-0.33 |
1.68 |
|
2003 |
3.97 |
3.11 |
0.09 |
2.55 |
0.47 |
0.18 |
0.69 |
|
2004 |
3.40 |
1.36 |
0.08 |
0.87 |
0.41 |
0.39 |
1.65 |
|
2005 |
-5.56 |
0.24 |
0.04 |
0.04 |
0.15 |
-0.23 |
-5.57 |
|
2006 |
-0.32 |
1.39 |
0.03 |
0.99 |
0.37 |
0.31 |
-2.01 |
|
2007 |
-0.56 |
1.16 |
0.08 |
0.81 |
0.27 |
-0.33 |
-1.39 |
|
2008 |
-0.47 |
2.63 |
0.08 |
1.93 |
0.62 |
0.03 |
-3.13 |
|
2009 |
-8.63 |
2.37 |
0.02 |
1.90 |
0.45 |
1.06 |
-12.06 |
|
2010 |
12.02 |
1.97 |
0.03 |
1.78 |
0.16 |
-0.15 |
10.20 |
|
2011 |
3.18 |
0.70 |
-0.03 |
0.91 |
-0.18 |
-0.33 |
2.81 |
| Industry |
Year |
DlnV/H |
sDln(K/H) |
sDln(K/H)IT |
sDln(K/H)othtan |
sDln(K/H)intan |
sDln(L/H) |
DlnTFP |
| RtAcc |
2001 |
1.99 |
1.01 |
0.13 |
0.59 |
0.29 |
0.21 |
0.77 |
|
2002 |
4.45 |
1.81 |
0.18 |
1.07 |
0.56 |
0.09 |
2.55 |
|
2003 |
1.92 |
1.08 |
0.17 |
0.46 |
0.45 |
0.47 |
0.37 |
|
2004 |
2.81 |
2.12 |
0.10 |
1.55 |
0.47 |
0.11 |
0.58 |
|
2005 |
1.37 |
2.28 |
0.06 |
1.81 |
0.41 |
0.38 |
-1.29 |
|
2006 |
4.46 |
2.07 |
0.04 |
1.71 |
0.32 |
0.51 |
1.88 |
|
2007 |
3.49 |
1.63 |
0.08 |
1.43 |
0.12 |
0.36 |
1.50 |
|
2008 |
-3.09 |
1.36 |
0.05 |
1.18 |
0.12 |
-0.01 |
-4.43 |
|
2009 |
-2.12 |
1.85 |
0.00 |
1.57 |
0.29 |
0.78 |
-4.75 |
|
2010 |
1.33 |
0.59 |
-0.01 |
0.77 |
-0.16 |
0.63 |
0.11 |
|
2011 |
0.07 |
0.34 |
0.00 |
0.53 |
-0.19 |
0.58 |
-0.85 |
| Industry |
Year |
DlnV/H |
sDln(K/H) |
sDln(K/H)IT |
sDln(K/H)othtan |
sDln(K/H)intan |
sDln(L/H) |
DlnTFP |
| Tran |
2001 |
-3.38 |
1.27 |
0.31 |
0.76 |
0.20 |
-0.44 |
-4.22 |
|
2002 |
-0.99 |
2.57 |
0.10 |
2.21 |
0.26 |
0.05 |
-3.61 |
|
2003 |
3.73 |
2.29 |
0.14 |
1.79 |
0.36 |
0.17 |
1.27 |
|
2004 |
5.85 |
1.66 |
0.06 |
1.13 |
0.47 |
0.20 |
3.99 |
|
2005 |
2.09 |
0.06 |
0.09 |
-0.09 |
0.07 |
-0.28 |
2.30 |
|
2006 |
-0.94 |
0.65 |
0.01 |
0.51 |
0.14 |
-0.45 |
-1.14 |
|
2007 |
4.50 |
1.82 |
0.12 |
1.35 |
0.34 |
0.73 |
1.95 |
|
2008 |
-2.35 |
1.18 |
0.04 |
1.00 |
0.14 |
0.99 |
-4.53 |
|
2009 |
-10.45 |
0.98 |
-0.05 |
0.91 |
0.12 |
-0.27 |
-11.16 |
|
2010 |
0.55 |
1.73 |
-0.02 |
1.54 |
0.20 |
0.64 |
-1.82 |
|
2011 |
1.35 |
0.24 |
0.02 |
0.12 |
0.10 |
0.96 |
0.15 |
| Industry |
Year |
DlnV/H |
sDln(K/H) |
sDln(K/H)IT |
sDln(K/H)othtan |
sDln(K/H)intan |
sDln(L/H) |
DlnTFP |
| InfoCom |
2001 |
3.96 |
2.45 |
0.01 |
0.81 |
1.64 |
0.18 |
1.33 |
|
2002 |
2.13 |
3.20 |
0.17 |
1.09 |
1.94 |
1.31 |
-2.38 |
|
2003 |
6.08 |
2.57 |
-0.08 |
1.01 |
1.64 |
0.18 |
3.33 |
|
2004 |
6.95 |
3.80 |
0.23 |
1.29 |
2.29 |
0.20 |
2.95 |
|
2005 |
1.88 |
-0.03 |
0.06 |
-0.63 |
0.55 |
1.07 |
0.84 |
|
2006 |
0.79 |
0.24 |
0.11 |
-0.32 |
0.44 |
0.49 |
0.07 |
|
2007 |
5.57 |
0.52 |
0.08 |
0.14 |
0.30 |
0.06 |
4.99 |
|
2008 |
4.30 |
2.33 |
0.04 |
1.17 |
1.11 |
0.15 |
1.83 |
|
2009 |
-2.49 |
0.86 |
-0.08 |
0.55 |
0.39 |
1.85 |
-5.20 |
|
2010 |
5.55 |
-0.28 |
-0.02 |
0.14 |
-0.40 |
1.02 |
4.82 |
|
2011 |
-3.99 |
-2.49 |
-0.03 |
-0.88 |
-1.57 |
0.53 |
-2.03 |
| Industry |
Year |
DlnV/H |
sDln(K/H) |
sDln(K/H) IT |
sDln(K/H)othtan |
sDln(K/H)intan |
sDln(L/H) |
DlnTFP |
| FinSvc |
2001 |
0.49 |
2.32 |
0.50 |
0.05 |
1.78 |
0.29 |
-2.13 |
|
2002 |
3.95 |
2.87 |
0.57 |
0.85 |
1.45 |
0.55 |
0.53 |
|
2003 |
7.76 |
2.31 |
0.21 |
0.98 |
1.13 |
0.99 |
4.46 |
|
2004 |
7.20 |
3.03 |
0.16 |
1.73 |
1.14 |
0.27 |
3.91 |
|
2005 |
2.92 |
0.55 |
0.46 |
0.32 |
-0.23 |
0.61 |
1.76 |
|
2006 |
7.75 |
2.17 |
0.07 |
1.69 |
0.41 |
0.41 |
5.16 |
|
2007 |
1.95 |
0.15 |
0.07 |
0.30 |
-0.22 |
1.75 |
0.05 |
|
2008 |
0.98 |
1.62 |
0.07 |
1.20 |
0.35 |
0.69 |
-1.33 |
|
2009 |
-1.32 |
1.76 |
-0.04 |
1.35 |
0.44 |
0.85 |
-3.93 |
|
2010 |
-3.84 |
1.12 |
0.11 |
0.79 |
0.21 |
1.02 |
-5.97 |
|
2011 |
-4.50 |
-1.38 |
0.16 |
-1.09 |
-0.44 |
0.66 |
-3.78 |
| Industry |
Year |
DlnV/H |
sDln(K/H) |
sDln(K/H) IT |
sDln(K/H)othtan |
sDln(K/H)intan |
sDln(L/H) |
DlnTFP |
| ProfAdmin |
2001 |
2.89 |
1.38 |
-0.04 |
0.76 |
0.66 |
-0.22 |
1.73 |
|
2002 |
-1.27 |
2.98 |
0.09 |
1.76 |
1.13 |
0.18 |
-4.43 |
|
2003 |
4.69 |
1.65 |
0.09 |
0.99 |
0.56 |
1.28 |
1.76 |
|
2004 |
1.13 |
1.11 |
0.03 |
0.70 |
0.38 |
-0.64 |
0.67 |
|
2005 |
3.12 |
-0.15 |
0.02 |
0.04 |
-0.22 |
0.64 |
2.63 |
|
2006 |
3.07 |
1.21 |
0.06 |
0.92 |
0.22 |
0.48 |
1.39 |
|
2007 |
5.02 |
0.71 |
0.09 |
0.82 |
-0.20 |
0.59 |
3.72 |
|
2008 |
-1.13 |
1.21 |
-0.03 |
1.11 |
0.13 |
-0.07 |
-2.27 |
|
2009 |
-5.32 |
1.84 |
-0.03 |
1.37 |
0.50 |
0.91 |
-8.07 |
|
2010 |
3.02 |
-0.28 |
-0.02 |
0.12 |
-0.39 |
1.24 |
2.06 |
|
2011 |
3.29 |
-0.40 |
0.04 |
-0.12 |
-0.33 |
0.72 |
2.97 |
| Industry |
Year |
DlnV/H |
sDln(K/H) |
sDln(K/H) IT |
sDln(K/H)othtan |
sDln(K/H)intan |
sDln(L/H) |
DlnTFP |
| PersSvc |
2001 |
-3.40 |
2.30 |
0.75 |
1.11 |
0.44 |
0.01 |
-5.71 |
|
2002 |
1.47 |
2.22 |
0.15 |
1.48 |
0.59 |
0.45 |
-1.21 |
|
2003 |
2.03 |
2.62 |
0.23 |
1.81 |
0.59 |
-0.07 |
-0.52 |
|
2004 |
-1.81 |
4.32 |
0.48 |
3.45 |
0.39 |
0.01 |
-6.15 |
|
2005 |
5.83 |
5.49 |
0.57 |
4.33 |
0.58 |
0.50 |
-0.16 |
|
2006 |
-2.32 |
1.44 |
0.08 |
1.35 |
0.01 |
0.08 |
-3.83 |
|
2007 |
-1.45 |
2.78 |
0.12 |
2.43 |
0.24 |
-0.32 |
-3.92 |
|
2008 |
0.29 |
2.11 |
0.00 |
2.09 |
0.02 |
1.68 |
-3.49 |
|
2009 |
-1.19 |
2.05 |
-0.14 |
1.92 |
0.27 |
1.45 |
-4.69 |
|
2010 |
-0.17 |
0.69 |
-0.08 |
0.88 |
-0.11 |
0.87 |
-1.73 |
|
2011 |
1.02 |
0.23 |
-0.02 |
0.44 |
-0.19 |
-0.31 |
1.10 |




