About Nesta
We are Nesta, the UK's innovation agency for social good. We design, test and scale solutions to society's biggest problems. Our three missions are to give every child a fair start, help people live healthy lives and create a sustainable future where the economy works for both people and the planet.
For over 20 years, we have worked to support, encourage and inspire innovation. We work in three roles: as an innovation partner working with frontline organisations to design and test new solutions, as a venture builder supporting new and early stage businesses and as a system shaper creating the conditions for innovation. Harnessing the rigour of science and the creativity of design, we work relentlessly to change millions of lives for the better.
Find more at nesta.org.uk
If you'd like this publication in an alternative format such as Braille or large print please contact us at [email protected]
About the Behavioural Insights Team
The Behavioural Insights Team (BIT) is one of the world's leading behavioural science consultancies, working around the world to improve people's lives. BIT works in partnership with governments, local authorities, businesses and NGOs in over 30 countries, often using simple changes to tackle major policy problems and deliver improved public services and social outcomes.
BIT was established by the UK government in 2010. In 2014 it became an independent social purpose company, part owned by the Cabinet Office and innovation agency Nesta, and since 2021 has been entirely owned by Nesta.
Authors
Ed Whincup, Shoshana Davidson, Reny Kiryakova, Jordan Whitwell-Mak
Appendix 3 – exploratory analysis interaction effects
Interaction effects between framings and incentives
Appendix 4
Breakdown by sample characteristics
Breakdown by industry/subject expertise
Appendix 5
Executive summary
Overview
The UK's transition to decarbonise its economy is having and will continue to have a profound impact on employment, increasing the demand for green jobs. However, green skills - the skills required to perform green jobs that include skills in STEM, specific technical skills, digital skills, data analytics and project and change management skills are in short supply among the UK's current and future workforce. Encouraging current and future workers to upskill with the necessary green skills will therefore be of key importance to the green transition.
Methodology
We used Predictiv, BIT's online experiment platform, to run an online experiment with a sample of 4,093 economically active adults (median age = 41 years) and 4,027 recent A-/T-Level or university graduates (median age = 21 years) in the UK. The sample was collected between 13 March – 12 April 2023.
Design
We designed an online experiment to test whether various messaging framings and financial incentives could increase current and future workers' interest and sentiment towards undertaking a green skills training course, when shown a hypothetical green skills course advert. Participants were randomly assigned to see one of five framings of a green skills offer: a dynamic social norm framing, a social impact + pro-environmental impact framing, a job security + demand framing, a pride + future generations framing, or a simple control (experiment one). We then asked about their intentions to take up training. They were later re-randomised into one of four arms. Three of these included an additional financial incentive to take up green skills training: a grant, a loan and a subsidy, while one had no additional incentive (control) (experiment two).
Key findings
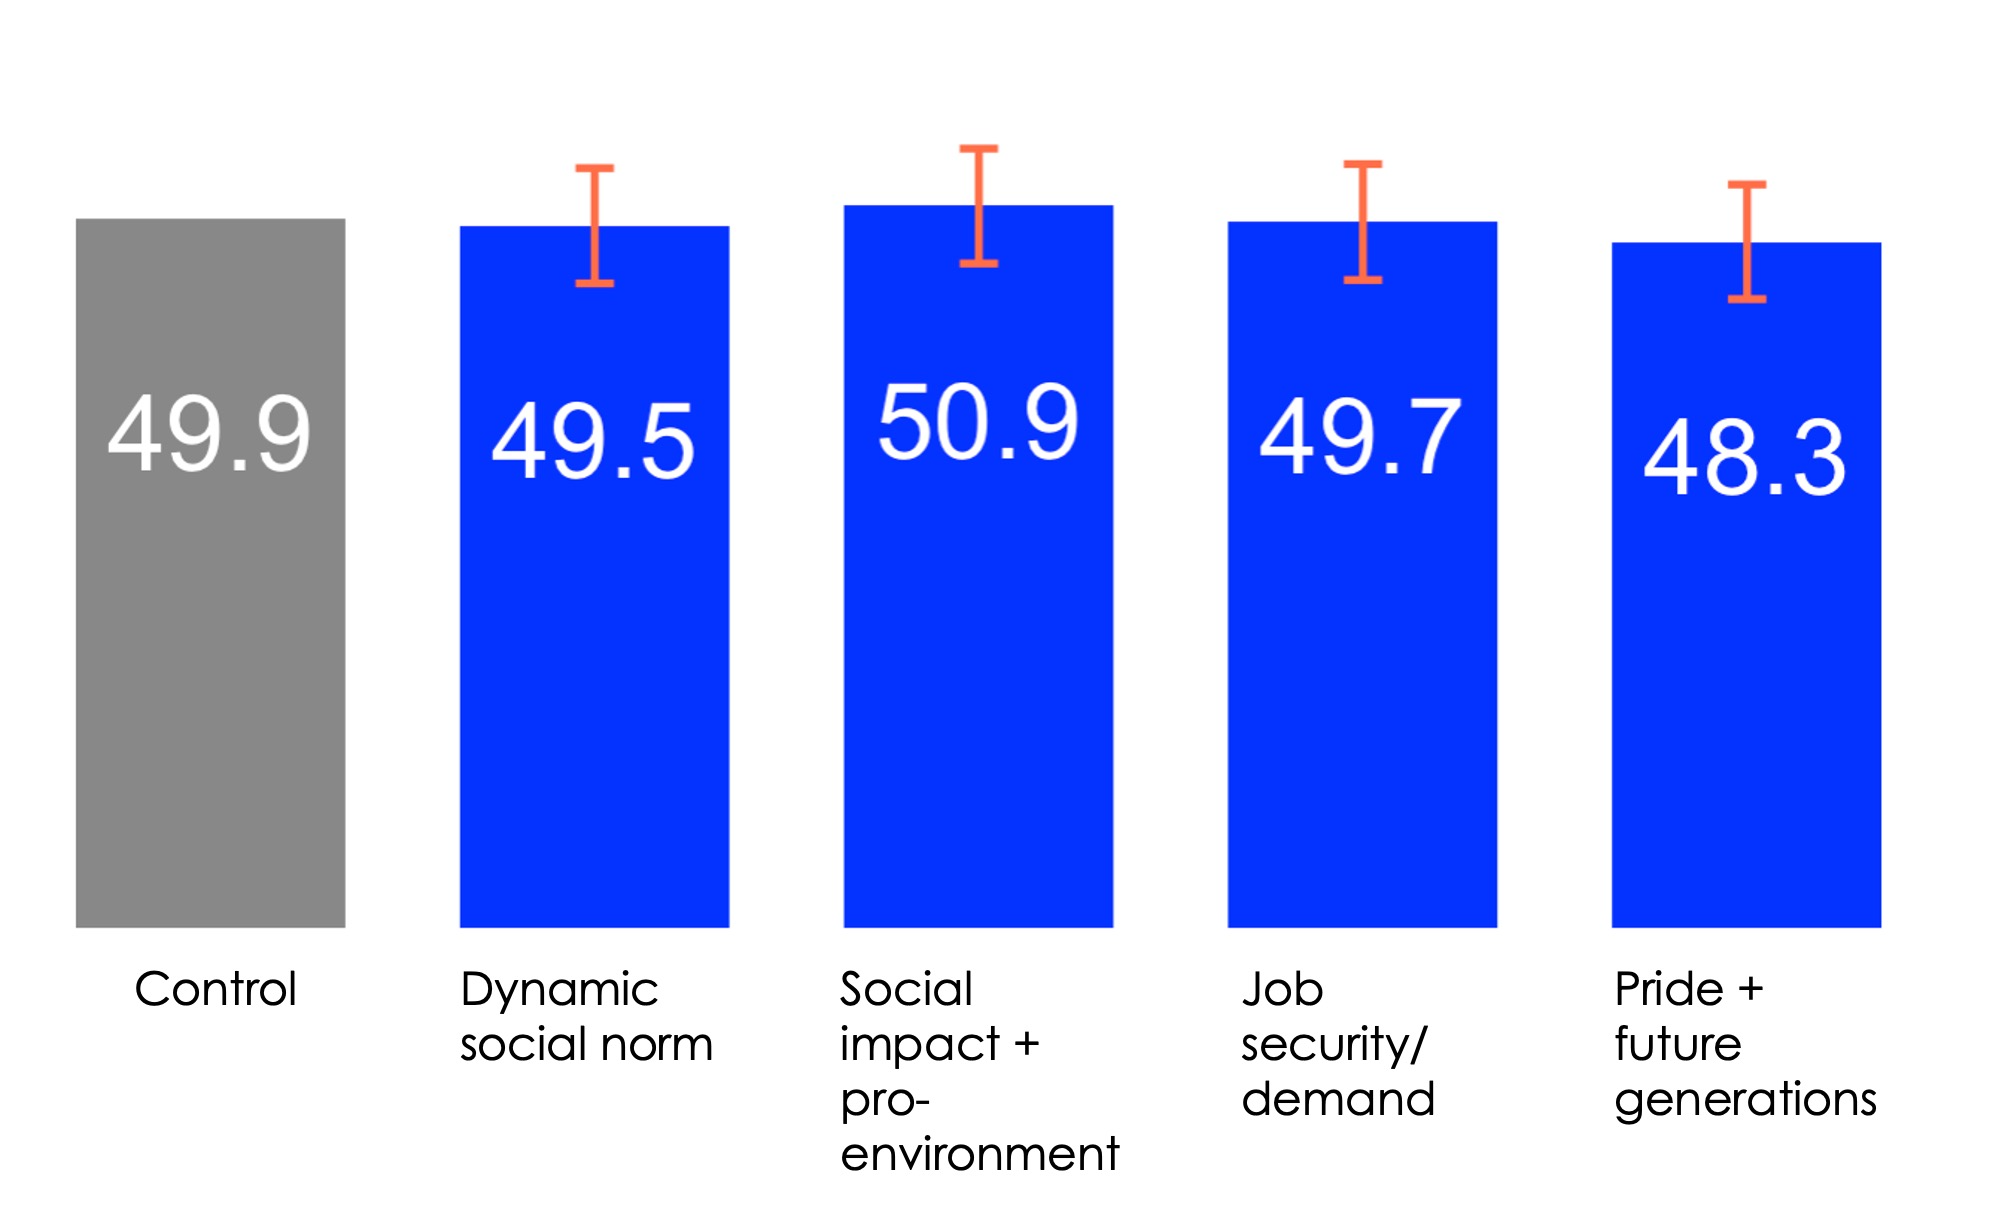
1 Framings: We found that framings did not significantly increase interest in the green skills training offer, compared to the control. We also found no differences in the effect of framings on interest for men and for women, nor did we find differences across economically active people and recent graduates. Participants felt that the dynamic social norm (a framing drawing attention to the increasing number of people developing their skills to work in green jobs), social impact and pride framings were most engaging, and also thought green jobs would help the environment and improve people's lives and communities after seeing the social impact framing. They were more likely to think other people with their skills would consider a green skills training course after seeing the dynamic social norms framing.
N = 8,120
Primary analysis. Logistic regression including covariates.
Corrected for multiple comparisons.
** p < 0.01, * p < 0.05, + p < 0.1
Numbers in bars equals the control mean +/- treatment effects.
Data collected by BIT on 13 March – 12 April 2023.
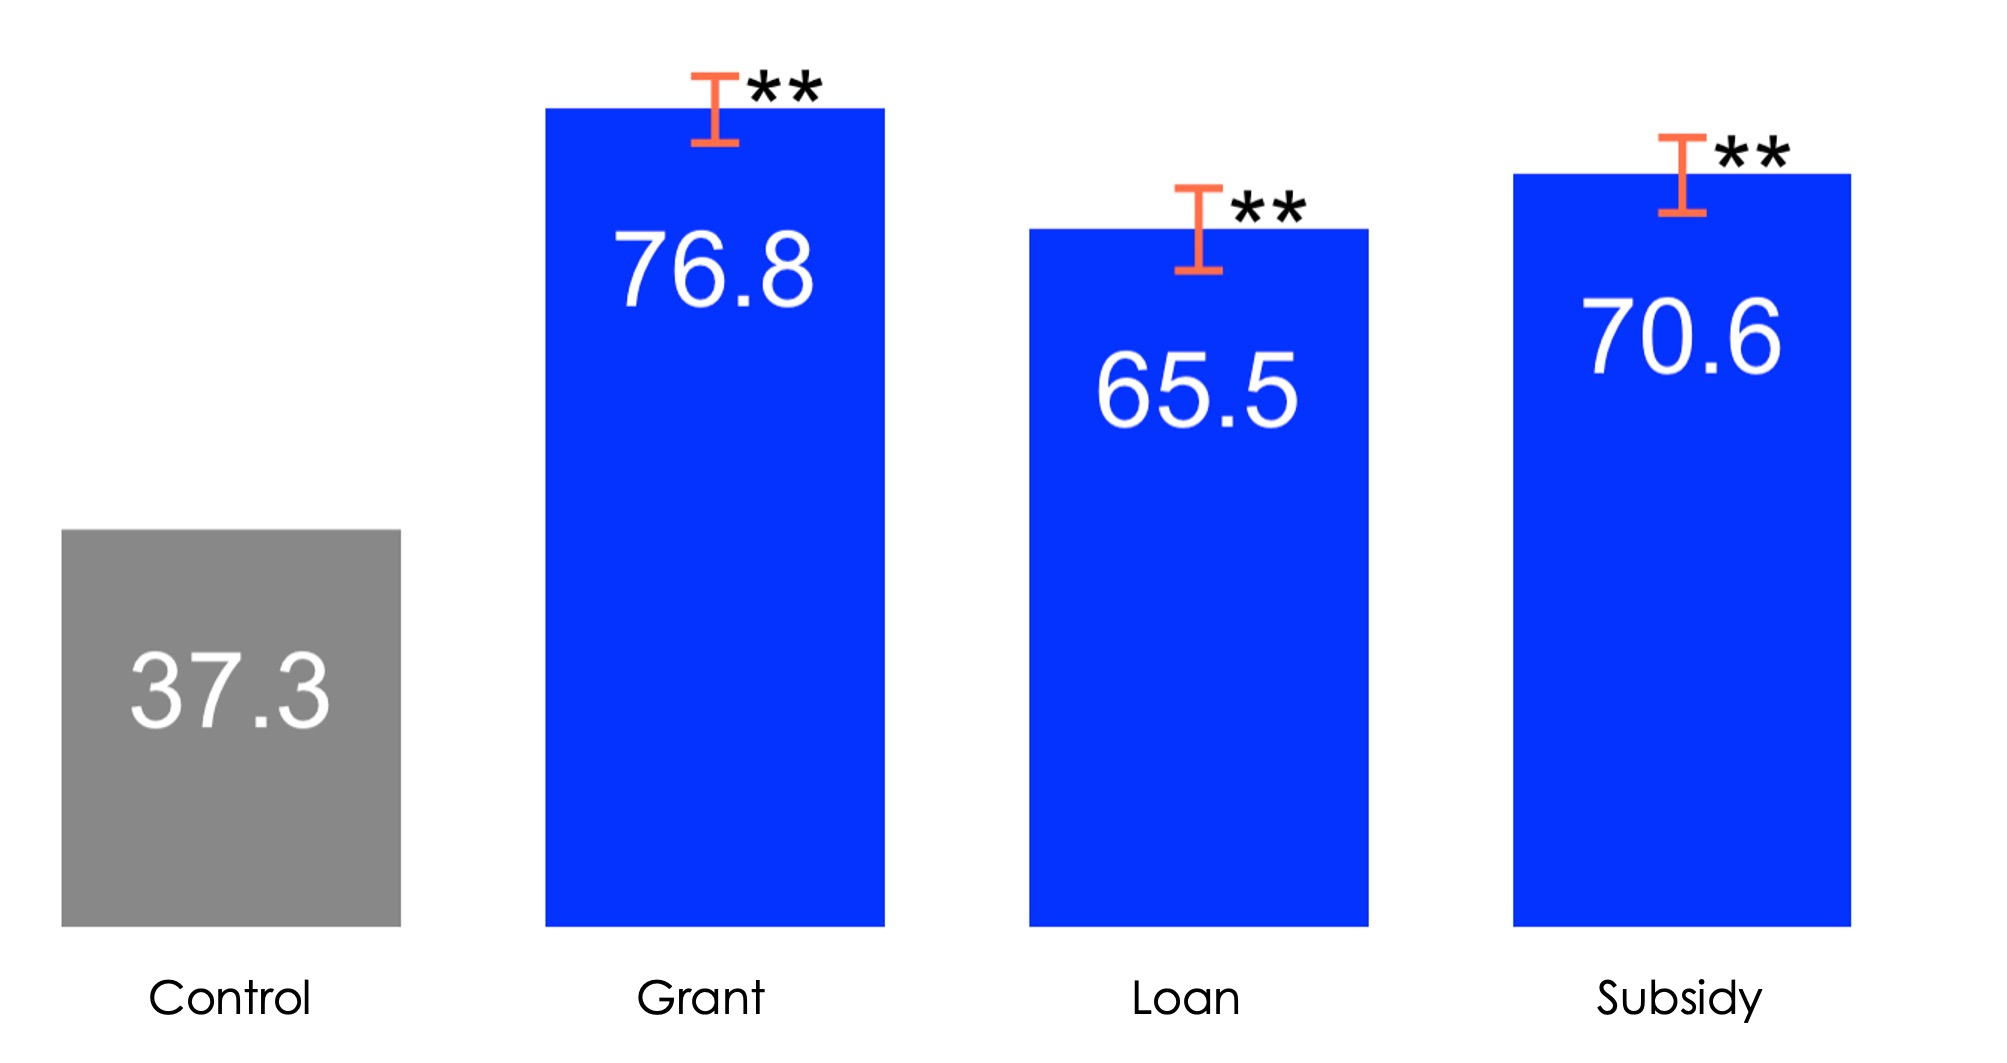
2 Financial incentives: The financial incentives all significantly increased interest in the green skills training offer. The grant increased interest by 39.5 percentage points (pp), the loan by 28pp, and the subsidy by 33.3pp compared with the control group. These increases were largely consistent across gender and across economically active people and recent graduates.
N = 8,120
Primary analysis. Logistic regression including covariates.
Corrected for multiple comparisons.
** p < 0.01, * p < 0.05, + p < 0.1
Numbers in bars equals the control mean +/- treatment effects.
Data collected by BIT on 13 March – 12 April 2023.
We also found that the percentage of participants interested in going on a green skills training course fell from 50% across all framing arms, to 37.3% for the control in the second experiment. The only additional information participants randomised into the control received in the second experiment, was that training costs had to be paid by the trainee upfront. We believe that this is due to participants not considering the cost and who would be paying for the training when indicating their interest in the first experiment, and only taking this into account when it was explicitly stated that they would need to pay in experiment two.
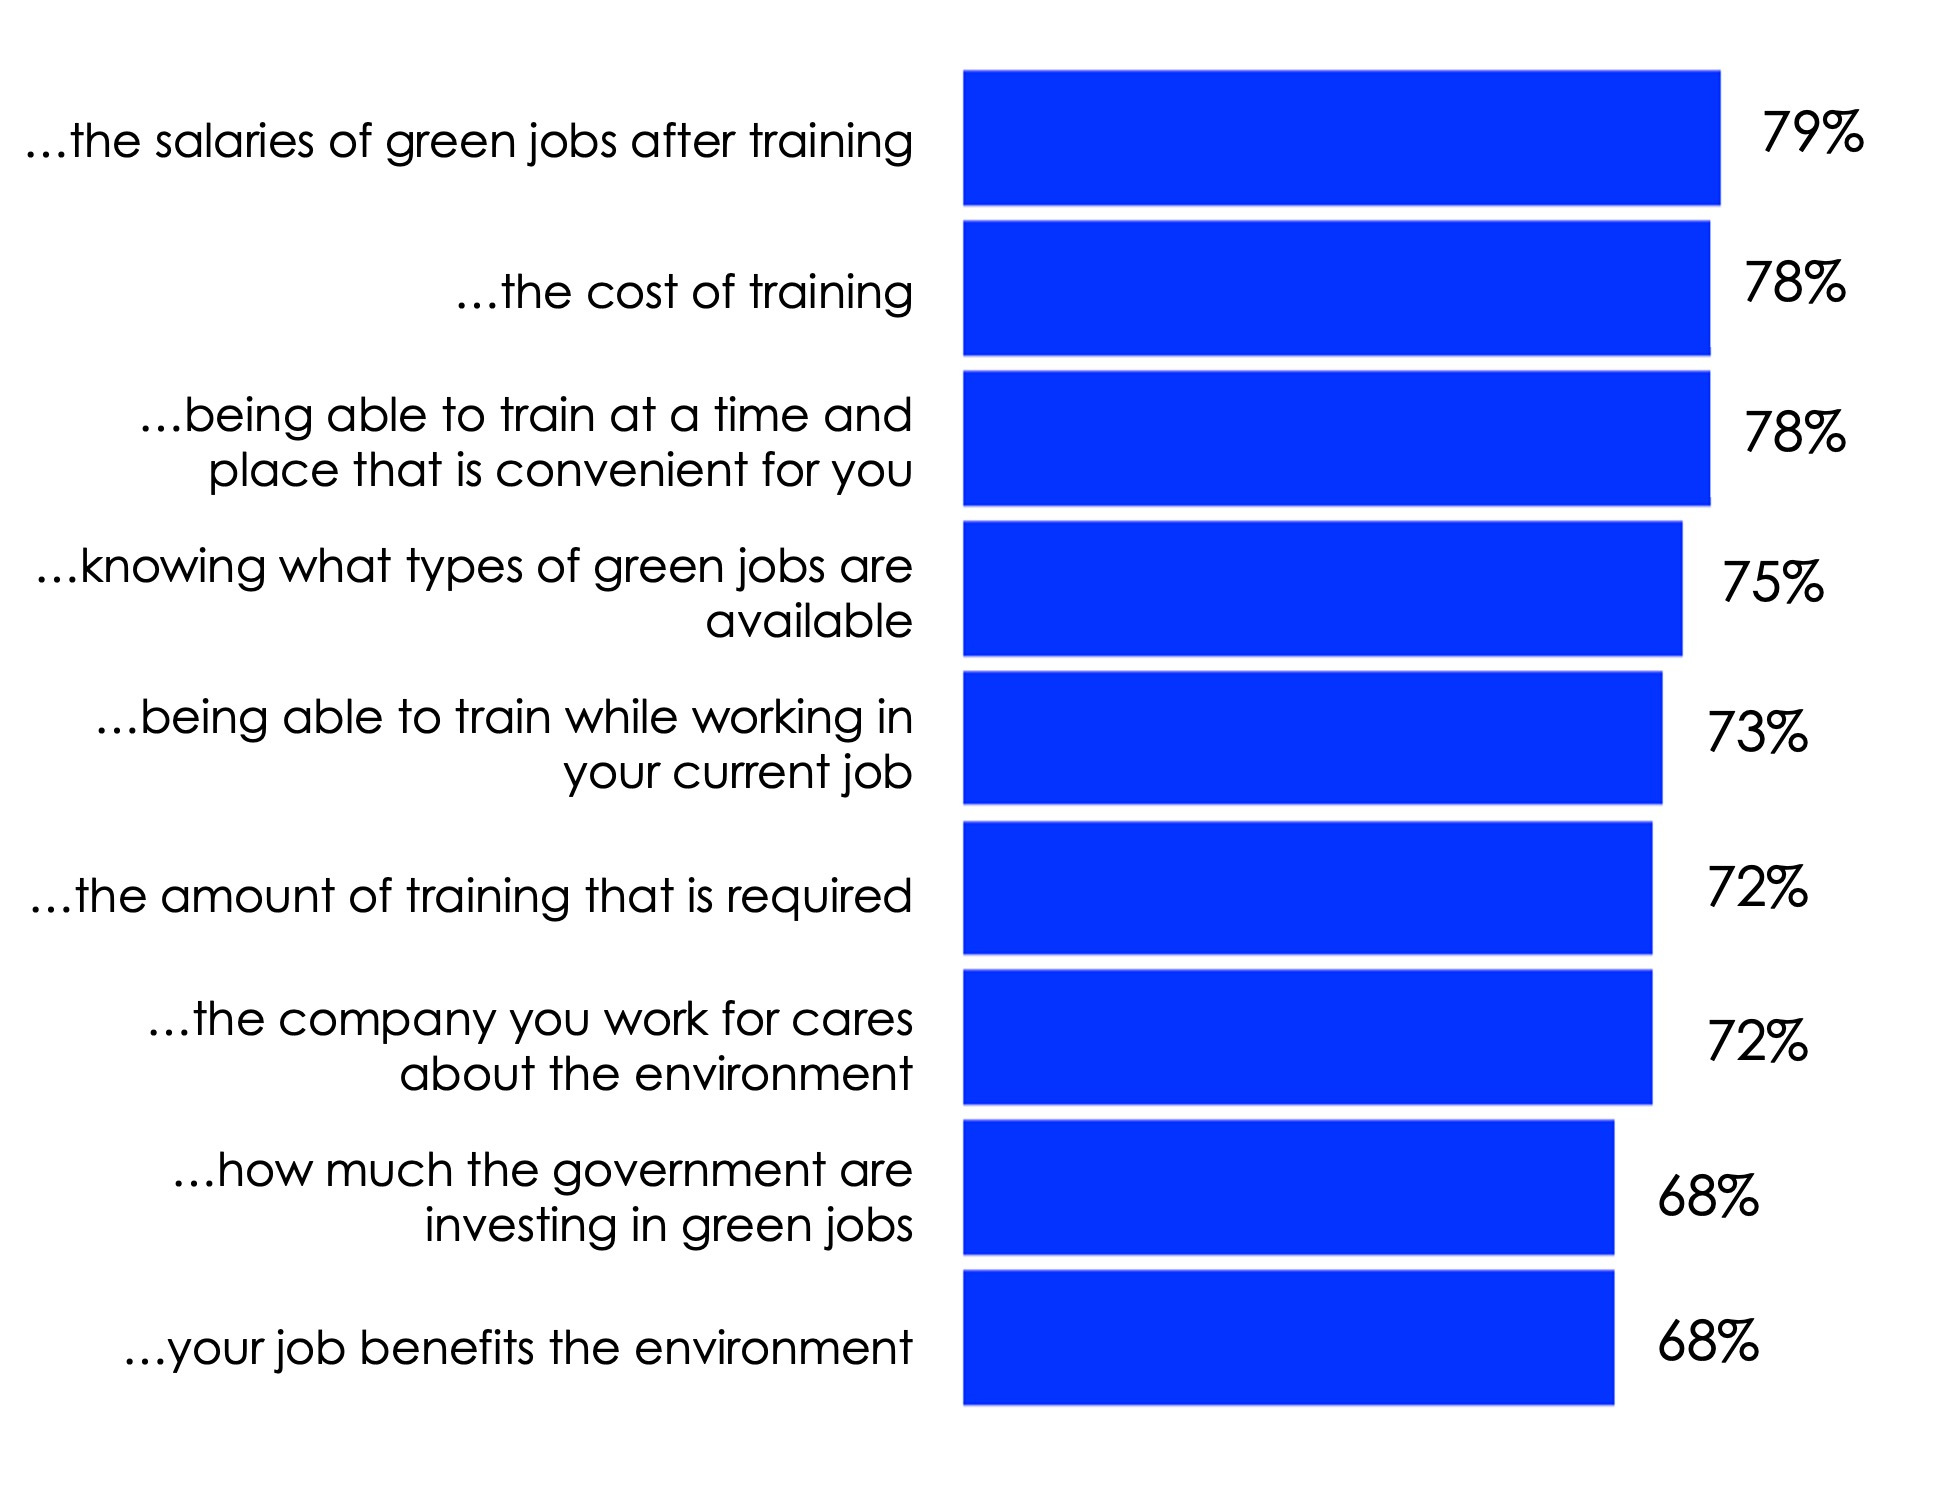
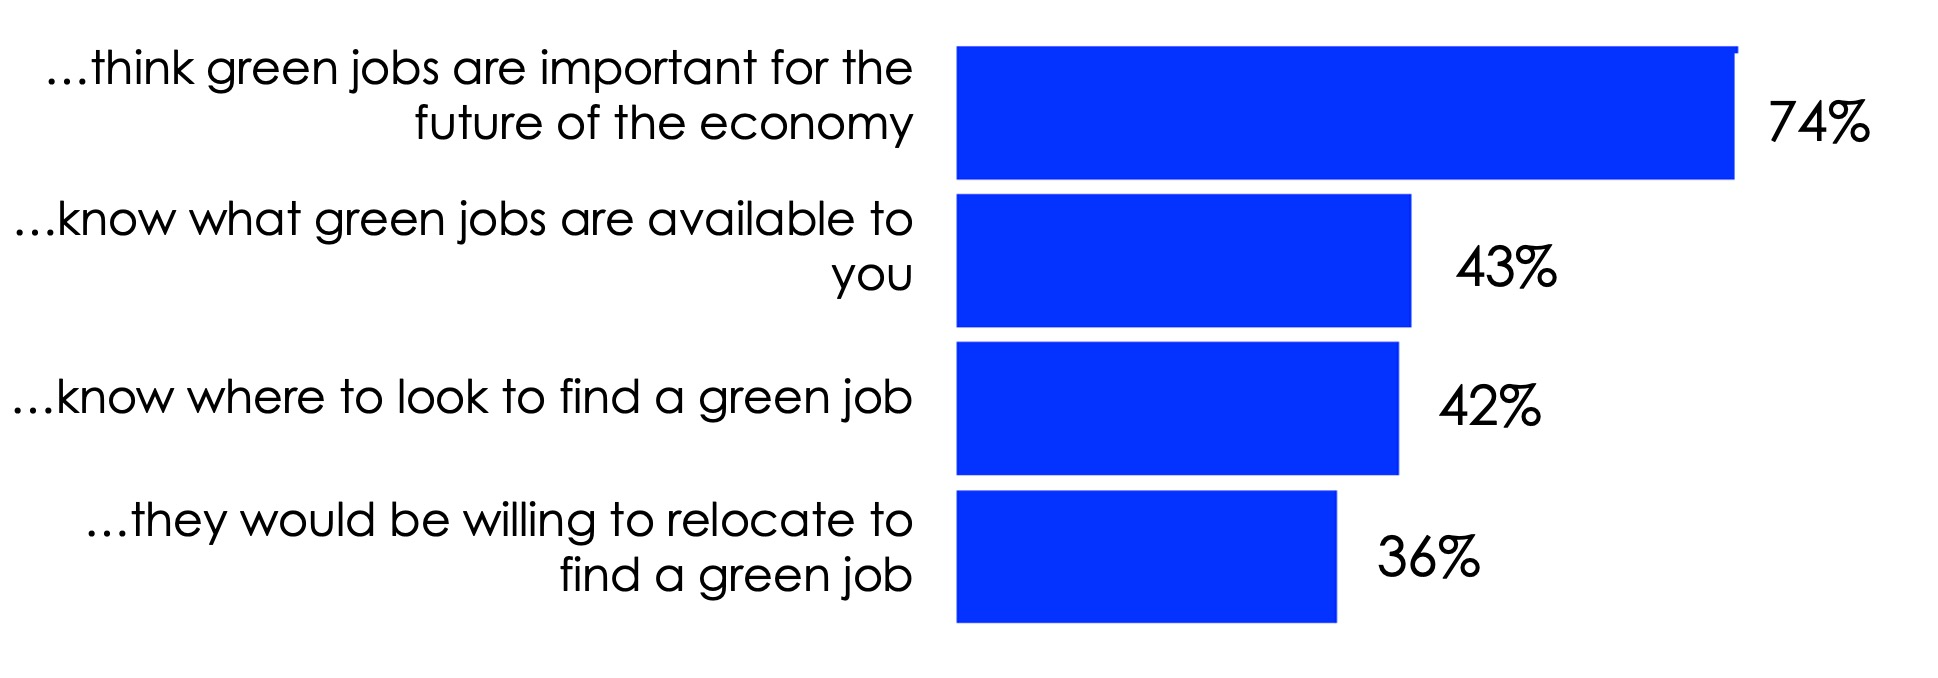
3 Attitudes and understanding of green jobs: The most important considerations around taking up green skills training were related to financial factors (the salaries of green jobs after training and the cost of training) and to the convenience of the training. Many think green jobs are important (74%) but few know what green jobs are available (43%) and where to look for them (42%).
Policy recommendations
- Highlight financial incentives upfront: Given that our framings did not significantly increase interest whereas the incentives did, messaging to promote green skills training should focus on addressing the financial barriers to training uptake and should draw attention to financial incentives if these are available.
- Consider the value-for-money or potential return from different financial incentives: Although the grant and subsidy were the most effective in increasing interest in the green skills training, loans also significantly increased interest and may attract people to green skills training at a lower cost to policymakers.
- Provide green career advice and bespoke green job matching services: We found that relatively few people know what green jobs are available to them (43%) and know where to look for a green job (42%). These findings highlight a need among current and future workers for further guidance around the pathways to green jobs through the provision of green career advice and green job matching services.
- Offer a range of training times and formats: Our findings indicate that people value a range of options when it comes to training. For example, we found variation in preferences for the length of training, timing of training and format of training (eg, 38% preferred online, 20% in-person and 35% hybrid options). These preferences should be considered among training providers when designing courses, to help people overcome barriers such as opportunity costs.
Recommendations for further research
- Consider any gaps for different groups: Our analysis found that men were significantly more interested in green skills training than women. However, despite not being statistically significant, we also found that the framings increased interest among women more positively than among men. If policymakers/employers are interested in narrowing this gap, further research is needed to explore why this may be the case.
- Consider the efficacy of low-cost, low-time intensive 'foot-in-the-door' training as a means of encouraging take up of longer-term training: People may be apprehensive to take up green skills training because of the financial commitment and not knowing what to expect. Further research could look into whether foot-in-the-door training could be a springboard to encourage people to take up green skills training in the long term.
- Conduct further research on the efficacy of various framings for green skills training and green jobs: It is possible that the lack of differences across our framings was due to the experiment design using a generic green skills training advert, and a wide audience in our sample. Framings may still be effective in communicating specific training courses that are more skill-specific or targeted towards individuals who can more easily transition from their current jobs into green jobs, for example, when communicating training for heat pump or retrofit installers. Alternatively, framings could also be effective if they are made to focus on what people are most interested in, such as communicating the salaries of green jobs, given that the majority (77%) said they would only take a green job if it paid the same as or more than a non-green job.
Overview
The UK's transition to decarbonise its economy is having, and will continue to have, a profound impact on employment. Some jobs in carbon-intensive industries such as oil and gas will decline, while other jobs will be created or transformed as sustainable practices become more prevalent. As a result, green jobs, defined as jobs that reduce the consumption of energy and raw materials, limit greenhouse gas emissions, minimise waste and pollution, protect and restore ecosystems and enable enterprises and communities to adapt to climate change, will become more necessary.
Green jobs will not only allow the UK to meet its environmental targets but could also carry benefits around increasing the nation's productivity. Our previous evidence review found that green jobs tend to require specific skills (green skills) such as skills in STEM, specific technical skills, digital skills, data analytics and project and change management skills, many of which are in short supply relative to demand within the UK's current and future workforce. A recent study by LinkedIn found that between 2016-2021, job adverts requiring green skills grew by 35% while green skills grew 26%. This means that the supply of workers with the necessary green skills is lagging behind their increasing demand, and this gap is likely to continue to increase as the economy continues to decarbonise. This is only exacerbated by other well-remunerated sectors competing for candidates with these skill sets.
Exploring ways of increasing green skills within the UK's current and future workforce is therefore of key importance for policymakers, and for green industries and businesses, if the UK is to achieve its Net Zero ambitions by 2050. However, increasing green skills among the workforce presents its own challenges. These include awareness/motivational barriers (eg, are people interested in gaining green skills? Do they know they require specific skills to work in green roles?), as well as financial barriers (eg, people may lack the capital to pay for necessary training courses), alongside the opportunity costs of working/earning less while upskilling/reskilling.
In light of these barriers, Nesta worked with BIT to run an experiment through BIT's online experiment platform Predictiv, to test how a variety of message framings and financial incentives could encourage current and future workers to take up green skills training based on a hypothetical green skills course advert (a green skills offer). This report summarises the key findings from our experiment and presents a series of evidence-based recommendations outlining what could work to ultimately help plug the UK's green skills gap.
Methodology
Sample
We recruited a sample of 4,093 economically active adults and 4,027 recent A-/T-Level or university graduates in the UK between 13 March – 12 April 2023.
|
We recruited a sample of 4,093 economically active people. |
|
|
|
|
| Gender |
|
Region |
|
Ethnicity |
|
| Women |
48% |
South and East |
29% |
White |
85% |
| Age |
|
North |
27% |
Asian |
7% |
| 16-24 |
12% |
Midlands |
19% |
Black |
4% |
| 25-54 |
69% |
Scot/NI/Wales |
11% |
Mixed/other |
4% |
| 55+ |
19% |
London |
14% |
|
|
|
And we recruited a sample of 4,027 recent graduates. |
|
|
|
|
| Gender |
|
Region |
|
Ethnicity |
|
| Women |
50% |
South and East |
27% |
White |
70% |
| Age |
|
North |
25% |
Asian |
14% |
| 16-24 |
85% |
Midlands |
17% |
Black |
10% |
| 25-54 |
15% |
Scot/NI/Wales |
11% |
Mixed/other |
6% |
| 55+ |
<1% |
London |
19% |
|
|
We also collected data for all respondents for age, region, urbanicity, education, income, employment status, climate concern, industry they work in, subject expertise, political view, and skills (eg, STEM, digital skills, project management skills) (see Appendix 1 - 5).
Median time spent completing survey: 8 minutes and 33 seconds.
Design
Participants were initially provided with a definition of what green jobs and green skills are. Participants were then randomly assigned to see one of five framings of a green skills offer. They were later re-randomised into one of four arms. Three of these included an additional incentive to take up green skills training while one had no additional incentive.
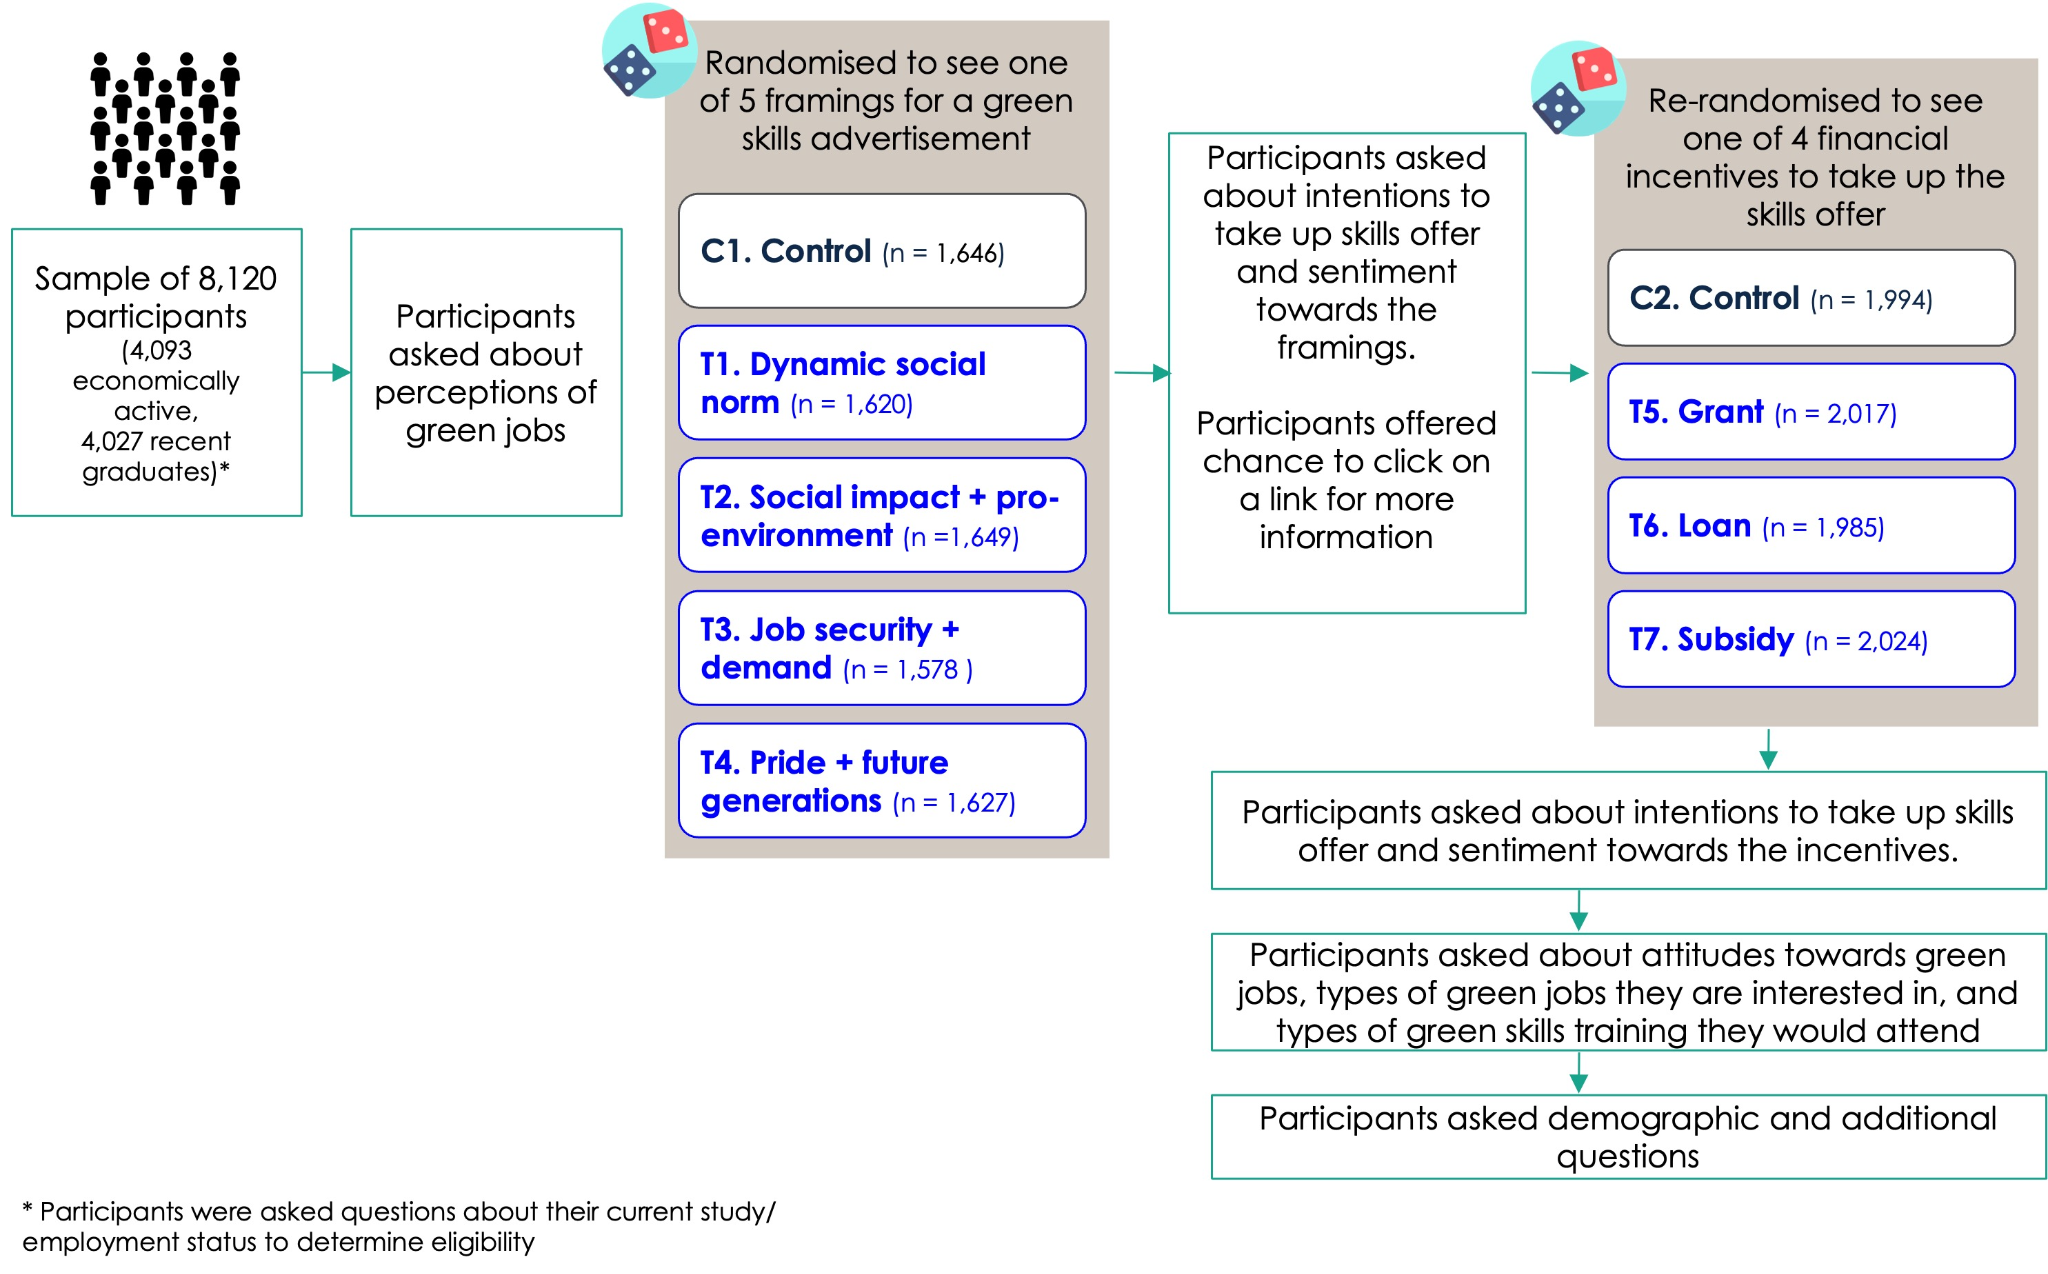
* Participants were asked questions about their current study/employment status to determine eligibility
Green skills offer framings
We presented participants with a green skills offer that was displayed as an online advertisement for a training course. Participants were randomly assigned to see one of five framings of the green skills offer. Each of the framings was informed by evidence, the specific rationale for each of these is outlined below.
- Dynamic social norm framing: Highlighting social norms can be an effective means of capturing attention and encouraging behaviour, as we tend to behave the way we think most other people do. In the context of green skills, we wanted to see whether drawing attention to their increasing popularity affected take up.
- Social impact + pro-environmental framing: Given the social impact of green jobs, we wanted to see whether intrinsic motivation affected take up, ie, by talking about the desire to have an impact on the planet/community.
- Job security + green job demand framing: Green jobs may be perceived as being more secure. Further, emphasising that green jobs are increasing may provide people with the reassurance needed to invest in their green skills, if they feel that this investment will pay-off in the long-term.
- Pride + future generations framing: Invoking a sense of pride can be a strong motivator in encouraging pro-environmental behaviours. Further, connecting people to future generations could serve as motivation for working in a green job.
C1: Control/simplified
Gain the skills you need to work in a green job with a training course relevant to you
Explore our training courses today
Courses range from £500 - £3,000
(n = 1,646)
T1: Dynamic social norm framing
Join the increasing number of people who are getting ahead of the curve by developing their green skills
Gain the skills you need to work in a green job with a training course relevant to you
Explore our training courses today
Courses range from £500 - £3,000
(n = 1,620)
T2: Social impact + pro-environmental framing
Have an impact on the planet and your community by working in a green job
Gain the skills you need to work in a green job with a training course relevant to you
Explore our training courses today
Courses range from £500 - £3,000
(n = 1,649)
T3: Job security + green job demand framing
Secure your future by working in a green job. Acquire the green skills that are in high demand today.
Gain the skills you need to work in a green job with a training course relevant to you
Explore our training courses today
Courses range from £500 - £3,000
(n = 1,578)
T4: Pride + future generations framing
Work in a job that will make you, your children and future generations proud
Gain the skills you need to work in a green job with a training course relevant to you
Explore our training courses today
Courses range from £500 - £3,000
(n = 1,627)
Across all arms, when participants clicked on the ‘Explore our training courses today' link, they were shown more information (see below). This was the same for all arms.





Results
Perceptions of green jobs
How framings of green skills offers affect sentiment towards green skills training
Interest in green skills training courses
Reasons for why people were or were not interested
Interest in green skills training by gender and economically active/recent graduate group
Willingness to pay for green skills training courses
Sentiment towards the green skills training offer framings
How financial incentives affect interest in and sentiment towards green skills training
Interest in green skills training following the financial incentives
Interest in the green skills training following the incentives, by economically active and recent graduate group
Interest in green skills training following the incentives, by gender
Sentiment towards the financial incentives
Attitudes towards and understanding of green jobs
Implementation of green skills training courses
Recommendations
Policy recommendations
Recommendations for further research
Appendix I - framings subgroup analyses
Interest in green skills training, by gender
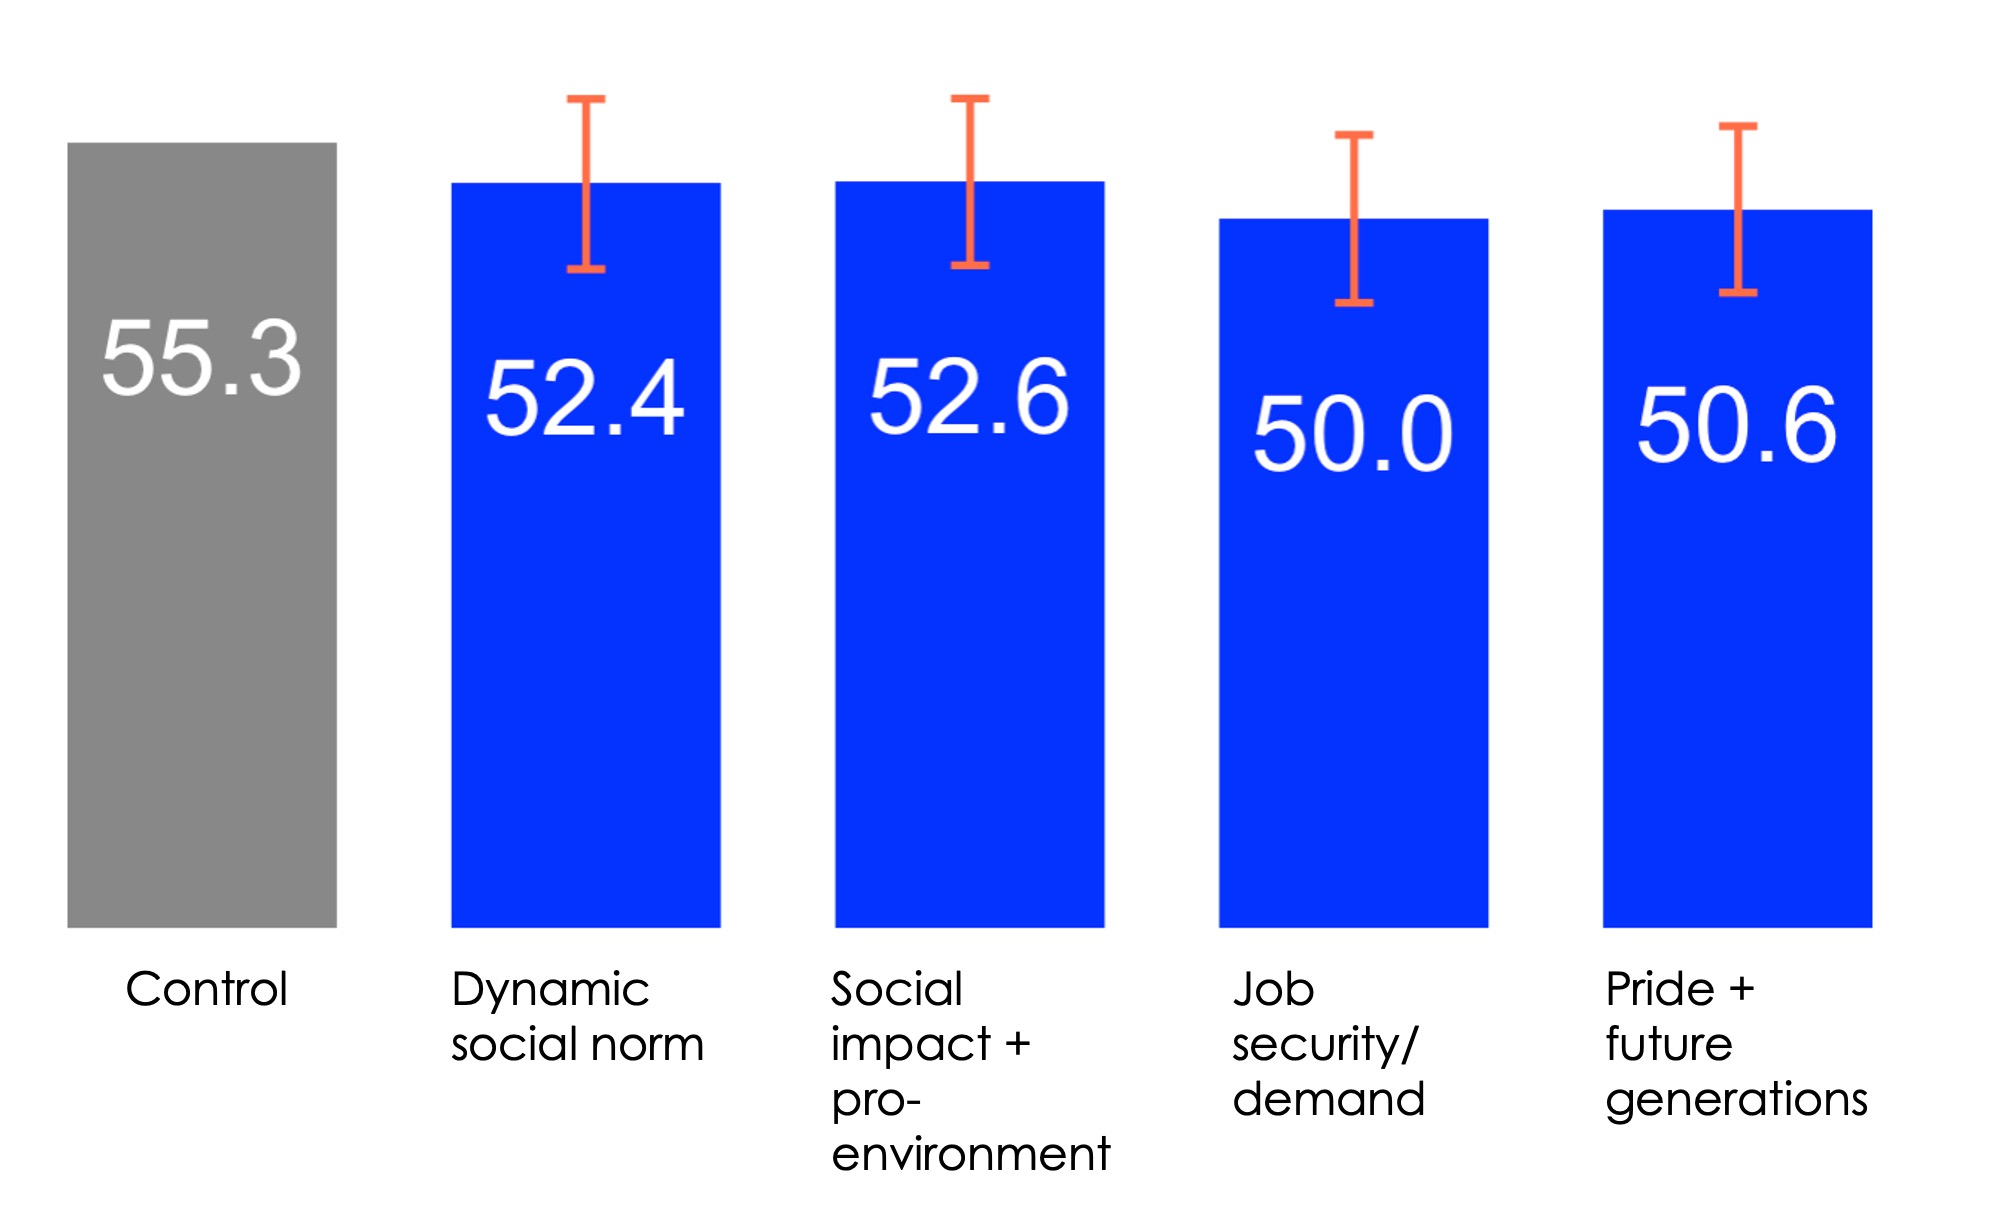
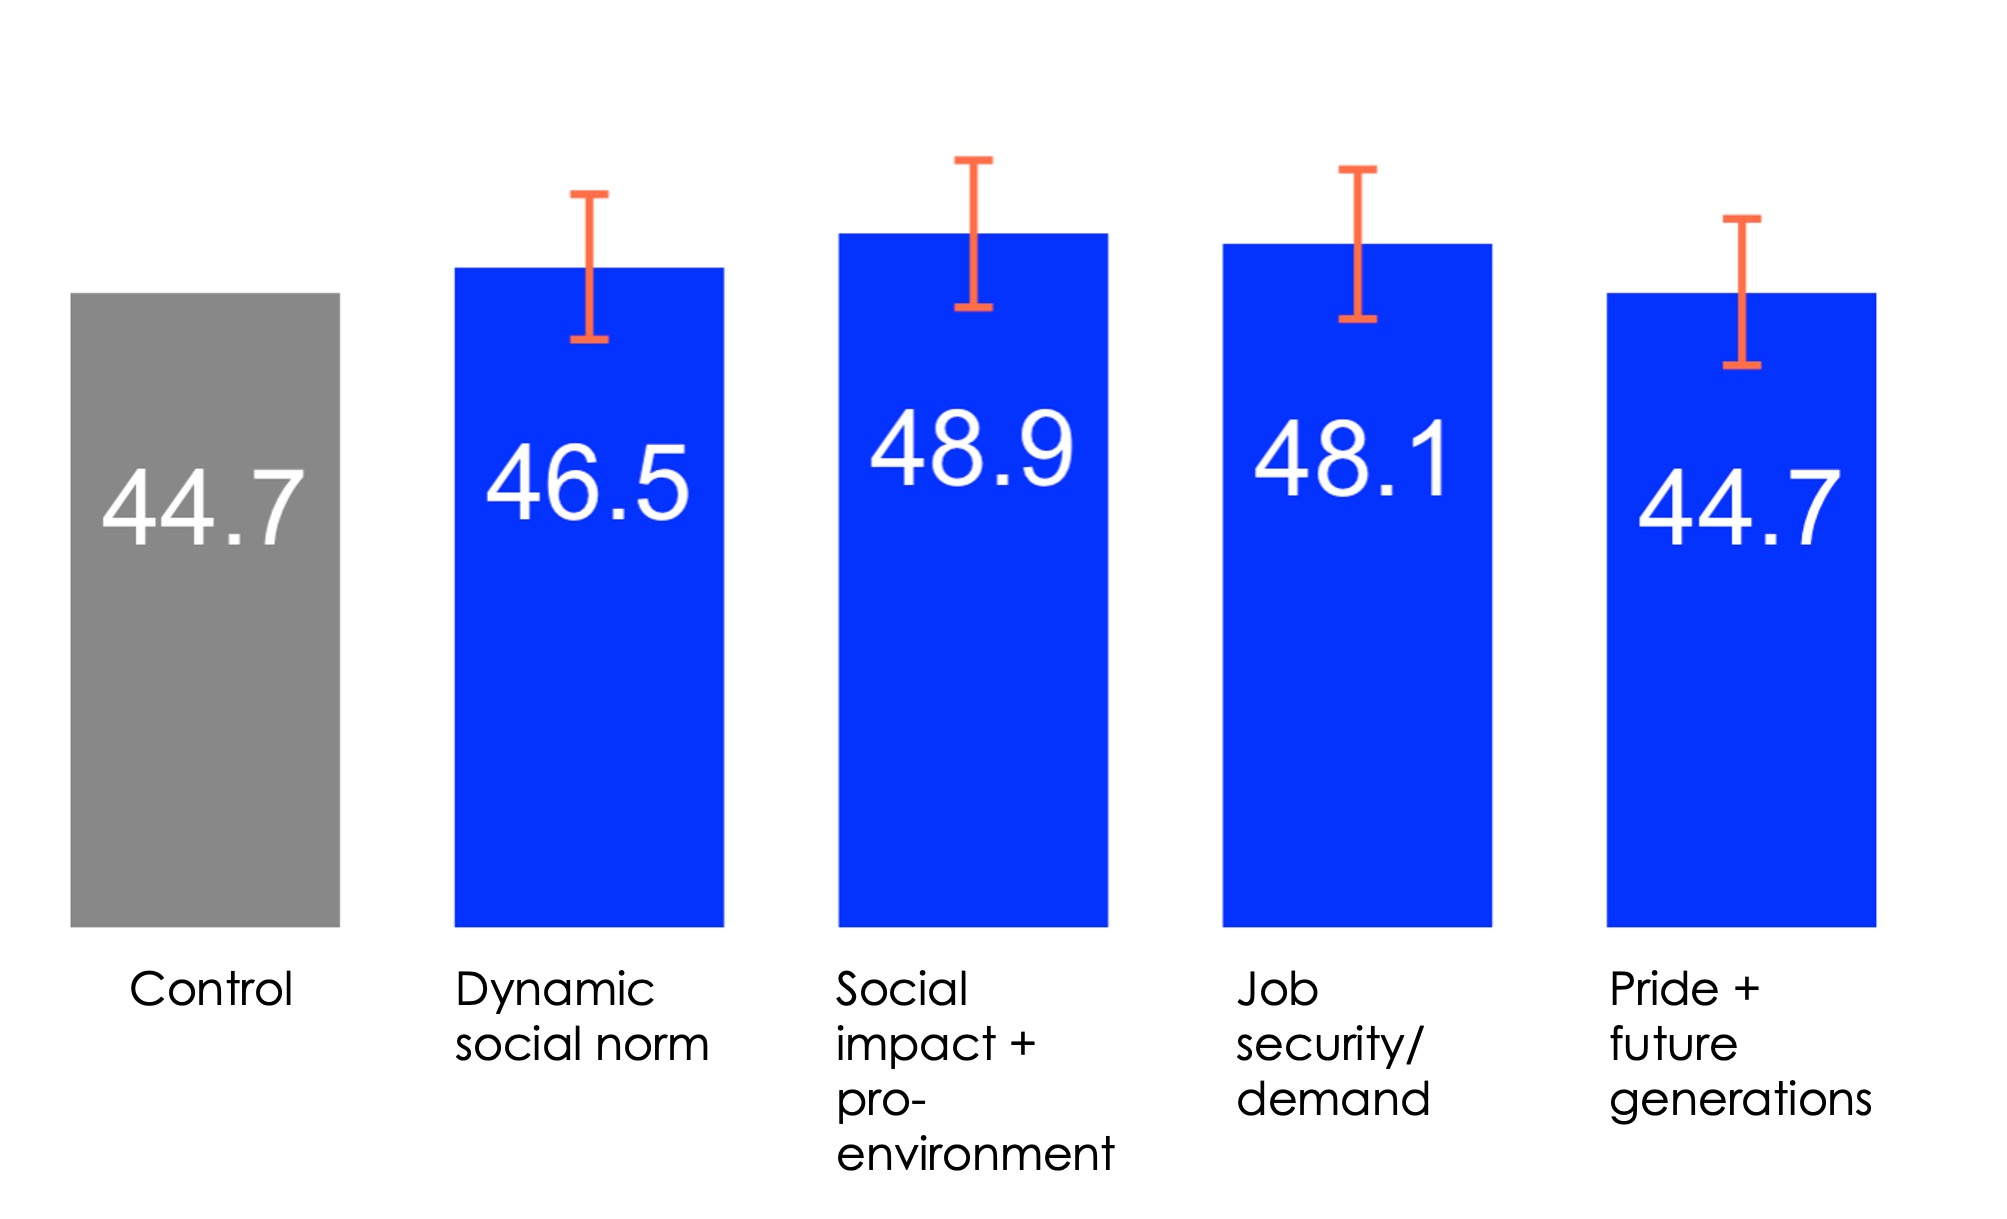
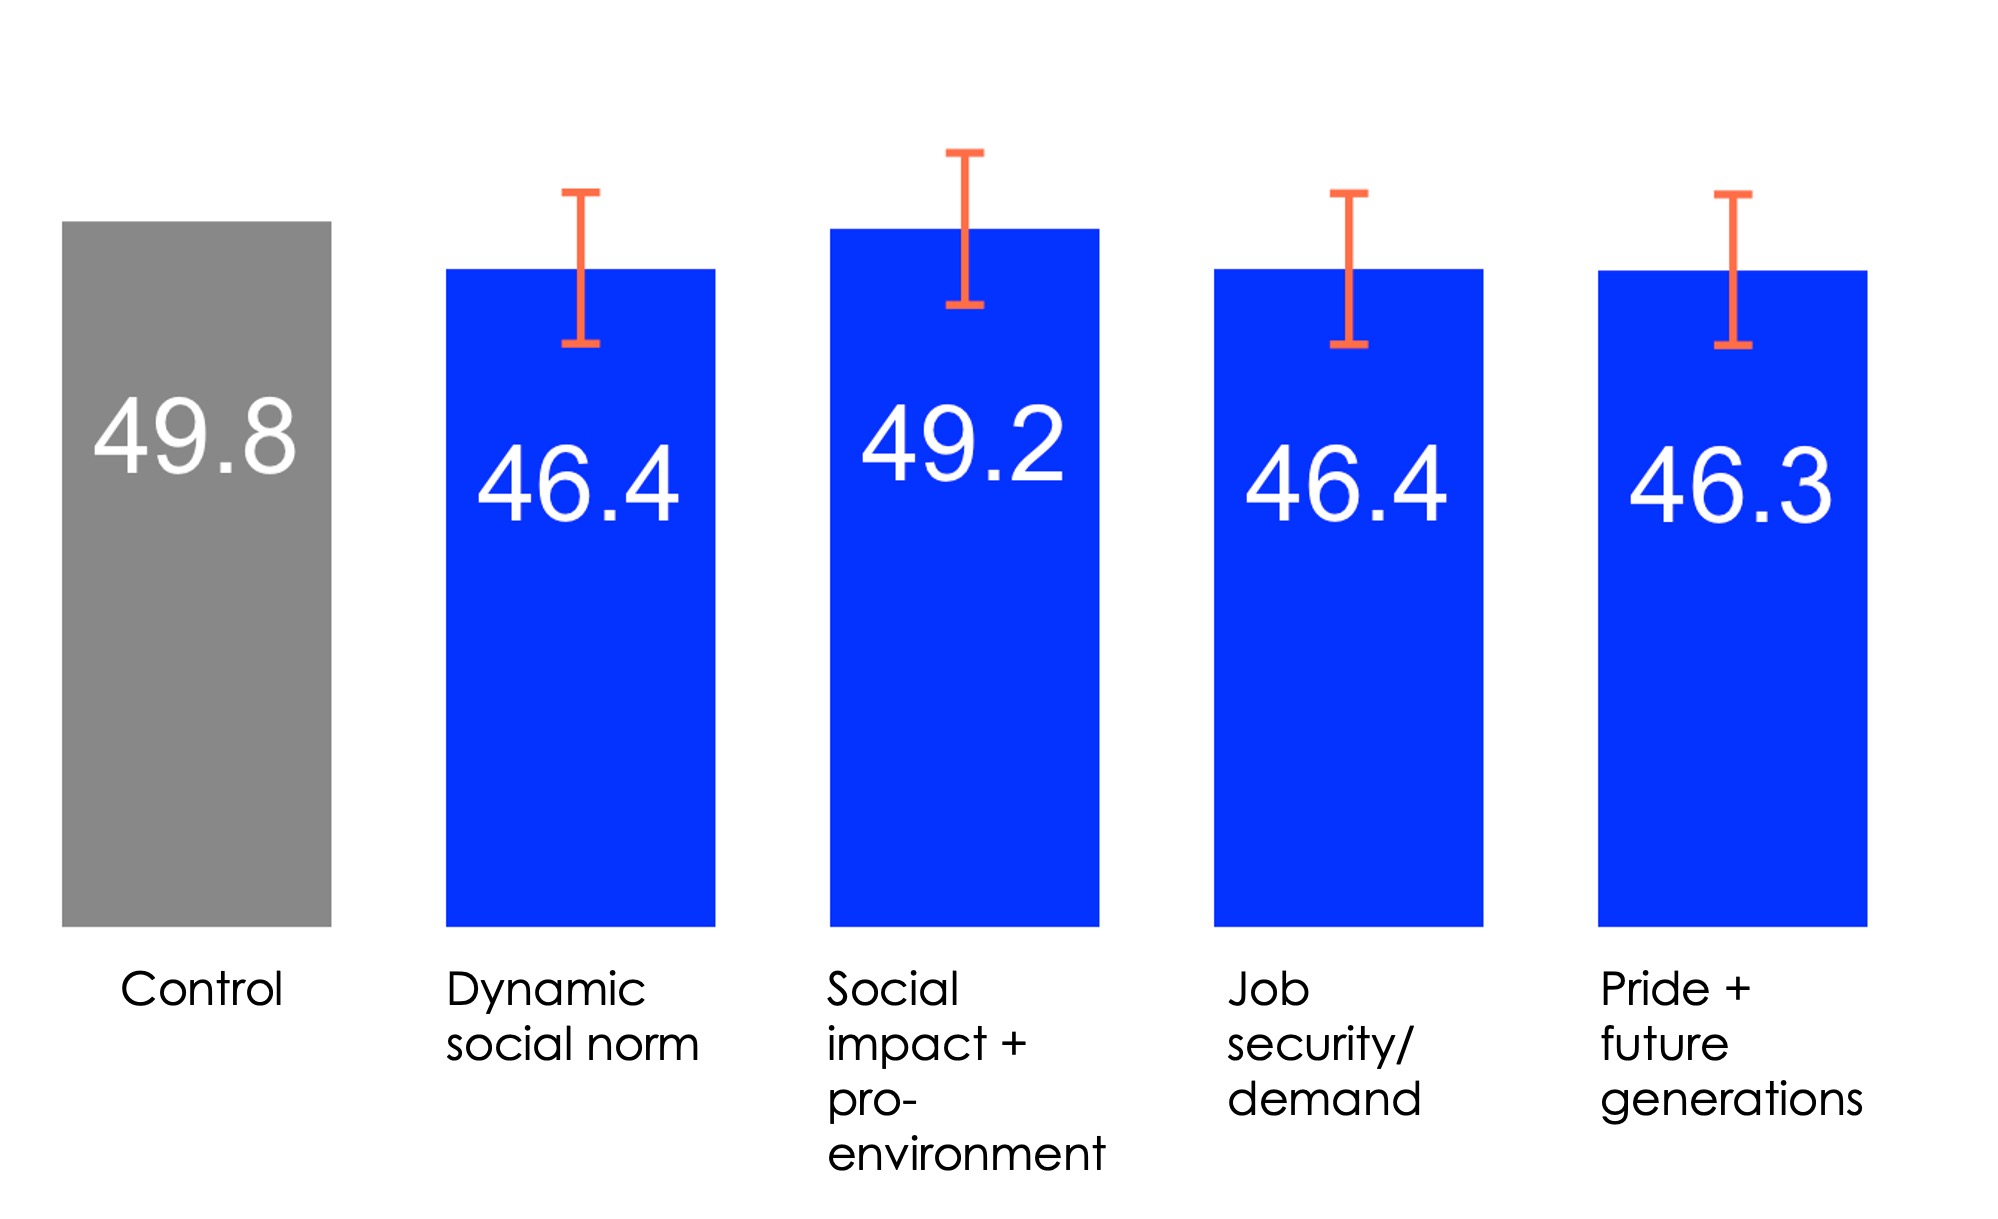
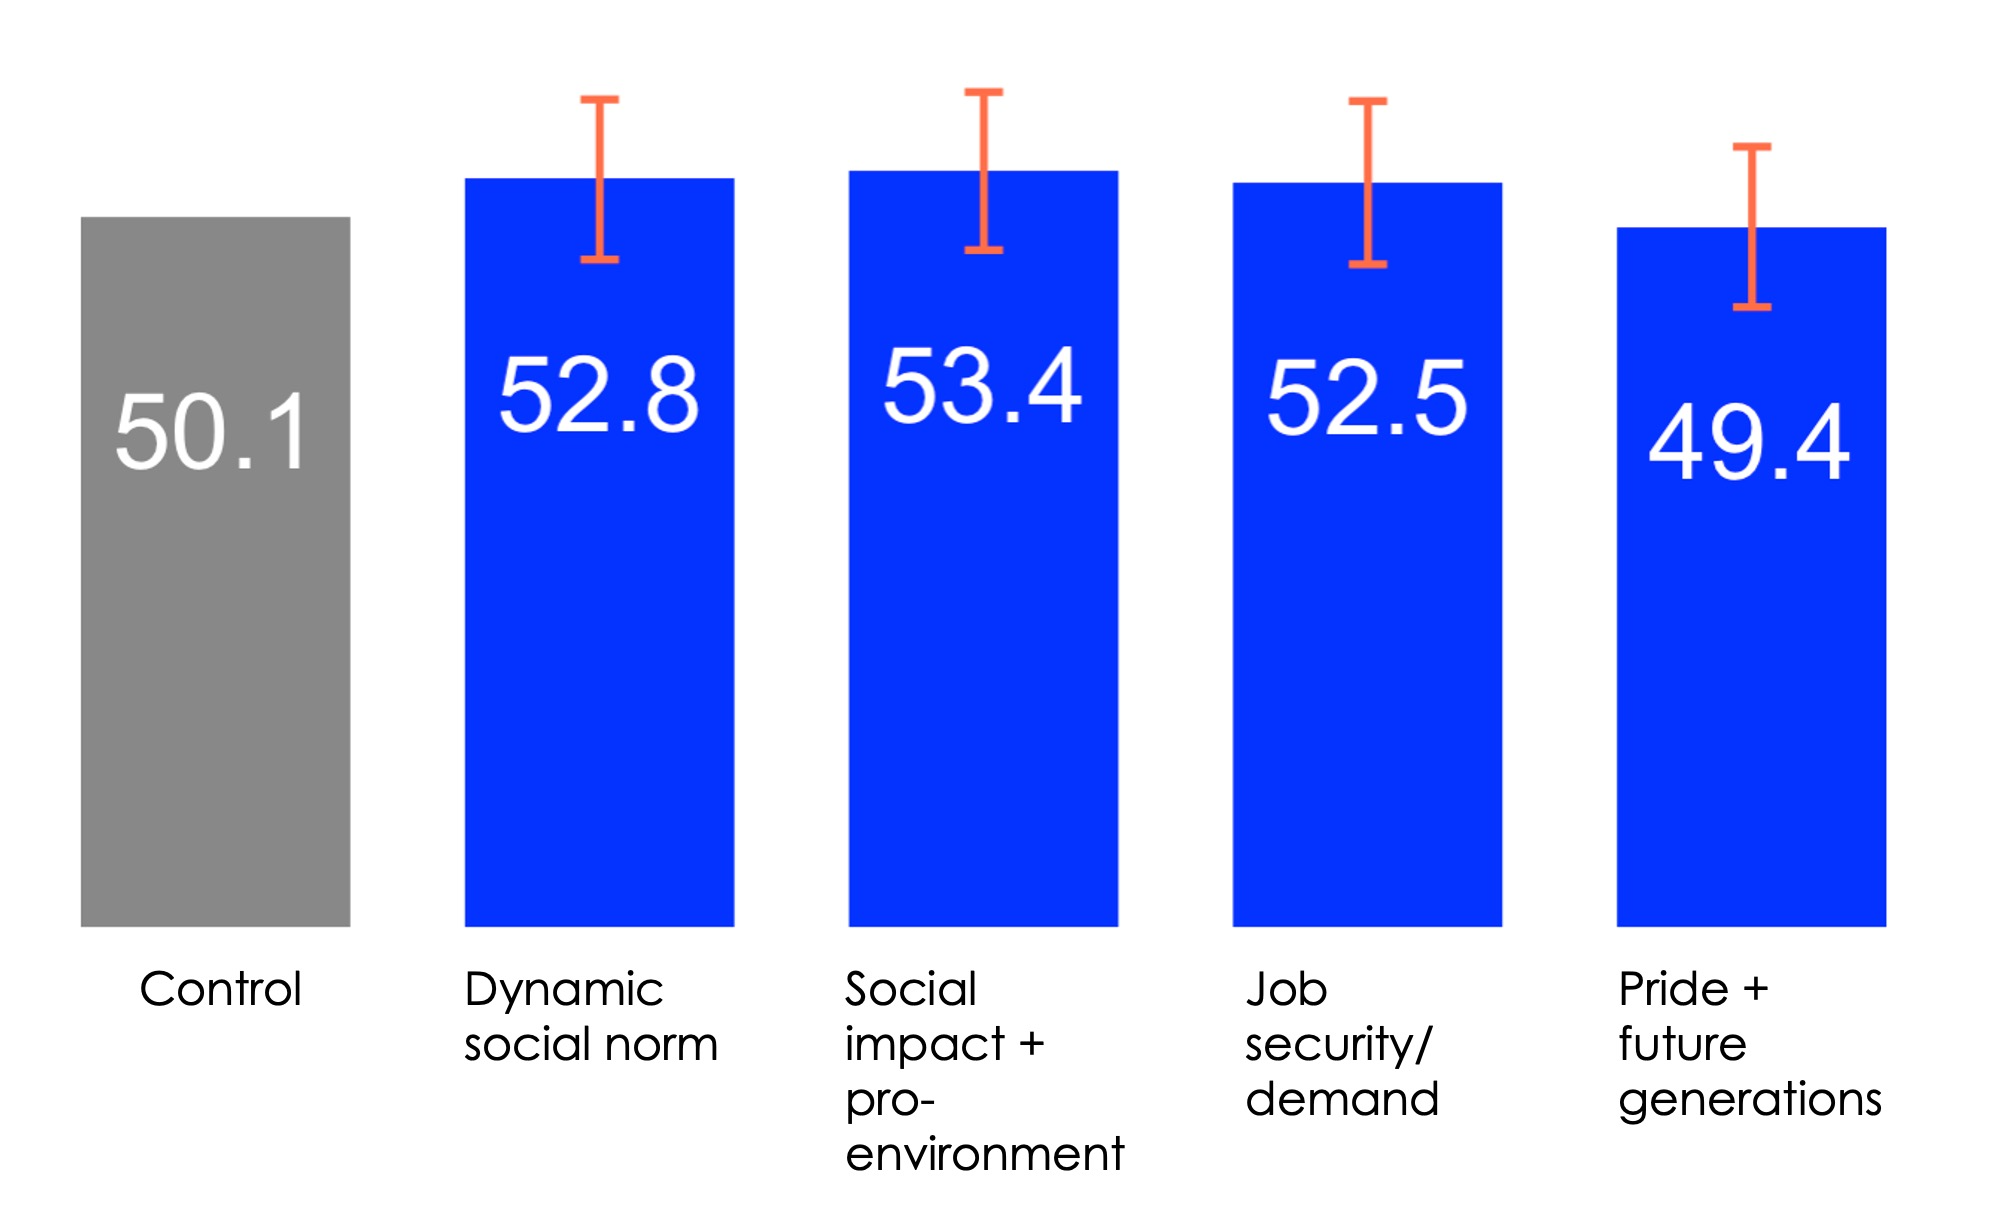
Interest in green skills training, by economically active and recent graduate group
Appendix 2 – breakdown of interest in framings
Breakdown of interest in the green skills training offer
Free text feedback on advertisements
Logos
Advertisement for Green Job Training
This advertisement encourages individuals to have an impact on the planet and their community by working in a green job.
- Main message: "Have an impact on the planet and your community by working in a green job."
- Call to action: "Gain the skills you need to work in a green job with a training course relevant to you. Explore our training courses today."
- Course Cost: "Courses range from £500 - £3,000."
A pop-up box with further details appears if participants click the link:
- Our courses are tailored to your preferences and skills, and are designed to equip you with the relevant skills you need to work in your desired green job. Further details on our courses below:
- Full-time and part-time courses available
- Day and evening courses available
- Course length ranges from 4 weeks to 3 months
- Available both online and in-person

Participants were then asked a series of questions, and we collected data to measure the impact of the different framings.
Green skills offer incentives
Participants were then randomised to see one of four arms. Three included different financial incentive structures, while one had no financial incentive. Each of the incentives chosen were informed by existing (or past) government schemes designed to increase the uptake of training/education, eg, loans and bursaries designed to encourage take up of vocational training.
C2: Control (n = 1,994)
Start your journey towards a green job by developing green skills through our training courses tailored to you
Courses range from £500 - £3,000. Courses are paid by the trainee upfront.
T5: Incentive/grant (n = 2,017)
Start your journey towards a green job with government bursaries of up to £1,500* available for people who want to develop their green skills through our training courses tailored to you
Courses range from £500 - £3,000
*Bursaries are grants that are paid towards your studies and do not need to be paid back.
T6: Loan (n = 1,985)
Start your journey towards a green job today with government loans* for people who want to develop their green skills through our training courses tailored to you
Courses range from £500 - £3,000
*Loans can cover up to £3,000. You only start to repay your loan once you earn over a certain amount, and the amount you pay back monthly is based on what you earn.
T7: Subsidy/discount (n = 2,024)
Start your journey towards a green job with a government-backed 50% discount* for people who want to develop their green skills through our training courses tailored to you
Courses range from £500 - £3,000
*Receive 50% off the green skills training courses
Participants were then asked a further series of questions, and we collected data to measure the impact of the financial incentives.
Results
Perceptions of green jobs
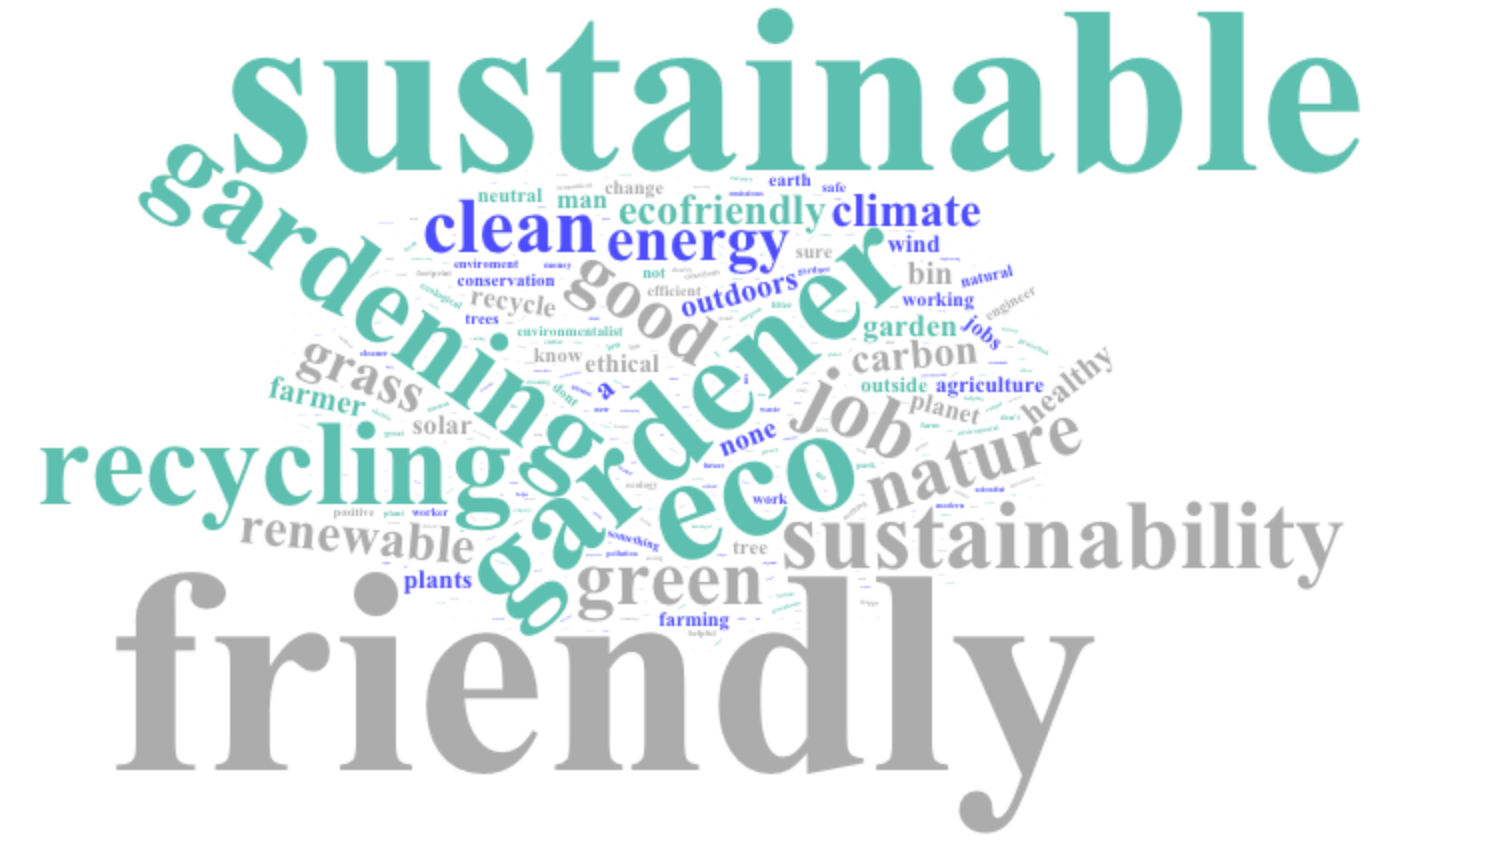
When thinking about green jobs, people generally understood that these jobs were good for the environment, noting that they are 'sustainable' or 'environmentally friendly'. However there were some misconceptions around green jobs being about gardening or agriculture.
How framings of green skills offers affect interest in and sentiment towards green skills training
Interest in green skills training courses
All framings performed similarly well in sparking interest in green skills training courses. Around one in two said that they were interested regardless of how they were framed.
N = 8,120
Primary analysis. Logistic regression including covariates.
Corrected for multiple comparisons.
** p < 0.01, * p < 0.05, + p < 0.1
Numbers in bars equals the control mean +/- treatment effects.
Data collected by BIT on 13 March - 12 April 2023.
Reasons for why people were or were not interested
The main reason people wanted to do a green skills training course was because they wanted to work in a job that would help the environment, while many also said that the demand for green jobs will increase in the coming years or that a green job is one they could be proud of. Interestingly, these top three responses align with three of the framings we tested (social impact + pro-environmental, job security + green job demand, and pride + future generations), suggesting that although the framings did not increase intentions to undertake green skills training, we did identify some of the key drivers for individuals.
Among those who said they would be interested in doing a green skills course (n = 4,070),
- 54% said they want to work in a job that will help the environment
- 47% said the demand for green jobs will increase in the next few years
- 45% said they want to work in a job they can be proud of
- 40% said the training looks interesting
- 28% said green jobs are a good local option
- 25% said green jobs offer job security
- 25% said they could get a better paying green job
- <1% Other (including helping their current organisation to develop better green credentials, having an interest in the environment or a related qualification)
Those who were not interested in taking a green skills training course said that they were too expensive, being priced at £500-£3,000. Among those who were not interested, 24% (12% of the full sample) thought that green jobs were not suitable for them, while 21% (or 10% of the full sample) thought the offer was not relevant to them. This suggests a group of people who may be targetable if they had the right information about green jobs.
Among those who said they would not be interested in doing a green skills course (n = 4,050),
- 61% said it was because the £500-£3,000 price range is too expensive
- 35% said it was because they are happy in their current job
- 24% said it was because they don't think green jobs would be suitable for them
- 21% said it was because the training offer is not relevant for them
- 19% said it was because the training does not look interesting
Interest in green skills training by gender and by economically active and recent graduate group
Our analysis found no statistically significant differences for how framings affected interest in green skills training offers for men and women or either of the economically active or recent graduate groups. See Appendix 1-2 for more detail.
Willingness to pay for green skills training courses
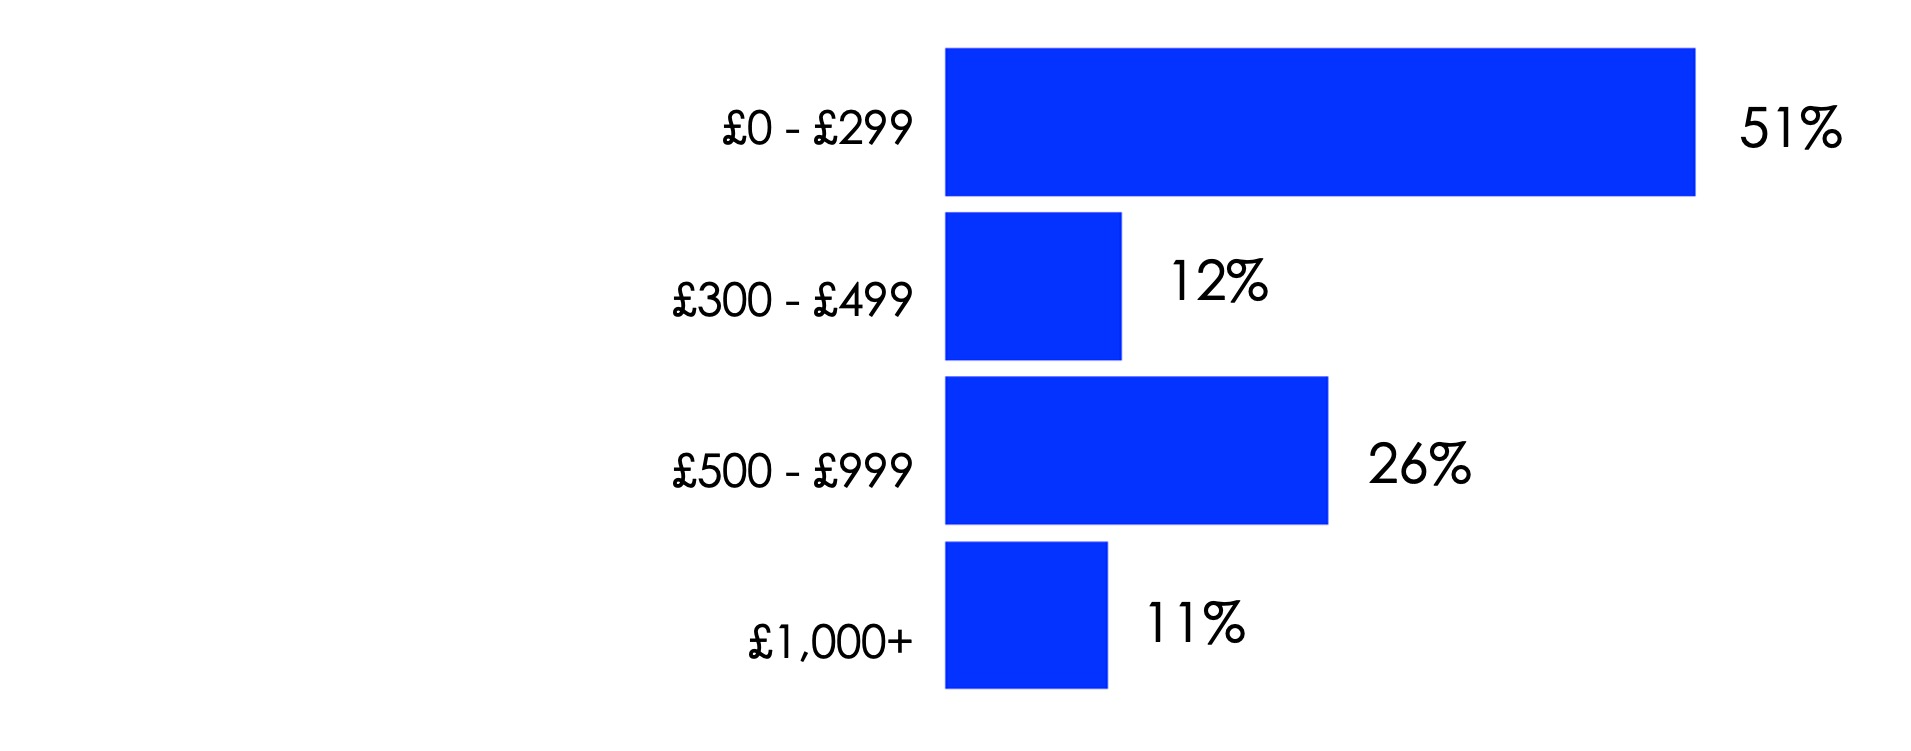
Those who were interested in green skills training courses said they were willing to pay £200 for a green skills training course. Each advert had mentioned that the course cost ranged from £500-£3,000: this is a sizable range based on the typical lower bound of online skills training courses (though we note that costs vary significantly based on criteria such as the method of delivery, frequency of the course, length of the course etc). It is therefore all the more interesting that the median amount participants were willing to pay fell below the bottom of this range.
N = 8,120
Primary analysis. Logistic regression including covariates.
Corrected for multiple comparisons.
** p < 0.01, * p < 0.05, + p < 0.1
Numbers in bars equals the control mean +/- treatment effects.
Data collected by BIT on 13 March - 12 April 2023.
Prior to answering this question, participants were asked to consider what going on a green skills training course would mean for their current income. Around one in five said they would miss out on work and income in order to do this training course, while two in three said they would do training at times which meant they would not have to miss out on work.
When going on a green skills training course...
- 45% said they would do training at times that meant they would not have to miss work or lose income
- 19% said they would miss out on work and therefore lose income while training
- 15% said they have savings that would cover their lost work and income while training
- 14% said their employer would allow them to take paid leave while training
Sentiment towards the green skills training offer framings
Participants generally had positive sentiment towards all green skills advertisements, regardless of framings. Participants felt that the dynamic social norm, social impact and pride framings were the most engaging.
| After seeing the advertisement, % who thought the advertisement... |
Control (n = 1,646) |
Dynamic social norm (n = 1,620) |
Social impact (n = 1,649) |
Job security (n = 1,578) |
Pride (n = 1,627) |
| ...is easy to understand |
80% |
80% |
82% |
80% |
82% |
| ...would make people consider green skills training |
48% |
51% |
51% |
48% |
52% |
| ...is affordable |
33% |
29% |
31% |
30% |
31% |
| ...is engaging |
43% |
48% |
50% |
46% |
48% |
| ...is relevant to them |
39% |
38% |
41% |
38% |
38% |
| ...had the right amount of information |
54% |
64% |
64% |
62% |
62% |
N = 8,120
Exploratory analysis. Logistic regression including covariates.
Green (red) text identifies values statistically significantly (p<0.05) higher (lower) than the control.
Numbers in the table are mean averages within each group.
Data collected by BIT on 13 March - 12 April 2023.
After seeing the social impact framing, participants were more likely to think that a green job would help the environment and improve people's lives and communities.
| After seeing the advertisement, % who thought that a green job would... |
Control (n = 1,646) |
Dynamic social norm (n = 1,620) |
Social impact (n = 1,649) |
Job security (n = 1,578) |
Pride (n = 1,627) |
| ...be a good fit for their skills |
44% |
45% |
45% |
45% |
45% |
| ...be an interesting career path |
61% |
62% |
64% |
61% |
63% |
| ...challenge them to improve their skills |
58% |
60% |
60% |
57% |
61% |
| ...be a possible career path for them |
43% |
43% |
43% |
41% |
44% |
| ...be a worthwhile career path |
59% |
62% |
62% |
62% |
61% |
| ...help the environment |
79% |
80% |
82% |
80% |
80% |
| ...improve people's lives and communities |
69% |
71% |
73% |
69% |
74% |
N = 8,120
Exploratory analysis. Logistic regression including covariates.
Green (red) text identifies values statistically significantly (p<0.05) higher (lower) than the control.
Numbers in the table are mean averages within each group.
Data collected by BIT on 13 March - 12 April 2023.
How financial incentives affect interest in and sentiment towards green skills training
After seeing the framings for the green skills offers, participants were then randomised to see one of four arms. Three included different financial incentive structures, while one had no financial incentive.
Interest in green skills training following the financial incentives
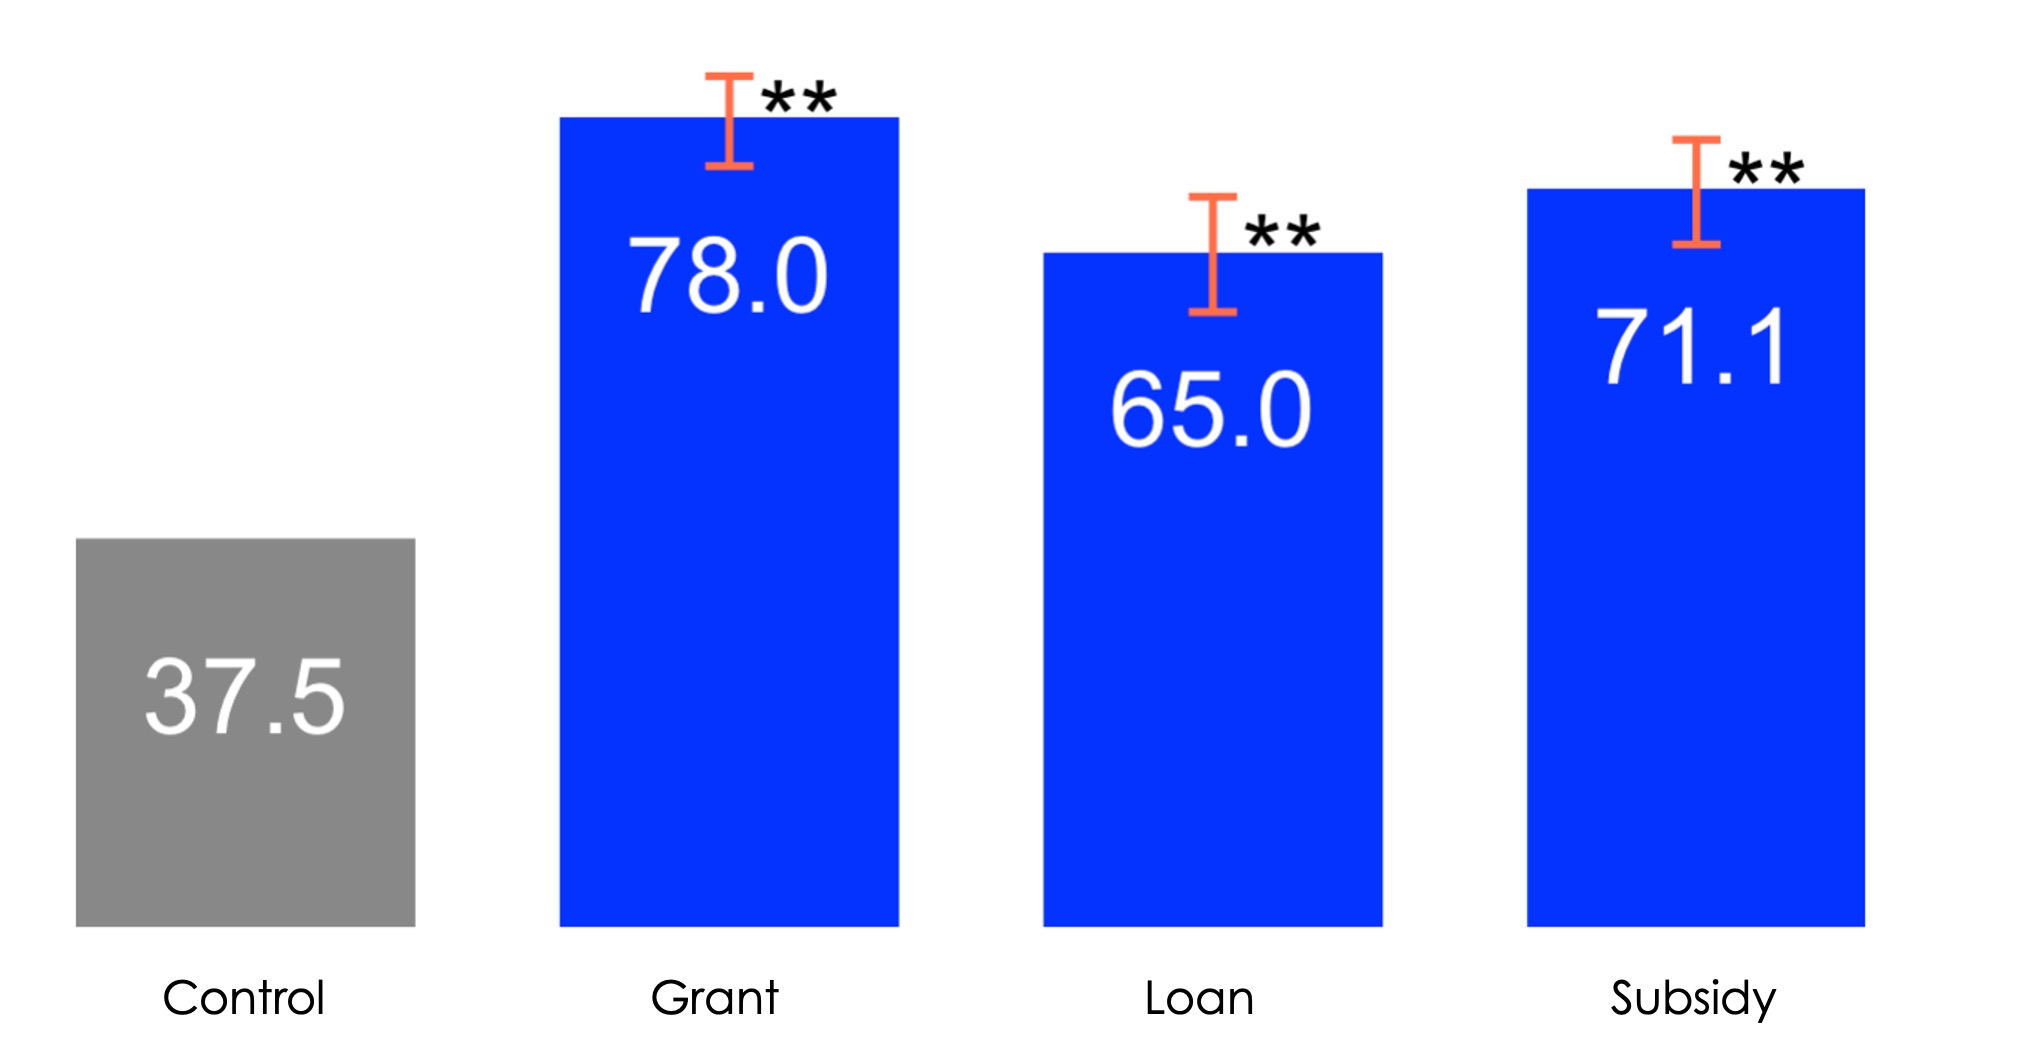
The grant (+39.5pp), loan (+28.2pp) and subsidy (+33.3pp) all significantly increased interest in green skills offers compared to the control group.
N = 8,120
Secondary analysis. Logistic regression including covariates.
Corrected for multiple comparisons.
** p < 0.01, * p < 0.05, + p < 0.1
Numbers in bars equals the control mean +/- treatment effects.
Data collected by BIT on 13 March - 12 April 2023.
Following the first experiment, 50% of participants had been interested in going on a green skills training course, across all arms. This fell to 37.3% for the control arm in the second experiment. The only additional information participants randomised into the control received in the second experiment, was that training costs had to be paid by the trainee upfront. It is therefore possible that in the first experiment, participants did not consider the cost and who would be paying for the training when indicating their interest, and only took this into account when it was explicitly stated that they would need to pay. It is also possible that participants assumed that someone else would pay for the training, eg, their employer. Alternatively, a second possibility for the decrease in interest may be due to the control in this second experiment being plain in design compared with the previous experiment and potentially being perceived as being repetitive.
The grant and subsidy arms were different ways of framing a financial incentive which had the same implications for participants: in both cases, trainees could receive up to £1,500 for a green skills training course, which they would not have to pay back. It is therefore interesting that there was a 6.2pp difference in the effectiveness of these two incentives, whereas it is unsurprising that both outperformed the loan treatment, which did need to be paid back.
The financial incentives increased the overall attractiveness of the green skills training offer.
Among those who said they are still/now interested (n = 4,314),
- 66% said it was because the financial incentive makes it a good offer
- 30% said it was because the training is a good price
However, a large proportion of those who indicated they were not interested in the offer still believed the training was too expensive, highlighting the significance of financial barriers in preventing potential take up.
Among those who said they are not interested after seeing the financial information (n = 3,806),
- 41% said it was because the training is too expensive
- 18% other (including not interested in green jobs/retraining, being happy in current job, lack of details of the financial offer, such as APR)
Interest in the green skills training following the incentives, by economically active and recent graduate group
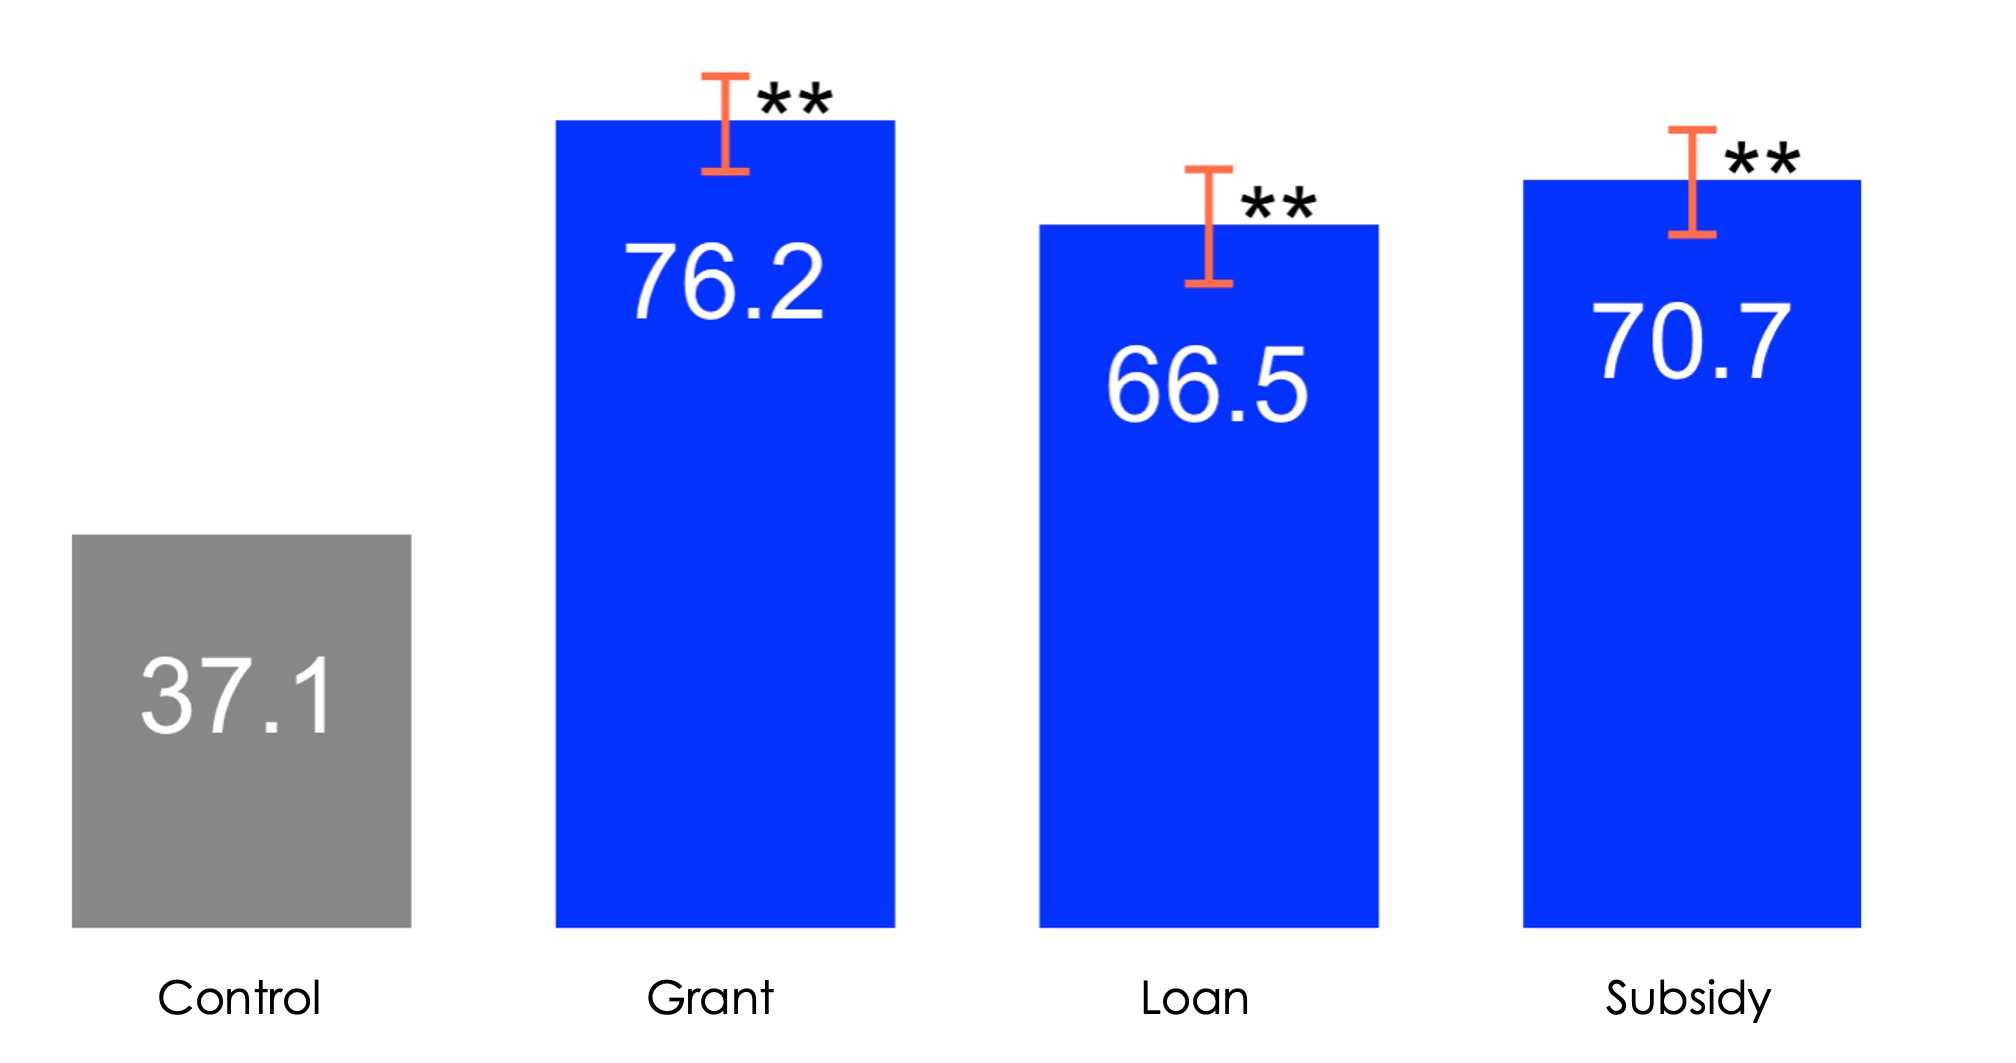
The grant, loan and subsidy were equally effective at increasing interest for both economically active people and recent graduates.
Exploratory subgroup analysis. Logistic regression including covariates.
** p < 0.01, * p < 0.05, + p < 0.1
Numbers in bars equals the control mean +/- treatment effects.
Data collected by BIT on 13 March - 12 April 2023.
Interest in green skills training following the incentives, by gender
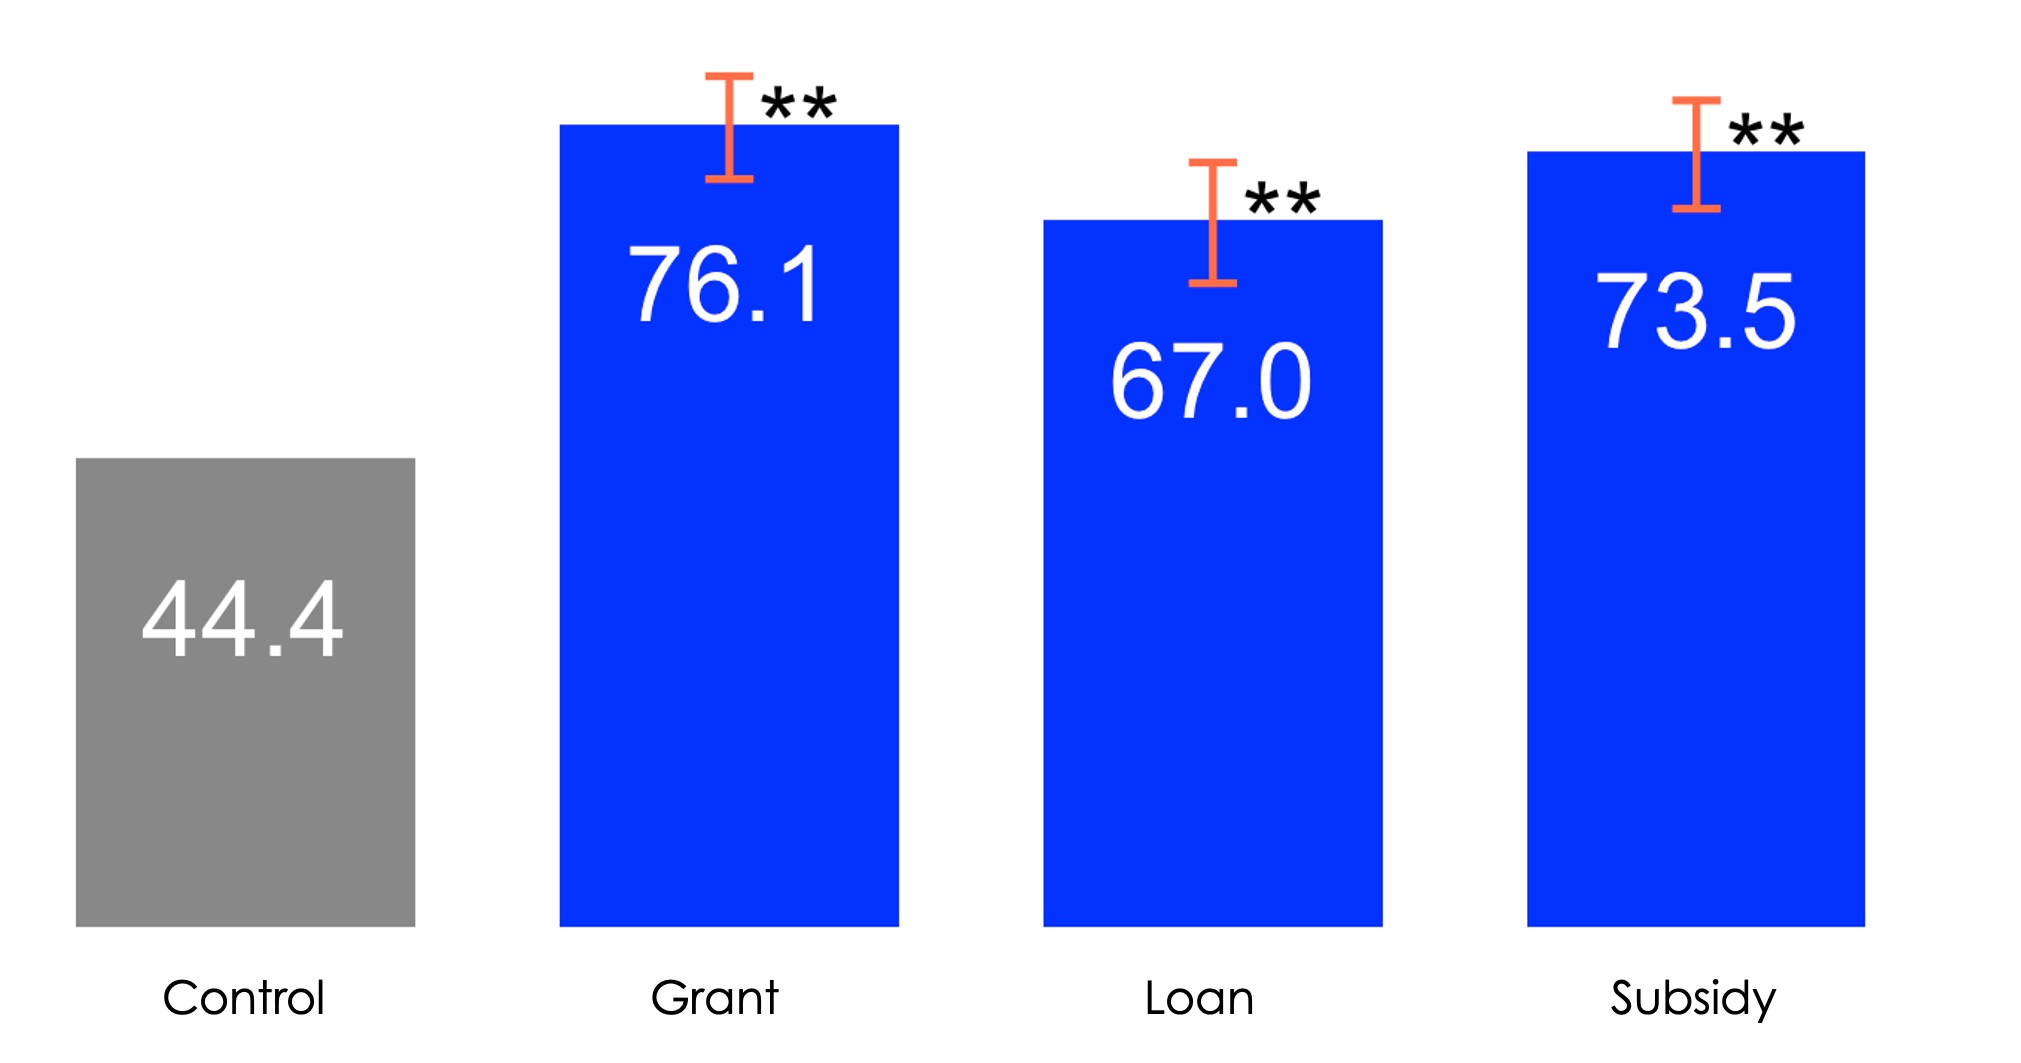
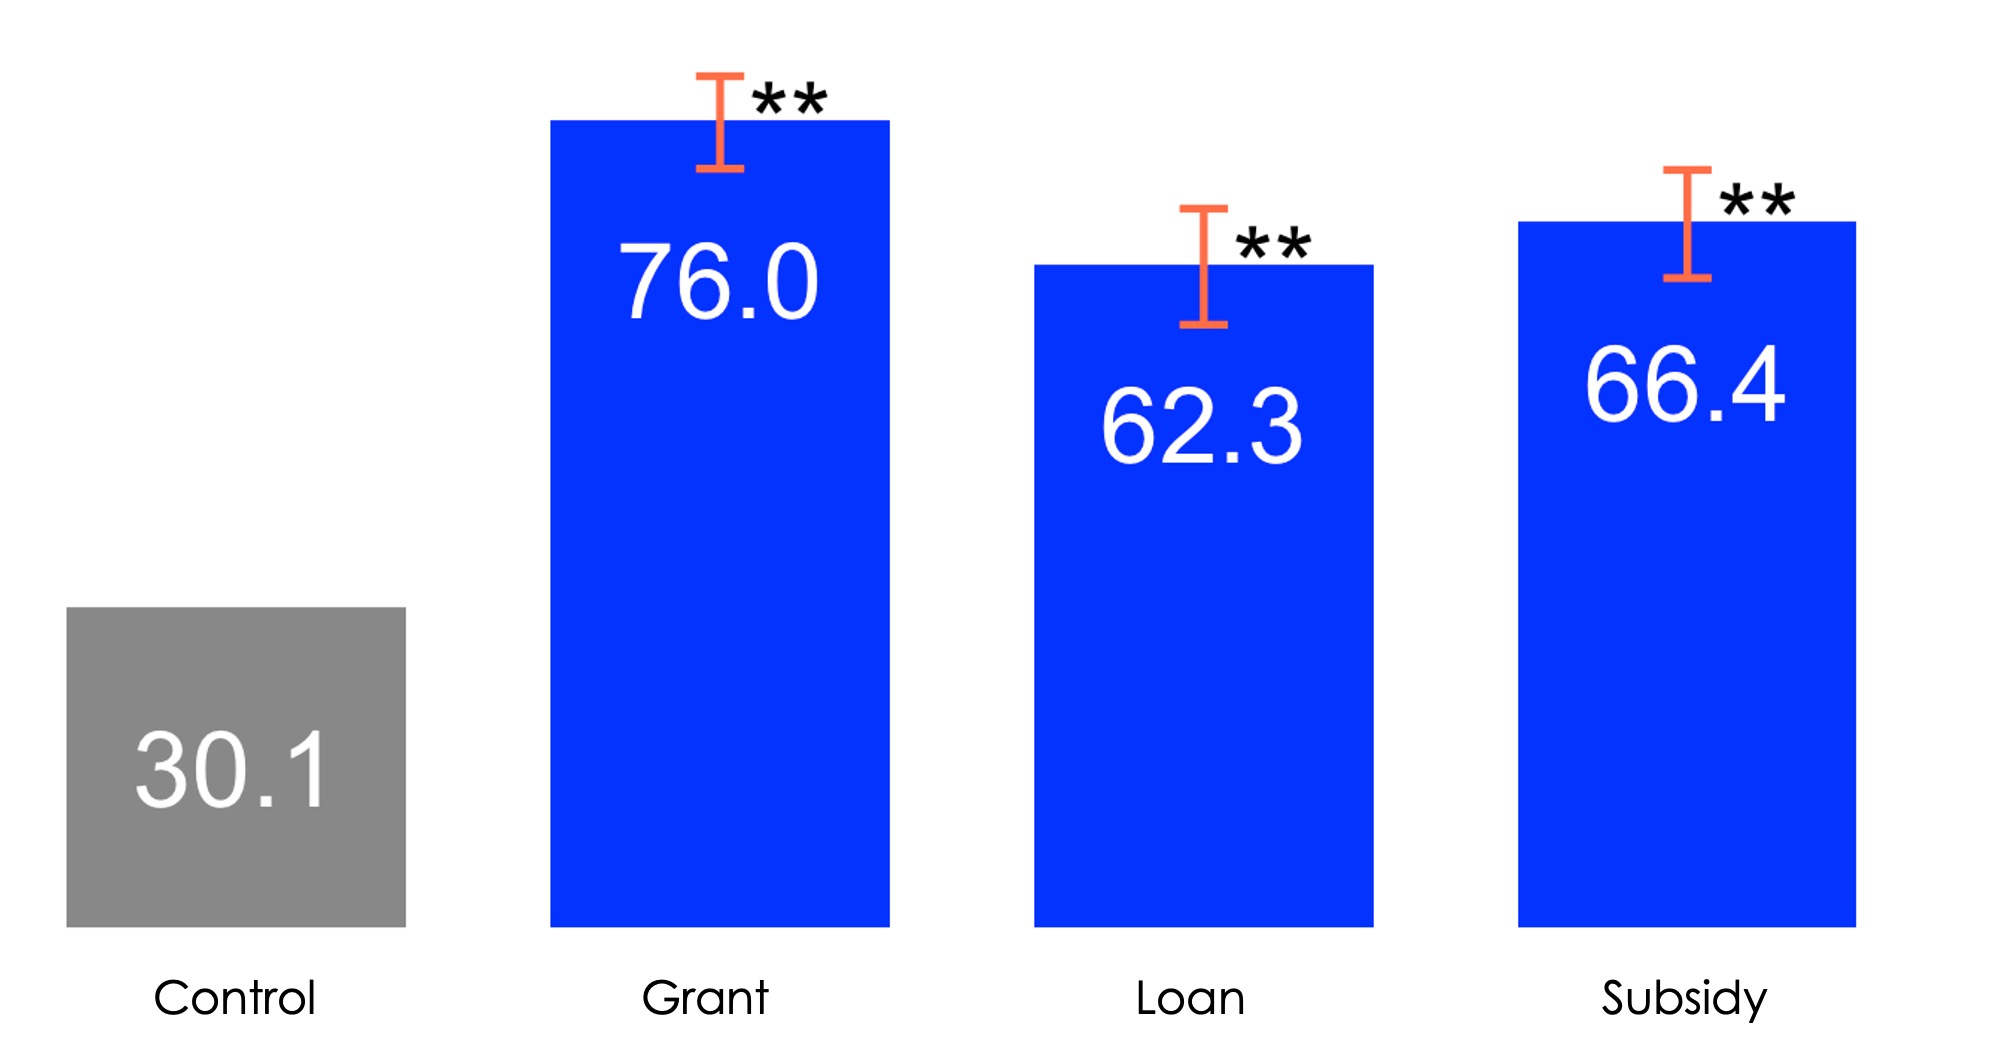
The grant was equally effective at increasing interest in the green skills offer for both men and women. Given that women had a lower baseline interest in the training after seeing the control (30.1% women v 44.4% men), it appears that all financial incentives were comparatively more effective at increasing interest among women, than among men. In particular, the grant increased interest among women by 45.9pp (31.7pp for men).
Exploratory subgroup analysis. Logistic regression including covariates.
** p < 0.01, * p < 0.05, + p < 0.1
Numbers in bars equals the control mean +/- treatment effects.
Data collected by BIT on 13 March - 12 April 2023.
Sentiment towards the financial incentives
People felt most positively towards the grant and subsidy incentives.
| After seeing the incentive, % who... |
Control (n = 1,994) |
Grant (n = 2,017) |
Loan (n = 1,985) |
Subsidy (n = 2,024) |
| ...would use the incentive to help them pay for a green skills training course |
- |
77% |
63% |
76% |
| ...would find it useful |
- |
65% |
54% |
58% |
| ...would encourage them to go on a green skills training course |
- |
62% |
51% |
56% |
| ...would encourage them to find out more about the green skills training course |
- |
63% |
53% |
58% |
N = 8,120
Exploratory analysis. Logistic regression including covariates.
Green text identifies values statistically significantly (p<0.05) highest (or joint highest) values within each row.
Numbers in the table are mean averages within each group.
Data collected by BIT on 13 March - 12 April 2023.
Attitudes towards and understanding of green jobs
Following the experiment, we asked further questions to understand people's attitudes towards and understanding of green jobs and green skills training.
Many think green jobs are important but few know what green jobs are available and where to look for them.
Salary is still a key consideration for taking green jobs.
- 77% said they would only take a green job if it paid the same as or more than a non-green job
- 13% said they would accept a lower wage in order to work in a green job
- 10% said they don't mind whether, or not, their job benefits the environment
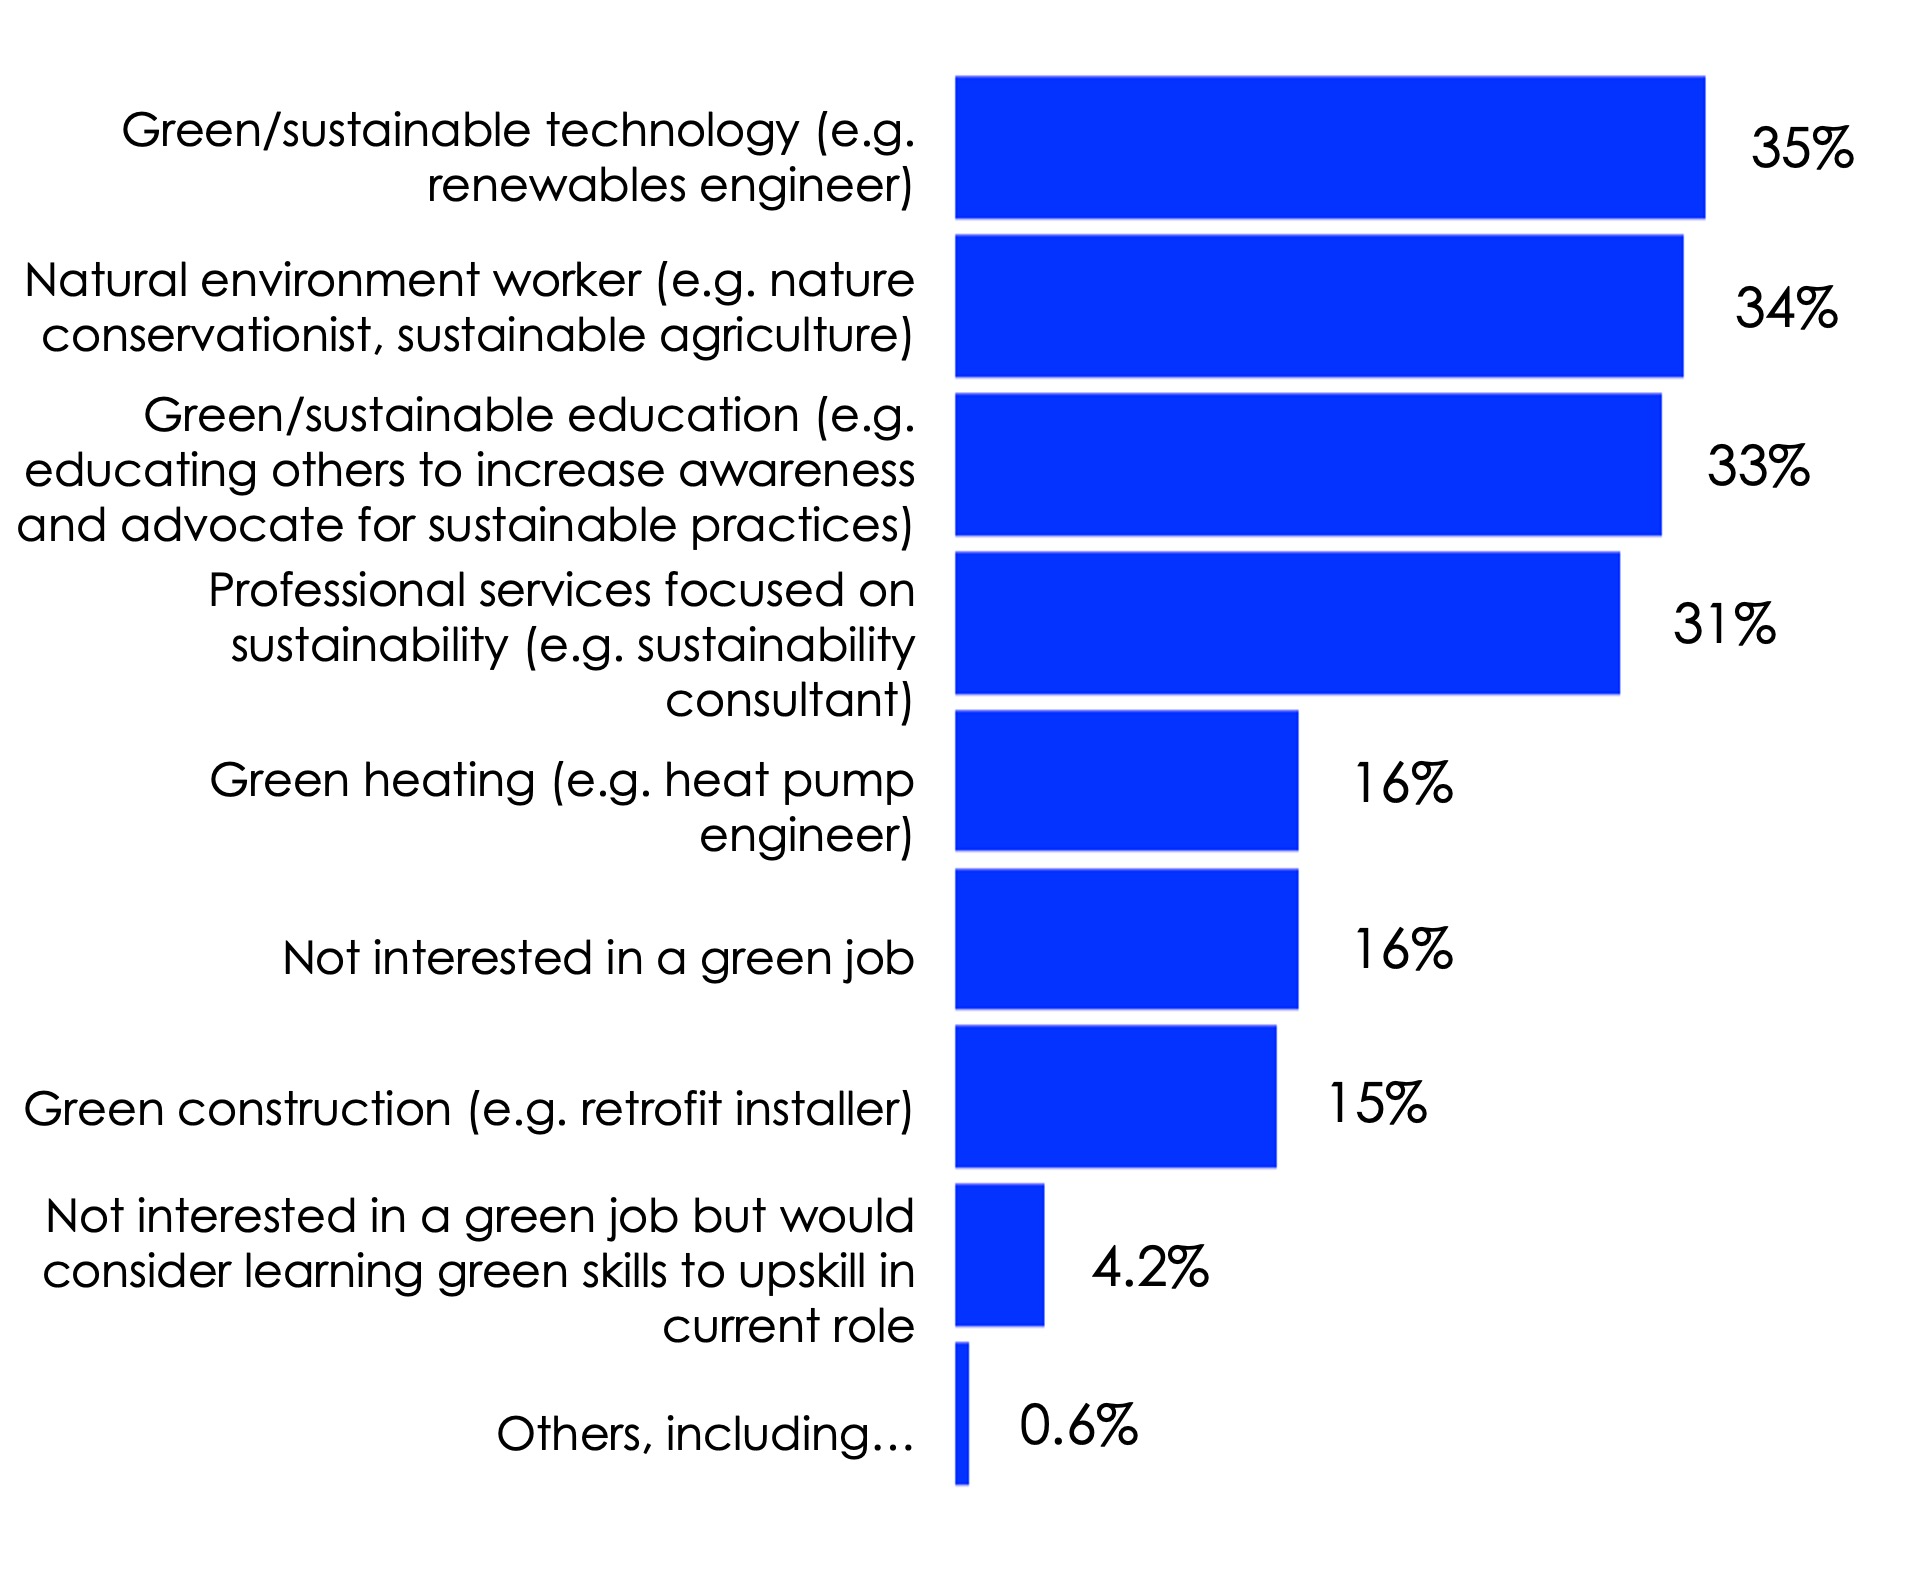
Green/sustainable technology was the green job category most people were interested in taking up.
When probed further into specific jobs people were interested in, participants said they would be interested in jobs such as a conservationist, educator, environmental analyst/officer, engineer/technician, green marketer, sustainability consultant, or roles involving management or customer service.
Implementation of green skills training courses
Of those who were interested in going on a green skills training course, the most popular course length was up to a month, and four to eight hours per week.
Preferences for course length
- 23% Up to a month
- 20% 2-3 months
- 19% Up to 2 weeks
- 17% More than 3 months
- 9% Up to week
- 6% A one-off standalone course
- 6% Don't know
Preferences for course hours
- 34% 4-8 hours
- 23% 8-16 hours
- 21% 2-4 hours
- 8% 16-32 hours
- 5% 0-2 hours
- 4% Don't know
- 3% More than 32 hours
Participants were more likely to attend weekday courses in the evening.
| % who said they would be most likely to attend their course on a...(n = 5,115) |
|
| ...weekday, in the evening |
35% |
| ...weekday, in the day |
23% |
| ...weekend, in the day |
20% |
| ...weekend, in the evening |
8% |
| Any of the above |
10% |
Participants preferred to have online or hybrid courses.
Online vs in-person
- 38% Online course
- 35% Hybrid course
- 20% In-person course
- 5% Any of the above
Recommendations
Policy recommendations
Recommendations for further research
-
Consider any gaps for different groups
- Our analysis found that men were significantly more interested in green skills training than women. If policymakers/employers are interested in narrowing this gap, further research is needed to explore why this may be the case. It is worth noting that although the framings did not significantly increase interest in the green skills offer among women, the framings did have a positive effect compared with the control offer, whereas for men this was not the case. Further research could examine this in more detail, for example by testing how framings may differentially affect interest across men and women in the context of specific (rather than generic) green skills training offers. Policymakers/employers may also be interested in comparing results for other groups of interest, eg, considering other demographic characteristics.
-
It is also worth noting that our analyses found little difference in interest for the economically active and recent graduate group which was unexpected given existing evidence that younger demographics may be more interested in working in green jobs. It is possible that the lack of difference was due to targeting recent university graduates who have just completed education and may not be interested in paying for additional training at this stage. Despite this, younger people remain a potential lower hanging fruit for filling the green jobs skills gap and further research is needed to address the barriers that may prevent them from accessing green jobs, such as awareness.
- Consider the efficacy of low-cost, low-time intensive 'foot-in-the-door' training as a means of encouraging take up of longer-term training
- Our analysis found that people were only willing to pay £200 for green skills training, and didn't know what to expect from green skills courses. Despite this, interest was still high across the sample (50%). With this in mind, further research could be carried out to see whether offering, for example, a one-day free course, or a £200 course, may pique interest enough to lead to increased willingness to take up green skills training in the long term.
- Conduct further research on the efficacy of various framings for green skills training and green jobs
- Although our analysis revealed no significant differences across our green skills offer framings, we believe this may be due to our decision to make our skills training offers generic to appeal to a wider audience, ie, the offers were non-specific to the type of training involved and the specific green job it would prepare participants for. This was noted by participants who commented on the lack of specificity of the job adverts directly. It is therefore possible that framings may be effective in situations where the training course is green skill-specific or green job-specific, for example, when communicating training for heat pump or retrofit installers and doing so in a real-world setting.
- Framings could also be effective if they are made to focus on what people are most interested in, such as communicating the salaries of green jobs. Based on our finding that the majority (77%) said they would only take a green job if it paid the same as or more than a non-green job, messaging that highlights the increased salary opportunities that may follow from green training may therefore be an effective motivator in encouraging green skills take up.
Appendix I - framings subgroup analyses
Interest in green skills training, by gender
Across all framings, men were more interested in green skills training than women (53% men vs 47% women). This seems to align with research by WorldSkills UK, who found a gender gap in the level of understanding towards green skills, with 72% of young women (16-24) saying they had never heard of green skills, compared with 53% of young men.
Looking across all framings, there were no statistically significant differences for how framings affected interest in green skills training offers for either men or women. We find that the social impact framing tended to perform best amongst the treatments for both men and women. While the differences were not statistically significant, it is curious that among men no treatment outperformed the control, whereas all the framings outperformed the control for women.
Men (n = 4,070)
Women (n = 3,996)
Exploratory subgroup analysis. Logistic regression including covariates.
**p < 0.01, * p < 0.05, + p < 0.1
Numbers in bars equals the control mean +/- treatment effects.
Data collected by BIT on 13 March – 12 April 2023.
Interest in green skills training, by economically active and recent graduate group
There were no statistically significant differences for how framings affected interest in green skills training offers for either the economically active or recent graduate groups.
In both groups, the pride framing tended to be the worst performing. For the economically active group, no treatment outperformed the control framing. Whilst not statistically significant, recent graduates tended to be more interested after seeing the dynamic social norm, social impact or job security framings, compared to the control group. In both groups, the social impact framing was the best performing treatment.
Across framings, there was little difference in interest for the economically active and recent graduate group (49% economically active vs 51% recent graduate).
Economically active (n = 4,093)
Recent graduate (n = 4,027)
Exploratory subgroup analysis. Logistic regression including covariates.
**p < 0.01, * p < 0.05, + p < 0.1
Numbers in bars equals the control mean +/- treatment effects.
Data collected by BIT on 13 March – 12 April 2023.
Appendix 2 – breakdown of interest in framings
Breakdown of interest in the green skills training offer
Around 6 in 10 thought that others would be interested in going on green skills training courses, suggesting that people tend to think interest in these skills is normalised. People were most likely to think that other people would be interested in going on a green skills training course after seeing the dynamic social norm message.
Interestingly, the control skills offer had the highest clickthrough rate to see more information (16%). We believe that this is due to an ordering effect whereby in the control, the call-to-action link was immediately below the image, whereas the treatments had the text 'gain the skills you need' above the link, possibly making it less prominent.
| After seeing the advertisement, % who... |
Control n = 1,646 |
Dynamic social norm n = 1,620 |
Social impact n = 1,649 |
Job security n = 1,578 |
Pride n = 1,627 |
| ...think most other people with their skills would be interested in going on a green skills training course |
59% |
63% |
62% |
62% |
63% |
| ...would be interested in finding out more about green skills training courses |
66% |
67% |
67% |
64% |
67% |
| ...would share the advertisement with someone who has similar skills to themselves |
54% |
54% |
58% |
56% |
56% |
| ...clicked to see more information |
16% |
11% |
12% |
12% |
11% |
N = 8,120
Exploratory analysis. Logistic regression including covariates.
Green (red)text identifies values statistically significantly (p<0.05) higher (lower) than the control.
Numbers in the table are mean averages within each group.
Data collected by BIT on 13 March – 12 April 2023.
Free text feedback on advertisements
Across all advertisements, people felt that they were easy to understand, and included key information that was personal and relevant to the individual.
The advertisements were clear, engaging and easy to understand
- 'Is worded in such a way to make the training enticing'
- 'Easy to understand and follow'
- 'Eye catching'
The advertisements were short but included the price, a 'call to action' and the ability to click for more information if interested
- 'It says what it means in plain language. You are not overwhelmed by information, but you are invited to look further at training courses'
- 'Upfront about the price'
- 'It shows a clear call to action, and defines the cost'
- 'It's not verbose. Click to find out, rather than needlessly wordy advertising'
The information was personal and relevant to the individual
- 'I like the phrase "training course that is relevant to YOU”, because it implies that they are speaking directly to you – the individual; and it inspires you to take action in my opinion.'
People were complimentary towards specific aspects of each message.
T1: Dynamic social norm
The 'get ahead of the curve' phrasing
- '[A]head of the curve' implies it is a future skill that will be in demand'
- 'Getting ahead of the curve. It's all about working towards a better future and being one of the first people to do it'
- 'Encouraging term'
- 'Motivating language'
Can join other people who are doing it
- ‘Joining people makes it feel communal and plays into the greater good idea of a green skill'
- 'The fact that they note that the number of people joining the roles is increasing'
- 'The invitation to join a group of people'
T2: Social impact + pro-environmental
Having an impact is important and makes people feel valued
- 'I like the word IMPACT. [It] makes the job seem important to the environment'
- 'Hav[ing] an impact makes your work sound impactful and [is] guaranteed to help'
- 'Impact makes me feel valuable'
T3: Job security + demand
Securing your future
- '[I like] the idea of securing one's future and that the skills are in high demand'
- 'Secure job, high in demand – makes it attractive'
- ‘Clear that training is relevant for future jobs'
- 'Its emphasis on expanding work opportunities is very appealing given the difficult economic conditions for so many people today'
- 'Secure your future – job security is very attractive in these uncertain times'
Flexibility of how to do the training
- ‘[I like] the flexibility of time to suit different people'
- ‘[I like] that the course is suitable to fit around [a] person's schedule'
T4: Pride + future generations
Making others proud
- 'It talks about the future of our children, which appeals to me'
- 'It makes you reflect on your legacy'
- ‘I like the reference to future generations'
- 'It reminds me that this is an important thin[g] for all of us'
However, some free text feedback suggested that people wanted more information about green skills or green jobs, and the training courses were priced too high.
That the adverts do not say what green skills or jobs are
- 'Doesn't explain what green skills are or what jobs you could get after'
- ‘I don't think everyone will know what a 'green job' is. I only know as it was just explained to me'
That the adverts were not specific enough
- ‘Not enough information about what the course includes, how long it is, where it is'
- ‘Not enough information about what kind of courses they offer for which skills'
- 'Could expand a little to give more information, what kind of job? Are course fees flexible in terms of payments etc'
- 'Pricing isn't specific and neither is how the course will be carried out, eg, online or in person'
That the cost of the training was too high
- 'The cost is too expensive'
- 'The price range is very big'
Appendix 3 – exploratory analysis interaction effects
Interaction effects between framings and incentives
When considering interaction effects between the financial incentives in experiment two, and the communications framings in experiment one, we found two significant interaction effects.
The grant incentive was significantly less effective at increasing interest in green skills training courses for those who saw the pro-environmental message, compared to any of the other messages, or the control. As shown in the table below, when implementing the grant incentive with the social impact message, the main effects increase interest by 38 percentage points, compared to the control framing and incentive. However due to a significant interaction effect (~10pp), the overall effect is just 28pp.
The subsidy incentive was significantly more effective at increasing interest in green skills training courses for those who saw the dynamic norm message. When implementing the subsidy with the dynamic norm message, the main effects increase interest by 20 percentage points, compared to the control framing and incentive. However due to a significant interaction effect (~10pp), the overall effect is 30pp.
| Interaction effects between framings and incentives on interest |
Incentives |
|
|
|
| Framings |
Control (no incentive) |
Grant |
Loan |
Subsidy |
| Control |
37% |
72% (+34pp) |
54% (+17pp) |
60% (+23pp) |
| Dynamic norm |
34% (-4pp) |
64%
Overall: +26pp
Main: +30pp
Interaction: -4pp |
46%
Overall: +9pp
Main: +13pp
Interaction: -4pp |
67%
Overall: +29pp
Main: +19pp
Interaction: +10pp* |
| Social impact |
40% (+2pp) |
65%
Overall: +27pp
Main: +36pp
Interaction: -9pp* |
55%
Overall: +17pp
Main: +19pp
Interaction: -2pp |
58%
Overall: +21pp
Main: +25pp
Interaction: -4pp |
| Job security |
36% (-2pp) |
66%
Overall: +28pp
Main: +32pp
Interaction: -4pp |
57%
Overall: +19pp
Main: +15pp
Interaction: +4pp |
58%
Overall: +21pp
Main: +21pp
Interaction: +0pp |
| Pride |
37% (-) |
67%
Overall: +29pp
Main: +34pp
Interaction: -5pp |
55%
Overall: +17pp
Main: +17pp
Interaction: 0pp |
62%
Overall: +25pp
Main: +23pp
Interaction: +2pp |
Overall effects show the percentage point differences compared to the control framing and control incentive (the top left cell), after summing main effects and interaction effects.
*indicates significant interaction effects (p<0.05).
Appendix 4 – breakdown of responses (before seeing financial information)
Breakdown by sample characteristics
| % who said they would be interested in going on a green skills training course |
|
|
| Full sample (n = 8,120) |
50% |
Statistically significant (p<0.05) differences in interest |
| Age |
|
|
| 16-24* (n = 3,891) |
49% |
Those aged 16 to 24: 4 percentage points lower than those aged 25 to 54. |
| 25-54 (n = 3,413) |
53% |
|
| 55 and over (n = 778) |
39% |
|
| Region |
|
|
| London* (n = 1,203) |
54% |
There were no significant differences in interest in green skills training offers for people living in different areas in the UK. |
| South and East (n = 2,090) |
47% |
|
| North (n = 1,943) |
51% |
|
| Midlands (n = 1,331) |
50% |
|
| Scotland/NI/Wales (n = 802) |
51% |
|
| Household income |
|
|
| Less than £40,000* (n = 4,904) |
60% |
Those with low income: 20 percentage points higher than high income. |
| £40,000 and over (n = 3,216) |
40% |
|
| Urbanicity |
|
|
| Rural* (n = 1,269) |
45% |
Those who live in rural areas: 10 percentage points lower than those living in urban areas. |
| Urban (n = 3,316) |
54% |
|
| Suburban (n = 3,535) |
48% |
|
| Education |
|
|
| No degree* (n = 3,677) |
47% |
There were no significant differences in interest in green skills training offers for people with and without a degree. |
| Degree (n = 4,413) |
53% |
|
| Characteristic |
Sub-Characteristic |
Percentage |
Description of difference |
| Employment status |
Not working* (n = 1,430) |
44% |
Those who do not work: 9 percentage points lower than those who work full-time. |
|
Working full-time (n = 4,094) |
53% |
|
|
Working part-time (n = 2,434) |
49% |
|
| Climate concern |
Not concerned* (n = 3,186) |
40% |
Those who are not concerned about climate change: 17 percentage points lower than those who are concerned about climate change. |
|
Concerned (n = 4,934) |
57% |
|
| Political view |
Conservative* (n = 1,580) |
54% |
There were no significant differences in interest in green skills training offers for people with different political views. |
|
Liberal (n = 3,013) |
53% |
|
|
Neither liberal nor conservative (n = 2,633) |
48% |
|
| Looking... |
...to change job (n = 3,685) |
63% |
Those who are looking to change jobs: 26 percentage points higher than those who are not looking to change their job. |
|
...to change career path (n = 3,596) |
65% |
Those who are looking to change career paths: 30 percentage points higher than those who are not looking to change their career path. |
|
...for new training/ educational courses (n = 3,390) |
68% |
Those who are looking for new training courses: 36 percentage points higher than those who are not looking for new training courses. |
| Current/most recent job involves... |
...STEM skills (n = 3,809) |
62% |
Those whose work involves/ involved STEM skills: 24 percentage points higher than those whose work does/did not involve STEM skills. |
|
...digital skills (n = 3,159) |
64% |
Those whose work involves/ involved digital skills: 28 percentage points higher than those whose work does/did not involve digital skills. |
|
...project management skills (n = 4,935) |
57% |
There were no significant differences in interest in green skills training offers for people whose jobs involve(d) project management skills or not. |
|
...leadership skills (n = 4,417) |
60% |
Those whose work involves/ involved leadership skills: 20 percentage points higher than those whose work does/did not involve leadership skills. |
|
...specific technical skills (n = 4,129) |
60% |
Those whose work involves/ involved specific technical skills: 20 percentage points higher than those whose work does/did not involve specific technical skills. |
|
...no specific skills (n = 4,064) |
60% |
Those whose work did not require specific skills: 20 percentage points higher than those whose work involve(d) specific skills. |
Breakdown by industry/subject expertise
| Category |
Percentage |
| Full sample (n = 8,120) |
50% |
| Industry |
|
| Agriculture, forestry and fishing (n = 158) |
68% |
| Mining and quarrying (n = 35) |
57% |
| Manufacturing (n = 390) |
59% |
| Electricity, gas, steam and air conditioning supply (n = 168) |
62% |
| Water supply, sewerage, waste management and remediation activities (n = 83) |
71% |
| Construction (n = 356) |
58% |
| Wholesale and retail trade (n = 712) |
49% |
| Transportation and storage (n = 235) |
55% |
| Accommodation and food service activities (n = 365) |
45% |
| Information and communication (n = 460) |
58% |
| Financial and insurance activities (n = 615) |
54% |
| Real estate activities (n = 151) |
53% |
| Professional, scientific and technical activities (n = 477) |
50% |
| Administrative and support service activities (n = 404) |
52% |
| Public administration and defence; compulsory social security (n = 285) |
42% |
| Education (n = 876) |
50% |
| Human health and social work activities (n = 875) |
50% |
| Arts, entertainment and recreation (n = 474) |
42% |
| Other (n = 1,000) |
37% |
| Subject (recent graduates) |
|
| Health or social care (n = 353) |
46% |
| Public services (n = 77) |
53% |
| Science (n = 343) |
46% |
| Mathematics and statistics (n = 135) |
53% |
| Agriculture (n = 61) |
86% |
| Horticulture and forestry (n = 25) |
68% |
| Animal care and veterinary science (n = 61) |
61% |
| Environmental conservation (n = 76) |
72% |
| Engineering (n = 211) |
57% |
| Manufacturing (n = 50) |
74% |
| Architecture (n = 68) |
59% |
| Building and construction (n = 72) |
58% |
| Information and communication technology (ICT) (n = 295) |
56% |
| Retail and commercial enterprise (n = 106) |
53% |
| Leisure, travel and tourism (n = 69) |
62% |
| Arts, media and publishing (n = 342) |
41% |
| History, philosophy and theology (n = 131) |
50% |
| Social sciences (n = 289) |
44% |
| Languages, literature and culture (n = 102) |
43% |
| Education and training (n = 211) |
53% |
| Business, administration, finance and law (n = 582) |
50% |
| Other (n = 226) |
40% |
| Subject (A-/T-level graduates) |
|
| Biology (n = 186) |
55% |
| Chemistry (n = 146) |
44% |
| Physics (n = 128) |
52% |
| English literature (n = 111) |
56% |
| Geography (n = 85) |
56% |
| History (n = 91) |
48% |
| Maths/further maths (n = 221) |
47% |
| Modern languages (n = 35) |
46% |
| Classical languages (n = 25) |
72% |
| Art and design (n = 122) |
48% |
| Design and technology (n = 62) |
47% |
| Sociology (n = 112) |
50% |
| Psychology (n = 164) |
47% |
| Business studies (n = 133) |
53% |
| Information technology (n = 50) |
56% |
| Computer science (n = 99) |
48% |
Appendix 5 - breakdown of responses (after seeing financial information)
| Characteristic |
Sub-Characteristic |
Percentage |
Statistically significant (p<0.05) differences in interest |
| Full sample (n = 8,120) |
|
50% |
|
| Age |
16-24* (n = 3,891) |
52% |
Those aged 16 to 24: 5 percentage points lower than those aged 25 to 54. |
|
25-54 (n = 3,413) |
57% |
|
|
55 and over (n = 778) |
43% |
|
| Region |
London* (n = 1,203) |
58% |
There were no significant differences in interest in green skills training offers for people living in different areas in the UK. |
|
South and East (n = 2,090) |
52% |
|
|
North (n = 1,943) |
54% |
|
|
Midlands (n = 1,331) |
52% |
|
|
Scotland/NI/Wales (n = 802) |
51% |
|
| Household income |
Less than £40,000* (n = 4,904) |
53% |
There were no significant differences in interest in green skills training offers for people with less/more than £40,000. |
|
£40,000 and over (n = 3,216) |
53% |
|
| Urbanicity |
Rural* (n = 1,269) |
47% |
Those who live in rural areas: 9 percentage points lower than those living in urban areas. |
|
Urban (n = 3,316) |
58% |
|
|
Suburban (n = 3,535) |
51% |
|
| Education |
No degree* (n = 3,677) |
49% |
There were no significant differences in interest in green skills training offers for people with and without a degree. |
|
Degree (n = 4,413) |
56% |
|
| Employment status |
Not working* (n = 1,430) |
47% |
Those who do not work: 9 percentage points lower than those who work full-time. |
|
Working full-time (n = 2,434) |
56% |
|
|
Working part-time (n = 2,434) |
51% |
|
| Concerned |
Not concerned* (n = 3,186) |
43% |
Those who are not concerned about climate change: 17 percentage points lower than those who are concerned about climate change. |
|
Concerned (n = 4,934) |
60% |
|
| Political view |
Conservative* (n = 1,580) |
58% |
There were no significant differences in interest in green skills training offers for people with different political views. |
|
Liberal (n = 3,013) |
56% |
|
|
Neither liberal nor conservative (n = 2,633) |
50% |
|
| Looking... |
...to change job (n = 3,685) |
63% |
Those who are looking to change jobs: 26 percentage points higher than those who are not looking to change their job. |
|
...to change career path (n = 3,596) |
66% |
Those who are looking to change career paths: 32 percentage points higher than those who are not looking to change their career path. |
|
...for new training/ educational courses (n = 3,390) |
70% |
Those who are looking for new training courses: 40 percentage points higher than those who are not looking for new training courses. |
| Current/most recent job involves... |
...STEM skills (n = 3,809) |
63% |
Those whose work involves/ involved STEM skills: 26 percentage points higher than those whose work does/did not involve STEM skills. |
|
...digital skills (n = 3,159) |
66% |
Those whose work involves/ involved digital skills: 32 percentage points higher than those whose work does/did not involve digital skills. |
|
...project management skills (n = 4,935) |
60% |
There were no significant differences in interest in green skills training offers for people whose jobs involve(d) project management skills or not. |
|
...leadership skills (n = 4,417) |
63% |
Those whose work involves/ involved leadership skills: 26 percentage points higher than those whose work does/did not involve leadership skills. |
|
...specific technical skills (n = 4,129) |
62% |
Those whose work involves/ involved specific technical skills: 24 percentage points higher than those whose work does/did not involve specific technical skills. |
|
...no specific skills (n = 4,064) |
61% |
Those whose work did not require specific skills: 22 percentage points higher than those whose work involve(d) specific skills. |
| Category |
Percentage |
| Full sample (n = 8,120) |
53% |
| Industry |
|
| Agriculture, forestry and fishing (n = 158) |
70% |
| Mining and quarrying (n = 35) |
51% |
| Manufacturing (n = 390) |
66% |
| Electricity, gas, steam and air conditioning supply (n = 168) |
61% |
| Water supply, sewerage, waste management and remediation activities (n = 83) |
69% |
| Construction (n = 356) |
59% |
| Wholesale and retail trade (n = 712) |
53% |
| Transportation and storage (n = 235) |
56% |
| Accommodation and food service activities (n = 365) |
50% |
| Information and communication (n = 460) |
62% |
| Financial and insurance activities (n = 615) |
57% |
| Real estate activities (n = 151) |
54% |
| Professional, scientific and technical activities (n = 477) |
54% |
| Administrative and support service activities (n = 404) |
53% |
| Public administration and defence; compulsory social security (n = 285) |
51% |
| Education (n = 876) |
53% |
| Human health and social work activities (n = 875) |
51% |
| Arts, entertainment and recreation (n = 474) |
42% |
| Other (n = 1,000) |
42% |
| Subject (recent graduates) |
|
| Health or social care (n = 353) |
46% |
| Public services (n = 77) |
57% |
| Science (n = 343) |
54% |
| Mathematics and statistics (n = 135) |
59% |
| Agriculture (n = 61) |
79% |
| Horticulture and forestry (n = 25) |
68% |
| Animal care and veterinary science (n = 61) |
57% |
| Environmental conservation (n = 76) |
72% |
| Engineering (n = 211) |
62% |
| Manufacturing (n = 50) |
74% |
| Architecture (n = 68) |
63% |
| Building and construction (n = 72) |
51% |
| Information and communication technology (ICT) (n = 295) |
57% |
| Retail and commercial enterprise (n = 106) |
51% |
| Leisure, travel and tourism (n = 69) |
55% |
| Arts, media and publishing (n = 342) |
44% |
| History, philosophy and theology (n = 131) |
42% |
| Social sciences (n = 289) |
51% |
| Languages, literature and culture (n = 102) |
49% |
| Education and training (n = 211) |
56% |
| Business, administration, finance and law (n = 582) |
56% |
| Other (n = 226) |
46% |
| Subject (A-/T-level graduates) |
|
| Biology (n = 186) |
61% |
| Chemistry (n = 146) |
58% |
| Physics (n = 128) |
54% |
| English literature (n = 111) |
54% |
| Geography (n = 85) |
56% |
| History (n = 91) |
54% |
| Maths/further maths (n = 221) |
49% |
| Modern languages (n = 35) |
49% |
| Classical languages (n = 25) |
64% |
| Art and design (n = 122) |
58% |
| Design and technology (n = 62) |
42% |
| Sociology (n = 112) |
53% |
| Psychology (n = 164) |
50% |
| Business studies (n = 133) |
53% |
| Information technology (n = 50) |
60% |
| Computer science (n = 99) |
49% |
58 Victoria Embankment
London EC4Y 0DS
+44 (0)20 7438 2500
[email protected]
@nesta_uk
nesta.uk
www.nesta.org.uk
ISBN: 978-1-916699-00-7
Nesta is a registered charity in England and Wales with company number 7706036 and charity number 1144091. Registered as a charity in Scotland number SC042833. Registered office: 58 Victoria Embankment, London EC4Y 0DS.
CC BY NC SA
Footnotes: