About Nesta
We are Nesta, the UK's innovation agency for social good. We design, test and scale solutions to society's biggest problems. Our three missions are to give every child a fair start, help people live healthy lives and create a sustainable future where the economy works for both people and the planet.
For over 20 years, we have worked to support, encourage and inspire innovation. We work in three roles: as an innovation partner working with frontline organisations to design and test new solutions, as a venture builder supporting new and early stage businesses and as a system shaper creating the conditions for innovation. Harnessing the rigour of science and the creativity of design, we work relentlessly to change millions of lives for the better.
Find out more at nesta.org.uk
If you'd like this publication in an alternative format such as Braille or large print please contact us at [email protected]
Executive Summary
1. Background and motivation
This report summarises the results of a pilot field trial with 7,002 customers conducted in Spring 2022. We sought to understand the impact of emailing customers of an energy advice app simple instructions about how to change their boiler settings to optimise the efficiency of their boiler.
In 2020, the residential sector was responsible for 16% of total UK emissions - the majority of which came from gas for heating, according to the Office for National Statistics. One strategy for reducing household carbon emissions is to increase the efficiency of carbon-emitting heating (thereby reducing households' energy demand). A promising way to do this is by reducing the flow temperature setting on gas condensing boilers. Recent research commissioned by Nesta finds that reducing a combi boiler's flow temperature from 80°C to 60°C can save approximately 9% of a household gas use.
However, awareness of this efficiency gain is limited. Office for National Statistics research found that 10% of survey respondents had lowered boiler flow temperatures in the past 12 months. Moreover, we saw potential to develop user-focussed information to help a range of individuals to benefit from this advice. Our previous research had found that a barrier to reducing boiler flow temperatures was a lack of information on how to correctly do this.
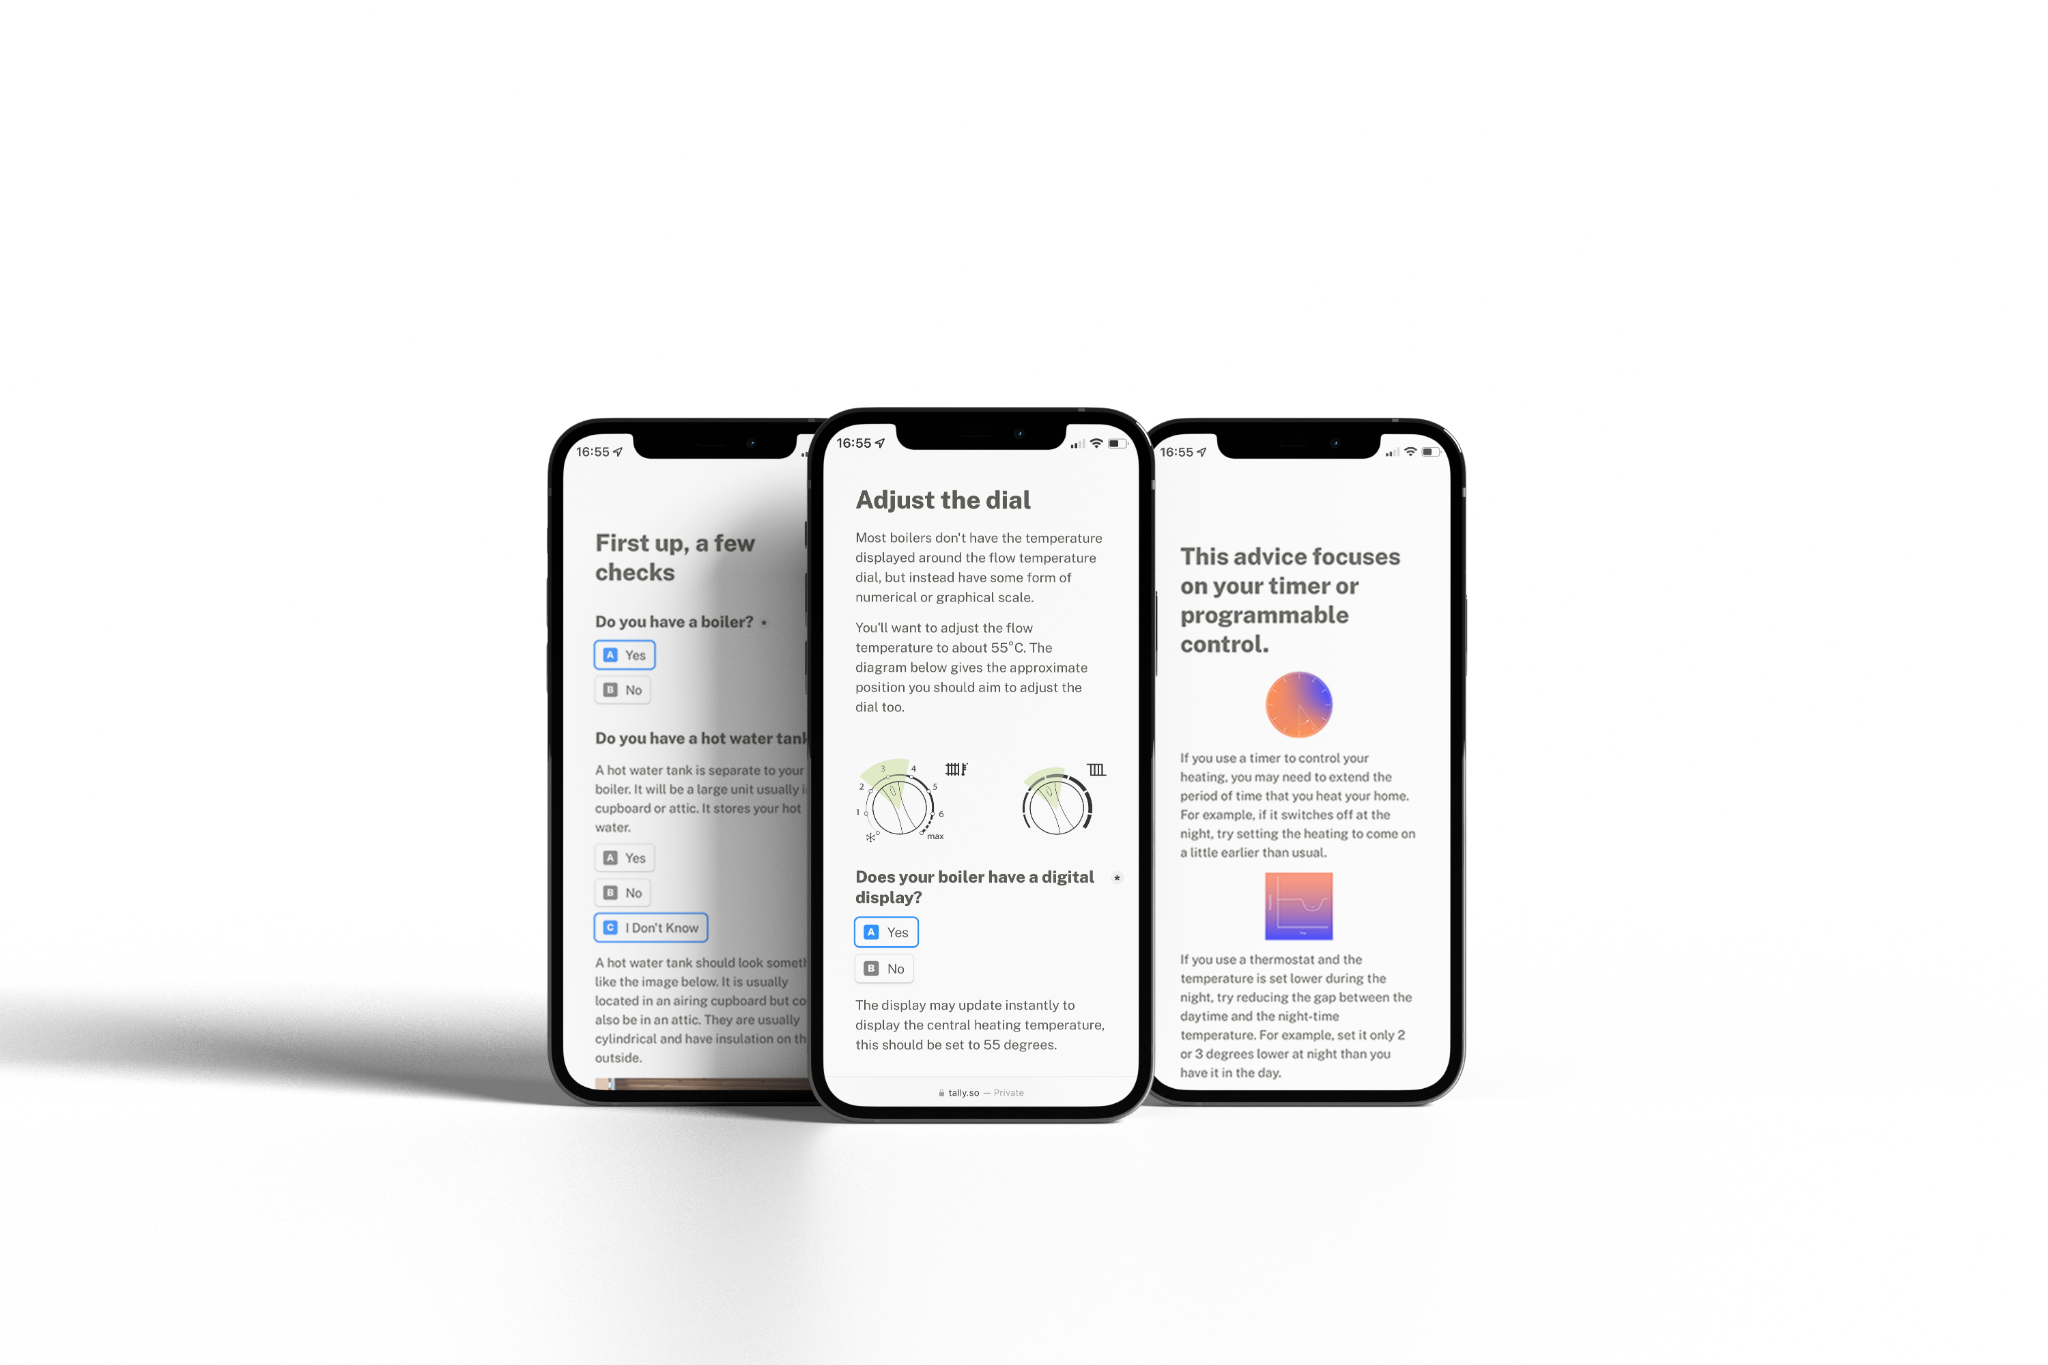
To solve this problem, Nesta developed an online tool that provided boiler optimisation advice. The tool included a step-by-step guide with relevant sections tailored to a user's boiler control configuration. The tool aimed to help overcome barriers and to increase the chance of individuals successfully turning their boiler flow temperature down. We were also able to account for different central heating systems to provide specific advice, such as excluding those with hot water tanks.
Figure 1. Illustration of our online tool
To assess whether our online tool was successful in helping individuals turn down their boiler flow temperature, we collaborated with Loop. Loop is a company that provides a smarter meter app, which links to smart meters to help customers understand their electricity and gas consumption. Loop also provides advice to reduce energy consumption to consumers. Collaborating with Loop meant that we were able to access their customers, which was a critical component to being able to evaluate the effectiveness of our online tool.
Our pilot began in April 2022, at a time when warmer weather meant that gas consumption was likely to be lower than households' winter consumption patterns. This had two implications: first, that some households may already have turned their heating off for summer; and second, that energy savings may be harder to detect given lower overall gas consumption during this period. Instead of a full-scale trial, we conducted a pilot trial with Loop to test our online tool and to gather initial evidence on the effectiveness of turning boiler flow temperatures down.
2. How the pilot worked
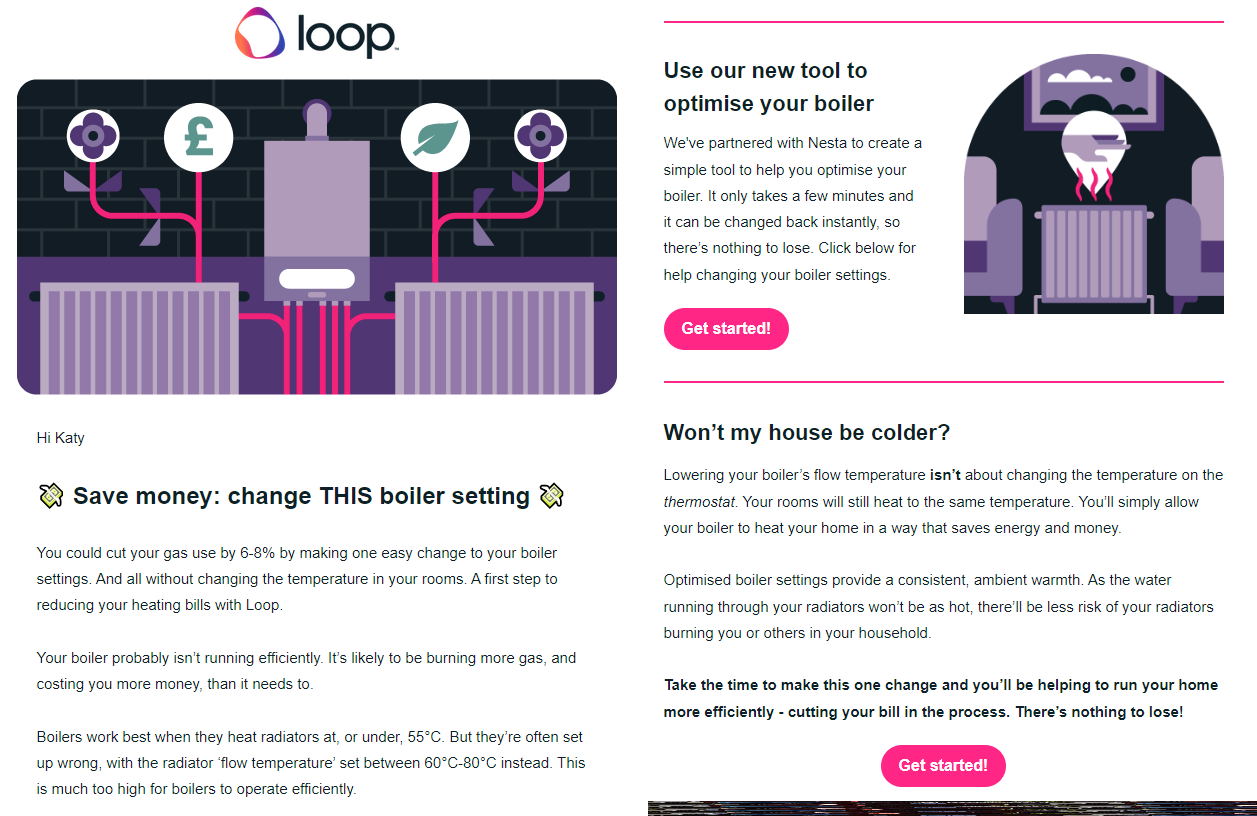
We launched the pilot with Loop on 9th April 2022. There were two arms: a treatment group who received our intervention – an email from Loop with a link to our online tool (3,502 customers) – and a control group, who did not (3,500 customers).
Figure 2. Email sent by Loop with a link to our online tool
3. Results
We found that our intervention resulted in more people turning their boiler flow temperatures down. When asked whether they had turned their boiler flow temperature down in the last two weeks, 181 survey respondents in the treatment group said they had, versus 97 in the control group. The email increased the proportion of participants who self-reported turning their boiler down (34% in the treatment group versus 19% in the control group – this difference was statistically significant).
Figure 3. Responses to turning boiler flow temperatures down (among 1,032 Loop customers who responded to a survey sent two weeks after the initial email)
The majority of participants in the treatment group who turned their boiler flow temperature down reported that they had heard the advice from Loop. We asked participants where they had found out about the information to turn their boiler flow temperature down. 57% (103) of participants who turned their boiler flow temperature down in the treatment group said they had heard the advice from Loop, compared to 22% (21) in the control group. We note that Loop had not provided any advice to turn boiler flow temperatures down, so it was surprising to see that 21 participants in the control group had said this. Overall, our interpretation of these survey responses is that our intervention had worked at helping participants to turn their boiler flow temperature down.
Participants who used our online tool were asked a series of survey questions immediately after they had used the tool. 80% of those who viewed the instructions stage of the tool reported changing their boiler settings, with a mean rating for ease of use of 4.8 out of 5 (237 total users rated the tool). When presented with the choice of leaving the app or viewing further guidance on heating, 86% of these 237 users opted to view personalised heating guidance. We also asked users “would you feel confident in adjusting your flow temperature in the future, if you decide you need to tweak it?" Users reported a high level of confidence with an average rating of 4.7 out of 5 – overall, indicating that our online tool was perceived as easy to use by these 237 users.
We did not find evidence that our intervention resulted in a difference between participants' satisfaction with their temperature in the treatment group and control group. Turning down boiler flow temperatures could result in a decrease in thermal comfort, as it typically means that it takes longer to heat up rooms (due to a lower transfer of heat from radiators for a given amount of time). To assess this, we asked participants to report on their satisfaction with their thermal comfort over the past two weeks. Given this is a small pilot, and it occurred during relatively warm spring weather, we urge caution in interpreting these results; but our takeaway from our survey responses was that comfort was not lower in the group whom we encouraged to turn boilers down.
Figure 4. Satisfaction with the temperature of participants' homes (among the 1,032 Loop customers who responded to a survey sent two weeks after the initial email)
Meanwhile, we found weak evidence of a reduction in daily gas consumption in the treatment group compared to the control group. The main focus of our trial was on seeing whether the email resulted in more people turning their boiler flow temperature down. The small sample size and short period of analysis meant we were concerned we would not be able to detect differences in gas consumption between the treatment and control group with sufficiently good precision. However, we did examine consumption differences between the treatment group (regardless of whether they followed the advice in the email, opened the email, or even received it) and the control group. We found that the treatment group had a daily gas consumption that was 0.36 kWh lower than the control group, but this wasn't statistically significant (p = .059). This reflects our original view that we wouldn't be able to detect a meaningful difference in a two-week trial in April – and that this would be better achieved in a full-scale trial over the winter.
That said, the analysis does suggest that the email intervention has promise in terms of reducing gas consumption. A 0.36 kWh reduction is approximately a reduction of 1.4%, an economically meaningful impact.
Figure 5. Analysis of effect of our email on daily gas consumption (among all 7,002 households involved in the trial)
Full report
Industry stakeholders have identified that reducing boiler flow temperatures can reduce household carbon emissions
In 2020, the residential sector was responsible for 16% of total UK emissions – the majority of which came from gas for heating, according to the Office for National Statistics. One strategy for reducing household carbon emissions is to increase the efficiency of carbon-emitting heating (thereby reducing households' energy demand). A promising way to do this is by reducing the flow temperature setting on gas condensing boilers. The Heating and Hotwater Industry Council (HHIC) has estimated that reducing flow temperatures from 70°C to 50°C reduces household gas consumption by 6-8%.
Efficiency is improved due to condensing boilers using waste heat (from burning gas) to pre-heat water entering the boiler. Typically, the lower the temperature of water entering the boiler, the more heat that can be recovered from the waste gas. This reduces the amount of gas that needs to be used to heat the water to a given temperature. Recovering heat from waste gas results in a 10-12% increase in boiler efficiency based on modelling by Harish Satyavada and Simone Baldi from 2016.
The return temperature of water entering the boiler is adjusted by changing the temperature of hot water flowing out of the boiler (which loses heat through radiators). This adjustment is possible on most condensing boilers – with no financial cost. There may also be fewer negative impacts, such as reducing thermal comfort, when compared to other energy-saving actions (such as reducing room thermostats). It could therefore be a cheap and effective way to save energy.
Organisations such as the European Commission and the Climate Change Committee have recently promoted information about reducing flow temperatures. However, awareness of this efficiency gain may be limited. Recent Office for National Statistics research suggested that 10% of participants in a survey they administered had lowered boiler flow temperatures in the past 12 months. Moreover, we saw potential to develop user-focussed information to help a range of individuals to benefit from this advice. Our previous research had found that a barrier to reducing boiler flow temperatures was a lack of information on how to correctly do this. This resulted in individuals not feeling confident in their ability to change settings on their boiler. We identified that a lack of confidence could be alleviated with accessible step-by-step information on how to make the change.
Critically, any information on flow temperatures needed to account for the heterogeneity in household heating, such as non-condensing boilers, where reducing flow temperature may only provide limited efficiency gains. It also needed to account for the presence of hot water tanks, where providing advice to reduce boiler temperatures could increase the potential for Legionnaires' disease.
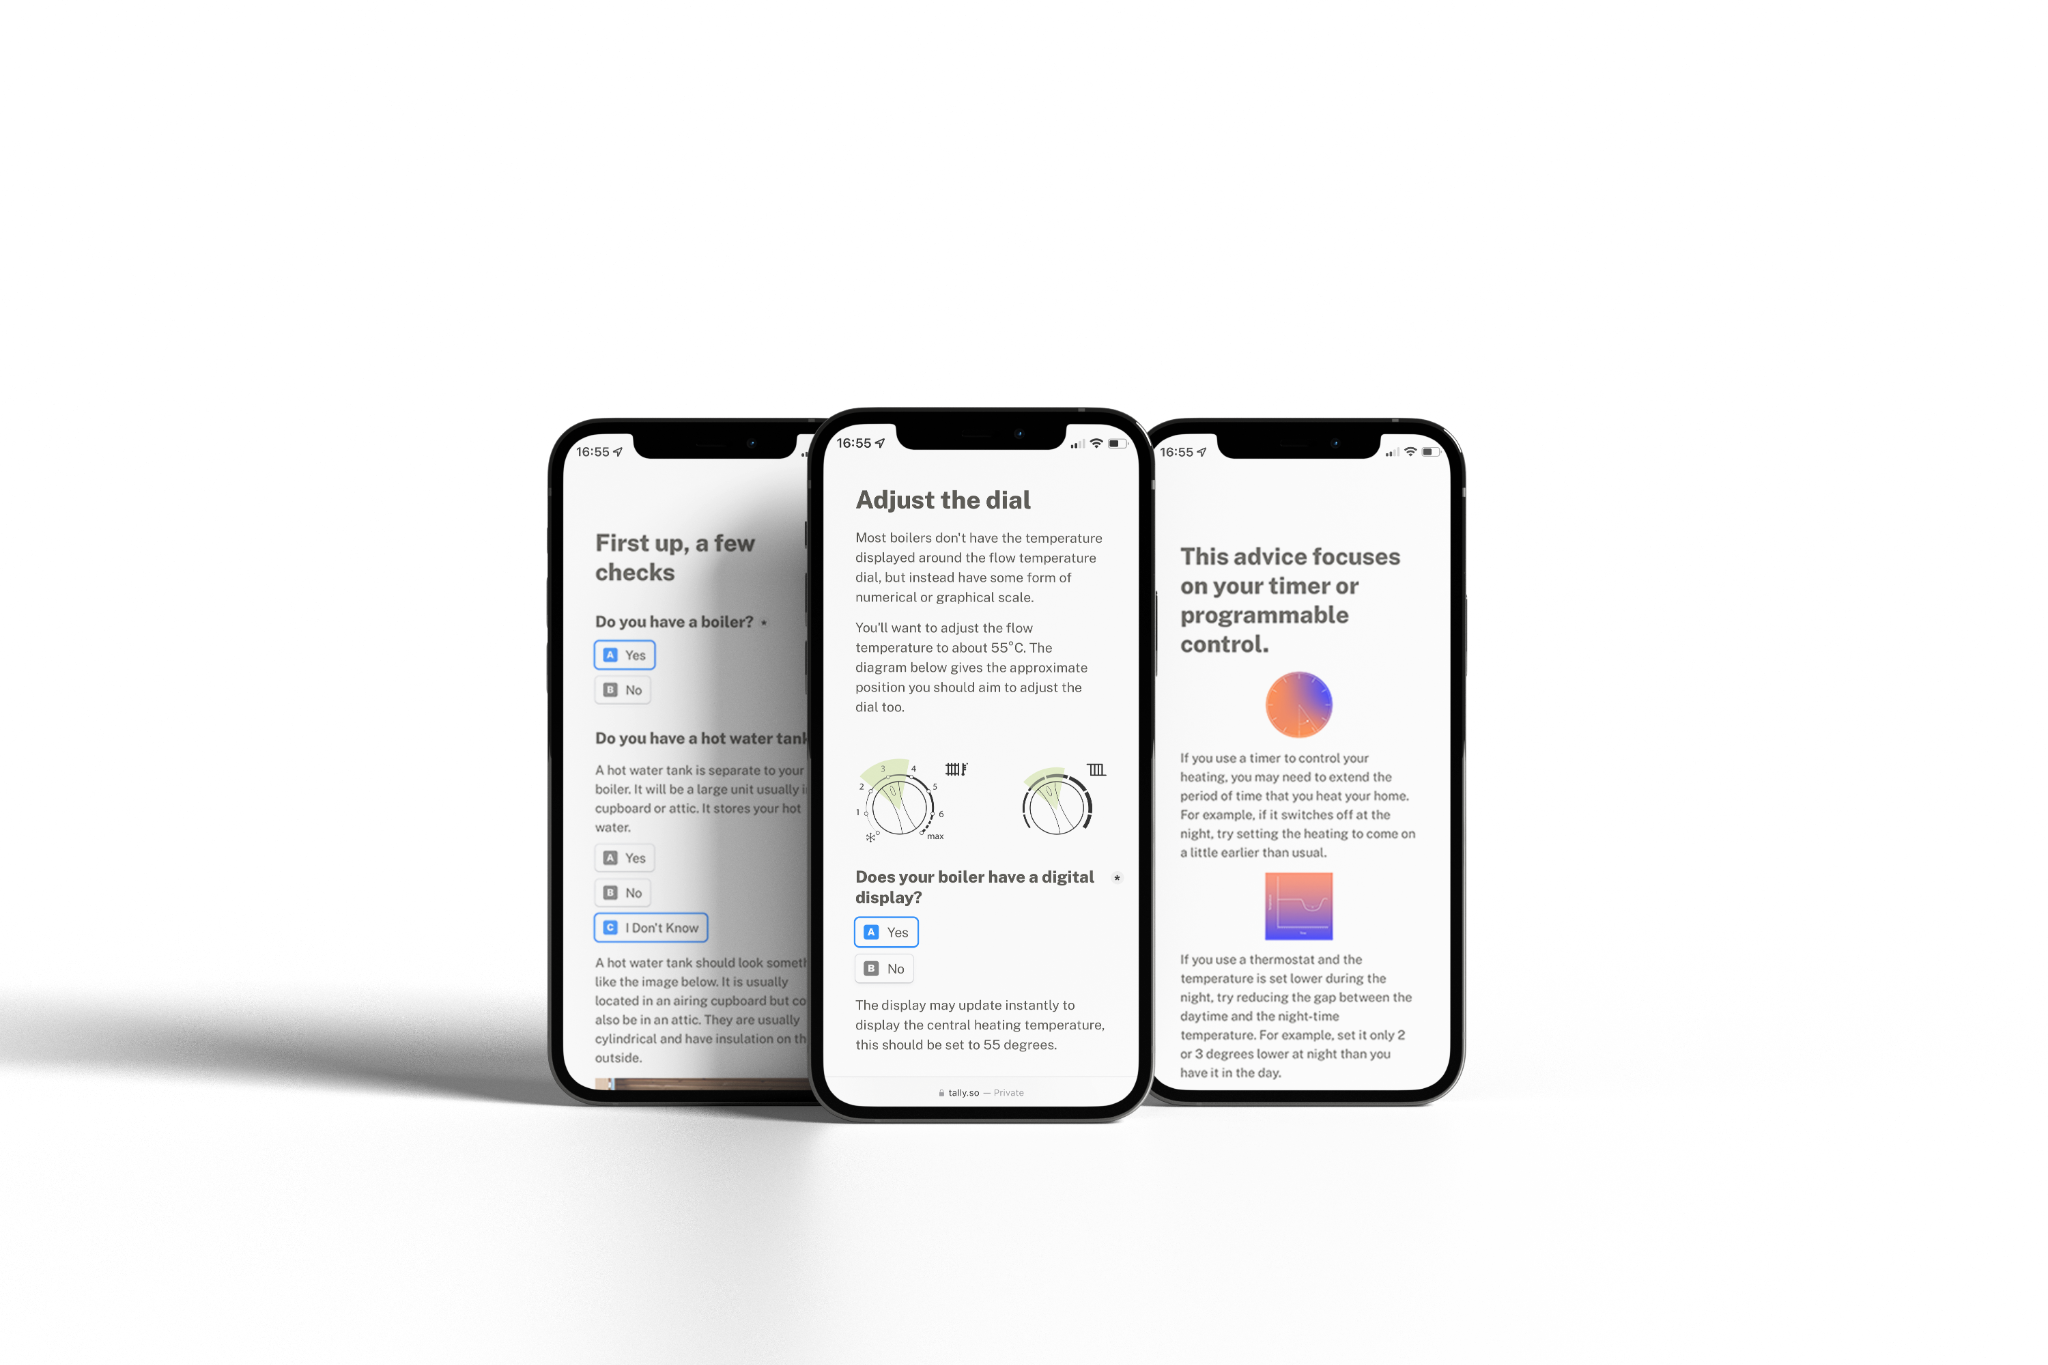
To account for the above, we developed an online tool that provided boiler optimisation advice. The tool included a step-by-step guide with relevant sections tailored to a user's boiler control configuration. The tool aimed to help overcome barriers and to increase the chance of individuals successfully turning their boiler flow temperature down. We were also able to account for different central heating systems to provide specific advice, such as excluding those with hot water tanks.
Figure 6. Illustration of our online tool
To test the effectiveness of our online tool, we decided that a field trial would be the most useful evaluation approach. One of the benefits of field trials is that they can be used to measure behaviour in the context in which it occurs - in this case, in people's homes. A field trial thus helps us understand how effective our online tool would be if we were to share it more widely. Using a field trial also helps us understand whether our online tool has other undesirable or detrimental effects, such as reducing people's thermal comfort.
Using a field trial could also help us gather evidence on whether turning down boiler flow temperatures could reduce energy consumption. As discussed above, reducing boiler flow temperatures has been found to increase efficiency in modelling research. However, the potential efficiency gains have yet to be tested with a field study. It's important to trial this in the field as each boiler, heating system, home and householder are different. For example, homes with relatively lower levels of insulation will tend to need higher flow temperatures than homes with more insulation. Research published by BEIS in 2021 confirms this need for robust evidence on the potential energy savings of lowering flow temperatures. Its research suggests that 91% of homes would be able to meet household heat demand on a typical winter day if the flow temperature was set at 70°C. Only 72% of households would be able to meet heat demands at 60°C and only 25% of households would be able to do so at 50°C – the flow temperature at which HHIC identified the 6-8% saving.
To assess whether our online tool was successful in helping individuals turn down their boiler flow temperature, we collaborated with Loop. Loop is a company that provides a smarter meter app, which links to smart meters to help customers understand their electricity and gas consumption. Loop also provides advice to reduce energy consumption to consumers. Collaborating with Loop meant that we were able to access their customers, which is a critical component to being able to evaluate the effectiveness of our online tool.
Our collaboration began in April 2022, at a time when warmer weather meant that gas consumption was likely to be lower than households' winter consumption patterns. This had two implications: first, that some households may already have turned their heating off for summer; and second, that energy savings may be harder to detect given lower overall gas consumption during this period. Instead of a full-scale trial, we set out to conduct a pilot trial with Loop to test our online tool and to gather initial evidence on the effectiveness of turning boiler flow temperatures down.
We conducted a pilot randomised controlled trial (RCT) with 7,002 of Loop's customers
We launched a pilot randomised controlled trial (RCT) with Loop on 9th April. The RCT comprised two arms: a treatment group who received our intervention an email from Loop with a link to our online tool (sent to 3,502 customers) – and a control group, who didn't receive our intervention (a group of 3,500 customers). We aimed to answer the following research questions from the field trial:
- → Research question 1: Does receiving our intervention result in more individuals in the treatment group turning their boiler flow temperature down than those in the control group?
- → Research question 2: Does receiving our intervention result in a lower level of satisfaction with thermal comfort?
- → Research question 3: Does receiving our intervention result in lower gas consumption?
We ran the trial over a two-week period and measured participants' energy use over this period, using data provided by Loop. We were keen to adhere to current best practice for running field trials, and accordingly, we pre-registered our trial on OSF.
Keeping track of which customers followed the advice in our intervention was challenging, as we had to rely on asking individuals to report whether they had or not. To do this, we sent a survey to all participants at the end of the two-week period, in which we asked whether they had changed their boiler flow temperatures. We also asked distractor questions, such as how many occupants lived with them in their homes. Distractor questions were used to make the survey seem more like a standalone survey (reducing the likelihood that the participants realised they were in an experiment, which might change their responses).
To recruit participants to complete the survey, Loop sent a follow-up email at the end of the two-week period, which provided a link to the survey and stated that anyone who completed the survey would be included in a prize draw to win £100. Of the 7,002 customers in the trial, 15% (1,032) of participants in our field trial completed the survey (498 in the control group and 524 in the treatment group).
Figure 7. Email sent by Loop with a link to our online tool
The image shows a screenshot of an email from Loop with the heading "Save money: change THIS boiler setting". It outlines how making one easy change to boiler settings could cut gas use by 6-8% without changing room temperature. It also presents a "Won't my house be colder?" section reassuring users that rooms will still heat to the same temperature and optimized settings provide consistent warmth with less risk of hot radiators. Call-to-action buttons say "Get started!".
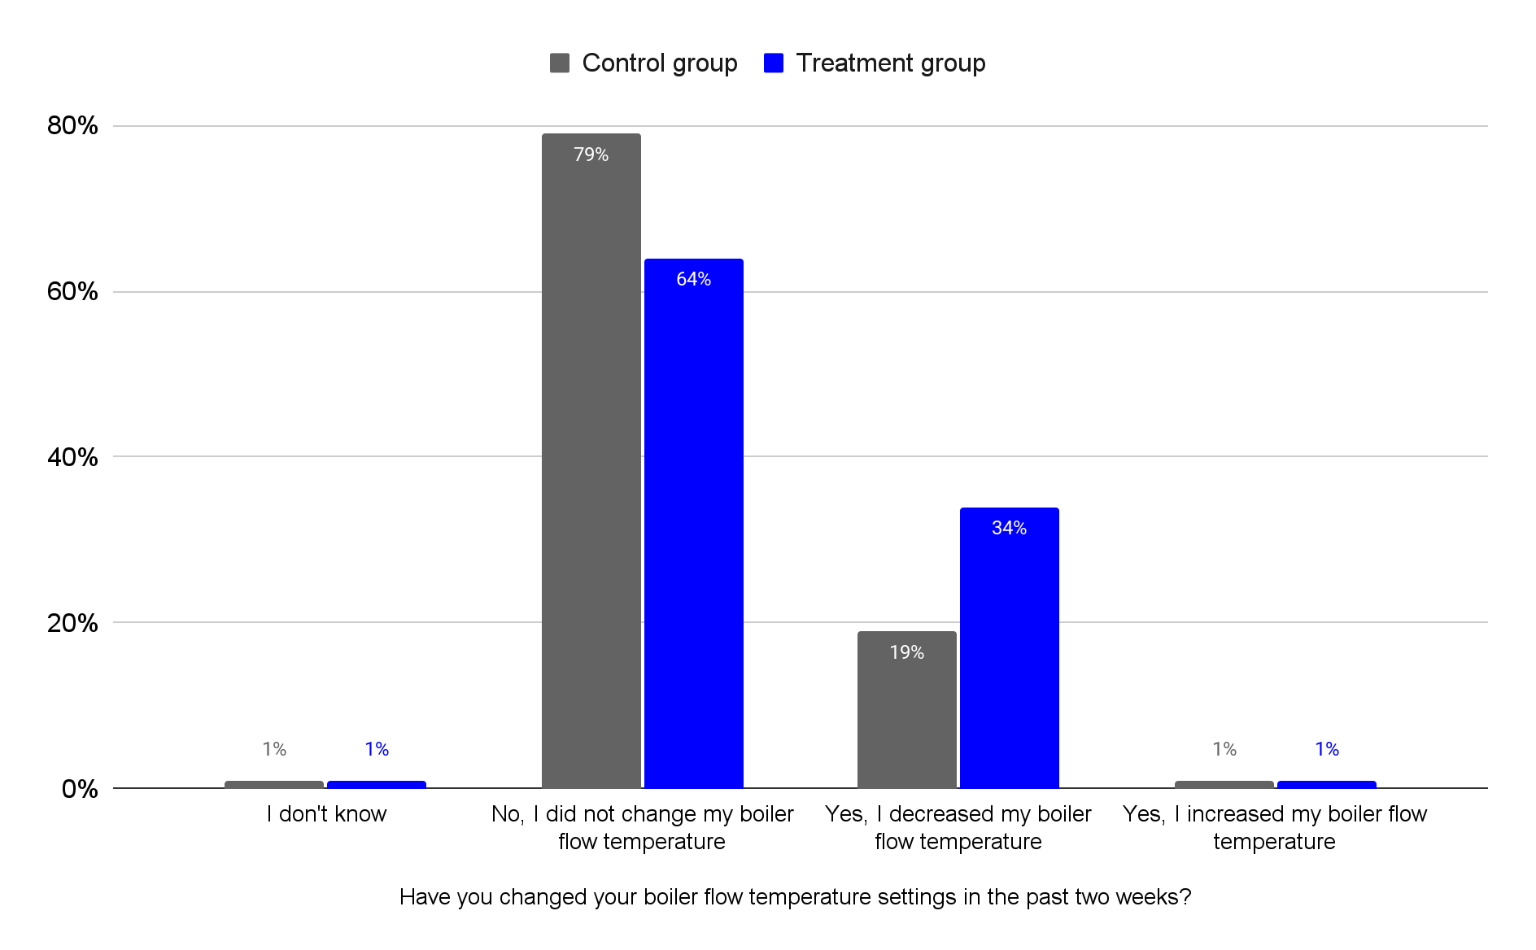
We found that our intervention resulted in more people turning their boiler flow temperatures down. When asked whether they had turned their boiler flow temperature down in the last two weeks, 181 survey respondents in the treatment group said they had, versus 97 in the control group.
Figure 8. Responses to turning boiler flow temperatures down (among 1,032 survey respondents)
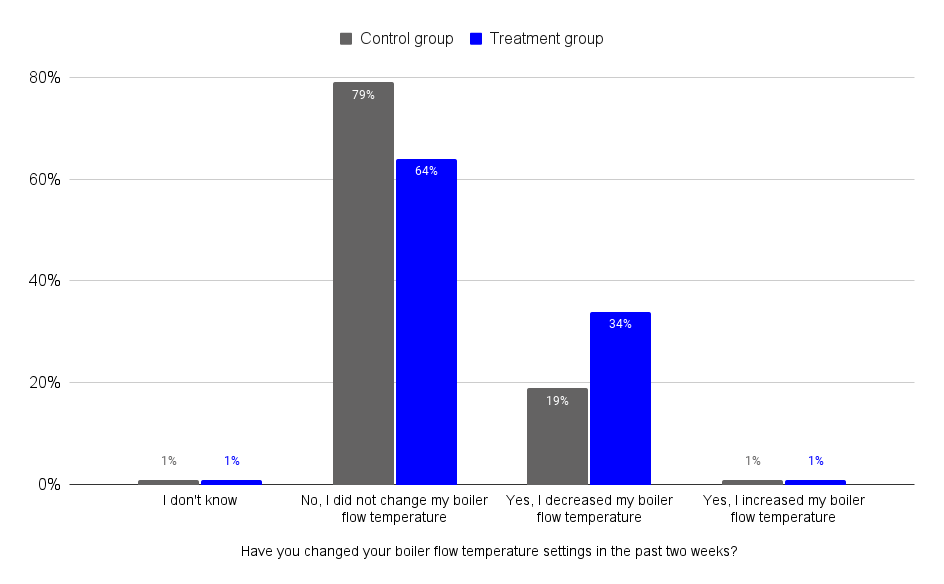
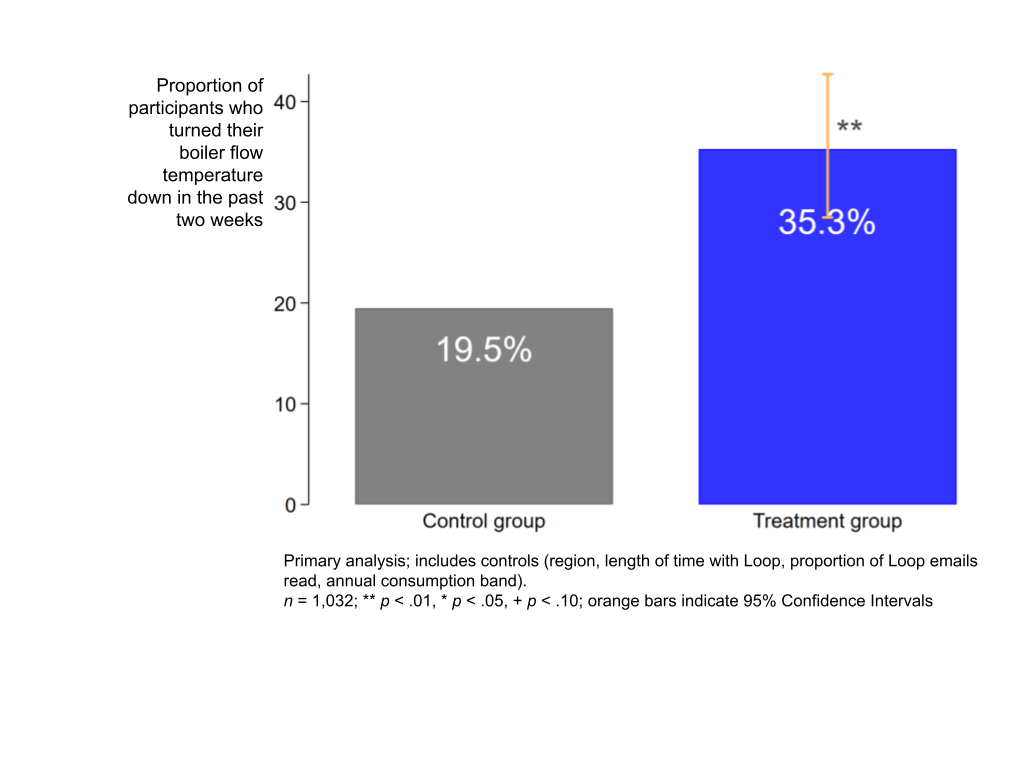
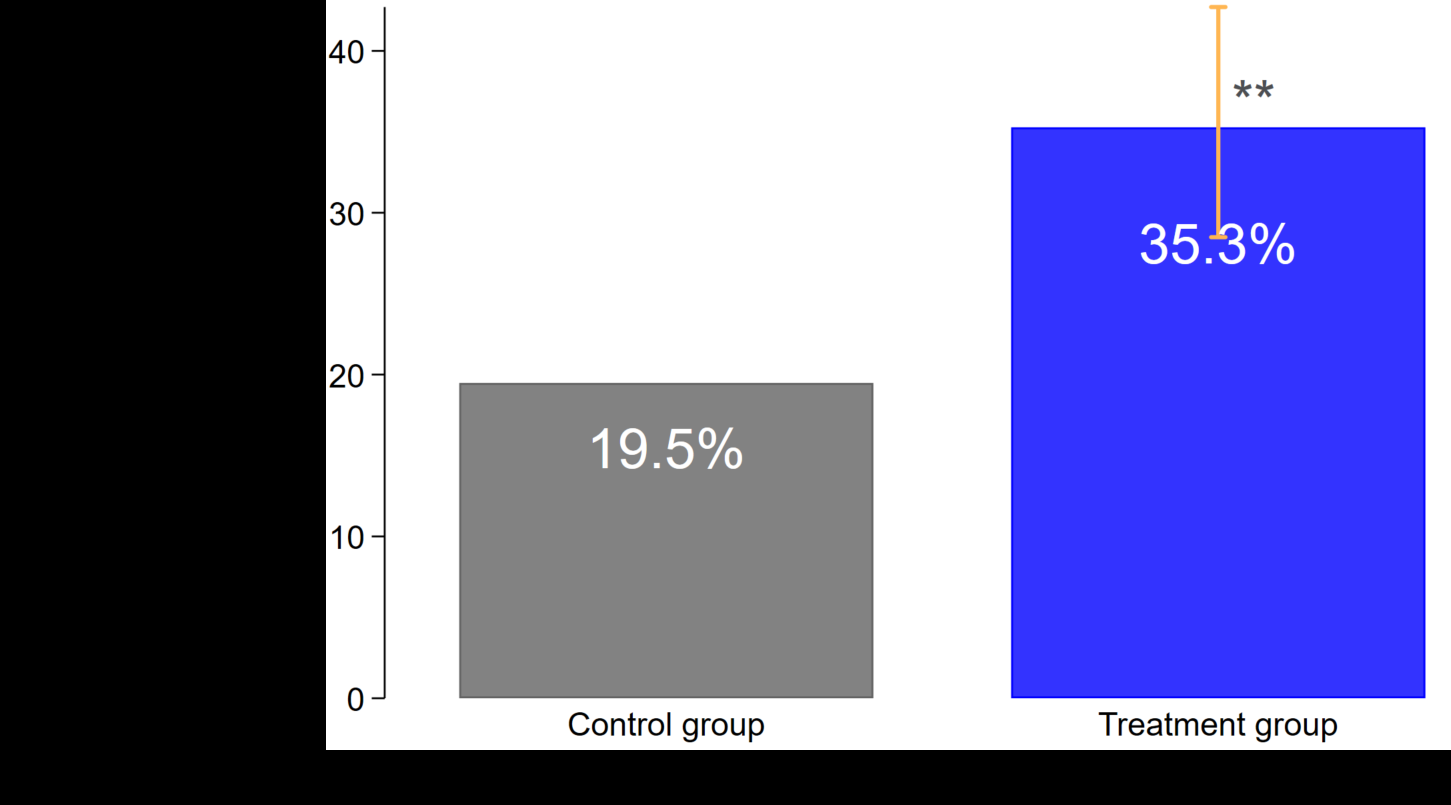
Our primary analysis showed that the email significantly increased the proportion of participants who self-reported turning their boiler down (34% in the treatment group versus 19% in the control group; p < .01) – see Figure 9 below.
Participants who used our online tool were asked a series of survey questions immediately after they had used the tool. 80% of those who viewed the instructions stage of the tool reported changing their boiler settings, with a mean rating for ease of use of 4.8 out of 5 (237 total users rated the tool). When presented with the choice of leaving the app or viewing further guidance on heating, 86% of these 237 users opted to view personalised heating guidance. We also asked users “would you feel confident in adjusting your flow temperature in the future, if you decide you need to tweak it?" Users reported a high level of confidence with an average rating of 4.7 out of 5 – overall, indicating that our online tool was perceived as easy to use by these 237 users.
Figure 9. Results from our primary analysis (among 1,032 survey respondents)
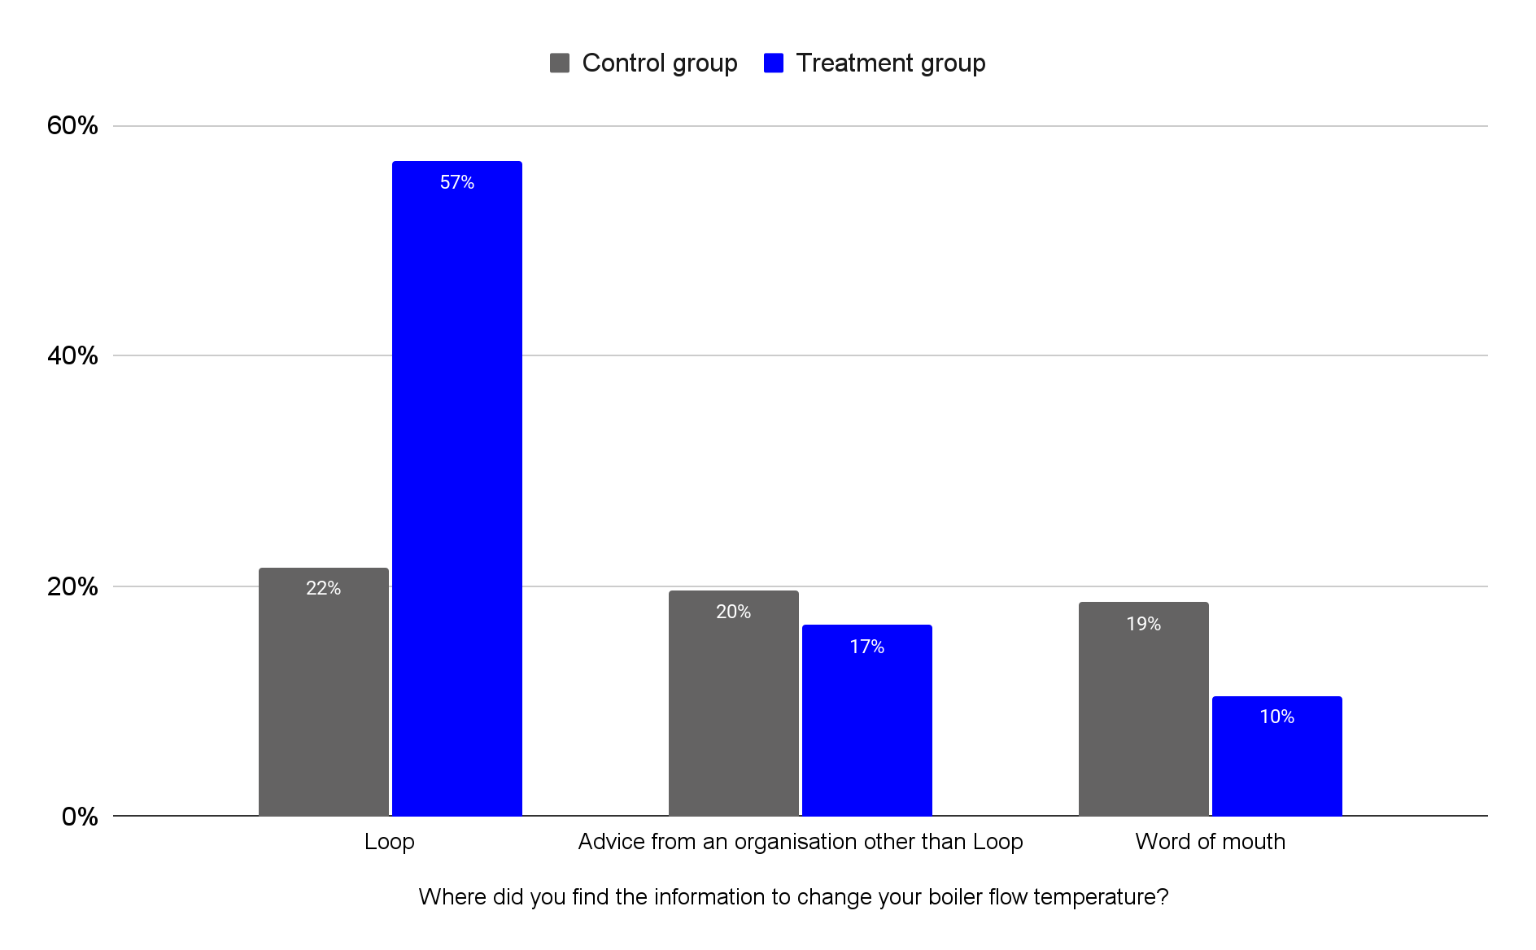
The majority of participants in the treatment group who turned their boiler flow temperature down reported that they had heard the advice from Loop. We asked participants where they had found out about the information to turn their boiler flow temperature down. 57% (103 of 181) of participants who turned their boiler flow temperature down in the treatment group said they had heard the advice from Loop, compared to 22% (21 of 97) in the control group. We note that Loop had not provided any advice to turn boiler flow temperatures down, so it was surprising to see that 21 participants in the control group had said this. Overall, our interpretation of these survey responses is that our intervention had worked at helping participants to turn their boiler flow temperature down.
Figure 10. Responses to where participants found the information to change their boiler flow temperature (among the 278 that self-reported they had reduced it)
We did not find evidence that our intervention resulted in a difference between participants' satisfaction with their temperature in the treatment group and control group
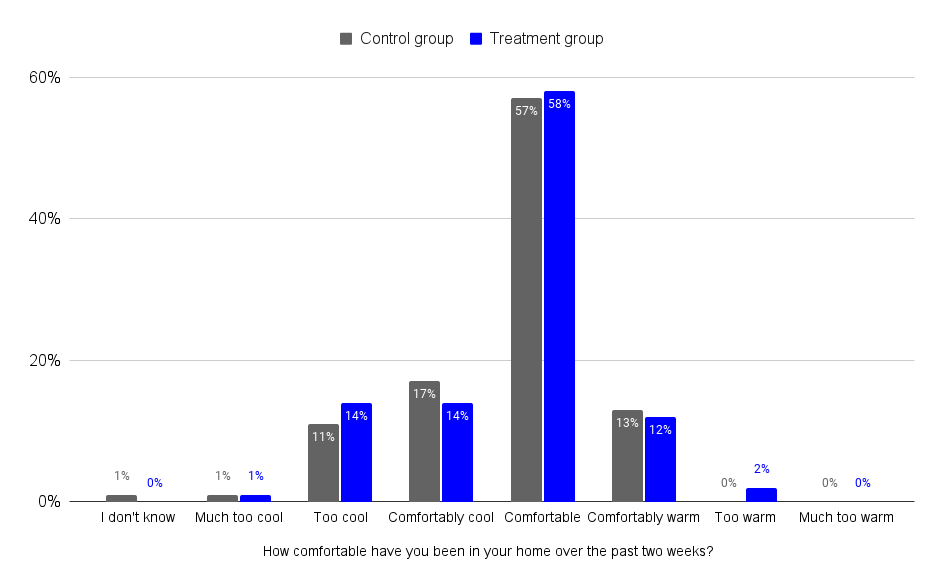
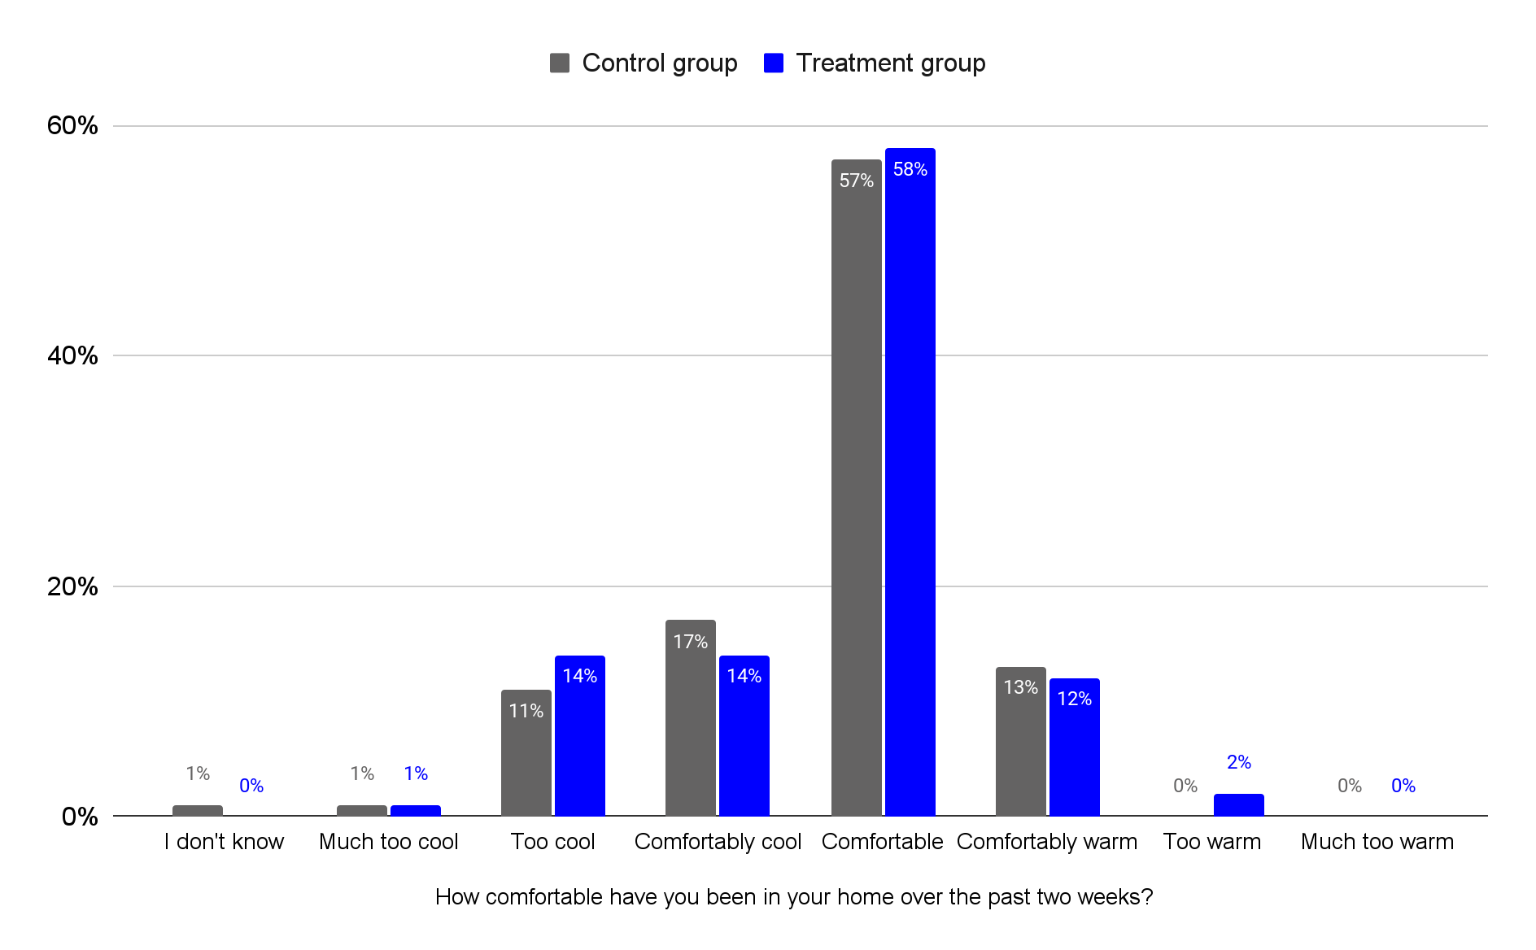
Turning down boiler flow temperatures could result in a decrease in thermal comfort, as it typically means that it takes longer to heat up rooms (due to a lower transfer of heat from radiators for a given amount of time). To assess this, we asked participants to report on their satisfaction with their thermal comfort over the past two weeks. Participants' responses are displayed below in Figure 11.
Figure 11. Responses to how satisfied participants were with the temperature of their homes (among 1,032 survey respondents)
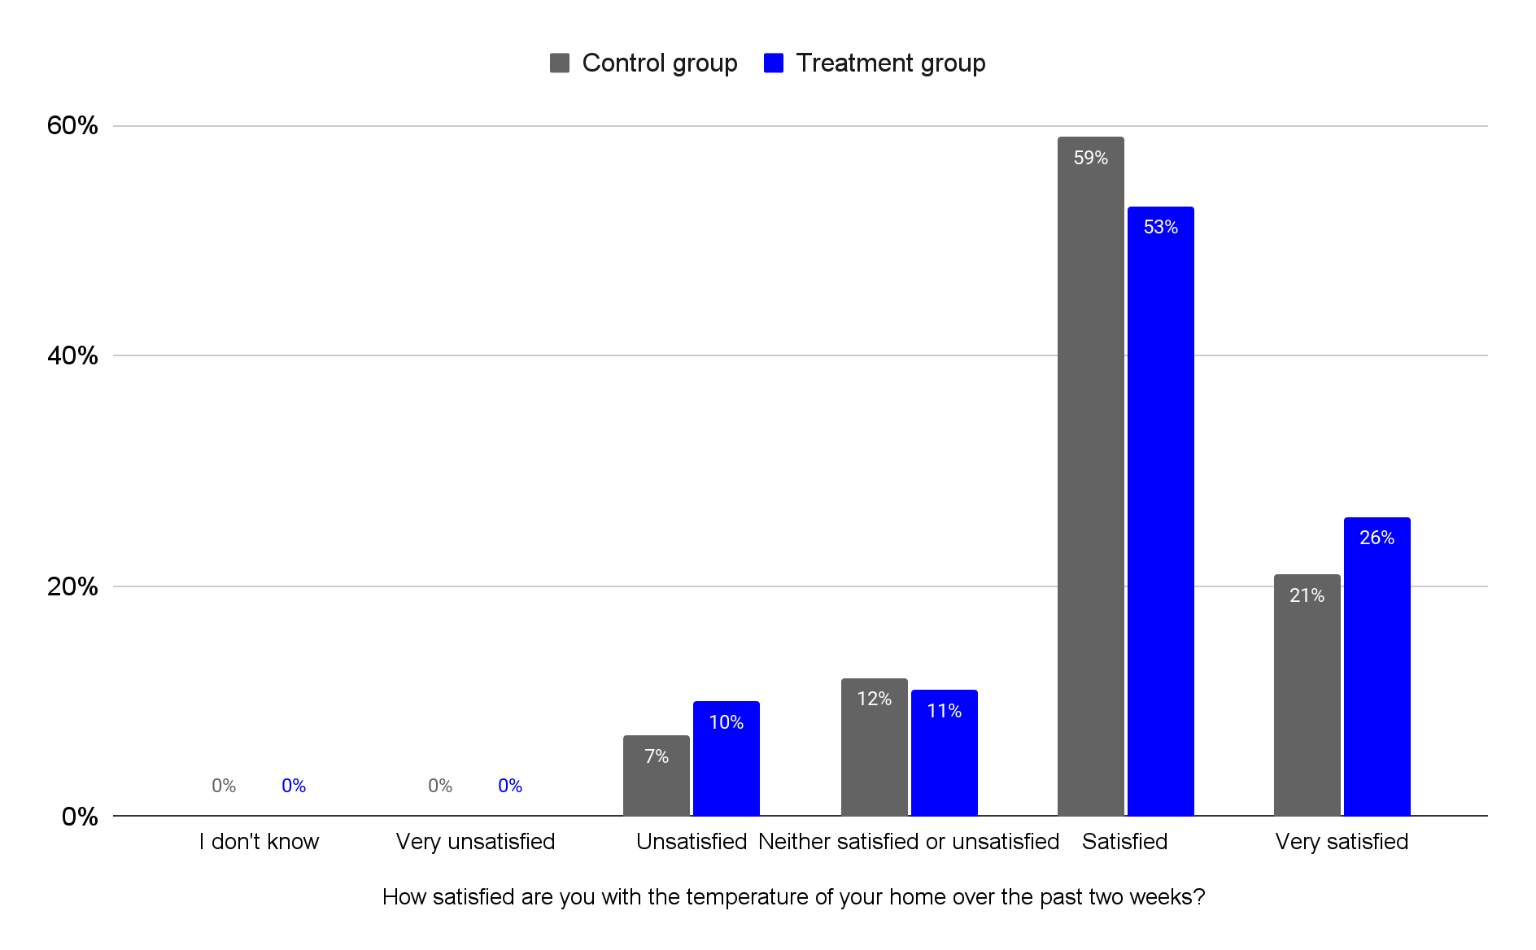
We did not find a statistically significant difference between the control group and the treatment group with respect to how many people were unsatisfied with the temperature of their home (11.1% in the treatment group versus 7.8% in the control group, p = .111).
Figure 12. Results from our secondary analysis (among 1,032 survey respondents)
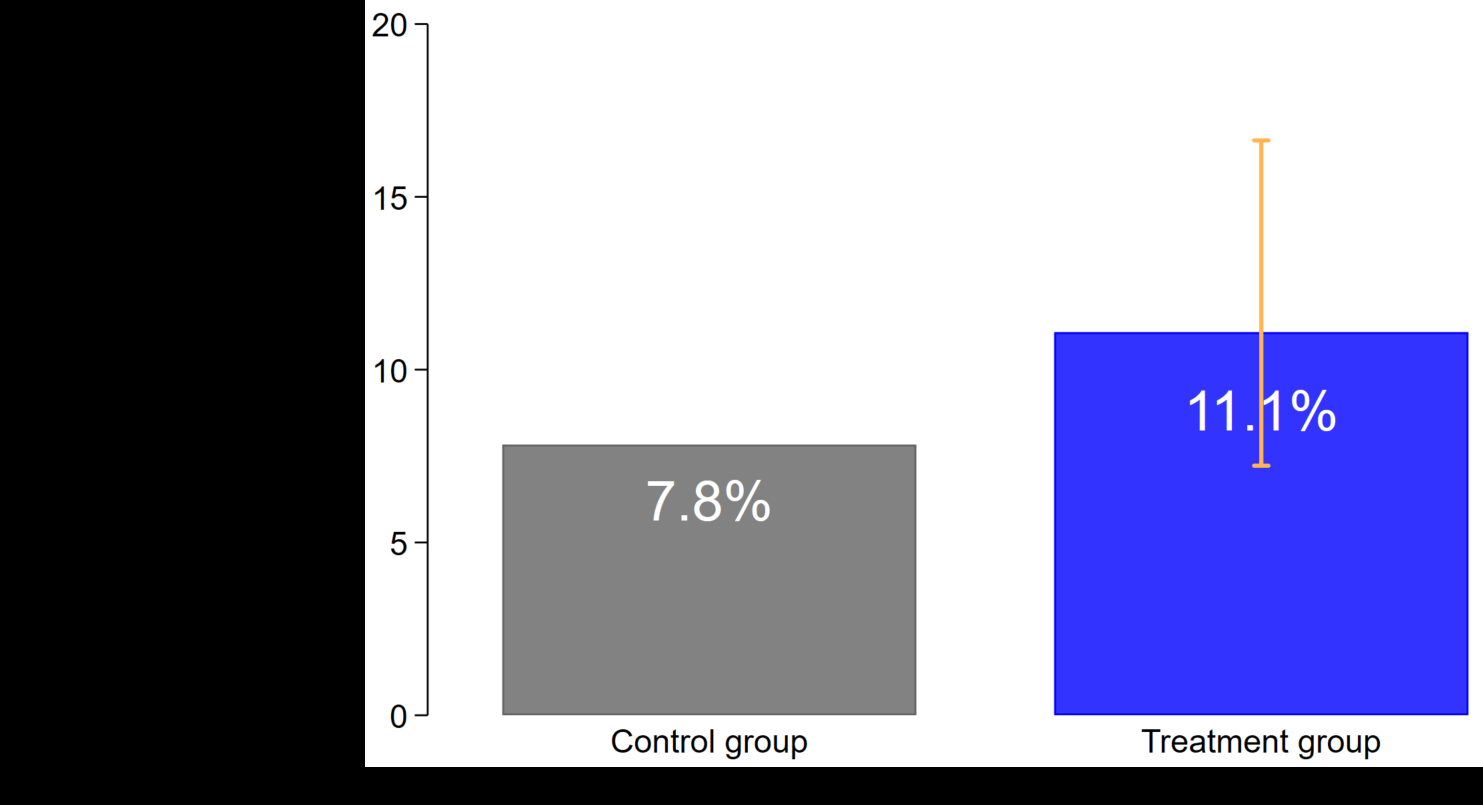
These findings suggest that our intervention resulted in more people lowering their flow temperature without introducing a difference in thermal comfort
Our primary analysis demonstrated that our email was indeed effective at increasing the number of individuals that turned their boiler flow temperature down, helping to confirm that this was an effective way to communicate this energy-saving strategy. Data collected by the website which hosted our online tool (Tally) confirmed this – 237 individuals reported turning their boiler flow temperature down after progressing through the tool.
It was also promising to find that participants' satisfaction with their temperature didn't appear to change as a result of turning their boiler flow temperature down. We confirmed this by also asking about participants' comfort with the temperature, in which we also found no significant difference (p = .111) (see Figure 13). It's worth saying that differences in thermal comfort may be more pronounced in colder weather - which is another reason why we plan on conducting a full-scale trial in winter.
Figure 13. Participants' thermal comfort (among 1,032 survey respondents)
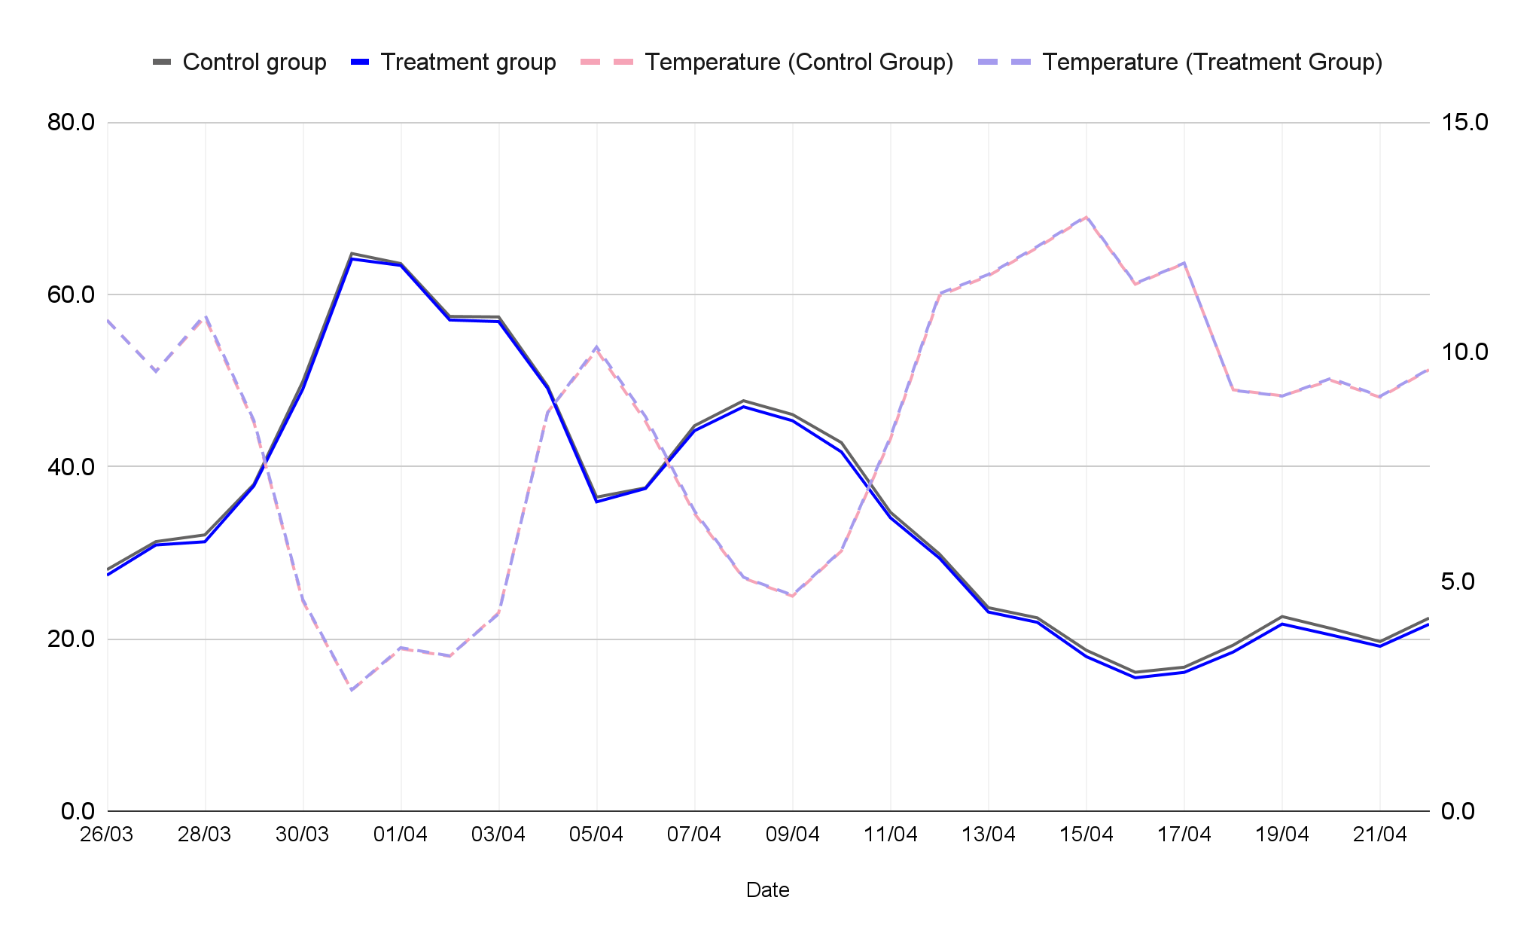
Gas consumption was much lower in the two weeks after Loop sent our email than the two weeks before our email, mostly due to warmer weather
The UK experienced warmer temperatures in the trial period (the two weeks after Loop sent our email) than in the pre-trial period (the two weeks before Loop sent our email). This is likely to have prompted lower gas consumption across both the treatment and control group (see Figure 14) in the trial period compared with the pre-trial period. In Figure 14, we show average temperature for the two groups – it was almost identical across the two groups (as one would expect given that the households were randomised). Daily gas consumption for the control group and the treatment group were similar prior to the trial (again, this is to be expected given the groups were randomised).
Figure 14. Daily gas consumption in our field trial (7,002 households, across 14 days; 94,458 total household-days analysed)
We found weak evidence of a reduction in daily gas consumption in the treatment group compared to the control group
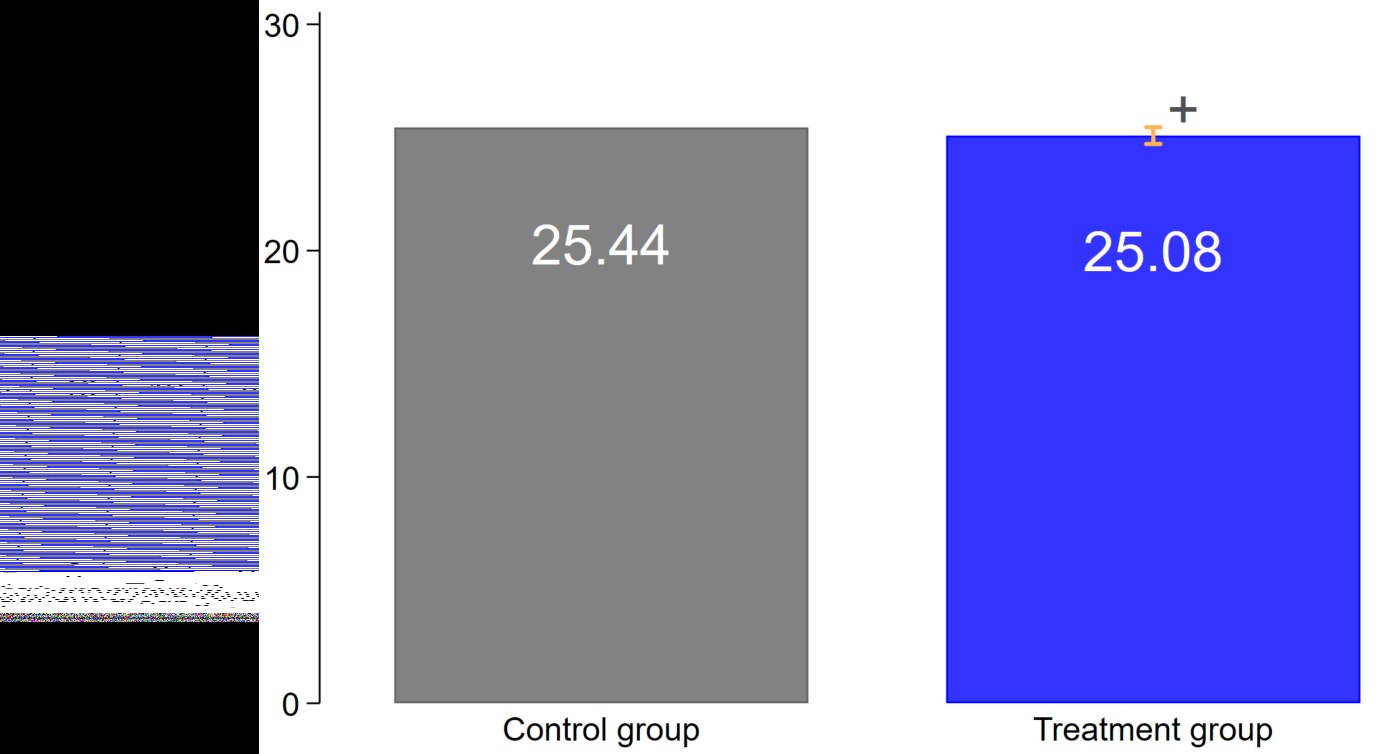
Our trial was intended to contribute to evidence on whether our intervention resulted in more people turning their boiler flow temperature down and to assess whether our intervention resulted in a change in thermal comfort. We were also interested in exploring whether we could detect an effect on gas consumption, which we explored using an intention-to-treat (ITT) analysis. In an ITT analysis, we examine the impact of the treatment (in this case, sending the email with the link to our tool helping people turn their boilers down) on all people in the treatment group, regardless of whether they followed the advice, opened the email, or even received it. We found that the treatment group had a daily gas consumption that was 0.36 kWh lower than the control group, but this wasn't statistically significant (p = .059).
This analysis does suggest that our intervention has promise in terms of reducing gas consumption. A 0.36 kWh reduction is approximately a reduction of 1.4%. This difference wasn't significant, so we can't conclude that our intervention reduced daily gas consumption. This reflects our original view that we wouldn't be able to detect a meaningful difference in a two-week trial in April – and that this would be better achieved in a full-scale trial over winter. (That said, when we control for heating degree days (a measure of cold weather), the ITT result is statistically significant (p = .042). However, we present the result here without controlling for heating degree days because heating degree days were not part of our pre-registered suite of control variables for analysis of gas consumption.)
Figure 15. ITT analysis of effect of our email on daily gas consumption (7,002 households, across 14 days; 94,458 total household-days analysed)
Conclusion
The results from our field trial indicated that the email with a link to our online tool was effective at increasing the number of participants who turned their boiler flow temperature down. Importantly, due to the way the online tool excluded individuals with hot water tanks or other central heating systems for whom our advice was not applicable, it meant we were confident that the right advice was provided to the right people.
The lack of a difference between the treatment group and the control group with respect to thermal comfort has also helped to allay some concerns that lowering boiler flow temperatures makes a material difference to thermal comfort. This is promising for two reasons: first, it means that one of the potential downsides to lowering boiler flow temperatures may be less of a concern than we previously thought; and second, it means the risk of potential backfire behaviours is lower than expected (for instance, turning on central heating for longer periods of time). We recognise that these concerns may be more apparent in cooler weather (such as in winter), where the effect of lower heat output from radiators may be felt more. This adds to our motivation to conduct a full-scale trial across winter to get further evidence on whether thermal comfort is affected.
Our field trial did not provide any strong evidence for the effect of our online tool on gas consumption. We found that the email reduced daily gas consumption by 0.357 kWh, but this was not statistically significant (p = .059) – this means we should treat this result with some caution, as the real effect may be higher or lower than 1.4%. The effect size is in line with other communications-based interventions to reduce energy consumption (such as Opower's communications as evaluated by Hunt Allcott). Given that we believe that only some customers followed the instructions in the email to turn their boiler down, the saving could have been much larger than 1.4% for those who followed our instructions. We will be able to get further clarity on this during our full-scale trial over winter.
It was unexpected that 19% of the control group self-reported that they had turned their boiler flow temperature down in the past two weeks. We anticipated that this proportion would be much lower. It does suggest that this advice is out for those that look for it, and we're aware that Loop customers are likely to be engaged with energy saving – as that is Loop's key benefit for customers. Correspondingly, the proportion in the general population may be smaller than this. A report on public opinions and social trends by the ONS published in July 2022 indicated that 10% of participants had “changed the temperature of the water in [their] radiators on [their] boiler (flow temperature)” within the last year. This is materially less than those in the control group in our trial.
There are a few potential explanations for this. For instance, it may be that participants misinterpreted the timescale, or reported that they had reduced their boiler flow temperature when it was actually their thermostat. We also note that our trial occurred at a time when there was a lot of media coverage on rising gas prices, which may have made people more aware of energy saving advice. This doesn't impact the robustness of our trial, as we expect this to be the same in the treatment and control groups due to our random allocation.
Irrespective of the reasons why the proportion of the control group who turned their boiler flow temperature down was higher than we thought, we are confident that our intervention can meaningfully increase this proportion.
In terms of next steps, we plan on doing more research into our questions – both via modelling and further field RCTs (including the full-scale trial over winter with Loop). We believe both these workstreams will provide useful evidence on the magnitude of the effect of turning down boiler flow temperatures.
Appendix
To identify the effect of turning boiler flow temperatures down on gas consumption, we used an instrumental variable analysis
Our previous analysis focused on the effect of our intervention and provided evidence that this could help more people turn their boiler flow temperature down. We also wanted to estimate the effect of people following the advice in the online tool - what was the impact of turning boiler flow temperatures down on gas consumption?
One approach to estimating the effect of turning boiler flow temperatures down is to use an instrumental variable analysis. Our email increased reported rates of turning boilers down from 19% in the control group to 35% in the treatment group. Using instrumental variable analysis, we can use the effect of our intervention to assess how many more people turned down their boiler flow temperature and what the consequent effect this had on gas consumption. Importantly, we were only able to use those who responded to the survey for this analysis as it was only for those participants that we knew whether they had turned down their boiler flow temperature (or not).
When we conducted this analysis, we found that turning down boiler flow temperatures was associated with (survey-responding) households having higher consumption of gas in the two weeks of our trial – but this also wasn't statistically significant (p = .051). Figure 16 displays these results. The difference is large – a 5.8 kWh effect - but we believe that this might be due to imbalance in survey responses (which we discuss in the next section). It's worth stating that Figure 16 shows the daily gas consumption only for individuals who reported that they turned their boiler flow temperatures down – and the difference in the two bars is the result of our intervention. Notably, in the control group bar in Figure 16, the daily gas consumption is notably lower than that of the control group as a whole (21.0 kWh versus 25.4 kWh). This suggests that, in the absence of our intervention, those in the control group who turn their boiler flow temperatures down do have a lower gas consumption than those in the control group who didn't (this is a correlation, not causal). Accordingly, these findings don't question whether turning boiler flow temperatures down reduces gas consumption, but it does indicate that those who turned their boiler flow temperature down in the treatment group had a higher gas consumption than those in the control group.
Figure 16. Instrumental variable analysis of effect of our intervention (1,032 households, across 14 days; 14,014 household-days analysed)
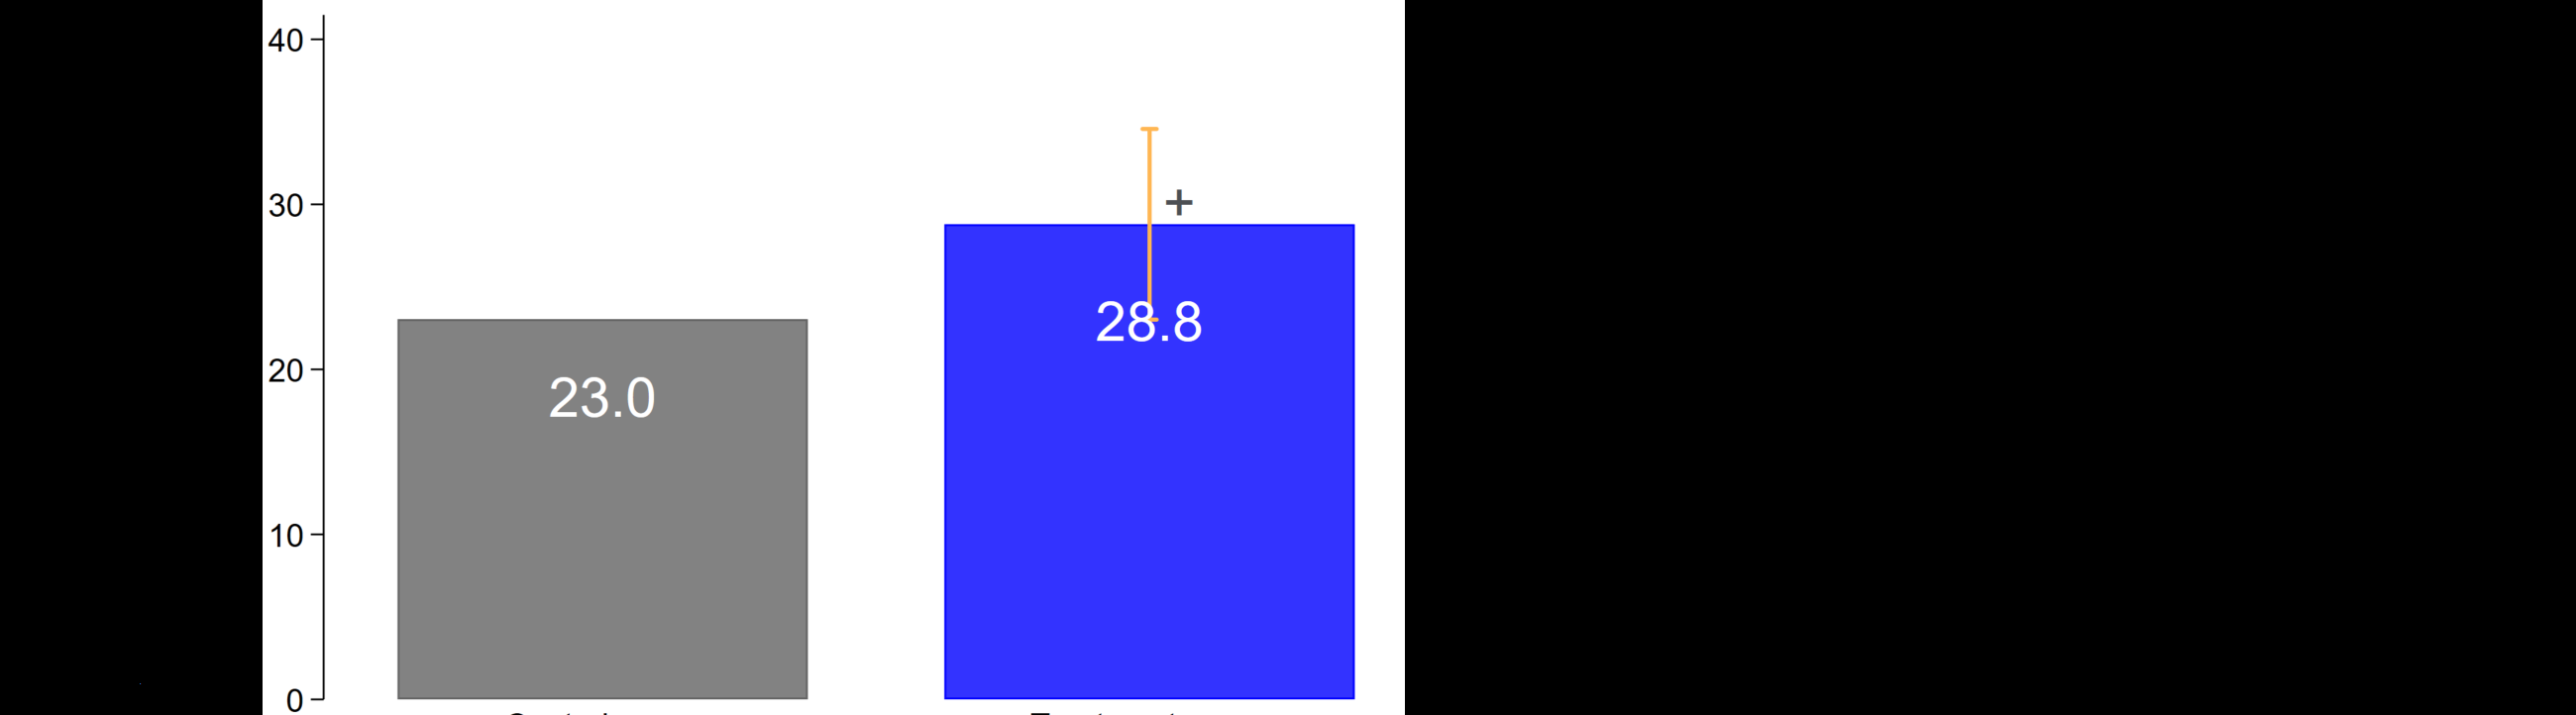
We believe our instrumental variable analysis was confounded by differential survey response and we are more confident in the results of our ITT analysis
Although neither of the analyses we conducted using gas consumption as an outcome were significant, the results of both do suggest different effects in terms of gas saving. On balance, the ITT analysis is the more robust finding: as an RCT, we can be confident that there were no other variables that may have introduced bias into our findings. For the instrumental variable analysis however, as we only used the small proportion of the sample who responded to the survey, there may be other factors that introduced bias to the finding. For instance, it may be that completing the online tool made people more likely to respond to the survey. This means that we can't be sure that the effect we saw in the analysis is from the intervention itself (or turning down boiler flow temperatures), or because of some other factor that we can't observe. This is closely related to the benefits of random sampling in polling over other methods that are more vulnerable to differential response, as noted by NatCen in its analysis of polling error in the 2015 UK General Election. Instrumental variable analysis also requires more assumptions than randomised control trials, which is why IVs are considered 'Level 4' on the Maryland Scale (a scale for rating the robustness of research methods, as summarised by What Works Centre for Local Economic Growth), whereas RCTs are considered the most robust evaluation method at Level 5.
In both cases, our trial wasn't set up to best observe effects on gas consumption. For example, we didn't know when within the two weeks that participants turned their boilers down. While we could expect this to be close to the point in which our intervention was sent for the treatment group, for the control group, it may have been any point across the trial period. We also don't know how much participants turned their boiler flow temperatures down by (which we know impacts the extent of energy saving). All of these factors add variability to the potential for energy savings – which is why we ran a field trial in the first place, but also would be factors that we would want to try to measure in our large-scale trial in winter.
Overall, these results will be best understood with a larger field trial, where we have enough time to sufficiently measure gas consumption. The pilot trial has indicated that our intervention is effective at helping people to turn down their boiler flow temperature and the large-scale trial will contribute to the question on whether turning boiler flow temperatures down does indeed result in a 6-8% energy saving.
Technical annex
In this section, we report our pre-specified analysis (see here) for transparency.
Balance in covariates across experimental arms
As discussed in our pre-analysis plan, we used stratified randomisation to allocate participants to the control group or the treatment group. We stratified on the region of participants' households (as defined by Nomenclature of Territorial Units for Statistics [NUTS] 1).
Below, we present descriptive statistics on the variables used as covariates in our regression models. Overall, we did not find evidence of material imbalance across the experimental arms. We note that all covariates were included in the regression models as controls, accounting for differences across experimental arms.
Table 1. Descriptive statistics for covariates
| Variable |
Control % (n) |
Treatment (email with link) % (n) |
Result of statistical test of difference |
| Region |
|
|
X² (10, n = 7,002) = 0.021; p = 1 |
| C |
3% (108) |
3% (110) |
|
| D |
10% (359) |
10% (359) |
|
| E |
7% (246) |
7% (246) |
|
| F |
10% (360) |
10% (360) |
|
| G |
9% (328) |
9% (328) |
|
| H |
12% (423) |
12% (423) |
|
| I |
7% (261) |
7% (262) |
|
| J |
21% (724) |
21% (724) |
|
| K |
10% (365) |
10% (364) |
|
| L |
5% (170) |
5% (170) |
|
| M |
4% (156) |
4% (156) |
|
| Length of time with Loop |
|
|
X² (2, n = 7,002) = 5.419; p = .067 |
| Less than 1 month |
41% (1,440) |
38% (1,348) |
|
| 1 to 4 months |
35% (1,217) |
37% (1,290) |
|
| More than 4 months |
24% (843) |
25% (864) |
|
| Proportion of emails from Loop read |
|
|
X² (2, n = 7,002) = 4.020; p = .134 |
| All |
2% (71) |
2% (167) |
|
| None |
42% (1,459) |
41% (2,890) |
|
| Some |
56% (1,970) |
56% (3,945) |
|
Table 2. Descriptive statistics for annual consumption band
| Variable |
Control % (n) |
Treatment (email with link) % (n) |
Result of statistical test of difference |
| Annual consumption band |
|
|
X² (70, n = 7,002) = 64.844; p = .652 |
| 1 |
1% (18) |
1% (21) |
|
| 2 |
1% (18) |
1% (27) |
|
| 3 |
0% (12) |
0% (8) |
|
| 4 |
0% (10) |
0% (15) |
|
| 5 |
0% (14) |
0% (14) |
|
| 6 |
1% (22) |
1% (28) |
|
| 7 |
1% (29) |
1% (25) |
|
| 8 |
1% (42) |
1% (25) |
|
| 9 |
1% (38) |
1% (36) |
|
| 10 |
1% (47) |
2% (58) |
|
| 11 |
2% (56) |
2% (59) |
|
| 12 |
2% (59) |
2% (65) |
|
| 13 |
2% (71) |
2% (64) |
|
| 14 |
2% (75) |
2% (66) |
|
| 15 |
2% (77) |
2% (85) |
|
| 16 |
2% (82) |
3% (94) |
|
| 17 |
3% (90) |
2% (87) |
|
| 18 |
3% (107) |
3% (94) |
|
| 19 |
3% (118) |
3% (105) |
|
| 20 |
3% (110) |
3% (116) |
|
| 21 |
3% (115) |
3% (112) |
|
| 22 |
3% (118) |
3% (112) |
|
| 23 |
3% (111) |
3% (117) |
|
| 24 |
3% (111) |
4% (128) |
|
| 25 |
3% (104) |
3% (108) |
|
| 26 |
3% (109) |
3% (109) |
|
| 27 |
3% (100) |
3% (99) |
|
| 28 |
3% (102) |
3% (116) |
|
| 29 |
3% (111) |
3% (88) |
|
| 30 |
3% (94) |
3% (88) |
|
| 31 |
3% (92) |
3% (95) |
|
| 32 |
2% (72) |
2% (86) |
|
| 33 |
2% (82) |
2% (78) |
|
| 34 |
2% (68) |
2% (73) |
|
| 35 |
2% (67) |
2% (63) |
|
| 36 |
1% (46) |
2% (68) |
|
| 37 |
2% (61) |
2% (70) |
|
| 38 |
1% (52) |
2% (73) |
|
| 39 |
2% (65) |
2% (60) |
|
| 40 |
2% (61) |
1% (51) |
|
| 41 |
1% (50) |
1% (44) |
|
| 42 |
1% (40) |
1% (39) |
|
| 43 |
1% (31) |
1% (30) |
|
| 44 |
1% (48) |
1% (27) |
|
| 45 |
1% (38) |
1% (45) |
|
| 46 |
1% (35) |
1% (34) |
|
| 47 |
1% (40) |
1% (22) |
|
| 48 |
1% (25) |
1% (24) |
|
| 49 |
0% (15) |
1% (18) |
|
| 50 |
1% (24) |
1% (19) |
|
| 51 |
1% (20) |
1% (23) |
|
| 52 |
1% (19) |
1% (23) |
|
| 53 |
1% (19) |
0% (15) |
|
| 54 |
1% (18) |
0% (7) |
|
| 55 |
1% (18) |
1% (18) |
|
| 56 |
0% (11) |
0% (14) |
|
| 57 |
0% (13) |
0% (16) |
|
| 58 |
0% (13) |
0% (10) |
|
| 59 |
0% (11) |
0% (12) |
|
| 60 |
0% (8) |
0% (10) |
|
| 61 |
1% (19) |
1% (20) |
|
| 62 |
0% (10) |
1% (21) |
|
| 63 |
1% (21) |
0% (17) |
|
| 64 |
0% (14) |
1% (19) |
|
| 65 |
0% (12) |
0% (8) |
|
| 66 |
0% (12) |
0% (5) |
|
| 67 |
0% (15) |
0% (13) |
|
| 68 |
0% (13) |
0% (6) |
|
| 69 |
0% (6) |
0% (5) |
|
| 70 |
0% (7) |
0% (4) |
|
| 71 |
1% (39) |
1% (48) |
|
Descriptive statistics for outcomes
Below, we present the descriptive statistics for the three outcomes used in our analysis
Table 3. Descriptive statistics for outcomes
|
Control group |
Treatment group |
| N Number of participants |
3,500 |
3,502 |
| n Number of survey responses |
498 |
534 |
| Primary outcome proportion of participants who self-reported they turned their boiler flow temperature down in the past two weeks |
19% n = 97 |
34% n = 181 |
| Secondary outcome Proportion of participants who were either unsatisfied or very unsatisfied with the temperature of their home |
8% n = 39 |
10% n = 53 |
| Secondary outcome Daily gas consumption (kWh) |
Mean = 25.44; SD = 23.86 |
Mean = 24.75; SD = 23.51 |
Results
Below, we present the results from our pre-specified analysis.
Primary analysis
Table 4. Results from our primary analysis; outcome: proportion of participants who self-reported they turned their boiler flow temperature down in the past two weeks (among 1,032 survey respondents)
| Logistic regression |
Primary analysis b(se) |
p-value |
95% CIs Lower |
95% CIs Upper |
| Exp. arm (ref.: Control group) Treatment group |
2.253 (0.160) |
<.01** |
1.647 |
3.082 |
| Constant |
- |
- |
- |
- |
| Controls |
YES |
|
|
|
| n |
1,032 |
|
|
|
| Pseudo R² (Cragg-Uhler) |
0.167 |
|
|
|
Coefficients are odds ratios. Controls include region, length of time with Loop, proportion of Loop emails read, annual consumption band
+ p < .1, * p<.05, ** p <.01
Secondary analysis
Table 5. Results from our secondary analysis; outcome: proportion of participants who were either unsatisfied or very unsatisfied with the temperature of their home (among 1,032 survey respondents)
| Logistic regression |
Secondary analysis b(se) |
p-value |
95% CIs Lower |
95% CIs Upper |
| Exp. arm (ref.: Control group) Treatment group |
1.467 (0.240) |
.111 |
0.916 |
2.348 |
| Constant |
- |
- |
- |
- |
| Controls |
YES |
|
|
|
| N |
1,032 |
|
|
|
| Pseudo R² (Cragg-Uhler) |
0.175 |
|
|
|
Coefficients are odds ratios. Controls include region, length of time with Loop, proportion of Loop emails read, annual consumption band
+ p < .1, * p<.05, ** p <.01
Gas consumption analysis
Table 6. Results from our ITT analysis; outcome: daily gas consumption (kWh) (7,002 households [n = 94,458])
| Linear regression |
Exploratory analysis b(se) |
p-value |
95% CIs Lower |
95% CIs Upper |
| Exp. arm (ref.: Control group) Treatment group |
-0.357 (0.189) |
.059+ |
-0.728 |
0.014 |
| Constant |
4.732 (1.014) |
|
|
|
| Controls |
YES |
|
|
|
| N |
94,458 |
|
|
|
| R² |
0.467 |
|
|
|
| Adjusted R² |
0.466 |
|
|
|
Clustered SEs used (household); number of clusters = 7,002. Controls include region, length of time with Loop, proportion of Loop emails read, annual consumption band
+ p < .1, * p < .05, ** p < .01
Table 7. Results from our instrumental variable analysis; outcome: daily gas consumption (kWh) (1,032 households [n = 14,014])
| First stage: logistic; second stage: linear |
Secondary analysis b(se) |
p-value |
95% CIs Lower |
95% CIs Upper |
| Exp. arm (ref.: Did not turn down boiler flow temperature) Turned down boiler flow temperature |
5.752 |
.051+ |
-0.023 |
11.528 |
| Constant |
(2.946) 1.962 (2.300) |
- |
- |
- |
| Controls |
YES |
|
|
|
| N |
14,014 |
|
|
|
| Multiple R² |
0.491 |
|
|
|
| Adjusted R² |
0.488 |
|
|
|
Clustered SEs used (household); number of clusters = 1,032. Controls include region, length of time with Loop, proportion of Loop emails read, annual consumption band
+ p < .1, * p < .05, ** p < .01
Survey sent at end of the trial (sent by Loop via Survey Monkey)
First, a few questions about you and your home.
1 [email address] What email address do you use for Loop? (the email address this survey was sent to).
[text box]
2 [occupants] How many people usually live in your home, including you?
- 1
- 2
- 3
- 4
- 5
- 6 or more
3 [own or rent] Do you currently: ?
- rent your home
- own your home
- other [please specify]
4 [bedrooms] How many bedrooms does your home have?
- 0
- 1
- 2
- 3
- 4
- 5 or more
Next, a few questions on how you heat your home.
5 [secondary outcome] How satisfied are you with the temperature of your home over the past two weeks?
- Very satisfied
- Satisfied
- Neither satisfied or unsatisfied
- Unsatisfied
- Very unsatisfied
- I don't know
6 How comfortable have you been in your home over the past two weeks?
- Much too warm
- Too warm
- Comfortably warm
- Comfortable
- Comfortably cool
- Too cool
- Much too cool
- I don't know
7 What best describes the main heating system in your home? (If you have multiple heating sources, choose the system that heats the most of your house.)
- Gas central heating (e.g. gas boiler)
- Electric central heating (e.g. electric radiators, heat pump)
- Oil or Liquefied petroleum gas (LPG) central heating
- A fireplace or other solid fuel central heating (e.g. biomass boiler, stove)
- No central heating system
- Other [please specify]
- I don't know
8 [hot water tank] Do you have a hot water tank? (A hot water tank is separate to your boiler. It will be a large unit usually in a cupboard or attic. It stores your hot water.)
- Yes
- No
- I don't know
9 [turned heating off] Have you already turned your heating off for Spring/Summer?
- Yes
- No
- I don't know
10 [primary outcome] Have you changed your boiler flow temperature settings in the past two weeks? (This is a setting on your boiler, not your thermostat.)
- Yes, I decreased my boiler flow temperature
- Yes, I increased my boiler flow temperature
- No, I did not change my boiler flow temperature
- I don't know
11 [advice source] [if respondent responded 'yes' (either direction) to [primary outcome] question] Where did you find the information to change your boiler flow temperature? Please tick all that apply:
- Word of mouth
- Advice from Loop
- Advice from an organisation other than loop
- Other [please specify]
Finally, we wanted to ask a question about heat pumps, a technology to heat homes that is more environmentally friendly than gas boilers.
12 [heat pump interest despite low temperature] Switching to a heat pump means your radiators may not be as hot. Your thermostat will still reach the same set temperature, it may just take slightly longer to do so. If a heat pump cost the same as a gas boiler, how interested would you be in getting one in your home?
- Very interested
- Interested
- Neither interested or uninterested
- Uninterested
- Very uninterested
- I don't know

58 Victoria Embankment
London EC4Y 0DS
+44 (0)20 7438 2500
[email protected]
Twitter: @nesta_uk
Facebook: nesta.uk
www.nesta.org.uk
ISBN: 978-1-913095-68-0
Nesta is a registered charity in England and Wales with company number 7706036 and charity number 1144091. Registered as a charity in Scotland number SC042833. Registered office:
58 Victoria Embankment, London EC4Y 0DS.