Context: who are the families?
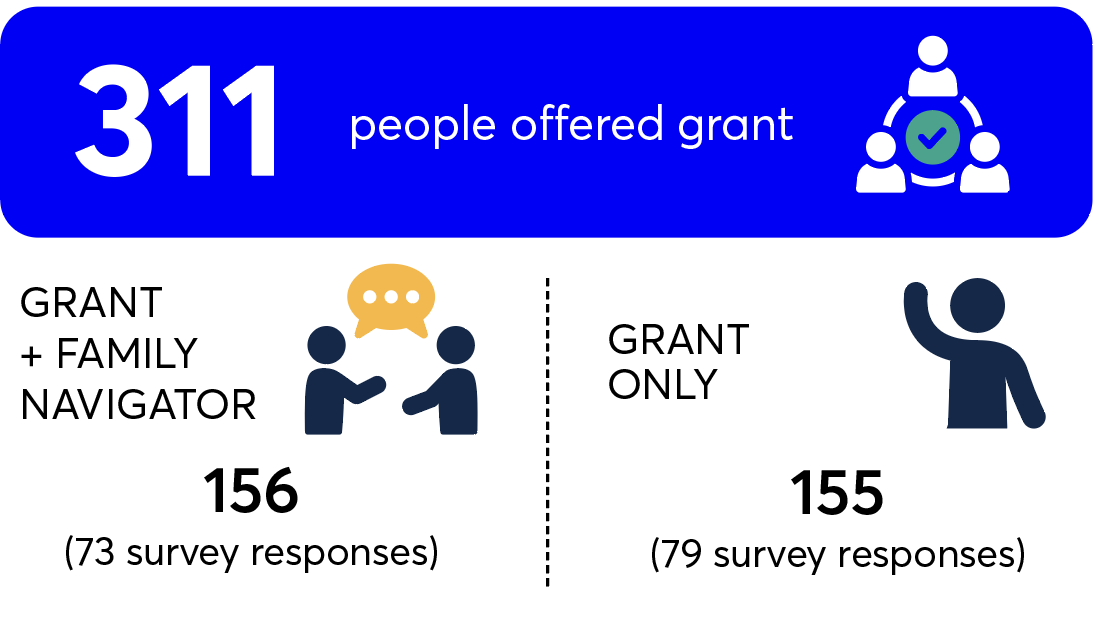
From the beginning of the pilot through to mid-January 2026 (9 months), 311 parents were offered the grant. As part of the pilot, parents are randomly assigned to receive either the grant only or the grant as well as proactive outreach from a Family Navigator. Both groups receive information in writing about Family Hubs.
Note: Much of the data in this report comes from our survey, which has been completed by around half of the grant recipients. The appendix provides graphs with more detail than is shown in the main report.
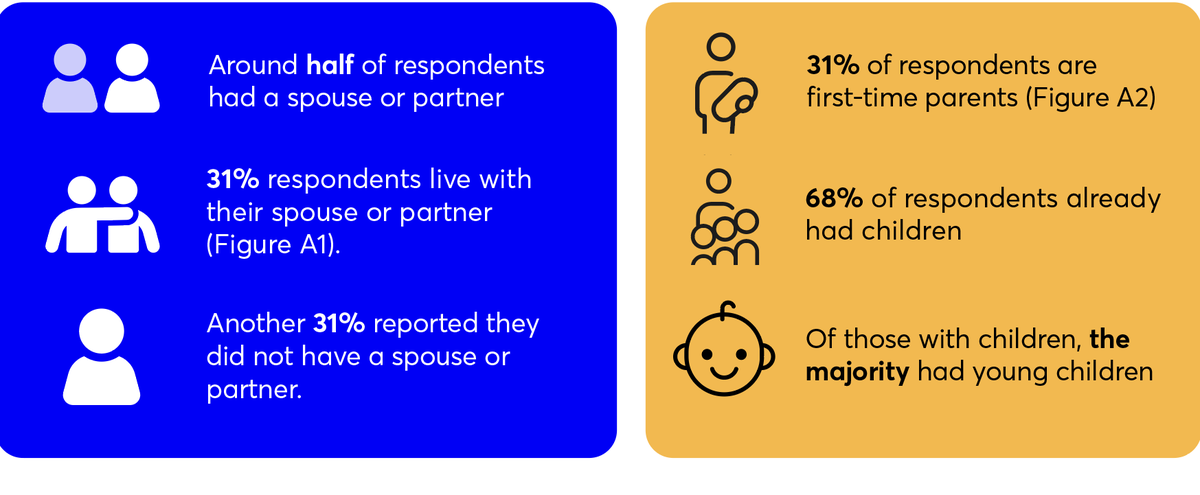
Household composition
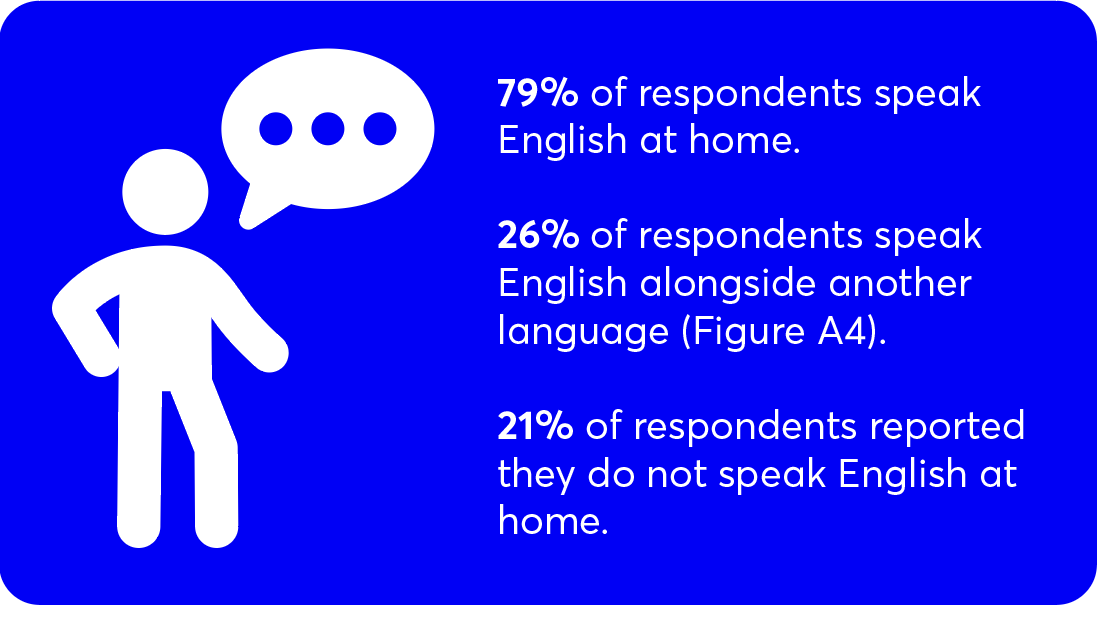
Ethnic and linguistic diversity
Survey respondents reported diverse ethnic backgrounds, with the single most common ethnicity being White, followed by Asian or Asian British.
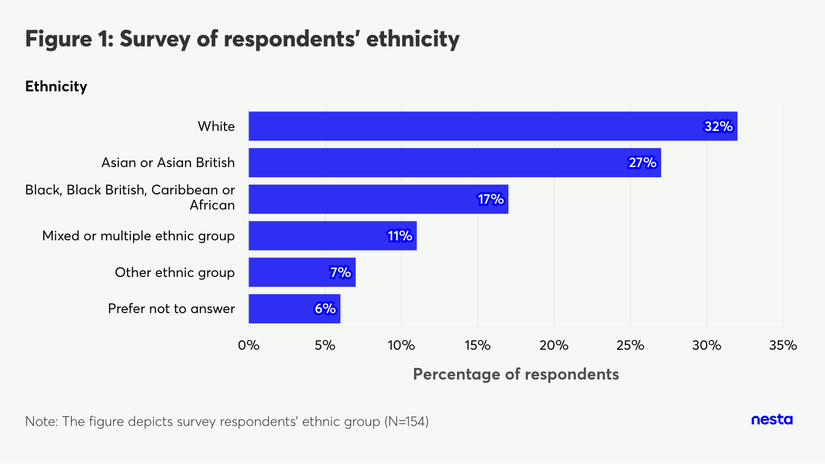
Figure 1
Image Description
A horizontal bar chart titled 'Figure 1: Survey of respondents' ethnicity'. The vertical axis lists different ethnic categories, and the horizontal axis measures the 'Percentage of respondents' from 0% to 35%. The blue bars show the following distribution from top to bottom: White at 32%; Asian or Asian British at 27%; Black, Black British, Caribbean or African at 17%; Mixed or multiple ethnic group at 11%; Other ethnic group at 7%; and Prefer not to answer at 6%. A footnote at the bottom reads 'Note: The figure depicts survey respondents' ethnic group (N=154)'.
Financial situation
Around one-third of survey respondents were employed full-time or part-time (Figure 2). Just over half reported that they are not currently employed.
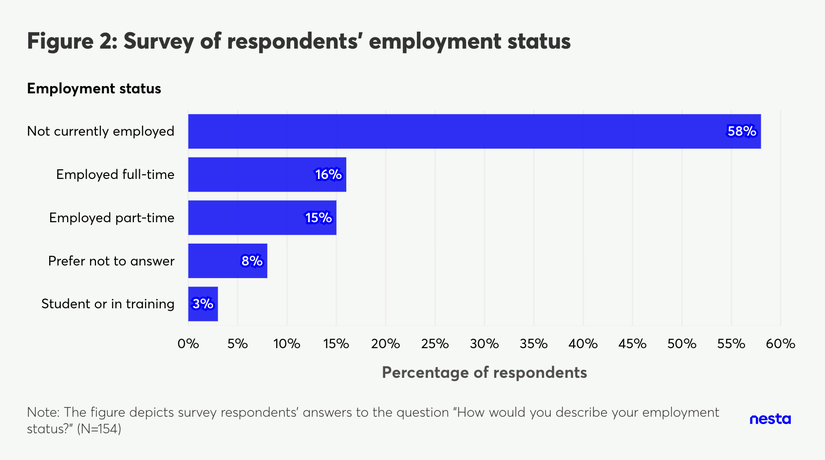
Figure 2
Image Description
A horizontal bar chart titled 'Figure 2: Survey of respondents' employment status'. The vertical axis lists different employment categories, and the horizontal axis measures the 'Percentage of respondents' from 0% to 60%. The blue bars show the following distribution from top to bottom: Not currently employed at 58%; Employed full-time at 16%; Employed part-time at 15%; Prefer not to answer at 8%; and Student or in training at 3%. A footnote at the bottom reads 'Note: The figure depicts survey respondents' answers to the question "How would you describe your employment status?" (N=154)'.
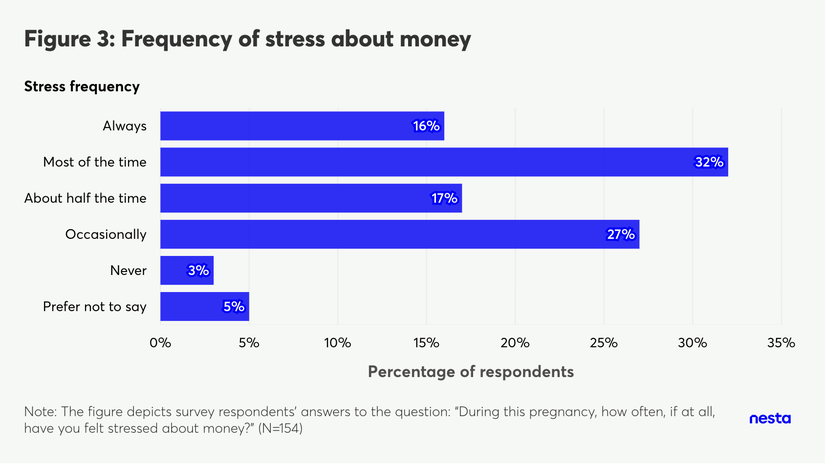
Figure 3
Image Description
A horizontal bar chart titled 'Figure 3: Frequency of stress about money'. The vertical axis lists 'Stress frequency' categories, and the horizontal axis measures the 'Percentage of respondents' from 0% to 35%. The blue bars show the following distribution from top to bottom: Always at 16%; Most of the time at 32%; About half the time at 17%; Occasionally at 27%; Never at 3%; and Prefer not to say at 5%. A footnote at the bottom reads 'Note: The figure depicts survey respondents' answers to the question: "During this pregnancy, how often, if at all, have you felt stressed about money?" (N=154)'.
Previous experience with Family Hubs

Note: This question regarding visiting Famuiy Hubs was asked in the survey, which takes place approximately five weeks after the intervention – some respondents had already been to a Family Hub as part of the Family Navigator intervention at this point.
Have visited a Family Hub
1 in 5 respondents reported that they attend a Family Hub regularly. But of those who had been to a Family Hub before, most currently go rarely.
Of those who have been to a Family Hub, two-thirds said that they were either satisfied or very satisfied with the Family Hub services. Most others were neutral.
Haven't visited a Family Hub
For survey respondents who had not been to a Family Hub before, or said they do not intend to go, we asked them why.
The most common responses related to information: many respondents said they don’t know about Family Hubs or were unsure what they offer (Figure A6).
This lack of understanding of what Family Hubs offer was also clear when we asked interviewees where they would go for support with their pregnancy or baby - Family Hubs are not (yet) established as a primary point of reference. Instead, interviewees cited personal networks (nuclear and extended family, friends, especially those who have had children), medical professionals (GP, midwife, doula, health visitor) and online sources (Google, Networks, ChatGPT, Camden website).
For survey respondents who were aware of what Family Hubs offer but had not been or did not intend to go, the most common reason for not visiting a Family Hub was a lack of time.