Appendix
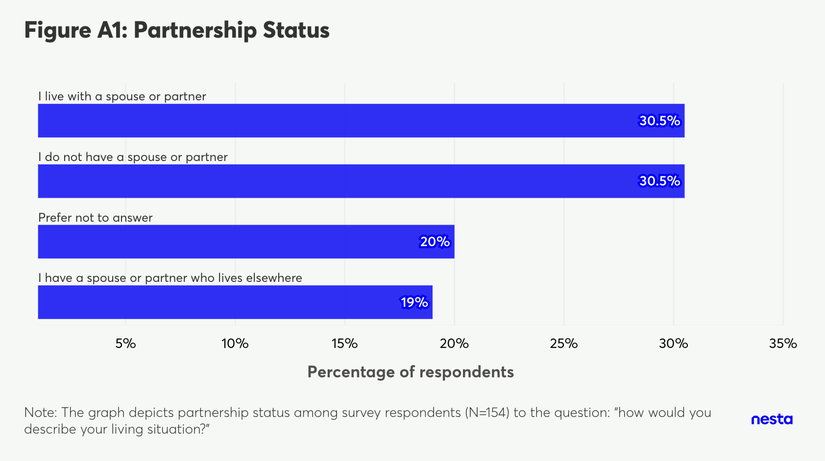
Figure A1
Image Description
A horizontal bar chart titled 'Figure A1: Partnership Status'. The vertical axis lists four partnership status categories, and the horizontal axis measures the 'Percentage of respondents' up to 35%. The blue bars show the following distribution from top to bottom: 'I live with a spouse or partner' at 30.5%; 'I do not have a spouse or partner' at 30.5%; 'Prefer not to answer' at 20%; and 'I have a spouse or partner who lives elsewhere' at 19%. A footnote at the bottom reads 'Note: The graph depicts partnership status among survey respondents (N=154) to the question: "how would you describe your living situation?"'.
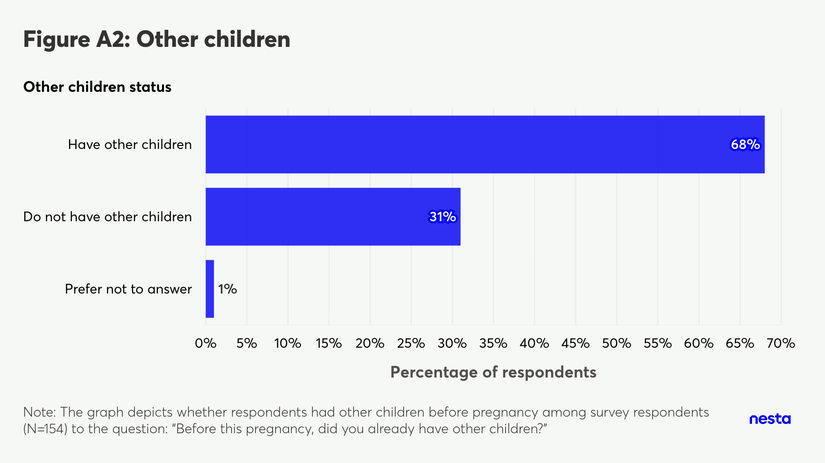
Figure A2
Image Description
A horizontal bar chart titled 'Figure A2: Other children'. The vertical axis lists 'Other children status' categories, and the horizontal axis measures the 'Percentage of respondents' from 0% to 70%. The blue bars show the following distribution from top to bottom: 'Have other children' at 68%; 'Do not have other children' at 31%; and 'Prefer not to answer' at 1%. A footnote at the bottom reads 'Note: The graph depicts whether respondents had other children before pregnancy among survey respondents (N=154) to the question: "Before this pregnancy, did you already have other children?"'.
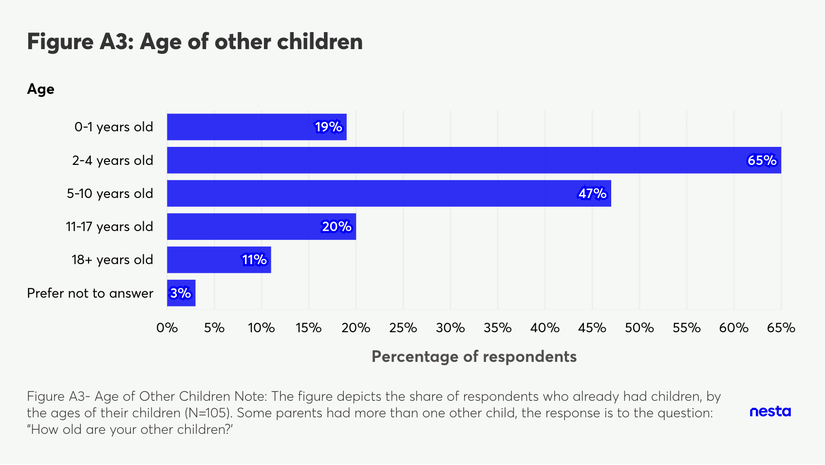
Figure A3
Image Description
A horizontal bar chart titled 'Figure A3: Age of other children'. The vertical axis lists 'Age' categories, and the horizontal axis measures the 'Percentage of respondents' from 0% to 65%. The blue bars show the following distribution from top to bottom: 0-1 years old at 19%; 2-4 years old at 65%; 5-10 years old at 47%; 11-17 years old at 20%; 18+ years old at 11%; and Prefer not to answer at 3%. A footnote at the bottom reads 'Figure A3- Age of Other Children Note: The figure depicts the share of respondents who already had children, by the ages of their children (N=105). Some parents had more than one other child, the response is to the question: "How old are your other children?"'.
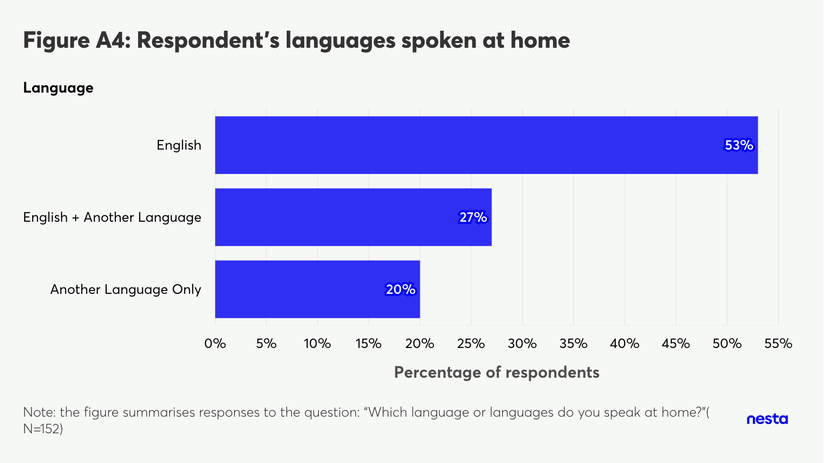
Figure A4
Image Description
A horizontal bar chart titled 'Figure A4: Respondents' languages spoken at home'. The vertical axis lists 'Language' categories, and the horizontal axis measures the 'Percentage of respondents' from 0% to 55%. The blue bars show the following distribution from top to bottom: English at 53%; English + Another Language at 27%; and Another Language Only at 20%. A footnote at the bottom reads 'Note: the figure summarises responses to the question: "Which language or languages do you speak at home?"( N=152)'.
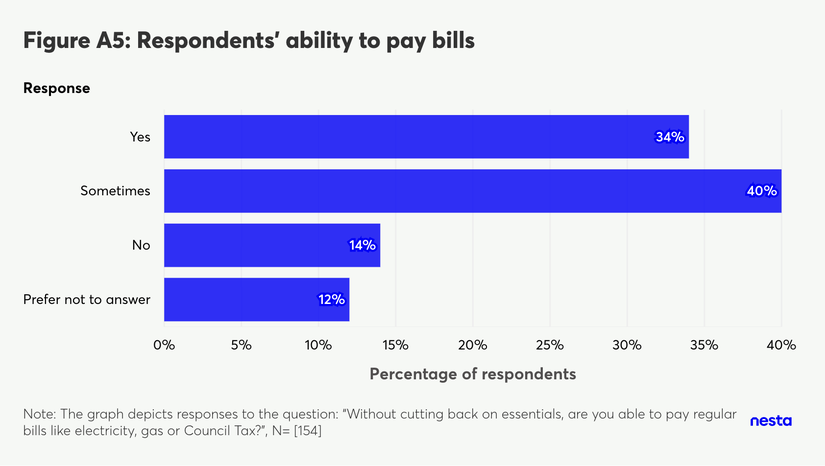
Figure A5
Image Description
A horizontal bar chart titled 'Figure A5: Respondents' ability to pay bills'. The vertical axis lists 'Response' categories, and the horizontal axis measures the 'Percentage of respondents' from 0% to 40%. The blue bars show the following distribution from top to bottom: Yes at 34%; Sometimes at 40%; No at 14%; and Prefer not to answer at 12%. A footnote at the bottom reads 'Note: The graph depicts responses to the question: "Without cutting back on essentials, are you able to pay regular bills like electricity, gas or Council Tax?", N= [154]'.
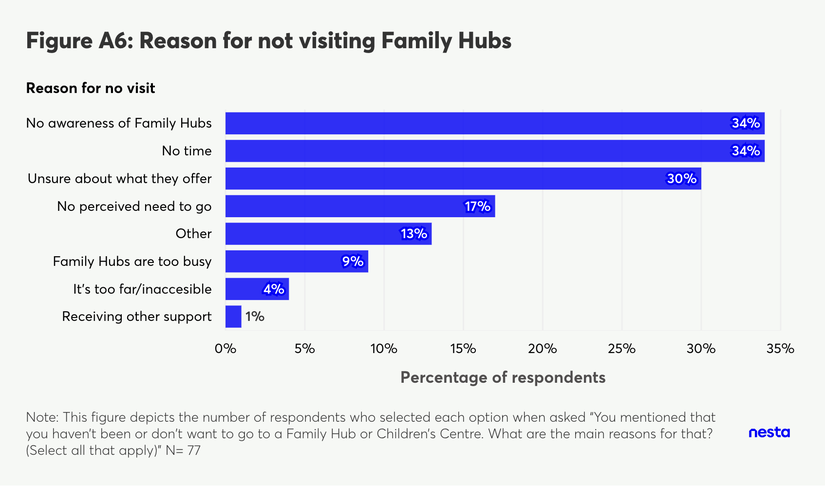
Figure A6
Image Description
A horizontal bar chart titled 'Figure A6: Reason for not visiting Family Hubs'. The vertical axis lists 'Reason for no visit' categories, and the horizontal axis measures the 'Percentage of respondents' from 0% to 35%. The blue bars show the following distribution from top to bottom: No awareness of Family Hubs at 34%; No time at 34%; Unsure about what they offer at 30%; No perceived need to go at 17%; Other at 13%; Family Hubs are too busy at 9%; It's too far/inaccesible at 4%; and Receiving other support at 1%. A footnote at the bottom reads 'Note: This figure depicts the number of respondents who selected each option when asked "You mentioned that you haven't been or don't want to go to a Family Hub or Children's Centre. What are the main reasons for that? (Select all that apply)" N= 77'.
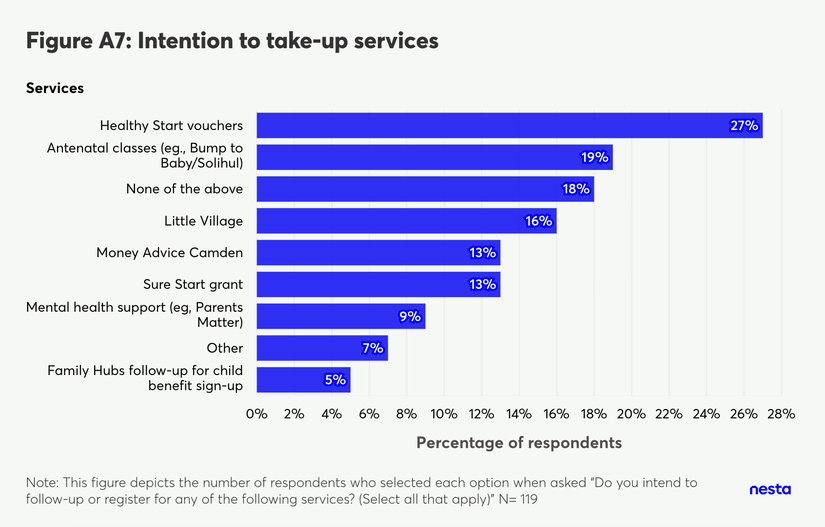
Figure A7
Image Description
A horizontal bar chart titled 'Figure A7: Intention to take-up services'. The vertical axis lists 'Services' options, and the horizontal axis measures the 'Percentage of respondents' from 0% to 28%. The blue bars show the following distribution from top to bottom: Healthy Start vouchers at 27%; Antenatal classes (eg, Bump to Baby/Solihul) at 19%; None of the above at 18%; Little Village at 16%; Money Advice Camden at 13%; Sure Start grant at 13%; Mental health support (eg, Parents Matter) at 9%; Other at 7%; and Family Hubs follow-up for child benefit sign-up at 5%. A footnote at the bottom reads 'Note: This figure depicts the number of respondents who selected each option when asked "Do you intend to follow-up or register for any of the following services? (Select all that apply)" N= 119'.
Data in this report
Data used in the pilot comes from NHS records of 20-week pregnancy scan appointments, and the council’s own benefit records. The pilot uses the LIFT platform, which helps the council to process its administrative data and target support to low-income households. See our Toolkit for more details.
Data used in the evaluation is a combination of administrative records and our own data collection. Ethical approval for the evaluation data collection activities was obtained from the UCL Institute of Education ethical review board (REC2164). Participants were informed that their decision to take part in the survey and interview would not affect their access to the Family Hubs or any other Council services.
Survey
We invited all parents who were offered the grant to complete our online survey. We invite parents by email and SMS in fortnightly batches, approximately 5 weeks after the initial grant offer, and parents are given two weeks to respond, with two reminders sent during this period. Respondents provided informed consent before beginning the interview. Respondents who complete the survey are sent a £25 gift voucher as a ‘thank you’ for their time.
The data in this report includes responses received through to 19 February 2026, for respondents who were offered the grant between April 2025 and January 2026. During this period we received 154 responses that completed all questions used in this report: 79 in the cash only condition and 75 in the Navigator condition.
Respondents had the option to select ‘prefer not to say’ for most questions. Throughout this report, percentages are calculated including all respondents who answered the question, including those who preferred not to provide an answer to a specific question, in the denominator.
Figures show percentages rounded to the nearest whole number, and therefore some figures may not sum to 100%.
Family Navigators’ call and meeting logs
Family Navigators keep records of phone calls and meetings with parents in a pre-defined format. The Data Capture Table for Navigators is available in our Toolkit. Put together, these logs allow us to view engagement pipelines for all parents who were randomised into the Family Navigator condition. In this report, we include records for any calls or meetings that occurred through to 3 February 2026, with 152 parents. Outreach was not possible to some parents in the Navigator condition because of missing or invalid contact details. Because the pilot is ongoing, the pipeline shown likely includes some ‘open’ cases - i.e. meetings and calls that are scheduled for a date after 3 February 2026.
Interviews with Family Navigators
We interviewed two Family Navigators, in December 2025 and January 2026.
Interviews with parents in pregnancy
We have interviewed 21 pregnant grant recipients to date. Interviewees were recruited through our survey, in which we asked respondents if they would be interested in an interview. Interviews were conducted over phone or video call. We obtained informed consent to record the interviews, and transcribed the interviews verbatim. Anonymised transcripts were then coded by three team members and analysed using thematic analysis.