Creative Commons
This work is licensed under the Creative Commons Attribution-Non Commercial-ShareAlike 4.0 International License. To view a copy of this license, visit http://creativecommons.org/licenses/by-nc-sa/4.0/ or send a letter to Creative Commons, PO Box 1866, Mountain View, CA 94042, USA.
Questions for the authors
Questions for the authors can be sent to:
[email protected] (Hasan Bakhshi)
[email protected] (Jonathan M. Downing)
[email protected] (Michael A. Osborne)
[email protected] (Philippe Schneider)
Suggested reference
Bakhshi, H., Downing, J., Osborne, M. and Schneider, P. (2017).
The Future of Skills: Employment in 2030. London: Pearson and Nesta.
Copyright 2017
The contents of this paper and the opinions expressed herein are those of the Authors alone.
ISBN: 978-0-992-42595-1
ABOUT PEARSON
Pearson is the world's learning company. We're experts in educational course ware and assessment, and provide teaching and learning services powered by technology. We believe that learning opens up opportunities, creating fulfilling careers and better lives. So it's our mission to help people make progress in their lives through learning.
ABOUT NESTA
Nesta is a global innovation foundation. We back new ideas to tackle the big challenges of our time, making use of our knowledge, networks, funding and skills. We work in partnership with others, including governments, businesses and charities. We are a UK charity that works all over the world, supported by a financial endowment.
To find out more visit www.nesta.org.uk.
ABOUT THE OXFORD MARTIN SCHOOL
The Oxford Martin School at the University of Oxford is a world-leading centre of pioneering research that addresses global challenges. We invest in research that cuts across disciplines to tackle a wide range of issues such as climate change, disease and inequality. We support novel, high risk and multidisciplinary projects that may not fit within conventional funding channels. We do this because breaking boundaries can produce results that could dramatically improve the wellbeing of this and future generations. We seek to make an impact by taking new approaches to global problems, through scientific and intellectual discovery, by developing policy recommendations and working with a wide range of stakeholders to translate them into action.
www.oxfordmartin.ox.ac.uk
Twitter: @oxmartinschool
Facebook: /oxfordmartinschool
ABOUT THE AUTHORS
Hasan Bakhshi leads Nesta's creative economy policy and research and data analytics. His work includes co-authoring the Next Gen skills review of the video games and visual effects industries, which led to wholesale reforms of the school ICT and computing curriculum in England, and the Manifesto for the Creative Economy, which sets out ten recommendations by which governments can help the creative economy grow. Bakhshi is a member of the Royal Economic Society Council, the Senior Management Team at the Economic Statistics Centre of Excellence (ESCOE) supported by the Office for National Statistics (ONS) and the Expert Peer Review Group for Evaluation at the Department for Business, Energy and Industrial Strategy.
Jonathan M. Downing is a DPhil (PhD) student in the Machine Learning Research Group at University of Oxford, jointly supervised by Dr. Michael Osborne and Prof. Stephen Roberts. His academic research focuses on the Bayesian non-parametric, Future of Work, and machine learning interpretability. Prior to starting his DPhil he completed a MEng Engineering Science at Keble College, University of Oxford.
Michael A Osborne is the Dyson Associate Professor in Machine Learning, a co-director of the Oxford Martin programme on Technology and Employment, an Official Fellow of Exeter College, and a co-director of the EPSRC Centre for Doctoral Training in Autonomous Intelligent Machines and Systems, all at the University of Oxford. He works to develop machine intelligence in sympathy with societal needs. His work in Machine Learning has been successfully applied in diverse contexts, from aiding the detection of planets in distant solar systems to enabling self-driving cars to determine when their maps may have changed due to roadworks. Osborne has deep interests in the broader societal consequences of machine learning and robotics, and has analysed how intelligent algorithms might soon substitute for human workers.
Philippe Schneider is an independent researcher who has collaborated extensively with Nesta as a Visiting Research Fellow and consultant since 2007. He has carried out technical and policy work for a range of private and public sector organisations, including the World Bank, BlackRock, the African Development Bank, HM Treasury, BP, CISCO, British Academy and what is now the Department for Business, Energy and Industrial Strategy where he was Advisor to the Secretary of State on innovation policy. He speaks and reads Chinese.
ACKNOWLEDGEMENTS
We thank Logan Graham for his research assistance on coding and preparation of the O*NET and employment data and to Justin Bewsher for his contributions to the sensitivity analysis. We are indebted to Harry Armstrong and Wendy L. Schultz, and to those who participated in the two foresight workshops held in Boston, Massachusetts, and in London in October 2016. We are also grateful to the attendees of a dry run workshop in London who helped us refine the workshop exercises. Thanks also to Antonio Lima, George Windsor, Juan Mateos-Garcia, Geoff Mulgan and Cath Sleeman at Nesta and Laurie Forcier, Amar Kumar, Janine Mathó, Tom Steiner, Vikki Weston and other colleagues at Pearson for their encouragement, support and valuable comments on the findings. Mark Griffiths played an important role in the inception of the study and provided valuable support throughout its implementation. Sir Michael Barber, Paolo Falco, Joshua Fleming and Carl Frey provided invaluable comments on an earlier draft of the report. We are also grateful to Rainy Kang for helping us track down data and Jessica Bland for her contributions in the early stages of the research.
EXECUTIVE SUMMARY
Recent debates about the future of jobs have mainly focused on whether or not they are at risk of automation (Arntz et. al., 2016; Frey and Osborne, 2017; McKinsey, 2017; PwC, 2017). Studies have generally minimised the potential effects of automation on job creation, and have tended to ignore other relevant trends, including globalisation, population ageing, urbanisation, and the rise of the green economy.
In this study we use a novel and comprehensive method to map out how employment is likely to change, and the implications for skills. We show both what we can expect, and where we should be uncertain. We also show likely dynamics in different parts of the labour market — from sectors like food and health to manufacturing. We find that education, health care, and wider public sector occupations are likely to grow. We also explain why some low-skilled jobs, in fields like construction and agriculture, are less likely to suffer poor labour market outcomes than has been assumed in the past.
More generally, we shine a light on the skills that are likely to be in greater demand, including interpersonal skills, higher-order cognitive skills, and systems skills. Unlike other recent studies, the method also makes it possible to predict with some confidence what kinds of new jobs may come into existence.
The study challenges the false alarmism that contributes to a culture of risk aversion and holds back technology adoption, innovation, and growth; this matters particularly to countries like the US and the UK, which already face structural productivity problems (Atkinson and Wu, 2017; Shiller, 2017).
Crucially, through the report, we point to the actions that educators, policymakers and individuals can take to better prepare themselves for the future.
OUR CONTRIBUTION
Our research introduces a novel mixed-methods approach to prediction that combines expert human judgement with machine learning, allowing us to understand more complex dependencies between job features than previously possible. We exploit this enhanced capability to assess complementarities between skills and draw out the implications for new occupations.
In addition, our analysis is grounded in an explicit consideration of the diverse and interacting sources of structural change — non-technological as well as technological — all of which are expected to have major impacts on future skills needs. Although some other studies have also sought to consider a wider range of trend influences on the future of work, these have been largely qualitative in nature.
Finally, our identification of the bundles of skills, abilities and knowledge areas that are most likely to be important in the future, as well as the skills investments that will have the greatest impact on occupational demand, provides information that educators, businesses and governments can use for strategic and policy-making purposes.
Job Features
The skills, abilities and knowledge areas that comprise occupations are collectively called features.
Structural Change
In economics, structural change is a shift or change in the basic ways a market or economy functions or operates.
OUR METHODOLOGY
Here's how our methodology works:
TRENDS ANALYSIS
We start by reviewing the drivers of change and the interactions that are expected to shape industry structures and labour markets in 2030. We also assemble detailed information about occupations (key tasks, related industries and historical growth patterns). This material is used to contextualise and inform discussions at foresight workshops in the US and UK, our countries of analysis.
FORESIGHT WORKSHOPS
At the workshops, panels of experts are presented with three sets of ten individual occupations and invited to debate the future prospects of each in light of the trends. The first set of ten occupations is chosen randomly. Participants then assign labels to the occupations according to their view of its future demand prospects (grow, stay the same, shrink), as well as their level of confidence in their responses. To sharpen prediction, an active learning method is implemented: the subsequent sets of occupations to be labelled are chosen by the algorithm. Specifically, the algorithm chooses occupations in areas of the skills space about which it is least certain, based on the previously labelled occupations. This process is repeated twice to generate a training set of 30 occupations.
MACHINE LEARNING
We subsequently use this information to train a machine learning classifier to generate predictions for all occupations. This relies on a detailed data set of 120 skills, abilities and knowledge features against which the U.S. Department of Labor's O*NET service 'scores' occupations. (We also map this data to the closest comparable UK occupations using a 'cross-walk'.) Together with the predictions about changes in occupational demand, this permits us to estimate the skills that will, by extension, most likely experience growth or decline.
ANALYSIS
We interpret the machine learning results with particular attention to the discussions from our foresight workshops, and highlight findings that are most relevant for employers, educators and policymakers.
O*NET
O*NET is the US Department of Labor's Occupational Information Network (O*NET), a free online database that contains hundreds of occupational definitions to help students, job seekers, businesses and workforce development professionals to understand today's world of work in the United States. Data from the 2016 O*NET survey was used in this study to understand the skills, abilities and knowledge areas that make up each occupation group. onetonline.org
This diagram illustrates the METHODOLOGY of the study, showing interconnected processes.
In the center, TRENDS is a circle with six radiating segments:
- INCREASING INEQUALITY
- POLITICAL UNCERTAINTY
- TECHNOLOGICAL CHANGE
- DEMOGRAPHIC CHANGE
- GLOBALISATION
- URBANISATION
- ENVIRONMENTAL SUSTAINABILITY
An arrow from TRENDS points to EXPERT INSIGHT, which is depicted by two overlapping speech bubbles.
An arrow from EXPERT INSIGHT points to MACHINE LEARNING, represented by a stylized human figure interacting with gears/data.
An arrow from MACHINE LEARNING points down to a set of small human figures, with some facing up (growth) and others down (decline), and then to an upward arrow indicating SKILLS IN DEMAND.
SKILLS IN DEMAND points to a box labeled O*NET.
O*NET then points back to the Trends section and also feeds into the Machine Learning section.
The overall flow highlights how trends inform expert insights, which are then used in machine learning to predict skills in demand, drawing on O*NET data.
KEY TRENDS
The future of work isn't only influenced by automation. Our model includes an analysis of the following key trends to determine the bigger picture of work.
ENVIRONMENTAL SUSTAINABILITY
- Climate change consensus largely intact, but with notable cracks.
- Structural changes resulting from emerging 'green economy sector' and 'green jobs', but vulnerable to political reversals.
URBANISATION
- More than half of world population lives in cities—70 percent by 2050. Cities attract high-value, knowledge-intensive industries, offer more varied employment and consumption opportunities.
- Uncertainties include fiscal policy, infrastructure investments, high public debt ratios.
INCREASING INEQUALITY
- Rise in income and wealth inequality, middle class squeeze.
- Disparities in education, healthcare, social services, consumption.
POLITICAL UNCERTAINTY
- Indices of geopolitical uncertainty have remained high since 9/11 spike.
- Mirrored by political and policy uncertainty—capacity of institutions and policymakers to act credibly and consistently.
- Uncertainty negatively affects economic activity in government-influenced sectors, such as defence, finance, construction, engineering, and healthcare.
TECHNOLOGICAL CHANGE
- Perennial fears about impact of automation on employment.
- Estimates of future automation impact range, from 47% of US employment at risk to only 9%.
- Conversely, technology amplifies human performance in some occupations—and gives rise to entirely new occupations and sectors.
GLOBALISATION
- Global labour markets increasingly integrated.
- Benefits (e.g., advanced manufacturing, knowledge-intensive services) and costs (e.g., employment and wage impacts, trade deficits, legacy manufacturing).
- Post-financial crisis headwinds (e.g., sluggish world trade growth, rising protectionism).
DEMOGRAPHIC CHANGE
- Pressures to control age-related entitlements vs. investments in education, R&D, infrastructure.
- Ripple effects through healthcare, finance, housing, education, recreation.
- Rising Millennial generation, with divergent consumption and work behaviours.
OUR FINDINGS
THE FUTURE DEMAND FOR OCCUPATIONS
We predict that around one-tenth of the workforce are in occupations that are likely to grow as a percentage of the workforce. Around one-fifth are in occupations that will likely shrink. This latter figure is much lower than recent studies of automation have suggested.
This means that roughly seven in ten people are currently in jobs where we simply cannot know for certain what will happen. However, our findings about skills suggest that occupation redesign coupled with workforce retraining could promote growth in these occupations.
A key element of the study is quantifying the extent of uncertainty about likely future trends. These uncertainties reflect the challenging task of balancing all the macro trends that might influence the future of work. Further uncertainties stem from the distinction between occupations that are expected to grow in demand (reflecting wider occupation growth) from those that will grow relative to other occupations. This distinction turns out to be important because our US and UK expert groups predict as a whole that the workforce will continue to grow through 2030.
The uncertainty in our findings also reflects our use of the richest possible data set of occupation-related 'features'—that is, the skills, abilities and knowledge areas required for each occupation. (This use of all 120 O*NET features is an important differentiator of our study. For example, the most recent study by Frey and Osborne (2017) uses only nine skills categories.) This detailed characterisation of occupations renders them less similar to one another, thereby limiting the confidence of our model in making predictions for one occupation based on what has been labelled for another. In exchange, however, we are able to develop a far more nuanced understanding of future skills demand, as noted below.
We find that many of the jobs likely to experience a fall in employment are, unsurprisingly, low- or medium-skilled in nature. However, in challenge to some other studies, not all low- and medium-skilled jobs are likely to face the same fate.
Technological change and globalisation may account for why many low- or middle-skilled occupations (e.g., manufacturing production) are expected to become less important in the workforce. The predicted decline in administrative, secretarial and some sales occupations is also consistent with these trends. Agriculture, skilled trades and construction occupations, however, exhibit more heterogeneous patterns, suggesting that there may be pockets of opportunity throughout the skills ladder.
The results also suggest that non-tradable services, like food preparation, elementary services and hospitality will all likely grow in importance. Many of these occupations, again, have lower skills requirements. However, they are associated with differentiated products, which consumers increasingly value.
This indicates that these occupations may be ripe for job redesign and employee skills upgrading to emphasise further product variety, a development heralded by the re-emergence of artisanal employment in occupations like barbering, brewing and textiles.
In general, public sector occupations—with some exceptions—feature prominently and are predicted to see growth.
In the UK, education, healthcare and wider public sector occupations are, with some confidence, predicted to see growth. These findings are consistent with population ageing and a greater appetite for lifelong learning. They are also consistent with the labour intensive nature of these sectors, and their traditionally lower potential for productivity growth (Baumol and Bowen, 1966). They are further consistent with the view that public sector roles are more resistant to automation (Acemoglu and Restrepo, 2017a).
Similar patterns are evident in the US, though with some interesting differences. Notably, confidence in the future growth of healthcare occupations is lower than we might expect, perhaps reflecting uncertainties related to healthcare policy and spending. However, consistent with the UK results, growth is anticipated for occupations such as sports and fitness, as well as for therapy. These which are arguably redefining healthcare, a phenomenon partly attributable to the preferences and consumption behaviour of Millennials.
Manufacturing Production
Manufacturing production occupations require one to set up, test and adjust manufacturing machinery or equipment, using any combination of electrical, electronic, mechanical, hydraulic, pneumatic or computer technologies.
Skilled Trades
In the UK, skilled trades include jobs in agriculture, metalwork, construction, textiles, food preparation, hospitality and woodworking, among others.
Elementary Services
In the UK, elementary occupations consist of simple and routine tasks which mainly require the use of hand-held tools and often some physical effort (e.g., farm workers, street cleaners, shelf fillers).
We also expect buoyant demand for some — but not all — professional occupations, reflecting the continued growth of service industries.
Creative, digital, design and engineering occupations have bright outlooks and are strongly complemented by digital technology. Furthermore, architectural and green occupations are expected to benefit from greater urbanisation and a greater interest in environmental sustainability.
Interestingly, demand prospects can vary considerably for some 'white collar' occupations that otherwise appear very similar. In the US, roles such as management analysts, training and development specialists and labour relations specialists — occupations which should benefit from the reorganisation of work — are projected to grow in the workforce, whereas financial specialists are expected to fall. The latter is consistent with automation having an impact on cognitively-advanced occupations as well as more routine roles.
Additionally, although there is a predicted decline in many sales occupations, consistent with an expansion in digital commerce, niche roles like sales engineers and real estate agents may buck this trend.
THE FUTURE DEMAND FOR SKILLS*
Our results provide broad support for policy and practitioner interest in so-called 21st century skills in both the US and the UK.
We find a strong emphasis on interpersonal skills, higher-order cognitive skills and systems skills in both the US and the UK.
In the US, there is particularly strong emphasis on interpersonal skills. These skills include teaching, social perceptiveness and coordination, as well as related knowledge, such as psychology and anthropology. This is consistent with the literature on the growing importance of social skills in the labour market (Deming, 2015). There are good reasons to believe that interpersonal skills will continue to grow in importance — not only as organisations seek to reduce the costs of coordination but also as they negotiate the cultural context in which globalisation and the spread of digital technology are taking place (Tett, 2017).
Our findings also confirm the importance of higher-order cognitive skills such as originality, fluency of ideas and active learning.
A similar picture emerges for the UK. The results point to a particularly strong relationship between higher-order cognitive skills and future occupational demand. Skills related to system thinking — the ability to recognise, understand and act on interconnections and feedback loops in sociotechnical systems — such as judgement and decision making, systems analysis and systems evaluation also feature prominently.
We show that the future workforce will need broad-based knowledge in addition to the more specialised features that will be needed for specific occupations.
Broad-based knowledge areas such as English language, history, philosophy and administration and management are all associated strongly with occupations projected to see a rise in workforce share.
Sales Engineers
A sales engineer is a salesperson with technical knowledge of the goods and their market.
Active Learning
Understanding the implications of new information for both current and future problem-solving and decision-making.
Fluency of Ideas
The ability to come up with a number of ideas about a topic (the number of ideas is important, not their quality, correctness, or creativity).
Sociotechnical Systems
The term sociotechnical system refers to interaction between society's complex infrastructures and human behaviour. It can also be used to describe the relationship between humans and technology in the workplace.
Systems Analysis
Determining how a system should work and how changes in conditions, operations and the environment will affect outcomes.
Systems Evaluation
Identifying measures or indicators of system performance and the actions needed to improve or correct performance, relative to the goals of the system.
*A Glossary of Skills laying out the precise definitions of all 120 O*NET skills, knowledge areas and abilities can be accessed at futureskills.pearson.com.
Other knowledge features like foreign languages are especially valuable as complements: that is, they find use in specialised occupations when other features have a large value. We find a similar pattern for a number of STEM-related features like science, technology design and operations analysis. Interestingly these features are found to be complementary to conventional STEM occupations, as well as to some non-STEM occupations such as secretarial and administrative jobs.
UNCOVERING SKILL COMPLEMENTARITIES
Occupations and their skills requirements are not set in stone: they are also capable of adjusting to shifts in the economic environment (Becker and Muendler, 2015). Our model identifies how the skill content of occupations can be varied to improve the odds that they will be in higher demand. As noted above, we define these as 'complementary skills' in so far as their impact on demand is conditional on the other skills that make up the occupation. The notion of complementarity can be used to determine priorities for skills investment and assist thinking on how jobs might be redesigned to put these skills to work.
Complementary skills that are most frequently associated with higher demand are customer and personal service, judgement and decision making, technology design, fluency of ideas, science and operations analysis.
In the US, customer and personal service, technology design and science skills are, according to our analysis, the job performance requirements seen as most likely to boost an occupation's demand beyond what is currently predicted, notwithstanding notable differences across occupation groups.
Take production occupations, for example, which our analysis shows are very likely to see a fall in the workforce. Our model suggests that increasing understanding of customer and personal service, technology design and installation will have the greatest positive impact on the future demand for these occupations, stemming the decline that they are otherwise projected to experience.
In the UK, it turns out that strengthening judgement and decision-making skills, fluency of ideas and operations analysis are important demand complements for many occupations. The literature underlines the need to match these skills with changes in organisational design, such as enhanced delegation, employee involvement in decision making and other related high-performance work practices in order to maximise their impact (Ben-Ner and Jones, 1995; Kruse et al., 2004; Lazear and Shaw, 2007).
ANTICIPATING NEW OCCUPATIONS
An attraction of our approach is that it can be used to consider occupations that do not yet exist, but may emerge in the future in response to the identified drivers of change. The model allows us to identify hypothetical occupations, dissimilar to existing occupations, that are 'almost certain' to see future growth. In particular, we can identify the combinations of skills, knowledge areas and abilities that are most associated with such new occupations.
For the US, the model finds four such hypothetical occupations, along with their top five ranking features. We are able to further understand something about these hypothetical occupations by looking at the existing occupations that are 'closest to them' and inspecting their historical growth.
For the UK, two new hypothetical occupations are discovered by the model, along with their top five ranking features. We again consider the occupations that are closest to these and confirm their past growth.
Operations Analysis
Analysing needs and product requirements to create a design.
Production Occupations
The production occupations is used in the U.S. and covers machinists, operators, assemblers, and the like across a wide variety of industries (e.g., nuclear power, gas and oil, food preparation, textiles).
Conclusion
Jobs are the cornerstone of our economic and social lives: they give people meaning, self-respect, income and the chance to make societal contributions (Banerjee and Duflo, 2008; World Bank, 2013; Taylor, 2017). Today, there are concerns that this relationship is under strain as structural change once again disrupts employment levels and occupational patterns. Our analysis provides grounds for optimism in this respect: far from being doomed by technology and other trends, we find that many occupations have bright or open-ended employment prospects. More importantly, we illustrate for different US and UK occupations, how the skills mix of the workforce can be upgraded to target such new opportunities. This, however, requires individuals, educators, businesses and policymakers to respond appropriately. History is a reminder that investments in skills must be at the centre of any long-term strategy for adjusting to structural change. A precondition for this is access to good information on skills needs — without which policymakers risk flying blind. We hope this report is a step towards improving understanding of this vital agenda.
1. Introduction
Governing is the art of planning and predicting. Developing a picture of long-term jobs and skills requirements is critical for policymakers as they navigate rapid, complex and uncertain shifts in the economy and society. A wide range of areas from curriculum development and careers guidance through apprenticeships and workplace training to occupational standards, migration and social insurance - rely on the availability of accurate labour market information (LMI). It is a basic precondition for the system resilience of modern economies - the collective ability of individuals, education and labour market institutions to adapt to change without breaking down or requiring excessively costly intervention to remedy.
However, there is also an awareness of the divergence between the pace of change and the inertia of our institutions. Andreas Schleicher, Director for Education and Skills at the Organisation for Economic Co-operation and Development (OECD), has pointed out that throughout history, education has always taken time to catch up with technological progress (Schleicher, 2015). In the UK, the Education Act of 1902, which marked the consolidation of a national education system and the creation of a publicly supported secondary school system, arrived a century after the Industrial Revolution and the growing complementarity between human and physical capital (Galor and Moav, 2006; Becker et al., 2009).
Today, educationalists speak about a '40-year gap' between experts who are exploring where the world of work and the state of learning will need to be in 15 years' time, practitioners in the trenches and parents, whose conception of 'good' education is framed by their own earlier experiences. The result is a structure that resembles sedimentary rock: each layer has its own assumptions and expectations. But there is little holding the layers together, and once in place, they can limit policy change and future choices.
Structural change is affecting labour markets, as it is all markets, upsetting the balance of supply and demand for skills. While misalignment is normal over the business cycle, the costs of persistent mismatches can be considerable if left unaddressed: they limit the ability of firms to innovate and adopt new technologies, while impeding the reallocation of labour from less productive activities to more productive ones (Adalet McGowan and Andrews, 2015). They also lead to increased labour costs, lost production associated with vacancies remaining unfilled and all the direct and indirect costs of higher unemployment (Şahin et al., 2014; OECD, 2016b). Individuals likewise pay a heavy price. They benefit from economic growth mainly through jobs. Not only are jobs typically the most important determinant of earnings and living standards. They also critically shape how individuals view themselves, interact with others and perceive their stake in society, including their sense of control over the future (Banerjee and Duflo, 2008; World Bank, 2013).
The jury is out on the scale of long-term skills shortages in the labour markets of advanced economies. Much of the evidence comes from employers, typically from surveys. ManpowerGroup, the human resources company that publishes arguably the most authoritative survey on skills shortages, finds that globally 40% of employers have difficulty filling jobs. This figure has been largely stable over the past decade, although considerable differences exist across countries: while shortage levels in the US have tracked the global average, they are significantly lower in the UK but appear to be growing (ManpowerGroup, 2016).
The reliability and validity of employer surveys, however, are open to question (Cappelli, 2015). The empirical fingerprints for skills shortages are not where we would expect them to be - namely in wage inflation not linked to productivity growth. On the contrary, labour's share in national income has trended downwards in most economies since the 1990s (International Monetary Fund (IMF), 2017). Academic studies examining the issue have also failed to uncover significant shortages (Weaver and Osterman, 2017). Where they exist, they are often attributed to the unwillingness of employers to offer attractive remuneration to workers, suggesting that interventions that treat the problem as an educational one are likely to be poorly targeted (Van Rens, 2015).
Saying that skills shortages are overstated is not the same as saying that they are unfounded. They are notoriously difficult to measure, hidden from view as companies work around problems by increasing the workload of existing employees, outsourcing work to other organisations or even adapting their product market strategies so that they are less dependent on a highly skilled workforce.
2. Literature Review
2.1. Anticipating Occupations and Skills
This report builds on the growing use of skills assessment and anticipation exercises (European Centre for the Development of Vocational Training (CEDEFOP), 2008; OECD, 2016a). Such endeavours have a long history, dating back to the 1960s. Improvements in the coverage, quality and timeliness of data and analytical tools have expanded the scope of activity, though there remain bottlenecks to the integration of public and privately held data (Mitchell and Brynjolfsson, 2017). Today, approaches look 10, 30 and even 100 years into the future, incorporating elements of structural foresight analysis such as the Delphi method and scenario development (OECD, 2012).
The ability to link occupation-based information to specific skills through databases such as the US Department of Labor's O*NET, or those aggregating online job advertisements in real time, has enabled policymakers to get a direct handle on skills needs. In the past, assessing these needs has been more difficult due to problems in definition, classification and measurement.
The common presumption underlying these efforts is that predicting occupational and skills demand over long horizons is feasible. This confidence may seem puzzling at a time when economic and business forecasting has been heavily criticised, following a string of errors before and after the 2008 financial crisis which have contributed to a groundswell of anti-expert opinion.
The dividing line between what is a 'good' and 'bad' forecast, however, is not straightforward (Broadbent, 2013; Chadha, 2017). For some, the value of a forecast lies in the questions it asks as much as the answers it provides: the stories revealed by errors can sharpen understanding of uncertain relationships between economic variables and support learning. In other cases, the size and direction of errors may matter more than some exogenous measure of forecast accuracy.
More prosaically, prediction is better suited to some areas of human activity than others. There tends to be a high degree of persistence, and thus predictability, in the occupational and skills make-up of the workforce. This reflects the fact that the labour market is a social institution embedded in a dense web of rules, habits and conventions and that there are substantial employment adjustment costs, even in the face of major changes such as the arrival of new and disruptive technologies (Pierson, 2004; Granovetter, 2017).
This pattern is not unique or even unusual historically. Thus some observers point to the fitful progress of electrification in the US, where labour productivity grew slowly between 1890 and 1915, then saw a decade-long acceleration, only to slow down in the mid-1920s, before experiencing a second boom in the 1930s (Syverson, 2013). The unprofitability of replacing still viable manufacturing plants adapted to water and steam power; the slow gestation of complementary innovations such as the electrical grid, unit drive transmission and hydroelectricity; the challenges of reconfiguring organisational processes, workforce skills and factory design to exploit electricity's potential and political barriers from municipal and town governments which restricted the flow of investment capital into utilities - these features all underscore the lags between the emergence of new technologies and their impact on productivity and the structure of employment (David, 1990; David and Wright, 1999).
Parallels between the labour market consequences of skills-augmenting technological change today and previous episodes of technological change, however, are limited in one respect. Despite the perception of rapid technological change associated with Information and Communication Technologies (ICT), the transition from manufacturing to service and knowledge-intensive jobs has been remarkably gradual, stretching over decades (Baraby and Siegel, 2017). Notably it has been more protracted than the transition from agricultural to manufacturing employment which accompanied electrification and industrialisation (Handel, 2012, 2016; Atkinson and Wu, 2017). This is consistent with evidence suggesting that the rate of job creation in new technology industries has in fact slowed over recent decades (Lin, 2011; Frey and Berger, 2016).
A satisfactory explanation for these developments lies outside the scope of this report, but at least part of it can be explained by: a decline in labour market fluidity associated with the ageing of the population; an increase in the share of the workforce with a college or university degree in so far as workers with degrees typically have more stable employment than workers without degrees; and a shift towards older and larger firms that contract and expand less rapidly than other firms (Hyatt and Spletzer, 2013; Davis and Haltiwanger, 2014). These elements combine to impart an additional degree of continuity on the economic environment, enabling prediction.
A more refined way of reaching the same conclusion is to compare the performance of long-term occupational projections against outcomes. One evaluation of US Bureau of Labor Statistics (BLS) 10-year projections at the one-digit level for the period 1988-2008 finds that they do a good job of anticipating the size of broad occupations (absolute error < 6%), with the exception of service and farm workers (Handel, 2016). In addition to path dependence in occupational structure, this performance is attributable to the fact that errors at a more detailed occupational level cancel out one another. Consistent with this, forecast errors are found to be inversely related to employment size: occupations with more than 600,000 workers have an average absolute error of 14.8% compared with 32.7% for occupations with between 25,000 and 49,000 workers. This suggests that, even in the presence of significant errors with respect to the size of individual occupations, this should not be an obstacle to prediction where the goal is to make more general statements about occupational and skills demand.
The BLS's projections are not exempt from criticism - most of which is focussed on their tendency to underestimate changes in the size of occupations (Alpert and Auyer, 2003; Carnevale et al., 2010; Wyatt, 2010). This largely reflects the challenges of applying fine-tuned rules and making point estimates when there are high levels of uncertainty. By extension, anticipating the direction of change - whether an occupation will grow or decline in relative or absolute terms - appears to pose fewer issues for the same reasons. As a coarser assessment, it requires less information about future states of the world and thus is more robust to ignorance.
Studies have similarly shown that ignoring some information can make not only for cheaper but also for more accurate decisions in such circumstances (Gigerenzer, 2010). We share this perspective and accordingly produce directional forecasts in this study.
Other sources of error are more problematic. They are embodied and variously popularised in 'weak signals' and 'black swans' - shifts that are difficult to observe amid the noise, yet whose consequences are potentially transformative. They resemble George Shackle's description of the future "which waits, not for its contents to be discovered, but for that content to be originated" (Shackle, 1972). Quantitative approaches which assume that past patterns of behaviour will continue over the longer term struggle badly with these shifts. Even when their significance is acknowledged, in many cases they are ignored on the grounds that they are too unruly to analyse. Whether this is an adequate defence is debatable. Policymakers have no alternative but to grapple with all possible discontinuities and plan accordingly. If planning is silent about discontinuities, its value is reduced. For this reason, many organisations have found qualitative foresight processes linked to strategic dialogue a useful lens through which to interrogate these matters. However, they are no panacea to the shortcomings of prediction: subjective judgments often lack external validity and transparency, meaning that decision-makers are not always sure if and how they should act on them.
Still, foresight processes have the potential to broaden thinking about alternatives beyond business-as-usual and their implications. By enabling deliberation and challenging individually held beliefs, these processes can also combat the types of bias that may creep into long-term, expert-led planning (Tichy, 2004; Goodwin and Wright, 2010; Kahneman, 2011; Ecken et al., 2011; Nemet et al., 2016): overconfidence (overweighting private information and underweighting public information); optimism (exaggerating the rate of change, especially for new technologies); familiarity (relating new experiences to previously seen ones); and narrative fallacy (creating explanations for phenomena which are essentially unconnected). Accordingly, we adopt an integrated approach which combines and builds on both quantitative and qualitative approaches.
2.2. Changing Skills Needs
This report relates to the literature on the changing demand for skills. Conventional wisdom views such change as a product of the complementarity between technology and high-skilled labour. That is, technological progress raises the demand for skills, and investment in skills, in turn, satiates that demand. This framework has proven a workhorse for economists and can successfully explain many salient changes over time in the distribution of earnings and employment across advanced economies (Goldin and Katz, 2009).
Nonetheless, its implementation rests on a highly aggregated and conceptually vague measure of skill, typically years of schooling. Recent accounts have sought to put more meat on its bones by mapping skills to the tasks performed by labour (Acemoglu and Autor, 2011). Influential work by Autor and Murnane (2003), for example, distinguishes between cognitive and manual tasks on the one hand, and routine and non-routine tasks on the other. Comparing tasks over time, from 1960 to 1998, they find that routine cognitive and manual tasks declined while non-routine cognitive and manual tasks grew in importance. Extending this study, Levy and Murnane (2004) attribute the growth of non-routine cognitive tasks to jobs requiring skills in expert thinking and complex communication. Similar frameworks have been used in the trade literature, especially in the context of outsourcing and offshoring and also to understand the emergence of new occupations such as green jobs (Consoli et al., 2016).
A growing body of work also underscores the role of 'non-cognitive' skills, including social skills and leadership skills. This derives from the pivotal insight of Heckman (1995) that labour market outcomes such as earnings are likely shaped by an array of skills insofar as measured cognitive ability accounts for only a small portion of the variation in such outcomes (Heckman and Kautz, 2012). Deming (2015) finds that, in the US, nearly all job growth since 1980 has been in occupations that are relatively social-skill intensive.
Strikingly, occupations with high analytical but low social skill requirements shrank over the same period. One possible explanation is that social skills provide the tools for the rich and versatile coordination which underpins a productive workplace - the subtleties of which computers have yet to master. This matters for organisations in complex environments where the classic gains from specialisation are eclipsed by the need to adapt flexibly to changing circumstances (Dessein and Santos, 2006).
Measures of social intelligence have also been validated by psychologists and neuroscientists (Poropat, 2009; Woolley et al., 2010). Indeed, more recent thinking rejects the contrast between cognitive and non-cognitive skills. Whereas reason is widely viewed as a path to greater knowledge and better decision-making, some argue that it is much more diverse and opportunistic - that it has evolved primarily to help humans justify themselves and influence others, which is indispensable for communication and cooperation. Patterns of thinking that appear 'irrational' from a purely cognitive perspective turn out to be advantageous when seen as adaptive responses to the dilemmas of social interaction (Mercier and Sperber, 2017).
Unencumbered by analytical tractability, policymakers have embraced a still wider understanding of skills. Over the past two decades there has been considerable thinking and advocacy - both nationally and internationally - focussed on embedding so-called '21st century skills' into education systems. The policy literature uses a range of overlapping concepts, taxonomies, definitions and technical language, but at their core, skills are viewed as encompassing the full panoply of cognitive, intrapersonal and interpersonal competencies (National Research Council, 2012; Reimers and Chung, 2016).
We are only aware of a handful of academic studies that view skills in these broad terms: for example, Liu and Grusky (2013) develop an eight-factor representation of workplace skills, though they focus on returns to skills that reflect changes in relative supply as much as demand. MacCrory et al. (2014) perform principal component analysis on abilities, work activities and skills in O*NET to identify five to seven distinct skills categories that have discriminatory power in terms of explaining changes in the skills content of occupations over the past decade.
We extend this body of work - in part by also drawing on the knowledge features in O*NET which provide information on the specific academic subjects and domain knowledge required by occupations. One advantage of the O*NET knowledge features is that they are expressed in relatively natural units which make them easier to understand and address through policy. They also touch on the knowledge versus skills debate in education circles between proponents who argue that curriculum and pedagogy should teach transferable-skills - the ability to work in teams, to create and think critically - and those who contend that skills need to be rigorously grounded in a base of knowledge in order to be mastered (Christodoulou, 2014; Hirsch, 2016).
2.3. Labour Markets and Structural Change
This report also addresses work on the employment effects of automation and structural change more generally. The rise of robots, artificial intelligence, big data and the internet of things have raised concerns about the widespread substitution of machines for labour. Evidence linking automation of many low-skilled and medium-skilled occupations to wage inequality, labour market polarisation and the ongoing decline in manufacturing jobs is interpreted as support for the claim that workers are falling behind in the race against machines (Autor et al., 2006, 2008; Black and Spitz-Oener, 2010; Dustmann et al., 2009; Goos and Manning, 2007; Michaels et al., 2009; Spitz-Oener, 2006).
Technological anxiety is not a new phenomenon (Keynes, 1930; Bix, 2000; Mokyr et al., 2015). Similar fears have been expressed before: during the Industrial Revolution, the latter part of the 1930s, and again immediately after World War II. Each time adjustment was disruptively painful for some workers and industries; but in the long run, such fears were not realised. The employment-to-population ratio grew during most of the 19th and 20th centuries in the UK and US, even as the economy experienced the effects of mechanisation, the taming of electricity, the invention of the automobile and the spread of mass communication.
History cannot settle whether this time is different: what is striking about the perspectives of earlier observers is how narrowly they defined the scope of what technology could accomplish. Earlier generations of machines were limited to manual and cognitive routine activities, based on well-defined, repetitive procedures. The newest technology, by contrast, is mimicing the human body and mind in increasingly subtle ways, encroaching on many non-routine activities, from legal writing and truck driving to medical diagnoses and security guarding.
The case of driverless cars illustrates the slippery and shifting definitional boundary around what it means for work to be 'routine'. In their seminal 2004 book The New Division of Labor: How Computers Are Creating the Next Job Market, Levy and Murnane (2004) argued that driving in traffic, insofar as it is reliant on human perception, fundamentally resisted automation: "Executing a left turn against oncoming traffic involves so many factors that it is hard to imagine discovering the set of rules that can replicate a driver's behaviour [...]". Formidable technical challenges lie ahead: the prospect of fleets of cars that can roam across cities or countries in all conditions without human input remains remote (Simonite, 2016; Mims, 2016). Nonetheless, elements of this problem are now satisfactorily understood and can be specified in computer code and automated. For example, Google's driverless cars have driven over 2 million miles in the past six years, and have been involved in 16 minor accidents, none of which caused injury or was the car's fault (Bank of America Merrill Lynch, 2017).
A more forward-looking approach can help guard against these pitfalls. This is exemplified by Frey and Osborne (2017), who assess the feasibility of automating existing jobs assuming that new technologies are implemented across industries on a larger scale. In this study, a sample of occupations was hand-labelled by machine-learning experts as strictly automatable or not automatable. Using a standardised set of nine O*NET features of an occupation that measure three bottlenecks to automation - perception and manipulation, creative intelligence, and social intelligence - they then ran a classifier algorithm to generate a 'probability of computerisation' across all jobs, estimating that over two decades, 47% of US workers' jobs are at a high risk of automation.
This finding has not gone unchallenged. MacCrory et al. (2014) point out that a handful of variables cannot capture the diverse economic impact of technological change on skills, especially across the whole gamut of occupations in the labour market. Arntz et al. (2016) observe that, within an occupation, many workers specialise in tasks that cannot be automated. Using the automation probabilities from the Frey and Osborne study and drawing on the Survey of Adult Skills by the Programme for the International Assessment of Adult Competencies (PIAAC) that examines task structures for individuals across more than 20 OECD countries, they argue that once task variation is taken into account, a much smaller proportion of jobs (= 9%) are at risk of being completely displaced. They also find important differences across countries that are attributed to variations in workplace organisation, adoption of new technologies and educational levels.
The McKinsey Global Institute (2017) disaggregates occupations into 2,000 constituent activities, rating each against 18 human capabilities and the extent to which they can be substituted by machines. It estimates that 49% of work activities globally have the potential to be automated, though very few occupations - less than 5% - are candidates for full automation (see also Brandes and Wattenhofer, 2016).
While these studies confirm the importance of considering the automatability at the task level, this approach raises its own challenges. In principle, there is nothing in an occupation-based approach that prevents analysts from considering its constituent tasks when evaluating the potential for automation. There are also drawbacks with a strictly bottom-up approach in the context of anticipating occupational and skills demand. In isolation, one might reasonably infer that similar tasks, such as sales, have similar levels of demand. But as part of an occupation, they also belong to different industries with different growth prospects and require different knowledge connected to the product, or the buyers of the product (for instance, consider an insurance sales agent vs. a solar equipment sales representative). By emphasising discrete tasks, there is a risk of losing important coordinating information which gives occupations their coherence - the fabric which distinguishes the whole from the parts.
Practically, unbundling occupations may come at the expense of quality. Autor (2013) counters the simple view popular in some parts of the automation debate - that jobs can be 'redefined' as machines perform routine tasks and workers perform the rest: "Consider the commonplace frustration calling a software firm for technical support only to discover that the support technician knows nothing more than what is on his or her computer screen - that is, the technician is a mouthpiece, not a problem solver. This example captures one feasible division of labor: machines performing routine technical tasks, such as looking up known issues in a support database, and workers performing the manual task of making polite conversation while reading aloud from a script. But this is not generally a productive form of work organization because it fails to harness the complementarities between technical and interpersonal skills".
A limitation of all these studies is that they only estimate which occupations are potentially automatable - not how many will actually be automated. As discussed earlier, the journey from technical feasibility to full adoption can take decades involving many steps and missteps. Just as significantly they do not assess the potential for job creation in tasks and occupations complemented by automation or the adjustments that are triggered in other parts of the economy through relative wage changes and other market forces (Shah et al., 2011; Davenport and Kirby, 2016; Kasparov, 2017).
The effect of fleshing out these dynamics is to substantially muddy and possibly reverse more pessimistic conclusions. Gregory et al. (2016) develop a task-based framework, estimating that automation boosted net labour demand across Europe by up to 11.6 million jobs over the period 1990-2010. They identify a number of channels that potentially compensate for the job-destroying effects of automation, including first, that automation may lead to lower unit costs and prices which stimulate higher demand for products, and, second, that surplus income from innovation can be converted into additional spending, so generating demand for extra jobs in more automation-resistant sectors (see also Goos et al., 2015).
However, a number of strong assumptions are necessary for this result - notably that additional firm profits are spent locally in Europe when in fact they may accrue to non-European shareholders. Relaxing this assumption results in significantly lower estimates, although they are still positive (1.9 million jobs). This finding has particular relevance to debates about 'who owns the capital' and the case for spreading ownership of robot capital through profit-sharing programmes and employee stock-ownership plans (Freeman, 2015).
Acemoglu and Restrepo (2017a) report contrasting results. They explore the impact of the increase in industrial robot usage between 1990 and 2007 on US local labour markets. To identify causality, they use industry-level spread of robots in other advanced economies as an instrument for robot usage in the US. This strategy helps isolate the change in exposure to robots from other organisational or industry developments that may also be correlated with robot usage and influence subsequent labour demand. They find that each additional robot reduces employment by about seven workers, with limited evidence of offsetting employment gains in other industries.
This finding is robust to a range of different specifications, tests and controls, such as demographic and industry characteristics, share of routine jobs, import competition from China and overall capital utilisation. Excluding the automobile industry, the heaviest user of robots, the introduction of robots does not change results when the localities most affected by robots had similar employment and wage levels to other localities which is to say they were not on a downhill path before robotisation.
Although Acemoglu and Restrepo's study (2017a) is an important step for understanding the dynamic employment effects of automation, it is far from the final word: in the main, it does not address the global effects of automation which are important given rich patterns of trade, migration and specialisation across local markets. Also, with the robot revolution still in its infancy, short-term consequences may differ from the long-term ones, once relative prices and investment have had time to fully adjust. Evidence of diminishing marginal returns to robot usage documented by Graetz and Michaels (2015) is consistent with such a view.
The need to recognise the interactions embedded in trends carries across into other spheres. Parallel to automation is a set of broader demographic, economic and geopolitical trends which not only have profound implications for labour markets, but are raising challenges for policy in their own right. In some cases, trends are reinforcing one another; in others, they are producing second-order effects which may be missed when viewed in isolation. Consider, for example, the implications of an ageing population. While much of the automation debate has focussed on the potential for mass unemployment, it overlooks the fact that robots may be required to maintain economic growth in response to lower labour force participation. The risk, in other words, is not that there will be too few jobs but that there will be too few people to fill them - bidding up wages in the process which may explain why countries undergoing more rapid population ageing tend to adopt more robots (Acemoglu and Restrepo, 2017b; Abeliansky and Prettner, 2017). We provide an overview of the trends in the following display, and a description of how the trends analysis fits in with our wider approach in Section 3.
The future of work - understood in its widest sense - has been climbing the policy agenda. The topic has featured on the covers of the popular press; major organisations, think tanks and consultancies have hosted conferences on the subject and it has generated a flurry of reports and studies (PwC, 2016; UK Commission for Employment and Skills, 2014; Beblavý et al., 2015; World Economic Forum (WEF), 2016; Hajkowicz et al., 2016; Canadian Scholarship Trust (CST), 2017). These efforts mirror our approach insofar as they assess the multiple trends affecting the employment and skills landscape. However, there is an important respect in which their treatment of the trends differs: in addition to being qualitative in nature, many use scenario techniques to weave trends into a set of internally coherent and distinct narratives about the future. This approach brings order and depth to conversations, though it also has drawbacks. Because scenarios are typically taken as given, assumptions about how change takes place and trends interact are often opaque. This makes it difficult to explain why one set of scenarios has been selected from among the infinite number that are possible, which has the impact of shutting off outcomes which might otherwise emerge if these dynamics were explicitly accounted for (Miller, 2006).
Overview of the Trends
Technological Change
Greater connectivity and improvements in computing power and artificial intelligence are enabling 'intelligence' to be embedded more cheaply and readily in physical systems - from entire cities right down to the individual human body. With peer-to-peer platforms, activities are amenable to decentralised production, unlocking previously unused or underused assets - in the process muddying traditional definitions of ownership and employment. Additive manufacturing and 3D printing could alter the economics of many industries, cutting the costs of on-demand production.
Material and life sciences have seen major breakthroughs in areas such as graphene and gene-editing with potentially radical applications. However, many must contend with a long road to commercialisation and significant barriers to adoption, especially ethical and safety concerns.
There remains an unresolved tension between the seeming ubiquity of digital technology and a downshift in measured productivity growth. Evidence from a wide range of industries, products and firms also suggests that research effort is rising steeply while research productivity is falling sharply - that is, more and more resources are being allocated to R&D in order to maintain constant growth.
History shows that technology optimism can slide into determinism, though there is a mirror image of this logic: people tend to underestimate the huge effects of technology over the long term. The general pattern of technological progress has been one of multiple lulls, followed by subsequent surges of creativity. For instance, new materials and processes, leveraging digital tools that allow improved real-time measurement, experimentation and replication, are inherently complementary such that advances in one domain may feed back into new technologies in a virtuous cycle.
Globalisation
Over the past three decades, labour markets around the world have become increasingly integrated. The emergence of countries like China and India, for centuries economic underperformers, has delivered an immense supply shock to traditional patterns of trade.
Globalisation has not only had benefits but also costs. Employment and wages have typically fallen in industries more exposed to import competition, exacerbated by labour market frictions and social and financial commitments such as home ownership, which limit workers' ability to relocate and take advantage of employment opportunities. US and UK exports to other countries have not grown as much as imports, though large trade deficits have not reduced jobs so much as redistributed them towards non-tradables, particularly construction.
The manufacturing sector has been a lightning rod for these changes, though the experience has not been uniform, containing pockets of activity that have thrived - whether because the gains from keeping production at home remain critical or head-to-head competition with emerging economies is limited. Combined with eroding cost advantages among competitors and new technologies, including breakthroughs in shale oil extraction, these conditions could support modest forms of reshoring.
As the economic centre of gravity shifts towards the emerging world, supported by a burgeoning middle class, so opportunities may open up in areas such as knowledge-intensive services and advanced manufacturing where UK and US exporters enjoy a comparative advantage.
However, a number of developments may frustrate this trend. Services are still substantially less likely to be traded than manufactured products due to the prevalence of non-tariff barriers. Emerging markets face various obstacles in sustaining their historic growth rates, ranging from the prospect of premature deindustrialisation to the task of building high-quality institutions.
Sluggish world trade growth since the financial crisis and stiffening protectionist sentiment have challenged the decades-old rule of thumb that trade grows faster than GDP, raising concerns that globalisation has structurally 'peaked'.
Demographic Change
There is an obvious appeal to basing predictions on population growth and changes to the composition of the population: given long-term historical trends, it is possible to make grounded assessments about where they are likely to go, and at what speed.
The global economy has passed an important demographic threshold: dependency ratios - the ratio of non-working age population to working age population - have begun to rise after nearly half a century of declines. With labour inputs slowing in advanced economies, the importance of productivity in driving overall growth and policy in boosting labour force participation has increased. This is especially true in the US, where prime-aged women and particularly men have been withdrawing from the labour market over a long period.
Countries are coming under fiscal pressure to control age-related entitlements which could draw resources away from education, R&D and infrastructure, especially as older households vote more actively than younger cohorts. How an ageing population chooses to put its purchasing power to work will have a significant impact on the fortunes of different industries and occupations. This is likely to benefit not only healthcare, finance and housing but also recreation and education which have traditionally catered to the young.
Millennials - the cohort born between 1980 and 2000 - are poised to grow in influence as they inherit the assets of their parents. They are the first group to come of age after the arrival of digital technology, bringing with them heightened expectations of immediacy, participation and transparency. At the same time many became economically active in the shadow of the Great Recession which may have tempered attitudes to risk and confidence in major institutions. As a result, this group exhibits quite different consumption and work behaviours compared with previous generations.
Environmental Sustainability
A striking development over the past decade has been the growing consensus around man-made global warming. The scale of the challenge is enormous: to keep the rise in average global temperatures to below 2°C - the de facto target for global policy - cumulative CO2 emissions need to be capped at one trillion metric tonnes above the levels of the late 1800s. The global economy has already produced half of that amount.
Climate change has wide-ranging consequences for many industries. Agriculture, tourism, insurance, forestry, water, infrastructure and energy will all be directly affected, though linkages with socio-economic and technological systems mean that risks can accumulate, propagate and culminate in even larger impacts. For example, climate change could threaten food and resource security in parts of the world which may in turn make poverty and conflict more likely.
Meeting emissions reduction targets requires investment in green technologies, including LED lighting, electric vehicles, solar photovoltaic systems and onshore wind and more sophisticated forms of energy efficiency - which will also create opportunities for green finance. Despite plummeting costs for 'clean' solutions, there are a number of reasons why 'dirty' technologies are likely to hold sway, including political lock-in and high switching costs. Views differ as to the optimal dynamic strategy to be followed in such a scenario. Evidence for the broader jobs potential of the green economy is also ambiguous.
Structural changes associated with the green economy are fundamentally dependent on government policy. The number of supportive regulations has grown across the world. Although initiatives are likely to be set nationally rather than multilaterally, remain tied to specific sectors and technologies and are vulnerable to political reversals.
Urbanisation
Today, over half of the world's population live in cities, a number that is expected to grow to 70% by 2050. This concentration of humanity illustrates the basic unevenness of economic development - the tendency for places close to large markets to grow more rapidly than places more distant.
Cities are magnets for high-value, knowledge-intensive industries, where physical proximity enables collaboration and firms and workers benefit from enhanced labour pooling and matching. Urban planners increasingly build these features into the fabric of cities through the establishment of innovation districts that integrate work, housing and recreation.
Cities also offer more varied consumption and employment opportunities, though medical conditions such as obesity, diabetes and depression have been linked to aspects of the urban environment. Pressures on affordable housing may lock some households out of these opportunities, forcing them to live in older suburbs or low-income areas tethered to declining industries.
There has been an increasing push for authorities to make cities 'smarter' - leveraging the information generated by infrastructure to optimise performance. This agenda has also come to focus on sustainability, resilience and making cities more age-friendly. However, in many advanced economies infrastructure investment as a proportion of total government expenditure has been trending downwards for decades, with serious questions around the quality of existing infrastructure. A major uncertainty is how debates about the role of fiscal policy and government activism will resolve themselves against a backdrop of high public debt ratios.
Increasing Inequality
The sharp rise in income and wealth inequality has been described as the "defining challenge of our times". This has been accompanied by a squeeze on the middle class, as the distribution of income has shifted towards the higher and lower ends of the scale. Countries with higher levels of income inequality tend to have lower levels of mobility between generations.
Economic distress and the erosion in opportunities for people with low education have, in turn, created a web of social issues, including rising mortality and morbidity among segments of the US population. They have also fuelled resentment of elites and the appeal of populist ideas.
The macroeconomic relationship between inequality and growth remains contested - though recent studies have tended to highlight the costs of rising inequality, particularly over longer time horizons. Income inequality and associated phenomena also have sectoral consequences. They contribute to greater health and social problems, raising the demand for healthcare and social services. Employment in occupations dedicated to protecting property rights and managing conflict is typically larger in countries with unequal distribution of income. Finally they translate into disparities in consumption, particularly of non-durable goods and services such as education.
A number of factors have driven higher inequality, including the impact of technology and globalisation, failings of the educational system, anticompetitive practices, weaknesses in corporate governance, the decline in union membership and the progressivity of the tax system. Some of these trends may potentially reverse in the future - for instance as ageing reduces labour supply, pushing up wages, or as calls for redistribution grow louder, although these forces are most likely to operate at the margins. Past experience suggests that current levels of inequality are likely to persist in the medium term, absent an extreme shock of some kind.
Political Uncertainty
The geopolitical landscape is characterised by a greater distribution of power that has challenged the capacity of the international system to respond effectively to a host of regional and global challenges - from the spread of nuclear weapons, authoritarianism and terrorism, through historical rivalries in the Middle East and Asia-Pacific to a growing rejection of free trade and immigration. Indices of geopolitical uncertainty have persisted at higher levels after they spiked on 9/11. This has been mirrored by elevated policy uncertainty - a weakening of the institutional structures which enable policymakers to act credibly and consistently.
Increases in uncertainty are found to have significant negative impacts on economic activity, raising the user cost of capital, increasing the option value of deferring investments where there are sunk costs, and hindering the efficient reallocation of resources from low to high productivity firms. The impacts are felt most strongly in sectors like defence, finance, construction, engineering and healthcare which require extensive investment commitments and/or are exposed to uncertain government programmes.
The trend towards policy uncertainty is a function of structural changes in political systems - above all, the rise in partisanship which has impeded compromise and effective negotiation, reinforced by the growth in the scale and complexity of government regulation. Even in systems designed to produce moderation, institutions may have had the effect of marginalising important conflicts over policy rather than resolving them, increasing public apathy and dissatisfaction.
3. Approach
The dynamic interdependencies of the trends have implications for our research design. In an earlier piece of analysis, we reviewed the drivers of change that are expected to shape industry and occupational structures in the US and UK workforces in 2030 (Schneider et al, 2017). Drivers were selected on the basis that they are relatively stable with clear possible directions. Where the available evidence offered contrasting views of a trend and its implications or identified possible disruptions, the analysis aimed to capture this uncertainty - rather than reach a verdict on how things would play out.
This analysis was used to contextualise and guide discussions at two foresight workshops that we convened between small groups of thought leaders with domain expertise in at least one of the seven trends identified. These foresight workshops were held in Boston on 20 October 2016 with 12 participants and in London on 28 October 2016 with 13 participants.
In the second part of the US and UK workshops, the domain experts were presented with three sets of 10 individual occupations at the six-digit and four-digit Standard Occupation Classification (SOC) levels, and were invited to debate their future prospects. They then assigned labels to the occupations (individually) according to whether they thought they would experience rising, unchanged or declining demand by 2030. The experts were also asked to record how certain/uncertain they were in making their predictions. Factsheets presenting information on each of the 30 occupations (containing a list of related job titles, related industries, key skills and tasks) and their historical growth patterns were made available to the experts when making their predictions.
We used these labels to train a machine-learning classifier to generate predictions for all occupations, making use of a detailed data set of 120 skills, abilities and knowledge features against which the US Department of Labor's O*NET service 'scores' all four-digit occupations in the US SOC on a consistent basis (we used a cross-walk to also apply this data set to the UK SOC). To maximise the performance of the algorithm we used an active learning method whereby the second and third sets of 10 occupations to be labelled were selected by the algorithm itself (intuitively, these occupations were selected to cover that part of the skills/abilities/knowledge space where the algorithm exhibited highest levels of uncertainty based on the previously labelled occupations). From the model we determined which skills, abilities and knowledge features were most associated (on their own and together) with rising or declining occupations.
Our mixed methodology approach - making use of structured foresight and supervised machine-learning techniques - was crafted to tackle the limitations in traditional qualitative and quantitative exercises. In particular, qualitative approaches based purely on eliciting the judgements of experts are likely to be subject to human biases, while quantitative approaches based purely on trend extrapolation are likely to miss structural breaks in past trends and behaviours. By combining a machine-learning algorithm with structured expert judgment we hope to have the best of both worlds.
Our research design is elaborate, matching the ambitious nature of our research question, but it is important to note that, as a consequence, our findings could reflect any number of assumptions. For example, the subjective judgments of one group of domain experts could be very different to another, or some parts of the O*NET data set could be more accurate characterisations of occupations than others. The provision of historical data on occupations and the main trends designed to establish a common frame of reference among experts mitigates some of these risks. However, it remains the case that predictions generated might have differed if a different group of experts had participated in the workshops or if we had used different selections of O*NET features in our model.
A separate, though related, challenge is how to evaluate our findings. As a forward-looking exercise, we might simply compare our predictions with labour market outcomes in 2030. Notwithstanding the fact that this is 13 years away, a concern is that because our predictions are conditional (see above), we cannot in any straightforward way identify the source of prediction errors.
We try and partly tackle this by investigating the sensitivity of our findings to key features of our research design. In particular, we present predictions that used (non-parametric) trend extrapolation of employment in an occupation to label the 30 occupations in place of the experts' judgments. These data-driven labels give a baseline against which those built on our foresight exercises can be compared.
It is also important to note that our UK and US findings are not directly comparable. While the common use of O*NET data means that it is tempting to compare the O*NET features that are most and least associated with predicted higher demand occupations in the two countries, we would actually have made significant changes to the research design if our objective had been to undertake a cross-country study. For example, we might have asked one common group of domain experts to label occupation prospects for both the US and UK using a set of the most similar occupation groups (crosswalked) across the two countries. Differences in the SOC structures in the two countries also complicate comparison of the occupation predictions. As such, while our use of standardised reporting in the US and UK results might invite comparison and contrast, any such inference would not be valid. Our focus on obtaining the best possible results for each country compromises our ability to compare the two.
4. Data
4.1. O*NET
To derive the demand for skills, abilities and knowledge from our occupational projections, we rely on data from the (O*NET), a survey produced for the US Department of Labor (Occupational Information Network (O*NET), 2017). The O*NET survey contains information on more than 1,000 detailed occupations, using a modified form of the (SOC) system. It began in 1998 and is updated on a rolling basis by surveys of each occupation's worker population as well as job analysts' assessments.
The scope and sampling of O*NET are viewed as an improvement on its predecessor, the Dictionary of Occupational Titles (DOT) and also standard household surveys where self-reporting can result in substantial measurement errors. Reported response rates are high at around 65% - and have been rising over time (Handel, 2016). We take advantage of the 2016 O*NET to reflect most accurately the current make-up of occupations, though results from previous versions of O*NET are broadly similar.
A major strength of O*NET is that it asks many different questions about the skills, abilities, knowledge and work activities that make up occupations. Respondents/analysts are asked about the importance of a particular feature for a job (for example, critical thinking, persuasion, manual dexterity and so on) and the level or amount of the feature required to perform it. The questions are rated on an ordinal scale which are standardised to a scale ranging from 0 to 100. We use all 120 features from the skills, abilities and knowledge categories in O*NET, designed to provide as rich a picture of occupations as possible. These features are detailed in Table 1.
Our implementation strategy departs from Frey and Osborne's (2017) study of automation in that it relies on O*NET's 'importance' rating. Analyses of O*NET data suggest that there is substantial overlap between the importance and level ratings, so this modelling choice does not lead to vastly different predictions in practice (results are available on request from the authors). Critically, the importance rating is available for all combinations of features and occupations. This is in marked contrast to the level rating for which O*NET recommends suppressing a large number of estimates on account of their low precision. This problem is most serious for knowledge features: to implement O*NET's recommendations in full would entail removing occupations equivalent to 89% of total US employment. Similarly, the scales and anchor points used to construct the level ratings have been criticised for their complexity which may affect the reliability of some ratings (Handel, 2016).
In the remainder of this report, we will use x to represent the vector of length 120 containing these variables. In our workshop factsheets, we also include the occupation description and five common job title examples for the occupation, also taken from O*NET.
<div class="table-container" markdown="1">
| TYPE | FEATURE | TYPE | FEATURE |
| :-------- | :--------------------------------------- | :----------- | :---------------------------------- |
| Skill | Reading Comprehension | Knowledge | Fine Arts |
| Skill | Active Listening | Knowledge | History and Archeology |
| Skill | Writing | Knowledge | Philosophy and Theology |
| Skill | Speaking | Knowledge | Public Safety and Security |
| Skill | Mathematics | Knowledge | Law and Government |
| Skill | Science | Knowledge | Telecommunications |
| Skill | Critical Thinking | Knowledge | Communications and Media |
| Skill | Active Learning | Knowledge | Transportation |
| Skill | Learning Strategies | Ability | Oral Comprehension |
| Skill | Monitoring | Ability | Written Comprehension |
| Skill | Social Perceptiveness | Ability | Oral Expression |
| Skill | Coordination | Ability | Written Expression |
| Skill | Persuasion | Ability | Fluency of Ideas |
| Skill | Negotiation | Ability | Originality |
| Skill | Instructing | Ability | Problem Sensitivity |
| Skill | Service Orientation | Ability | Deductive Reasoning |
| Skill | Complex Problem Solving | Ability | Inductive Reasoning |
| Skill | Operations Analysis | Ability | Information Ordering |
| Skill | Technology Design | Ability | Category Flexibility |
| Skill | Equipment Selection | Ability | Mathematical Reasoning |
| Skill | Installation | Ability | Number Facility |
| Skill | Programming | Ability | Memorization |
| Skill | Operation Monitoring | Ability | Speed of Closure |
| Skill | Operation and Control | Ability | Flexibility of Closure |
| Skill | Equipment Maintenance | Ability | Perceptual Speed |
| Skill | Troubleshooting | Ability | Spatial Orientation |
| Skill | Repairing | Ability | Visualization |
| Skill | Quality Control Analysis | Ability | Selective Attention |
| Skill | Judgment and decision-making | Ability | Time Sharing |
| Skill | Systems Analysis | Ability | Arm-hand Steadiness |
| Skill | Systems Evaluation | Ability | Manual Dexterity |
| Skill | Time Management | Ability | Finger Dexterity |
| Skill | Management of Financial Resources | Ability | Control Precision |
| Skill | Management of Material Resources | Ability | Multilimb Coordination |
| Skill | Management of Personnel Resources | Ability | Response Orientation |
| Knowledge | Administration and Management | Ability | Rate Control |
| Knowledge | Clerical | Ability | Reaction Time |
| Knowledge | Economics and Accounting | Ability | Ability Wrist-Finger Speed |
| Knowledge | Sales and Marketing | Ability | Speed of Limb Movement |
| Knowledge | Customer and Personal Service | Ability | Static Strength |
| Knowledge | Personnel and Human Resources | Ability | Explosive Strength |
| Knowledge | Production and Processing | Ability | Dynamic Strength |
| Knowledge | Food Production | Ability | Trunk Strength |
| Knowledge | Computers and Electronics | Ability | Stamina |
| Knowledge | Engineering and Technology | Ability | Extent Flexibility |
| Knowledge | Design | Ability | Dynamic Flexibility |
| Knowledge | Building and Construction | Ability | Gross Body Coordination |
| Knowledge | Mechanical | Ability | Gross Body Equilibrium |
| Knowledge | Mathematics | Ability | Near Vision |
| Knowledge | Physics | Ability | Far Vision |
| Knowledge | Chemistry | Ability | Visual Color Discrimination |
| Knowledge | Biology | Ability | Night Vision |
| Knowledge | Psychology | Ability | Peripheral Vision |
| Knowledge | Sociology and Anthropology | Ability | Depth Perception |
| Knowledge | Geography | Ability | Glare Sensitivity |
| Knowledge | Medicine and Dentistry | Ability | Hearing Sensitivity |
| Knowledge | Therapy and Counseling | Ability | Auditory Attention |
| Knowledge | Education and Training | Ability | Sound Localization |
| Knowledge | English Language | Ability | Speech Recognition |
| Knowledge | Foreign Language | Ability | Speech Clarity |
</div>
## 4.2. Employment Microdata {: #section-4-2-employment-microdata }
To form yearly estimates of employment by occupation and industry for our workshops, we used US and UK employment microdata. For the US, we used 1983-2015 data from the Current Population Survey’s (CPS) Annual Social and Economic Supplement (ASEC) from the Integrated Public Use Microdata Series (IPUMS) by the Minnesota Population Center (King et al., 2010). We used an IPUMS-provided best-guess harmonisation of occupation codes over time to 1990 Census occupation codes. We then crosswalked these codes to six-digit US SOC 2010 codes.
For industry, we presented CPS-derived estimates of occupation employment by industry in 2015, harmonised in the same way. We used the most granular common level of North American Industry Classification System (NAICS) 2012 code available for that occupation (either the four-, three-, or two-digit level).
The comparable high-resolution microdata is only readily available in the UK over a shorter time period due to challenges in matching the SOC codes across changes in the classification over time. We used yearly occupational employment estimates based on the Labour Force Survey and provided by the Office for National Statistics (ONS) for 2001 and 2016 inclusive (ONS, 2017a). These were provided at the four-digit ONS SOC 2010 level, the equivalent level of granularity as the six-digit US SOC 2010 occupation code. We further generated estimates of occupation employment by UK Standard Industrial Classification (SIC) 2007 industry class and subclass in 2015 using the Labour Force Survey provided by ONS (2017b).
The US employment results from our machine-learning classifier were weighted using the May 2015 Occupational Employment Statistics from the Bureau of Labor Statistics (US Bureau of Labor Statistics, 2015). The corresponding UK employment results are weighted using the August 2016 Labour Force Survey from the Office for National Statistics (ONS, 2017a).
## 4.3. Workshop-Generated Data {: #section-4-3-workshop-generated-data }
To collect labels to train our machine-learning classifier of future demand for occupations, we held two expert foresight workshops in Boston and London in October 2016. Each workshop brought together a diverse group of 12 to 13 experts from industry, government, academia, and the social sector. Our experts were instructed to consider the net impact on the workforce occupation composition of all the trends discussed above, guided by our trends analysis. Figure 1 features a sample page of the trends analysis, which was shared with our experts in advance, and presented at the workshops.
Over the course of the workshop, the group participated in three prediction sessions. In each session, the participants viewed the information described above for 10 occupations, displayed on two slides ('factsheets') per occupation. (See Figures 2a and 2b for examples of these factsheets.)
Note that the factsheets presented time-series plots of the occupation to participants, such that they could form their predictions with proper historical context. After viewing the occupation descriptions the group was directed to an online form to answer two questions:
1. What will happen to the share of total employment held by this occupation?
{Higher share, Same share, Lower share}
2. What will happen to the number of people employed in this occupation?
{Grow, No change, Decline}
With only a three-point scale, it was important to consider both employment share and absolute employment levels so as to allow a fuller expression of judgments of future demand. For example, only knowing that an occupation will grow slower than the workforce as a whole says nothing about whether it will add or shed jobs. In the event, both US and UK workshops were of the view - albeit with significant differences in opinion across individuals - that total employment would grow over the prediction horizon, consistent with the historical pattern.
Given the inherent difficulties in making long-term predictions, our workshop participants were also asked to provide a 0-9 ranking of how certain they were in their answer, with 0 representing not certain at all, and 9 representing completely certain. They were also given a space to provide freeform thoughts they felt were necessary to qualify their answers.
After the group submitted their answers using the online form, an experienced foresight workshop facilitator reviewed the responses with the group. After the group debated their perspectives during a half-hour session, the group was then allowed to change their answers, after which the workshop moved onto the next set of 10 occupations.
The first 10 occupations presented to participants were selected randomly. For the second and third rounds, the respective batches of 10 occupations were selected so as to be maximally informative for the machine-learning model in light of the answers previously gathered from participants. In a way, the participants could be seen as teaching the machine-learning algorithm throughout the course of the day, with the algorithm able to respond to the information from participants by proposing a prioritised list of further questions. This process is described formally in Section 5.3.
Figure 1: Sample page from trends analysis presented at the workshops
<div class="diagram-description" markdown="1">
### Future of Skills
#### Technological change
#### Globalisation
Unwinding trade imbalances
Peak globalisation?
The importance of place
Specific trade opportunities
Growing global
middle class
#### Demographic change
Peak globalisation?
Rapid expansion of global trade may have run its course
Evidence that trade has become less responsive to global GDP growth - suggesting that trade slowdown is not just a temporary phenomenon reflecting the crisis (Constantinescu, Mattoo and Ruta, 2014).
* Leveling off of offshoring?
* Stabilisation of China's manufacturing share
* Stronger domestic production base in emerging economies
* Weaker (trade-intensive) business fixed investment as percentage of GDP in advanced economies
Going forward
If trade slowdown is structural, impacts of trade on labour market will in future be very different from what they have been in past.
#### Environmental sustainability
#### Urbanisation
#### Increasing inequality
#### Political uncertainty
#### References
<div class="chart-description" markdown="1">
World trade (percentage of GDP)
</div>
<div class="chart-description" markdown="1">
Four year rolling sensitivity (elasticity) of global real-trade growth to global real-GDP growth
</div>
</div>
Figure 2A: Factsheet for UK occupation farm workers
### DESCRIPTION
Farm workers perform a variety of tasks, by hand and machine, to produce and harvest crops and to breed and rear cattle, sheep, pigs and poultry.
### SAMPLE JOB TITLES
Agricultural Worker; Agricultural Labourer; Estate Labourer; Gang Man (Agriculture); Agricultural Craftsman
### TOP JOB TASKS
* Operates farm machinery to prepare soil, fertilise and treat crops.
* Cultivates growing crops by hoeing, spraying and thinning as necessary.
* Weighs and measures foodstuffs, feeds animals and checks them for any signs of disease.
* Cleans barns, sheds, pens, yards, incubators and breeding units and sterilises milking and other equipment as necessary.
* Treats minor ailments and assists veterinary surgeon as required.
Skills based on U.S. "Farmworkers, Farm, Ranch, And Aquacultural Animals" (45-2093.00)
### TOP JOB SKILLS
* Critical Thinking
* Active Listening
* Monitoring
* Operation and Control
* Operation Monitoring
Figure 2B: Statistics factsheet for UK occupation farm workers
<div class="chart-description" markdown="1">
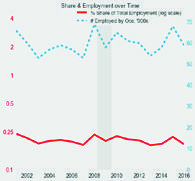
### TOP EMPLOYING INDUSTRIES
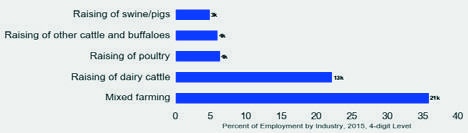
</div>
## 5. Methodology {: #section-5-methodology }
Our methodology uses the foresight exercises described in Section 4.3 as training data for a machine learning model. The primary goal of the model is to learn a function f(x) that maps from 120 O\*NET variables x (capturing skills, knowledge and abilities) to future occupational demand. In this framework, the iᵗʰ occupation is considered a point, x⁽ⁱ⁾, in a 120-dimensional skills-/knowledge-/ability-space, whose associated demand is f(x⁽ⁱ⁾). Our approach is built on an expectation that demand should vary smoothly as a function of skills, knowledge and abilities: that is, if two occupations i and j have similar O\*NET variables, x⁽ⁱ⁾ ~ x⁽ʲ⁾, we expect their associated demands to be similar, f(x⁽ⁱ⁾) ≈ f(x⁽ʲ⁾).
We choose to model f with a Gaussian process, to be described in Section 5.1. The Gaussian process is a Bayesian non-parametric model (Ghahramani, 2013), meaning that its expressiveness will naturally adapt to that inherent in the data. This gives us an in-built resistance to over-fitting (learning patterns that do not generalise to unseen data): the model will not induce the flexibility required to give a near-perfect fit on training data unless the quality and quantity of data suggests that this fit will extend equally well to unobserved data. This desirable property is induced by the 'Occam's Razor' implicit within Bayesian reasoning (MacKay, 2003), and is suggested empirically by the cross-validation tests presented in Section 6.2. The Gaussian process gives a flexible, non-linear, function class suitable for the complex interactions (for instance, complementarities) that we expect between variables and demand.
This model is trained on a dataset containing labels for each occupation from each individual expert, rather than on the group consensus. This approach permits the diversity of views within the group to be captured within the model. The participant labels are modelled as conditionally independent given the latent function f(x). The dependence among the group's labels induced by discussion is modelled through this shared latent function.
Resilience to uncertainty is crucial to our exercise. Not only did our workshops gather observations from individual participants with explicit representations of their uncertainty, the model must also try to fuse observations from the diverse range of opinions produced by our domain experts. Our model choice is informed by the probabilistic foundations of the Gaussian process, which give it a coherent way to reason about uncertainty. As such, we expect our model to give an honest representation of the trends that can be inferred from uncertain, or noisy, participant labels.
Beyond the state-of-the-art Gaussian processes, we introduce a novel heteroskedastic ordinal regression model (that is, a model with location-varying noise variance), described in Section 5.2. This development is necessary to manage participant labels that are both ordinal and of varying uncertainty. Our model is put to work on a variety of tasks. In particular, it is the basis of our means of selecting occupations to be labelled through active learning (Section 5.3). Interpreting the patterns discovered by the model is the basis of our assessment of the importance of O\*NET features to future demand (Section 5.4). Finally, we use the model to predict future occupations, defined as hotspots of high demand that are not associated with an existing occupation (Section 5.5).
To benchmark the efficacy of our foresight exercise, we also use Gaussian processes to perform extrapolation out to the year 2030 of past employment trends (Section 5.6). These extrapolations provide alternatives to the labels produced in the workshops, and provide results that do not rely on the subjective judgments of the experts.
### 5.1. Gaussian Processes {: #section-5-1-gaussian-processes }
In this section, we give a brief review of Gaussian processes. Formally, a GP (Rasmussen and Williams, 2006) is a probability distribution over functions f: X → R, such that the marginal distribution over the function values on any finite subset of x (such as x) is multivariate Gaussian. For a function f(x), the prior distribution over its values f on a subset cx are completely specified by a mean vector m and covariance matrix K:
p(f | K) := N(f; m, K) := 1 / sqrt(det(2πK)) exp(-½fᵀK⁻¹f) (1)
The covariance matrix is generated by a covariance function: K: X × X → R; that is, Kᵢⱼ = k(xᵢ, xⱼ).

Given training data D, we use the GP to make predictions about the function values f* at input x*. With this information, we have the predictive equations:
p(f | x, D) = N(f; m(f | x, D), V(f | x*, D)) (2)
where
m(f | x, D) = K(x, X)K(X, X)⁻¹y (3)
V(f | x, D) = K(x, x) - K(x, X)K(X, X)⁻¹K(X,x*) (4)
Inferring the label posterior p(y* | x*, D) is complicated by the non-Gaussian form of the ordinal likelihood to be introduced below.

### 5.2. Heteroskedastic Ordinal Regression {: #section-5-2-heteroskedastic-ordinal-regression }

Gaussian process ordinal regression consists of combining ordinal (that is, ordered numerical scores) observations with a Gaussian process prior. Our approach differs from the state-of-the-art (Chu and Ghahramani, 2005), in incorporating a heteroskedastic noise model. Recall that participants describe how confident they are using a choice from an ordinal list {0,..., 9}. We assume that the noise standard deviation associated with each observation is an affine transformation of the chosen value: noise = a + βi for i∈ {0,...,9} with hyperparameters a ∈ R+ and β∈ R+. Since the value of noise is an ordinal variable as well, we build a secondary ordinal regression model to predict the ordinal value of noise at different points in feature space.

As there are two questions being asked, one relating to share change, and the other absolute change, two different types of observations are made. We build a model capable of acknowledging and fusing these two different observation types by employing and extending GPflow, a package for building Gaussian process models in Python using TensorFlow (Matthews et al., 2016). We use a Gaussian process to model a latent function f(x), representing the change in demand in absolute employment. The relative change in share can be represented by dividing the absolute change in demand by the total size T of the workforce in 2030. That is, the second of the two workshop questions provides an observation f/T, where T is an unknown positive value to be inferred for each participant.

For each question, the model ingests ternary-valued labels from one of the sets {Higher share, Same share, Lower share} and {Grow, No change, Decline}, for relative share of employment and absolute change in employment, respectively. From these ternary-valued observations the model produces a posterior distribution over binary-valued labels, namely, {Increasing demand, Decreasing demand), which are used as the foundation of the analysis. The derivative of 'Increasing demand of an occupation' with respect to the occupation features is made possible by the use of automatic differentiation, a feature of Google's Tensorflow Python package (Abadi et al, 2015), which provides the framework to GPflow.

### 5.3. Active Learning {: #section-5-3-active-learning }

As described in Section 4.3, our foresight workshops required choosing which occupations were to be presented to participants. We introduced the use of a machine learning model to automate this choice. The machine learning model used was a reduced form of the model described in Section 5.2 to ensure 'real-time' performance. In particular, given that our goal is to predict demand, and that our model is able to provide estimates of the uncertainty of demand in all occupations, we took the natural option of uncertainty sampling. Uncertainty sampling ranks the set of all occupations from high- to low- uncertainty, and chooses the highest-ranked for labelling by participants. The motivation for the approach is the expectation these labels should be most informative about demand overall: their observation should lead to a large reduction in total uncertainty. The active learning approach is one that aims to interactively acquire data so as to provide the greatest confidence in resulting predictions.

### 5.4. Assessing Feature Importance {: #section-5-4-assessing-feature-importance }

One of the core goals of this work is to assess the significance of the 120 O\*NET features to future demand, and thereby inform skills policy decisions.

First, however, our research question needs further clarification: what exactly does it mean for a feature to be important to demand? We propose two primary criteria for a scheme to measure importance:

1.  An important feature must be clearly predictive of demand.
2.  An increase in an important feature must lead to a strong increase in demand.

We also propose two secondary criteria for a scheme to measure importance:

1.  It must be able to uncover non-linear interactions between features.
2.  It must be able to capture complementarities between features: we wish to discover features whose importance is contingent on the values of other features.

One approach to assessing feature importance is feature selection (Guyon and Elisseeff, 2003). Feature selection is a broad and well-studied topic, and aims to choose those features that are most informative of the function. In our context, it might be thought that the ranking of O\*NET features selected through such a scheme is a means of ranking their importance to demand. We suggest that the bulk of methods of feature selection give, at best, an insufficient guide to importance, and, at worst, actively misleading: feature selection does not address the second of our primary criteria. That is, determining that a feature is highly informative gives no sense of the sign of the relationship between feature and demand. Most feature selection adopts an information-theoretic approach that would not distinguish between a feature x1, for which f(x) = -x1, and a feature x2, for which f(x) = α+x2 (α and β being some parameters). Both x1 and x2 are highly informative of demand. However, a skills policy that result in broad increases in x1 would lead to harmful outcomes for occupations; x2, the converse. Note also that, for our complex, non-linear, function f, relationships with x are unlikely to be as simple as that described above for x1 and x2. Another feature, x3, may give f(x) = cos(x3): while, again, x3 is highly informative of demand, it is unclear whether it is important: for some occupations (values of x3), x3 will have very different significance from that for other occupations. To be explicit, the Automatic Relevance Determination approach (Rasmussen and Williams (2006)) often used for embedded feature selection for Gaussian processes is inappropriate for our ends. It provides only a description of the informativeness of features, rather than their importance.

### 5.4.1. Pearson Correlation {: #section-5-4-1-pearson-correlation }

We first consider a direct means of achieving our primary two criteria, while ignoring the secondary criteria. This metric of the importance of a feature, which we abbreviate as Pearson correlation, is the employment-weighted Pearson correlation coefficient between our model’s predictive mean for demand and the feature. More precisely, let the posterior mean for the latent demand feature for the iᵗʰ occupation be m(x⁽ⁱ⁾). We can then define the Pearson correlation value for the nᵗʰ O\*NET feature as:
PC(n) := Σᵢ w(i) (m(x⁽ⁱ⁾) - E(m(x))) (xᵢ⁽ⁿ⁾ - E(x⁽ⁿ⁾)) / (σ(m(x)) σ(x⁽ⁿ⁾)) (5)
where (for any function g(x)) we define the employment-weighted expectation and variance:
E(g(x)) := Σᵢ w(i)g(x⁽ⁱ⁾) (6)
σ(g(x))² := E(g(x)²) – E(g(x))² (7)
I is the total number of occupations, and w⁽ⁱ⁾ is the fraction of total employment within the iᵗʰ occupation.

Pearson correlation measures the linear relationship between demand and a feature. As such, it gives the sign of clear relationships, but satisfies neither of our secondary criteria. One consequence of linearity is that the Pearson correlation may place low weight on features that are linked to high demand only for a small number of occupations. Nonetheless, the features that it does highlight will unquestionably be important: if a strong positive linear interaction exists, it should certainly influence our resulting skills policy. As such, we would consider Pearson correlation to give a sufficient but not necessary condition for importance.

### 5.4.2. Average Derivative and Feature Complementarity {: #section-5-4-2-average-derivative-and-feature-complementarity }

Our second proposal gives a means of satisfying our secondary criteria, while perhaps weakening the case for the first of the primary criteria. The average derivative, as described in Baehrens et al. (2010), is for the nᵗʰ feature simply
AG(n) := E ( ∂m(x) / ∂x_n ) (8)
using the employment-weighted expectation defined in (6).
By way of interpretation, the derivative measures the expected increase in demand for a unit increase in a particular feature (for instance, as a result of a policy intervention). By averaging over all occupations, we get a sense of the aggregate increase in demand as a result of this increase in a feature. The average derivative gives an interpretable notion of sign: it can clearly distinguish positive from negative relationships with demand.
The first advantage of this metric relative to the marginal correlation is that it is sensitive to non-linearities in the data, addressing the first of our secondary criteria. While the derivative gives a linear approximation to demand, it is only a locally linear approximation. By considering the approximation at all points (occupations) in skills/knowledge/abilities/space, we are able to better measure relationships that have different slopes at different regions of the space.
This ability to manage non-linearity also enables the average derivative to capture the importance of features whose significance is conditional on the values of other features. For instance, fine arts is very important to artists, but less important for occupations with differing skills profiles. This is achieved through reporting the derivative averaged over subsets of occupations: for instance, those that fall within a major occupational grouping. For a non-linear function, the average derivative for a feature may be substantively different over one region of space (occupational grouping) than from another.
For each subset of occupations, we will highlight those features with both large positive and large negative average derivatives. Those with large positive derivatives we say are complementary to the occupational group (increasing such a feature increases demand), whereas those with large negative derivatives we say are anti-complementary (increasing such a feature decreases demand). It is also of interest to speak of complementarities between features, rather than simply of the complementarity of a feature to an occupational group. To do so, we must find some way of singling out the features associated with the occupational group. Those features that are large on average for an occupational group are, speaking roughly, those that are most exceptionally significant, and hence most characteristic, of the occupational grouping. As such, we will define features with large positive average derivatives to be complementary to those characteristic (large-valued) features.
The key drawback of the average derivative approach is that the averaging itself may obstruct accurate interpretation. As an example, if f(x) = 10¹⁰ cos(xₙ), there are many points for which the average derivative would be very large: for instance, all those points immediately to the left of a peak, {xₙ = -ε + 2πη; ∀ small positive ε and integer n}. This xₙ is a feature that is unlikely to be useful in policy: it has an equal number of points (occupations) with very large negative derivative. Increasing xₙ would be very harmful to all such occupations. Nonetheless, if the chosen samples (occupations) contain even one more point of large positive derivative than large negative derivative, xₙ may have high average derivative. This drawback leads us to regard the average derivative as a necessary but not sufficient condition for importance; rendering it complementary to the marginal correlation.
To slightly ameliorate the problems of averaging, we calculate the empirical distribution of the derivative for each feature - particularly, its mean and standard deviation. We then exclude features whose derivative has a standard deviation that is in the top 97ᵗʰ percentile of the distribution. The rationale is that the influence of these features is very 'noisy' (for example within a particular occupational grouping, demand might strongly increase for some occupations and strongly decrease for other occupations) and hence unlikely to be a reliable basis upon which to design policy. Here we have implicitly taken a conservative view of the potential of skills policy to precisely affect targeted occupational groups. However, there is a tradeoff in the selection of the threshold of exclusion. Any non-linearity in demand will result in the derivative varying over, thereby increasing the standard deviation. Note that features excluded under this scheme are excluded only for consideration by the average derivative: the recommendations of this metric cannot be trusted for these features. The excluded features are used as normal in every other facet of our modelling, as in producing occupation-level and aggregate predictions of demand.
### 5.5. New Occupations {: #section-5-5-new-occupations }
We define a potential new occupation as a combination of skills, abilities and knowledge features that is likely to see high future demand, but is not associated with an existing occupation. To forecast where new occupations might emerge, we optimise the posterior mean for the latent demand variable, m(x) as a function of x. More precisely, we start by randomly selecting 50 current occupations as our starting points of high demand occupations. We run local optimisation algorithms (limited-memory BFGS, observing box-constraints, as per Byrd et al., 1995) initialised at each of the 50 occupations. This will return 50 local optimisers of m(x): points x* in the skills, abilities and knowledge features space that is associated with high demand. Many of these optimisers will be (near-)identical, and others will be (near-)identical to each other to existing occupations. Beginning with a single such optimiser, x*₀, we add each successive optimiser unless it is closer, in the 2-norm sense, than a preset threshold (ε = 0.1) to either: an existing occupation, or; a previously included optimiser. This procedure will return a list of hotspots of demand (local optimisers) {x*; vᵢ}, of length that may vary for different mean functions. Each hotspot can be interpreted through returning its vector of skills, abilities and knowledge features values x*, as well as the list of occupations which are closest to it.
### 5.6. Trend Extrapolation {: #section-5-6-trend-extrapolation }
As an alternative to the labels from our foresight workshop participants, we use non-parametric extrapolation of historical employment trends to give a more data-driven alternative to predicting demand in the year 2030. Specifically, we use a Gaussian process to regress UK and US employment (for the years we have) as a function of years, for both absolute employment values and share employment values, projecting forward to 2030.
Each occupation is modelled separately using a Gaussian Process (GP). A Matérn Covariance with parameter ν =3/2 is used for each GP; this ensures sufficiently smooth extrapolation without losing the structure in the trends. To control the characteristic scale on which the Gaussian Process varies (a length scale), we assign a prior that centres the value of the length scale such that data points from the last year in our employment series will influence employment numbers in 2030. The GP is modelled over the log of the employment numbers.
Absolute employment numbers are modelled directly from historical data using a Gaussian Process. The share values are slightly more involved. First, we model the total workforce, T, as a function of time and use our model to extrapolate that forward to 2030. We then divide the extrapolated total workforce values by the absolute values to give the share value predictions.
We use these trend extrapolations to compute the probability of the trend being higher demand, the same demand or lower demand between 2015 and 2030. The probability of being high is taken as the total positive difference above two standard deviations. Low is taken as the total negative difference below two standard deviations.
To generate a data set equivalent to our workshop response we sampled from these extrapolated probabilities. A three-parameter multinomial distribution is sampled using the probabilities of higher, same and lower. For each occupation we sample 12 values and use these as the participant responses. A noise value of 0 is assigned for every data point.
These values are then fed into the ordinal regression GP model and the corresponding probabilities are computed as described in Section 5.2.
## 6. Results {: #section-6-results }
Here we present our main results and analysis for both the US and the UK economies. In presenting results for both countries, we caution that, as discussed in Section 3, cross-country comparison is difficult, and is not the focus of this research. The first analysis we present relates to the share of employment in 2030 by occupation, and our model's outputs are the probabilities of that share being greater than at present. (Findings for the absolute level of employment are available on request from the authors.) Below, we informally use 'increased demand', 'future demand' (and, at times, simply 'demand') as a shorthand for ‘increased share of employment in 2030'.
### 6.1. Occupations {: #section-6-1-occupations }
The primary outputs of our model are the probabilities of each occupation experiencing a rise in workforce share (that is, increased demand). These occupation-level results can then be aggregated to give the figures below. We distinguish the percentage of the workforce in occupations predicted to see a rise in workforce share in 2030 with a 'low probability' (less than 30%), 'medium probability' (> 50%) and 'high probability' (> 70%). (These probability thresholds are the ones used in Frey and Osborne (2017)). That is, we calculate total employment that has probability of future increasing demand lying above and below these three thresholds.
#### 6.1.1. US {: #section-6-1-1-us }
As per Section 4.2, our calculations are made at the finest level available for US occupations; that is, the six-digit US SOC 2010. The percentage of the US workforce as partitioned by the thresholds above is provided in Table 2.
Table 2: The fraction of the US workforce above and below varying thresholds for the probability of increasing demand
<div class="table-container" markdown="1">
| Number of Occupations | Employment | below 0.3 | above 0.5 | above 0.7 |
| :-------------------- | :------------ | :-------- | :-------- | :-------- |
| 772 | 135 million | 18.7% | 43.2% | 9.6% |
</div>
Note: employment does not equal total US employment as it excludes any 6-digit SOC occupations for which O\*NET data is missing. This consists of "All Other" titles in the BLS data, representing occupations with a wide range of characteristics which do not fit into one of the detailed O\*NET-SOC occupations. It also consists of occupations for which O\*NET is either in the process collecting data e.g. underwriters or has decided not to collect data e.g. legislators. Hence our analysis excludes occupations equivalent to roughly 2 percent of total US employment.
In Figure 3, we plot (following Frey and Osborne, 2017) the distribution of current US employment over its probability of future increased demand. We additionally distinguish this employment by an intermediate aggregation of the Major Groups, as specified by the BLS 2010 SOC user guide (US Bureau of Labor Statistics, 2010).
Figure 3: The distribution of US employment according to its probability of future increased demand.
Note that the total area under all curves is equal to total US employment.
<div class="chart-description" markdown="1">
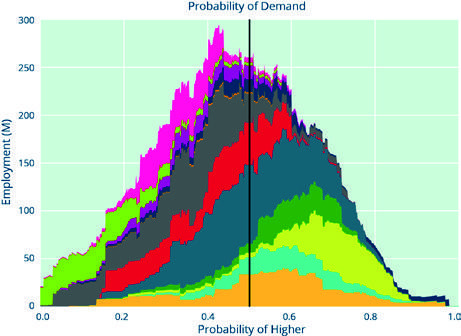
Management, Business and Financial Occupations
Computer, Engineering and Science Occupations
Education, Legal, Community Service, Arts,
and Media Occupations
Healthcare Practitioners and Technical
Occupations
Service Occupations
Sales and Related Occupations
Office and Administrative Support Occupations
Farming, Fishing and Forestry Occupations
Construction and Extraction Occupations
Installation, Maintenance and Repair Occupations
Production Occupations
Transportation and Material Moving Occupations
</div>
Figure 3 reveals a large mass of the workforce in employment with highly uncertain demand prospects (that is, a probability of experiencing higher workforce share of around 0.5). Note that this contrasts sharply with the U-shaped distribution by probability of automation in Frey and Osborne (2017), where the workforce is overwhelmingly in occupations at either a very high probability or a very low probability of automation. That our predictions are more uncertain is a direct result of the distinctions of our methodology from previous work. Firstly, the expert labels we gather in our foresight exercises (see Section 4.3) are explicitly clothed in uncertainty, whereas Frey and Osborne (2017) assume that participants are certain about their labels. This humility is partially motivated by the difficulty of the task assigned to our experts: balancing all the macro trends that might influence the future of work. Our allowance for our experts' self-assessed degrees of confidence also recognises that many of the macro trends act at cross-purposes, leading to uncertainty about which will dominate in the case of any one occupation. Secondly, we use 120 O\*NET features, against the nine used in Frey and Osborne (2017). This more detailed characterisation of occupations renders occupations less similar to one another, and hence limits the confidence of our model in predicting for one occupation based on what has been labelled for another.
Table 3 lists the minor occupation groups about which our model is most optimistic.
Table 3: For the US, the minor occupation groups with the greatest probabilities of future increased demand
For these occupations, we characterise the fraction of their current employment that has a probability of increased demand above two thresholds.
<div class="table-container" markdown="1">
| TITLE | EMPLOYMENT | >0.7 | >0.5 |
| :----------------------------------------------- | :---------- | :---- | :---- |
| Preschool, Primary, Secondary and Special | 4,050,880 | 97.8 | 100 |
| Education School Teachers | | | |
| Animal Care and Service Workers | 185,780 | 93.7 | 100 |
| Lawyers, Judges and Related Workers | 672,580 | 90.7 | 98.1 |
| Post-secondary Teachers | 1,328,890 | 83.0 | 100 |
| Engineers | 1,610,470 | 70.0 | 100 |
| Personal Appearance Workers | 504,640 | 69.0 | 100 |
| Social Scientists and Related Workers | 239,170 | 65.6 | 92 |
| Counselors, Social Workers and Other | 1,715,190 | 54.0 | 100 |
| Community and Social Service Specialists | | | |
| Librarians, Curators and Archivists | 253,800 | 51.8 | 62.9 |
| Entertainers and Performers, Sports | 483,450 | 46.4 | 96.1 |
| and Related Workers | | | |
| Other Management Occupations | 2,185,950 | 42.9 | 100 |
| Media and Communication Workers | 542,570 | 40.3 | 89.4 |
| Operations Specialties Managers | 1,663,790 | 29.8 | 46.5 |
| Religious Workers | 68,530 | 29.6 | 100 |
| Other Teachers and Instructors | 282,640 | 23.0 | 100 |
| Other Personal Care and Service Workers | 2,619,120 | 21.9 | 100 |
| Construction Trades Workers | 4,076,790 | 21.8 | 64.7 |
| Business Operations Specialists | 4,424,800 | 19.6 | 77.4 |
| Physical Scientists | 266,050 | 13.8 | 100 |
| Other Sales And Related Workers | 585,030 | 12.3 | 14.4 |
| Architects, Surveyors and Cartographers | 168,650 | 11.8 | 67.3 |
| Other Education, Training, | 1,386,830 | 10.1 | 100 |
| And Library Occupations | | | |
| Other Healthcare Support Occupations | 1,451,710 | 6.3 | 54.3 |
| Occupational Therapy And Physical Therapist | 174,800 | 4.3 | 100 |
| Assistants And Aides | | | |
| Health Diagnosing And Treating Practitioners | 4,944,470 | 4.0 | 100 |
</div>
We derive a number of insights from Table 3, informed in part by our workshop discussions.
* Education and personal care occupations feature prominently in the rankings; however, healthcare occupations are lower than expected by trends such as ageing, potentially reflecting uncertainty over the trajectory of healthcare policy and spending in the US or technical issues related to the composition of the training set (which, in practice, underrepresented healthcare occupations).
* Construction trade work, as a larger employer, is another beneficiary. It is supported by a number of trends, including urbanisation, ageing and globalisation and is expected to be an important source of medium-skilled jobs in the future.
* Demand prospects can vary considerably for occupations that are otherwise very similar. For example, business operations specialists - which typically need information management expertise - are set to grow as a share of the workforce while neighbouring minor occupation groups in the SOC such as financial specialists (see Table 4) are predicted to fall in share. Looking at the detailed occupation level, the results for business operations specialists are driven by management analysts, training and development specialists, labour relations specialists, logisticians and meeting, convention and event planners in particular - occupations that will conceivably benefit from the reorganisation of work and the workplace.
* Another niche anticipated to grow in workforce share is other sales and related workers and, within that in particular, sales engineers and real estate agents, notwithstanding the predicted decline in general sales occupations.
6.1.2. UK
Again, as per Section 4.2, our calculations are made at the finest level available for UK occupations; that is, the four-digit UK SOC 2010. The percentage of the UK workforce as partitioned by the thresholds above is provided in Table 5.
Table 5: The fraction of the UK workforce above and below varying thresholds for the probability of increasing demand
| Number of Occupations |
Employment |
below 0.3 |
above 0.5 |
above 0.7 |
| 365 |
31,423,561 |
21.2% |
51.8% |
8.0% |
Note: employment does not equal total UK employment as it excludes 4-digit SOC 2010 occupations corresponding to the 6-digit SOC occupations for which ONET data is missing. The latter consists of "All Other" titles in the BLS data, representing occupations with a wide range of characteristics which do not fit into one of the detailed ONET-SOC occupations. It also consists of occupations for which O*NET is either in the process collecting data e.g. underwriters or has decided not to collect data e.g. legislators. Hence our analysis excludes occupations equivalent to roughly 1 percent of total UK employment.
In Figure 4, we describe (following Frey and Osborne, 2014) the distribution of current UK employment over its probability of future increased demand. We additionally disaggregate this employment by Major Group (that is, at one-digit level) in the UK SOC.
As with the US results, Figure 4 reveals that the model is notably more uncertain than in Frey and Osborne (2014). Note from Table 5 that, relative to the US, a larger fraction of the UK workforce is predicted to grow in share; however, a larger fraction of the UK workforce also faces a high risk of declining in share.
Figure 4: The distribution of UK employment according to its probability of future increased demand.
Note that the total area under all curves is equal to total UK employment.
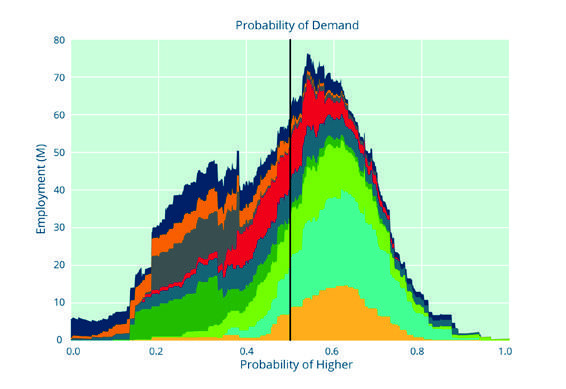
Probability of Demand
Employment (M)
- Management, Directors and Senior Officials
- Professional Occupations
- Associate Professional and Technical Occupations
- Administrative and Secretarial Occupations
- Skilled Trades Occupations
- Caring, Leisure and Other Service Occupations
- Sales and Customer Service Occupations
- Process, Plant and Machine Operatives
- Elementary Occupations
Table 6: For the UK, the minor occupation groups, or three-digit occupations, with the greatest probabilities of future increased demand
For these occupations, we characterise the fraction of their current employment that has a probability of increased demand above two thresholds.
| TITLE |
EMPLOYMENT |
>0.7 |
>0.5 |
| Food Preparation and Hospitality Trades |
479,645 |
71.4% |
76.6% |
| Teaching and Educational Professionals |
1,569,250 |
57.3% |
94.5% |
| Sports and Fitness Occupations |
170,183 |
56.0% |
100.0% |
| Natural and Social Science Professionals |
227,020 |
55.0% |
100.0% |
| Managers and Proprietors in Hospitality and Leisure Services |
299,143 |
50.0% |
96.7% |
| Health and Social Services Managers and Directors |
88,651 |
44.1% |
100.0% |
| Artistic, Literary and Media Occupations |
397,323 |
37.1% |
79.4% |
| Public Services and Other Associate Professionals |
524,068 |
31.9% |
100.0% |
| Other Elementary Services Occupations |
1,066,177 |
26.5% |
92.6% |
| Therapy Professionals |
123,632 |
22.6% |
100.0% |
| Engineering Professionals |
475,217 |
22.4% |
100.0% |
| Media Professionals |
164,649 |
19.3% |
100.0% |
| Welfare Professionals |
177,879 |
14.4% |
91.9% |
| Electrical and Electronic Trades |
468,429 |
12.4% |
100.0% |
| Health Professionals |
545,874 |
4.1% |
100.0% |
We can glean several insights from Table 6.
- The presence of health and education-related and other service occupations is consistent with Baumol's cost disease hypothesis – that is, lower productivity growth sectors should be expected to experience increasing workforce shares for a given increase in demand (Baumol et al., 2012).
- The results also highlight the resilience of public sector occupations beyond health and education. It is unclear whether this is because workshop participants believe these occupations will grow faster than others, or because they believe that any change will be less volatile due to institutional factors, such as higher job security and unionisation, enabling participants to have a higher degree of confidence in them. However understood, the finding is consistent with research by Acemoglu and Restrepo (2017a) showing that the public sector is among the few segments of the labour market that holds up in areas affected by automation. Another possibility is that it reflects consumer concerns about ethical, privacy and safety issues which, among other things, may affect the demand for regulation (World Economic Forum (WEF), 2016; Jones, 2016).
- Activities that are not subject to international trade feature heavily in the list of occupation groups: food preparation, elementary services, hospitality and leisure services and sports and fitness, and electrical and electronic trades. This is also consistent with the high-tech multiplier effects identified by Moretti (2012) and Gregory et al. (2016).
- Some of these occupations (food preparation and hospitality trades and other elementary service occupations) have low skills requirements, but are associated with differentiated products which consumers value (Autor and Dorn, 2013). They may therefore be ripe for job redesign to emphasise further product variety. Signs of this can be seen in the return of artisanal employment: the remaking of goods and services such as barbering, coffee roasting, butchery, bartending, carpentry, textiles and ceramics, incorporating elements of craft-based technical skill which are higher-end – and more expensive – than in the past. Workers also draw on deep cultural knowledge about what makes a good or service ‘authentic’ and are able to communicate these values of ‘good’ taste to consumers. These markets benefit from the blurring of tastes between high- and low-brow culture and trends such as reshoring and the importance of localness in production (Ocejo, 2017).
- The craft phenomenon has been attributed, in part, to the consumption preferences of millennials. They may also explain the support we find for occupations such as sports and fitness and therapy. Arguably, these activities represent a broader definition of health – one which seeks to maintain people's wellness through proper nutrition, exercise and mental health rather than than simply to respond to illness through the provision of acute, episodic care.
- Creative, digital, design and engineering occupations generally have a bright outlook. This can be seen from Table 6 but also Table B2 in the Appendix which shows the average probability of increased workforce share across minor occupation groups. These activities are strongly complemented by digital technology but are also ones in which the UK has a comparative advantage and benefits from trends such as urbanisation.
- Although ‘green’ occupations fall slightly below the 0.7 threshold, Table B2 shows that they are projected to grow in share (with a mean probability of 0.62).
A number of other occupation groups have a high probability of experiencing a fall in workforce share, as detailed in Table 7.
Table 7: For the US, the minor occupation groups with the lowest probabilities of future increased demand
We characterise for these occupations the fraction of their current employment that has a probability of increased demand below two thresholds.
| TITLE |
EMPLOYMENT |
<0.3 |
<0.5 |
| Woodworkers |
236,460 |
100% |
100% |
| Printing Workers |
256,040 |
100% |
100% |
| Metal Workers and Plastic Workers |
1,923,050 |
98.7% |
100% |
| Financial Clerks |
3,144,540 |
97.7% |
100% |
| Other Production Occupations |
2,552,400 |
96.9% |
99.4% |
| Plant and System Operators |
311,060 |
94.1% |
100% |
| Assemblers and Fabricators |
1,571,480 |
92.2% |
100% |
| Communications Equipment Operators |
110,250 |
91.2% |
100% |
| Food Processing Workers |
738,030 |
89.1% |
100% |
| Forest, Conservation and Logging Workers, Extraction Workers |
42,740 |
83.9% |
100% |
| Financial Specialists |
561,550 |
81.5% |
100% |
| Rail Transportation Workers |
253,530 |
66.7% |
100% |
| Cooks and Food Preparation Workers |
2,607,770 |
66.3% |
90.7% |
| Sales Representatives, Services |
117,460 |
53.2% |
100% |
| Retail Sales Workers |
3,132,040 |
49.0% |
100% |
| Other Construction and Related Workers |
8,799,240 |
44.9% |
47.6% |
| Water Transportation Workers |
393,710 |
39.8% |
63.2% |
| Vehicle and Mobile Equipment Mechanics, Installers and Repairers |
77,270 |
39.6% |
100% |
| Librarians, Curators and Archivists |
1,554,340 |
38.0% |
99.2% |
| Material Recording, Scheduling, Dispatching, and Distributing Workers |
253,800 |
37.1% |
37.1% |
| Other Installation, Maintenance, and Repair Occupations |
3,973,730 |
32.1% |
97.6% |
| Entertainment Attendants and Related Workers |
2,776,890 |
28.4% |
90% |
| Motor Vehicle Operators |
524,310 |
25.2% |
96.7% |
| Material Moving Workers |
3,797,540 |
24.3% |
100% |
| Other Office and Administrative Support Workers |
4,473,640 |
20.9% |
100% |
| Agricultural Workers |
3,723,230 |
20.2% |
100% |
| Construction Trades Workers |
383,890 |
17.9% |
100% |
| Other Healthcare Support Occupations |
4,076,790 |
8.8% |
35.3% |
| Health Technologists and Technicians |
1,451,710 |
7.5% |
45.7% |
| Information and Record Clerks |
2,909,230 |
6.5% |
56.3% |
| Secretaries and Administrative Assistants |
5,336,050 |
6.4% |
95% |
| Legal Support Workers |
3,680,630 |
5.5% |
100% |
| Electrical and Electronic Equipment Mechanics, Installers and Repairers |
344,220 |
5.1% |
100% |
| Business Operations Specialists |
585,280 |
3.1% |
100% |
| Other Protective Service Workers |
4,424,800 |
2.9% |
22.6% |
| Grounds Maintenance Workers |
1,524,350 |
2.7% |
89.8% |
| Drafters, Engineering Technicians, and Mapping Technicians |
959,960 |
2.5% |
6.7% |
| Life, Physical and Social Science Technicians |
680,790 |
2.2% |
74.3% |
| Other Transportation Workers |
359,460 |
1.8% |
82.7% |
|
305,320 |
1% |
100% |
Table 7 is suggestive of a number of interpretations.
- Technological advancements and globalisation may account for why many manufacturing production occupations are predicted to see a fall in workforce share.
- The predicted decline in the workforce share of administrative, secretarial and, to some extent, sales occupations is also consistent with routine-biased technological change. Customer service jobs which entail social interaction are perhaps harder to reconcile with this framework.
- Skilled trades occupations (SOC 2010 major group 5) exhibit a more heterogeneous pattern. Metal forming, textiles, vehicle trades and, to an extent, construction and building trades are projected to fall in share; by contrast, electrical and electronic trades, food preparation, building finishing and other skilled trades (for example, glass and ceramics makers, decorators and finishers) fare much better (see Table B2). This suggests that there are likely to be pockets of opportunity for those lower down the skills ladder, depending on which choices are made.
6.2. SENSITIVITY ANALYSIS
Firstly, to test for the generalisability of our results, we perform a cross-validation exercise. In particular, we randomly select a reduced training set of half the available data (corresponding to the labels for 15 occupations); the remaining data form a test set. On the test set, we evaluate the receiver operating characteristic (ROC) curve (Murphy, 2012). Given that we observe ternary, as opposed to binary, labels, the ROC curve is a surface (Waegeman et al., 2008). An approximation is made to the volume under the surface (VUS), whereby the area under the curve (AUC) is calculated separately for each ternary component. The volume under the ROC surface is taken to be the mean of the separate AUC slices. As the workshop data or model prediction for an occupation is either an empirical or posterior distribution over ternary labels respectively, samples are drawn and the mean VUS is calculated. Due to uncertainty in the distribution, a normalised VUS is calculated by dividing the test VUS by the ground truth VUS. We repeat this experiment for 50 random splits of the 30 occupations from the workshop set. Each experiment is composed of 10 training occupations and 20 test occupations.
A high AUC/VUS (which ranges from 0.5 to 1) indicates that our model is able to reliably predict 15 occupations given a distinct set of 15 occupations. This would suggest that the model is effective and that the training set is self-consistent. It would also imply a degree of robustness of our results to the inclusion (or exclusion) of a small number of occupations in that training set.
We also investigate how breaks in long-term trends as perceived by the workshop experts contribute to the findings above. We do this by re-running the predictive model but using non-parametric extrapolation (as described in Section 5.6) of occupational employment to label the occupations in place of the experts' judgments.
As examples of extrapolated trends, Figure 5 plots the share of employment extrapolations for three UK occupations, one each for higher, same and lower probability. Figure 6 shows the absolute employment extrapolations for three US occupations, one each for higher, same and lower probability. The shaded areas give the 90% credibility interval around the mean.
Figure 5: Examples of share employment number extrapolations for three UK occupations.
We show occupations with probability of higher, same and lower share in 2030.
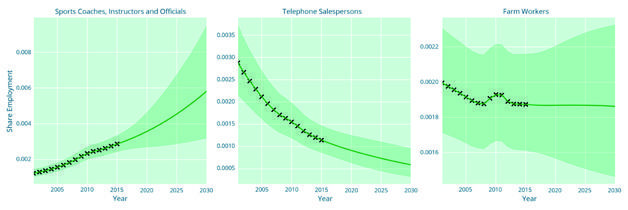
Figure 6: Examples of absolute employment number extrapolations for three US occupations.
We show occupations with probability of higher, same and lower absolute employment numbers in 2030.
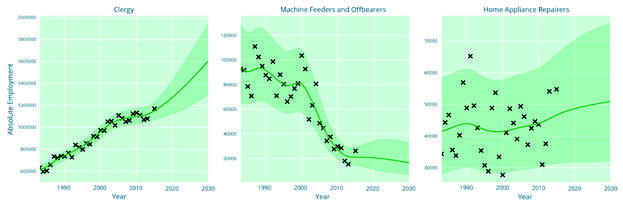
Note that, in what follows, all rankings of occupation groups from our model use the employment-weighted average of probabilities of occupations within the group.
6.2.1. US
Firstly, Table 8 presents the results of our cross-validation exercise on US workshop data. The high VUS results suggest that our model is robust, and that our results are not sensitive to small changes to the training set.
Table 8: The volume under the receiver operating surface from cross-validation of model on US workshop data
| Mean |
Lower Quartile |
Upper Quartile |
| 0.949 |
0.943 |
0.956 |
Table 9 compares the probability of increased demand generated by trend extrapolation against that obtained from the judgment of experts.
Table 9: The percentage point (PP) differences (of trend extrapolation from our workshop-trained predictions) in the probabilities of future demand at minor occupation group level
That is, each row is the probability produced by trend extrapolation minus the probability produced by the workshop, multiplied by 100.
| TITLE |
PP DIFFERENCE IN PROBABILITY OF DEMAND |
| Other Office and Administrative Support Workers |
-52.2 |
| Legal Support Workers |
-47.8 |
| Financial Clerks |
-47.0 |
| Communications Equipment Operators |
-42.2 |
| Financial Specialists |
-39.6 |
| Information and Record Clerks |
-39.2 |
| Secretaries and Administrative Assistants |
-38.7 |
| Sales Representatives, Services |
-35.6 |
| Entertainment Attendants and Related Workers |
-34.4 |
| Retail Sales Workers |
-32.7 |
| Rail Transportation Workers |
-27.7 |
| Motor Vehicle Operators |
-27.5 |
| Other Protective Service Workers |
-27.4 |
| Material Recording, Scheduling, Dispatching and Distributing Worker |
-27.4 |
| Sales Representatives, Wholesale and Manufacturing |
-26.3 |
| Librarians, Curators and Archivists |
-26.2 |
| Supervisors of Transportation and Material Moving Workers |
-26.1 |
| Other Healthcare Support Occupations |
-25.7 |
| Other Transportation Workers |
-25.4 |
| Assemblers and Fabricators |
-24.9 |
| Other Production Occupations |
-23.6 |
| Lawyers, Judges and Related Workers |
-23.1 |
| Baggage Porters, Bellhops and Concierges |
-22.8 |
| Food and Beverage Serving Workers |
-22.8 |
| Supervisors of Office and Administrative Support Workers |
-22.4 |
| Printing Workers |
-22.1 |
| Forest, Conservation and Logging Workers |
-21.6 |
| Health Technologists and Technicians |
-21.2 |
| Food Processing Workers |
-21.1 |
| Supervisors of Sales Workers |
-20.7 |
| Operations Specialties Managers |
-20.4 |
| Supervisors of Personal Care and Service Workers |
-20.3 |
| Cooks and Food Preparation Workers |
-20.2 |
| Top Executives |
-19.7 |
| Supervisors of Food Preparation and Serving Workers |
-19.6 |
| Religious Workers |
-19.3 |
| Other Sales and Related Workers |
-19.2 |
| Other Construction and Related Workers |
-19.2 |
| Media and Communication Workers |
-18.9 |
| Plant and System Operators |
-18.7 |
| Law Enforcement Workers |
-18.5 |
| Business Operations Specialists |
-18.1 |
| Textile, Apparel and Furnishings Workers |
-18.1 |
| Counselors, Social Workers and Other Community and Social Service Specialists |
-18.0 |
| Extraction Workers |
-17.9 |
| Material Moving Workers |
-17.2 |
| Other Management Occupations |
-17.1 |
| Metal Workers and Plastic Worker |
-17.1 |
| Supervisors of Production Workers |
-16.8 |
| Water Transportation Workers |
-16.3 |
| Fishing and Hunting Workers |
-15.9 |
| Tour and Travel Guide |
-15.8 |
| Nursing, Psychiatric and Home Health Aides |
-15.6 |
| Other Teachers and Instructors |
-15.4 |
| Health Diagnosing and Treating Practitioners |
-15.4 |
| Social Scientists and Related Workers |
-15.2 |
| Supervisors of Protective Service Workers |
-15.2 |
| Woodworkers |
-15.1 |
| Vehicle and Mobile Equipment Mechanics, Installers and Repairers |
-14.8 |
| Media and Communication Equipment Workers |
-14.5 |
| Agricultural Workers |
-14.4 |
| Other Food Preparation and Serving Related Workers |
-14.4 |
| Supervisors of Construction and Extraction Workers |
-14.2 |
| Occupational Therapy and Physical Therapist Assistants and Aides |
-14.1 |
| Supervisors of Building and Grounds Cleaning and Maintenance Workers |
-13.9 |
| Advertising, Marketing, Promotions, Public Relations and Sales Managers |
-13.8 |
| Other Education, Training and Library Occupations |
-13.7 |
| Life, Physical and Social Science Technicians |
-13.6 |
| Supervisors of Farming, Fishing and Forestry Workers |
-13.5 |
| Air Transportation Workers |
-13.4 |
| Other Healthcare Practitioners and Technical Occupations |
-13.3 |
| Preschool, Primary, Secondary and Special Education School Teachers |
-12.2 |
| Other Personal Care and Service Workers |
-11.9 |
| Fire Fighting and Prevention Workers |
-10.9 |
| Entertainers and Performers, Sports and Related Workers |
-10.8 |
| Funeral Service Workers |
-10.6 |
| Other Installation, Maintenance and Repair Occupations |
-10.4 |
| Construction Trades Workers |
-9.9 |
| Drafters, Engineering Technicians and Mapping Technicians |
-8.4 |
| Electrical and Electronic Equipment Mechanics, Installers and Repairers |
-7.8 |
| Life Scientists |
-7.3 |
| Art and Design Workers |
-6.8 |
| Helpers, Construction Trades |
-6.5 |
| Supervisors of Installation, Maintenance and Repair Workers |
-5.9 |
| Architects, Surveyors and Cartographers |
-5.8 |
| Mathematical Science Occupations |
-4.5 |
| Computer Occupations |
-4.2 |
| Grounds Maintenance Workers |
-3.5 |
| Post-secondary Teachers |
-3.3 |
| Physical Scientists |
-1.9 |
| Personal Appearance Workers |
-1.0 |
| Building Cleaning and Pest Control Workers |
4.2 |
| Animal Care and Service Workers |
4.4 |
| Engineers |
8.8 |
Table 10 further ranks occupation groups, using the same intermediate aggregation of major groups as described in Section 6.1, by their probability of rising demand using our expert judgment training set. It compares these against rankings based on independent quantitative forecasts for the year 2024 from the US BLS. (See Table A1 in the Appendix for major group rankings).
Table 10: Relative rankings of intermediate aggregation of major occupation groups in the US by our model, and by independent forecasts from the BLS
| RANKING FROM EXPERT JUDGEMENT |
RANKING FROM BLS PROJECTIONS 2014–2024 |
| Education, Legal, Community Service, Arts and Media Occupations |
Healthcare Practitioners and Technical Occupations |
| Computer, Engineering and Science Occupations |
Construction and Extraction Occupations |
| Healthcare Practitioners and Technical Occupations |
Service Occupations |
| Management, Business and Financial Occupations |
Computer, Engineering and Science Occupations |
| Construction and Extraction Occupations |
Education, Legal, Community Service, Arts and Media Occupations |
| Service Occupations |
Management, Business and Financial Occupations |
| Sales and Related Occupations |
Installation, Maintenance and Repair Occupations |
| Farming, Fishing and Forestry Occupations |
Sales and Related Occupations |
| Installation, Maintenance and Repair Occupations |
Transportation and Material Moving Occupations |
| Office and Administrative Support Occupations |
Office and Administrative Support Occupations |
| Transportation and Material Moving Occupations |
Production Occupations |
| Production Occupations |
Farming, Fishing and Forestry Occupations |
Tables 9 and 10 reveal the following insights.
- Firstly, Table 9 makes it clear that expert judgment is considerably more pessimistic than trend extrapolation for most minor occupation groups. (This can also be seen by inspecting the distribution of current employment over its probability of future demand under trend extrapolation in Figure A1 in the Appendix and comparing it with Figure 3). The divergence is largest for routine cognitive, as opposed to routine manual, occupations.
- We see considerable divergence across the three outlooks (our workshop-informed model, our trend extrapolation, and the BLS projection). This is arguably most marked for occupations in legal, architecture and engineering and arts, design, entertainment, and sports and media. There is seemingly greater agreement, however, over occupations projected to decline in workforce share.
6.2.2. UK
We begin by detailing in Table 11 the VUS scores from our cross-validation exercise on UK workshop data. Again, the high results give some reassurance both that the model is robust and that the results are not sensitive to minor alterations to the choice of occupations in the training set.
Table 11: The volume under the receiver operating surface from cross-validation of model on UK workshop data
| Mean |
Lower Quartile |
Upper Quartile |
| 0.946 |
0.938 |
0.954 |
Table 12 compares the probability of rising workforce share generated by trend extrapolation versus the judgment of experts.
As with the US, although to a lesser degree, it shows that expert judgement is more pessimistic than trend extrapolation for most minor occupation groups. (This can also be seen in the distribution of current employment over its probability of future demand under trend extrapolation in Figure A2 in the Appendix and comparing it with Figure 4). Expert judgement is particularly more pessimistic about management and supervision roles. There are few cases where the experts are more optimistic than trend extrapolation – construction and related occupations (not supervisors) are the main exception.
Table 12: The percentage point (PP) differences (of trend extrapolation from our workshop-trained predictions) in the probabilities of future demand at minor occupation group level.
Each row is the probability produced by trend extrapolation minus the probability produced by the workshop, multiplied by 100.
| OCCUPATION TITLE |
PP DIFFERENCE IN PROBABILITY OF DEMAND |
| Construction and Building Trades Supervisors |
-38.2 |
| Skilled Metal, Electrical and Electronic Trades Supervisors |
-31.9 |
| Production Managers and Directors |
-31.6 |
| Managers and Directors in Transport and Logistics |
-27.8 |
| Mobile Machine Drivers and Operatives |
-25.1 |
| Sales Supervisors |
-24.6 |
| Managers and Directors in Retail and Wholesale |
-24.6 |
| Senior Officers in Protective Services |
-24.5 |
| Administrative Occupations: Office Managers and Supervisors |
-24.0 |
| Elementary Storage Occupations |
-23.1 |
| Conservation and Environmental Associate Professionals |
-21.4 |
| Agricultural and Related Trades |
-20.9 |
| Other Drivers and Transport Operatives |
-20.9 |
| Chief Executives and Senior Officials |
-20.4 |
| Managers and Proprietors in Agriculture-related Services |
-20.4 |
| Elementary Sales Occupations |
-19.9 |
| Financial institution Managers and Directors |
-19.1 |
| Sales, Marketing and Related Associate Professionals |
-19.0 |
| Public Services and Other Associate Professionals |
-19.0 |
| Cleaning and Housekeeping Managers and Supervisors |
-18.4 |
| Functional Managers and Directors |
-17.9 |
| Administrative Occupations: Finance |
-17.3 |
| Managers and Proprietors in Hospitality and Leisure Services |
-17.3 |
| Elementary Administration Occupations |
-16.9 |
| Conservation and Environment Professionals |
-16.6 |
| Food Preparation and Hospitality Trades |
-16.4 |
| Legal Professionals |
-16.2 |
| Process Operatives |
-16.2 |
| Managers and Proprietors in Health and Care Services |
-15.6 |
| Managers and Proprietors in Other Services |
-15.4 |
| Architects, Town Planners and Surveyors |
-15.0 |
| Transport Associate Professionals |
-15.0 |
| Protective Service Occupations |
-15.0 |
| Elementary Cleaning Occupations |
-14.8 |
| Sales Assistants and Retail Cashiers |
-14.7 |
| Health and Social Services Managers and Directors |
-14.6 |
| Business, Research and Administrative Professionals |
-14.2 |
| Administrative Occupations: Records |
-13.7 |
| Other Administrative Occupations |
-13.4 |
| Elementary Agricultural Occupations |
-12.7 |
| Elementary Process Plant Occupations |
-12.6 |
| Hairdressers and Related Services |
-12.0 |
| Sales-related Occupations |
-11.7 |
| Business, Finance and Related Associate Professionals |
-11.6 |
| Engineering Professionals |
-10.4 |
| Assemblers and Routine Operatives |
-10.2 |
| Animal Care and Control Services |
-9.9 |
| Quality and Regulatory Professionals |
-9.7 |
| Housekeeping and Related Services |
-9.6 |
| Road Transport Drivers |
-9.6 |
| Other Elementary Services Occupations |
-9.5 |
| Customer Service Occupations |
-9.5 |
| Administrative Occupations: Government and Related Organisations |
-8.9 |
| Elementary Security Occupations |
-8.1 |
| Secretarial and Related Occupations |
-7.9 |
| Research and Development Managers |
-7.5 |
| Customer Service Managers and Supervisors |
-7.2 |
| Leisure and Travel Services |
-5.9 |
| Natural and Social Science Professionals |
-5.8 |
| Legal Associate Professionals |
-5.6 |
| Librarians and Related Professionals |
-4.8 |
| Welfare and Housing Associate Professionals |
-4.6 |
| Sports and Fitness Occupations |
-4.3 |
| Information Technology and Telecommunications Professionals |
-3.8 |
| Textiles and Garments Trades |
-2.7 |
| Caring Personal Services |
-2.2 |
| Printing Trades |
-1.9 |
| Welfare Professionals |
-1.8 |
| Artistic, Literary and Media Occupations |
-1.7 |
| Media Professionals |
-1.5 |
| Plant and Machine Operatives |
-1.0 |
| Information Technology Technicians |
-1.0 |
| Teaching and Educational Professionals |
-0.7 |
| Health Associate Professionals |
0.0 |
| Nursing and Midwifery Professionals |
0.0 |
| Design Occupations |
0.4 |
| Science, Engineering and Production Technicians |
0.7 |
| Other Skilled Trades |
0.9 |
| Health Professionals |
2.0 |
| Construction Operatives |
3.2 |
| Vehicle Trades |
4.4 |
| Childcare and Related Personal Services |
5.2 |
| Metal Machining, Fitting and Instrument-making Trades |
5.6 |
| Metal Forming, Welding and Related Trades |
7.2 |
| Building Finishing Trades |
9.2 |
| Therapy Professionals |
10.8 |
| Elementary Construction Occupations |
14.6 |
| Construction and Building Trades |
15.6 |
| Draughtspersons and Related Architectural Technicians |
20.3 |
| Electrical and Electronic Trades |
22.6 |
Table 13 ranks major occupation groups by their probability of rising demand using our expert judgement training set, and compares against rankings based on independent quantitative forecasts for the year 2024 from the former UK Commission for Employment and Skills (UKCES).
We comment on the rankings provided by our model and the UKCES, as described in Table 13.
- The rankings are broadly consistent across the two outlooks. However, there are important exceptions when we drill down and examine minor group or three-digit occupations (see Table A2 in the Appendix for sub-major group rankings).
- One difference is that the experts are a little less confident about rising demand for customer service occupations. This places them closer to the results found in Frey and Osborne (2017).
- Our approach also reflects less optimism about occupations relating to personal care. While this may seem difficult to reconcile with an ageing population (care workers and home carers being the largest occupation within this group), it may also reflect uncertainty over the fact that people are working longer and leading healthier, more independent lives – a theme and tension which ran through the UK workshop discussions. Another difference is that our expert-informed model is more optimistic than UKCES on the prospects for certain medium-skilled jobs for example, skilled metal, electrical and electronic trades and textiles, printing and other skilled trades – areas where apprenticeships have traditionally been an important route to entry.
- Our model is also more optimistic about culture, media and sports, teaching and educational professionals and science, research, engineering and technology occupations than UKCES.
Table 13: Relative rankings of major occupation groups in the UK by our model, trained on expert judgement, and by independent forecasts from the UKCES
| RANKING FROM EXPERT JUDGEMENT |
RANKING FROM UKCES PROJECTIONS 2014–2024 |
| Professional Occupations |
Managers, Directors and Senior Officials |
| Managers, Directors and Senior Officials |
Professional Occupations |
| Associate Professional and Technical Occupations |
Caring, Leisure and Other Service Occupations |
| Caring, Leisure and Other Service Occupations |
Associate Professional and Technical Occupations |
| Skilled Trades Occupations |
Elementary Occupations |
| Elementary Occupations |
Sales and Customer Service Occupations |
| Administrative and Secretarial Occupations |
Skilled Trades Occupations |
| Sales and Customer Service Occupations |
Process, Plant and Machine Operatives |
| Process, Plant and Machine Operatives |
Administrative and Secretarial Occupations |
6.3. SKILLS
We now describe the findings of our study on the relationships between O*NET variables (which we refer to as 'features' and occasionally informally refer to as 'skills') and future demand. Note that our methodology (see Section 5.4) provides employment-weighted results: as such, all the results that follow are robust to outlying occupations with small employment.
We use two measures of the importance of features to future demand: the Pearson correlation coefficient (Section 5.4.1) and the average derivative (Section 5.4.2). In interpreting the values of these measures, note firstly that the correlation coefficient lies between -1 and 1. The average derivative is calculated by considering the derivative of an unobservable real-valued function linked to demand. It is dimensionless; an average derivative's magnitude is significant only relative to that of another average derivative. For either measure, positive values are associated with features whose increase is expected to increase demand, and negative values with features whose increase is expected to decrease demand.
As described in Section 5.4.2, we exclude especially noisy features from consideration under the average derivative measure.
For both the UK and US, these variables are:
- Perceptual Speed (Abilities);
- Building and Construction (Knowledge);
- Food Production (Knowledge);
- Production and Processing (Knowledge);
- Control Precision (Abilities);
- Biology (Knowledge); and
- Fine Arts (Knowledge).
Note that the excluded variables are predominately knowledge features. The significance of knowledge, perhaps more than other features differs considerably across occupations. It is hence not surprising that these features are more likely to be less reliable than others under the average derivative metric.
6.3.1. US
Table 14: A ranking, by Pearson correlation, of the importance of O*NET variables to future demand for US occupations
| RANK |
O*NET VARIABLE |
CLASS |
PEARSON CORRELATION |
| 1 |
Learning Strategies |
Skills |
0.632 |
| 2 |
Psychology |
Knowledge |
0.613 |
| 3 |
Instructing |
Skills |
0.609 |
| 4 |
Social Perceptiveness |
Skills |
0.605 |
| 5 |
Sociology and Anthropology |
Knowledge |
0.603 |
| 6 |
Education and Training |
Knowledge |
0.602 |
| 7 |
Coordination |
Skills |
0.571 |
| 8 |
Originality |
Abilities |
0.570 |
| 9 |
Fluency of Ideas |
Abilities |
0.562 |
| 10 |
Active Learning |
Skills |
0.534 |
| 11 |
Therapy and Counseling |
Knowledge |
0.531 |
| 12 |
Philosophy and Theology |
Knowledge |
0.526 |
| 13 |
Speaking |
Skills |
0.514 |
| 14 |
Service Orientation |
Skills |
0.511 |
| 15 |
Active Listening |
Skills |
0.507 |
| 16 |
Complex Problem Solving |
Skills |
0.502 |
| 17 |
Oral Expression |
Abilities |
0.493 |
| 18 |
Communications and Media |
Knowledge |
0.491 |
| 19 |
Speech Clarity |
Abilities |
0.489 |
| 20 |
Judgment and Decision-making |
Skills |
0.482 |
| 21 |
English Language Knowledge |
Knowledge |
0.474 |
| 22 |
Monitoring |
Skills |
0.470 |
| 23 |
Deductive Reasoning |
Abilities |
0.468 |
| 24 |
Oral Comprehension |
Abilities |
0.465 |
| 25 |
Critical Thinking |
Skills |
0.462 |
| 26 |
Systems Evaluation |
Skills |
0.461 |
| 27 |
History and Archeology |
Knowledge |
0.452 |
| 28 |
Inductive Reasoning |
Abilities |
0.448 |
| 29 |
Persuasion Skills |
Skills |
0.443 |
| 30 |
Speech Recognition |
Abilities |
0.436 |
| 31 |
Science |
Skills |
0.431 |
| 32 |
Negotiation |
Skills |
0.419 |
| 33 |
Management of Personnel Resources |
Skills |
0.418 |
| 34 |
Systems Analysis |
Skills |
0.415 |
| 35 |
Problem Sensitivity |
Abilities |
0.414 |
| 36 |
Writing |
Skills |
0.407 |
| 37 |
Operations Analysis |
Skills |
0.395 |
| 38 |
Administration and Management |
Knowledge |
0.388 |
| 39 |
Biology |
Knowledge |
0.388 |
| 40 |
Fine Arts |
Knowledge |
0.385 |
| 41 |
Reading Comprehension |
Skills |
0.374 |
| 42 |
Memorization |
Abilities |
0.372 |
| 43 |
Time Management |
Skills |
0.360 |
| 44 |
Foreign Language |
Knowledge |
0.359 |
| 45 |
Written Expression |
Abilities |
0.351 |
| 46 |
Medicine and Dentistry |
Knowledge |
0.348 |
| 47 |
Technology Design |
Skills |
0.345 |
| 48 |
Personnel and Human Resources |
Knowledge |
0.344 |
| 49 |
Written Comprehension |
Abilities |
0.341 |
| 50 |
Information Ordering |
Abilities |
0.328 |
| 51 |
Time Sharing |
Abilities |
0.316 |
| 52 |
Geography |
Knowledge |
0.310 |
| 53 |
Law and Government |
Knowledge |
0.309 |
| 54 |
Customer and Personal Service |
Knowledge |
0.291 |
| 55 |
Category Flexibility |
Abilities |
0.284 |
| 56 |
Speed of Closure |
Abilities |
0.268 |
| 57 |
Management of Material Resources |
Skills |
0.262 |
| 58 |
Chemistry |
Knowledge |
0.192 |
| 59 |
Public Safety and Security |
Knowledge |
0.189 |
| 60 |
Telecommunications |
Knowledge |
0.189 |
| 61 |
Computers and Electronics |
Knowledge |
0.186 |
| 62 |
Management of Financial Resources |
Skills |
0.160 |
| 63 |
Design |
Knowledge |
0.146 |
| 64 |
Flexibility of Closure |
Abilities |
0.133 |
| 65 |
Physics |
Knowledge |
0.126 |
| 66 |
Programming |
Skills |
0.122 |
| 67 |
Engineering and Technology |
Knowledge |
0.121 |
| 68 |
Visualization |
Abilities |
0.120 |
| 69 |
Sales and Marketing |
Knowledge |
0.118 |
| 70 |
Far Vision |
Abilities |
0.105 |
| 71 |
Explosive Strength |
Abilities |
0.099 |
| 72 |
Building and Construction |
Knowledge |
0.078 |
| 73 |
Selective Attention |
Abilities |
0.069 |
| 74 |
Clerical Knowledge |
Knowledge |
0.047 |
| 75 |
Auditory Attention |
Abilities |
0.036 |
| 76 |
Economics and Accounting |
Knowledge |
0.036 |
| 77 |
Mathematical Reasoning |
Abilities |
0.035 |
| 78 |
Near Vision |
Abilities |
0.016 |
| 79 |
Mathematics – Skills |
Skills |
0.008 |
| 80 |
Transportation |
Knowledge |
0.004 |
| 81 |
Mathematics – Knowledge |
Knowledge |
-0.006 |
| 82 |
Number Facility |
Abilities |
-0.022 |
| 83 |
Dynamic Flexibility |
Abilities |
-0.023 |
| 84 |
Quality Control Analysis |
Skills |
-0.028 |
| 85 |
Stamina |
Abilities |
-0.033 |
| 86 |
Food Production |
Knowledge |
-0.034 |
| 87 |
Trunk Strength |
Abilities |
-0.039 |
| 88 |
Gross Body Coordination |
Abilities |
-0.059 |
| 89 |
Gross Body Equilibrium |
Abilities |
-0.063 |
| 90 |
Visual Color Discrimination |
Abilities |
-0.081 |
| 91 |
Installation |
Skills |
-0.082 |
| 92 |
Dynamic Strength |
Abilities |
-0.111 |
| 93 |
Troubleshooting |
Skills |
-0.114 |
| 94 |
Extent Flexibility |
Abilities |
-0.129 |
| 95 |
Equipment Selection |
Skills |
-0.141 |
| 96 |
Static Strength |
Abilities |
-0.142 |
| 97 |
Hearing Sensitivity |
Abilities |
-0.142 |
| 98 |
Mechanical |
Knowledge |
-0.152 |
| 99 |
Perceptual Speed |
Abilities |
-0.168 |
| 100 |
Depth Perception |
Abilities |
-0.173 |
| 101 |
Speed of Limb Movement |
Abilities |
-0.185 |
| 102 |
Spatial Orientation |
Abilities |
-0.198 |
| 103 |
Sound Localization |
Abilities |
-0.207 |
| 104 |
Multilimb Coordination |
Abilities |
-0.219 |
| 105 |
Production and Processing |
Knowledge |
-0.239 |
| 106 |
Operation Monitoring |
Skills |
-0.242 |
| 107 |
Night Vision |
Abilities |
-0.244 |
| 108 |
Peripheral Vision |
Abilities |
-0.246 |
| 109 |
Glare Sensitivity |
Abilities |
-0.247 |
| 110 |
Repairing |
Skills |
-0.259 |
| 111 |
Response Orientation |
Abilities |
-0.282 |
| 112 |
Equipment Maintenance |
Skills |
-0.284 |
| 113 |
Arm-Hand Steadiness |
Abilities |
-0.297 |
| 114 |
Reaction Time |
Abilities |
-0.322 |
| 115 |
Operation and Control |
Skills |
-0.326 |
| 116 |
Finger Dexterity |
Abilities |
-0.354 |
| 117 |
Manual Dexterity |
Abilities |
-0.365 |
| 118 |
Rate Control |
Abilities |
-0.394 |
| 119 |
Wrist-Finger Speed |
Abilities |
-0.423 |
| 120 |
Control Precision |
Abilities |
-0.466 |
Figure 7: The 10 most important O*NET features as ranked by Pearson correlation for the US
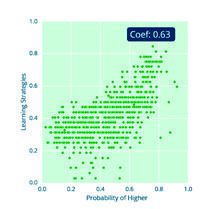
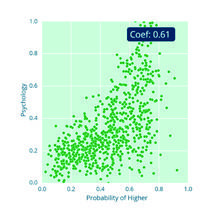
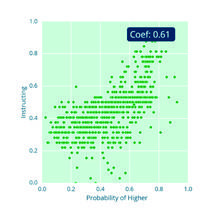
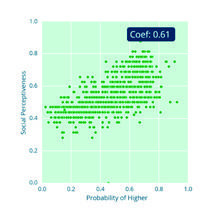
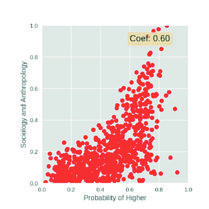
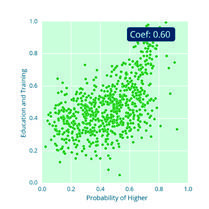
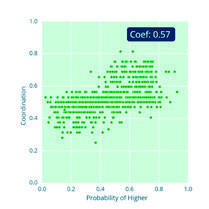
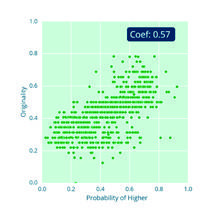
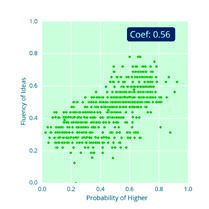
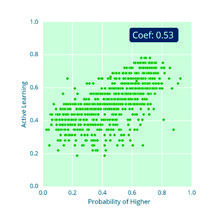
Figure 8: The 10 least important O*NET features as ranked by Pearson correlation for the US
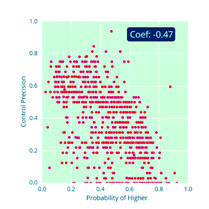
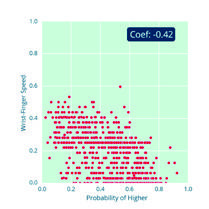
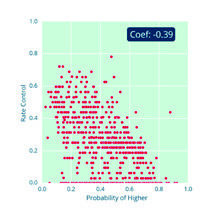
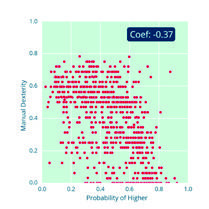
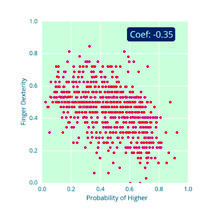
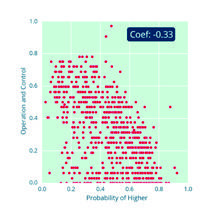
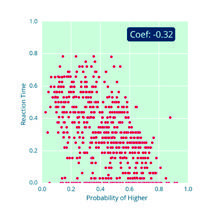
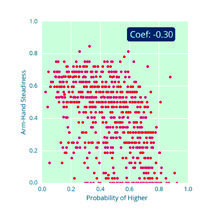
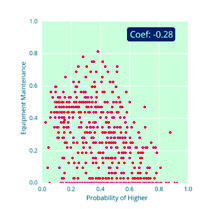
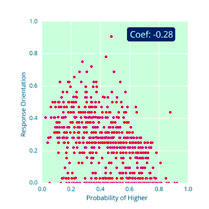
Table 14 ranks, by Pearson correlation coefficient, all 120 variables according to their association with a rising occupation workforce share (in declining order of strength). Figures 7 and 8 plot, respectively, the top and bottom ten O*NET variables as ranked by Pearson correlation. Table C1 in the Appendix also provides aggregate rankings for the average derivative.
- As in the US, the results confirm the importance of 21st century skills in the US, with a particularly strong emphasis on interpersonal competencies. This is underscored by the presence of skills such as Instructing, Social Perceptiveness and Coordination, and related knowledge domains such as Psychology and Sociology and Anthropology.
- Interestingly, systems skills, relatively underexplored in the literature, all feature in the top 10. Systems thinking emphasises the ability to recognise and understand socio-technical systems - their interconnections and feedback effects - and choose appropriate actions in light of them. It marks a shift from more reductionist and mechanistic forms of analysis and lends itself to pedagogical approaches such as game design and case method with evidence that it can contribute to interdisciplinary learning (Tekinbas et al., 2014; Capra and Luisi, 2014; Arnold and Wade, 2015).
- The combined importance of these skills and interpersonal skills supports the view that the demand for collaborative problem-solving skills may experience higher growth in the future (Nesta, 2017).
- Knowledge fields such as English language, Administration and Management, Sociology and Anthropology and Education and Training are all associated strongly with occupations predicted to see a rise in workforce share, again highlighting the importance of generic knowledge requirements.
- Like the US results, psychomotor and physical abilities, including Manual Dexterity and Finger Dexterity are strongly associated with occupations with a falling workforce share.
- Also as in the US results, correlations for skills, knowledge areas and abilities associated with a rising occupation workforce share are stronger than those associated with a falling occupation workforce share.
6.3.2. UK
Table 15: A ranking, by Pearson correlation, of the importance of O*NET variables to future demand for UK occupations
| RANK |
O*NET VARIABLE |
CLASS |
PEARSON CORRELATION |
| 1 |
Judgment and Decision-Making |
Skills |
0.752 |
| 2 |
Fluency of Ideas |
Abilities |
0.732 |
| 3 |
Active Learning |
Skills |
0.721 |
| 4 |
Learning Strategies |
Skills |
0.715 |
| 5 |
Originality Abilities |
Abilities |
0.710 |
| 6 |
Systems Evaluation |
Skills |
0.703 |
| 7 |
Deductive Reasoning |
Abilities |
0.672 |
| 8 |
Complex Problem Solving |
Skills |
0.671 |
| 9 |
Systems Analysis |
Skills |
0.670 |
| 10 |
Monitoring |
Skills |
0.663 |
| 11 |
Critical Thinking |
Skills |
0.658 |
| 12 |
Instructing |
Skills |
0.657 |
| 13 |
Education and Training |
Knowledge |
0.636 |
| 14 |
Management of Personnel Resources |
Skills |
0.635 |
| 15 |
Coordination |
Skills |
0.620 |
| 16 |
Inductive Reasoning |
Abilities |
0.611 |
| 17 |
Problem Sensitivity |
Abilities |
0.601 |
| 18 |
Information Ordering |
Abilities |
0.575 |
| 19 |
Active Listening |
Skills |
0.571 |
| 20 |
Administration and Management |
Knowledge |
0.559 |
| 21 |
Social Perceptiveness |
Skills |
0.556 |
| 22 |
Operations Analysis |
Skills |
0.555 |
| 23 |
Psychology |
Skills |
0.551 |
| 24 |
Time Management |
Skills |
0.550 |
| 25 |
Oral Comprehension |
Abilities |
0.545 |
| 26 |
Memorization |
Abilities |
0.530 |
| 27 |
Speaking |
Skills |
0.528 |
| 28 |
Oral Expression |
Abilities |
0.526 |
| 29 |
Category Flexibility |
Abilities |
0.520 |
| 30 |
Sociology and Anthropology |
Knowledge |
0.516 |
| 31 |
Speed of Closure |
Abilities |
0.504 |
| 32 |
Science |
Skills |
0.502 |
| 33 |
Writing |
Skills |
0.492 |
| 34 |
English Language |
Knowledge |
0.491 |
| 35 |
Written Comprehension |
Abilities |
0.481 |
| 36 |
Personnel and Human Resources |
Knowledge |
0.476 |
| 37 |
Persuasion |
Skills |
0.467 |
| 38 |
Reading Comprehension |
Skills |
0.465 |
| 39 |
Communications and Media |
Knowledge |
0.463 |
| 40 |
Management of Material Resources |
Skills |
0.462 |
| 41 |
Time Sharing |
Abilities |
0.452 |
| 42 |
Speech Recognition |
Abilities |
0.446 |
| 43 |
Negotiation |
Skills |
0.443 |
| 44 |
Speech Clarity |
Abilities |
0.440 |
| 45 |
Written Expression |
Abilities |
0.439 |
| 46 |
Technology Design |
Skills |
0.420 |
| 47 |
History and Archeology |
Knowledge |
0.415 |
| 48 |
Flexibility of Closure |
Abilities |
0.412 |
| 49 |
Biology |
Knowledge |
0.408 |
| 50 |
Management of Financial Resources |
Skills |
0.402 |
| 51 |
Fine Arts |
Knowledge |
0.394 |
| 52 |
Philosophy and Theology |
Knowledge |
0.393 |
| 53 |
Therapy and Counseling |
Knowledge |
0.383 |
| 54 |
Mathematics – Skills |
Skills |
0.382 |
| 55 |
Mathematical Reasoning |
Abilities |
0.380 |
| 56 |
Service Orientation |
Skills |
0.379 |
| 57 |
Law and Government |
Knowledge |
0.357 |
| 58 |
Programming |
Skills |
0.337 |
| 59 |
Number Facility |
Abilities |
0.335 |
| 60 |
Computers and Electronics |
Knowledge |
0.334 |
| 61 |
Geography |
Knowledge |
0.319 |
| 62 |
Economics and Accounting |
Knowledge |
0.306 |
| 63 |
Mathematics – Knowledge |
Knowledge |
0.304 |
| 64 |
Visualization |
Abilities |
0.300 |
| 65 |
Medicine and Dentistry |
Knowledge |
0.289 |
| 66 |
Near Vision |
Abilities |
0.258 |
| 67 |
Chemistry |
Knowledge |
0.248 |
| 68 |
Design |
Knowledge |
0.246 |
| 69 |
Sales and Marketing |
Knowledge |
0.242 |
| 70 |
Customer and Personal Service |
Knowledge |
0.236 |
| 71 |
Foreign Language |
Knowledge |
0.235 |
| 72 |
Physics |
Knowledge |
0.227 |
| 73 |
Selective Attention |
Abilities |
0.224 |
| 74 |
Perceptual Speed |
Abilities |
0.216 |
| 75 |
Engineering and Technology |
Knowledge |
0.212 |
| 76 |
Telecommunications |
Knowledge |
0.207 |
| 77 |
Food Production |
Knowledge |
0.175 |
| 78 |
Quality Control Analysis |
Skills |
0.143 |
| 79 |
Far Vision |
Abilities |
0.141 |
| 80 |
Auditory Attention |
Abilities |
0.099 |
| 81 |
Public Safety and Security |
Knowledge |
0.083 |
| 82 |
Building and Construction |
Knowledge |
0.069 |
| 83 |
Visual Color Discrimination |
Abilities |
0.058 |
| 84 |
Clerical |
Knowledge |
0.057 |
| 85 |
Production and Processing |
Knowledge |
0.039 |
| 86 |
Hearing Sensitivity |
Abilities |
-0.043 |
| 87 |
Installation |
Skills |
-0.055 |
| 88 |
Transportation |
Knowledge |
-0.091 |
| 89 |
Mechanical |
Knowledge |
-0.102 |
| 90 |
Troubleshooting |
Skills |
-0.112 |
| 91 |
Explosive Strength |
Abilities |
-0.113 |
| 92 |
Operation Monitoring |
Skills |
-0.117 |
| 93 |
Equipment Selection |
Skills |
-0.118 |
| 94 |
Gross Body Equilibrium |
Abilities |
-0.123 |
| 95 |
Depth Perception |
Abilities |
-0.124 |
| 96 |
Wrist-Finger Speed |
Abilities |
-0.127 |
| 97 |
Trunk Strength |
Abilities |
-0.141 |
| 98 |
Gross Body Coordination |
Abilities |
-0.145 |
| 99 |
Stamina |
Abilities |
-0.175 |
| 100 |
Finger Dexterity |
Abilities |
-0.184 |
| 101 |
Repairing |
Skills |
-0.199 |
| 102 |
Arm-Hand Steadiness |
Abilities |
-0.209 |
| 103 |
Spatial Orientation |
Abilities |
-0.212 |
| 104 |
Extent Flexibility |
Abilities |
-0.221 |
| 105 |
Dynamic Strength |
Abilities |
-0.221 |
| 106 |
Equipment Maintenance |
Skills |
-0.222 |
| 107 |
Dynamic Flexibility |
Abilities |
-0.224 |
| 108 |
Speed of Limb Movement |
Abilities |
-0.225 |
| 109 |
Response Orientation |
Abilities |
-0.231 |
| 110 |
Reaction Time |
Abilities |
-0.236 |
| 111 |
Glare Sensitivity |
Abilities |
-0.243 |
| 112 |
Sound Localization |
Abilities |
-0.245 |
| 113 |
Operation and Control |
Skills |
-0.249 |
| 114 |
Night Vision |
Abilities |
-0.260 |
| 115 |
Multilimb Coordination |
Abilities |
-0.266 |
| 116 |
Peripheral Vision |
Abilities |
-0.268 |
| 117 |
Rate Control |
Abilities |
-0.271 |
| 118 |
Manual Dexterity |
Abilities |
-0.314 |
| 119 |
Static Strength |
Abilities |
-0.317 |
| 120 |
Control Precision |
Abilities |
-0.383 |
Figure 9: The 10 most important O*NET features as ranked by Pearson correlation for the UK
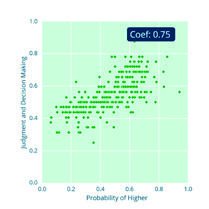
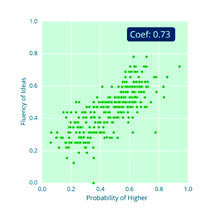
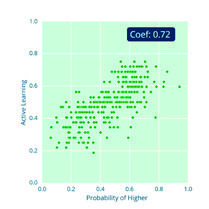
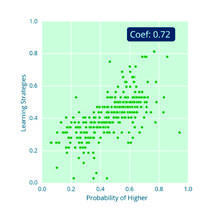
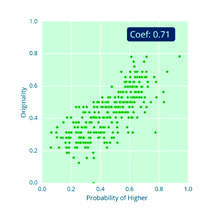
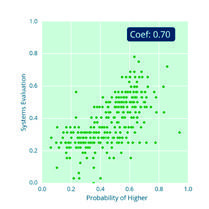
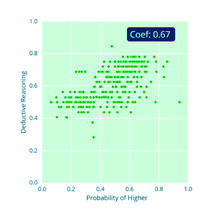
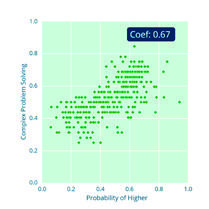
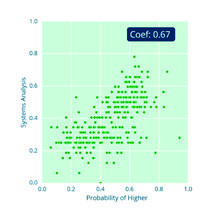
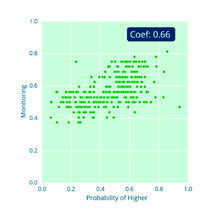
Figure 10: The 10 least important O*NET features as ranked by Pearson correlation for the UK
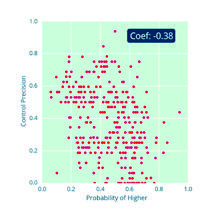
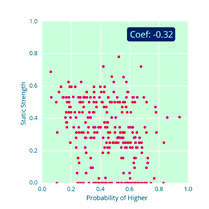
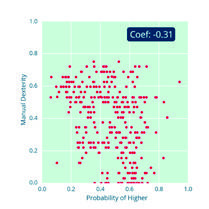
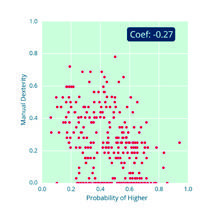
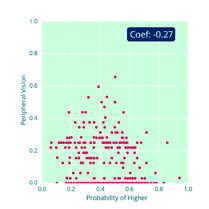
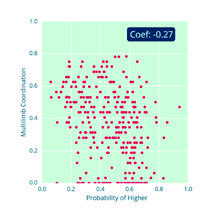
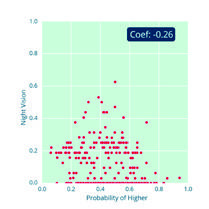
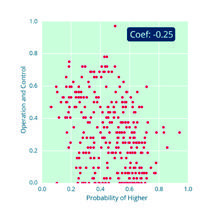
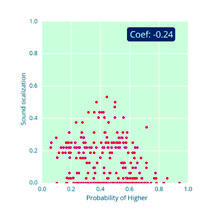
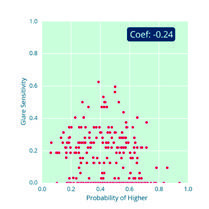
Table 15 ranks, by Pearson correlation coefficient, all 120 variables according to their association with a rising occupation workforce share (in declining order of strength). Figures 9 and 10 plot the top and bottom 10 O*NET variables as ranked by Pearson correlation. Table C2 in the Appendix also provides aggregate rankings for the average derivative.
- As in the US, the results confirm the importance of 21st century skills, though now with a particularly strong emphasis on cognitive competencies and learning strategies.
- Interestingly, systems skills, relatively underexplored in the literature, all feature in the top 10. Systems thinking emphasises the ability to recognise and understand socio-technical systems - their interconnections and feedback effects - and choose appropriate actions in light of them. It marks a shift from more reductionist and mechanistic forms of analysis and lends itself to pedagogical approaches such as game design and case method with evidence that it can contribute to interdisciplinary learning (Tekinbas et al., 2014; Capra and Luisi, 2014; Arnold and Wade, 2015).
- The combined importance of these skills and interpersonal skills supports the view that the demand for collaborative problem-solving skills may experience higher growth in the future (Nesta, 2017).
- Knowledge fields such as English language, Administration and Management, Sociology and Anthropology and Education and Training are all associated strongly with occupations predicted to see a rise in workforce share, again highlighting the importance of generic knowledge requirements.
- Like the US results, psychomotor and physical abilities, including Manual Dexterity and Finger Dexterity are strongly associated with occupations with a falling workforce share.
- Also as in the US results, correlations for skills, knowledge areas and abilities associated with a rising occupation workforce share are stronger than those associated with a falling occupation workforce share.
6.4. Relative importance of skills, abilities and knowledge
We now provide a comparison of the overall relative importance of skills, abilities and knowledge areas as captured in O*NET. Figure 11 shows the results for a) the US and b) the UK. All figures feature on the horizontal axis the rank of all O*NET features: the further to the right, the less important it is for demand. This importance is assessed using linear (Pearson correlation coefficient) and non-linear (average derivative) metrics.
Figure 11: The relative importance of skills, abilities and knowledge as assessed by Pearson correlation coefficient
(a) US Results
A stacked area chart displaying the proportion of Abilities, Knowledge, and Skills across O*NET Ranking, overlaid with a line graph representing the Average Correlation Coefficient (weighted). The proportion of Skills and Knowledge generally increases towards higher O*NET rankings, while Abilities decreases. The correlation coefficient line shows a downward trend as O*NET Ranking increases.
(b) UK Results
A stacked area chart displaying the proportion of Abilities, Knowledge, and Skills across O*NET Ranking, overlaid with a line graph representing the Average Correlation Coefficient (weighted). Similar to the US results, Skills and Knowledge proportions tend to increase with higher O*NET Rankings, while Abilities decreases. The correlation coefficient line also shows a downward trend.
Figure 12: The relative importance of skills, abilities and knowledge as assessed by average derivative.
(a) US Results
A stacked area chart showing the proportion of Abilities, Knowledge, and Skills by O*NET Ranking, along with a line graph representing the Average Gradient (weighted). Abilities are less important (weighted to the right), while knowledge features are given more weight by the non-linear metric. The average gradient line generally decreases across the O*NET rankings.
(b) UK Results
A stacked area chart illustrating the proportion of Abilities, Knowledge, and Skills by O*NET Ranking, with a line graph for the Average Gradient (weighted). Similar trends are observed as in the US results, where abilities are less important and knowledge features are weighted more by the non-linear metric. The average gradient line shows a declining trend.
In all the plots, it can be seen that abilities are broadly less important (weighted to the right). Perhaps the most interesting insight, however, is that the non-linear metric (the average derivative) gives knowledge features more weight to the left. That is, a non-linear measure ranks knowledge features more highly. Recall that the benefit of a non-linear metric is that it allows us to discover complementarities: skills that are only important if other skills take high values. As such, this result is compatible with the intuition that knowledge features (such as Psychology and Foreign Language) are mostly valuable as complements. We find a similar pattern in a large number of Science, Technology, Engineering, and Mathematics (STEM) - features (such as Science, Technology Design and Operations Analysis). They are not equally useful to all occupations (as would be required to be assessed as important for our linear metric), but find use only for some specialised occupations that have high values for other skills.
6.5. SKILL COMPLEMENTARITIES
Recall from Section 5.4.2, that we say that an O*NET feature a is complementary to an O*NET feature b if increasing a increases demand for occupations with large values of b. Conversely, a is anti-complementary to an O*NET feature b if increasing a decreases demand for occupations with large values of b. For each sub-major occupation group, for both the US and UK, we rank the three features that would most drive: (i) a rising workforce share for a unit increase in the feature (complementary features), and (ii) a falling workforce share for a unit increase in the feature (anti-complementary features). As such, we are also able to establish which features are most important for different regions of the skills space. We represent the position of an occupation group in skills space by listing its highest ranked features, which we term its current features.
6.5.1. US
We describe in Table 16 complementary and anti-complementary O*NET variables for US sub-major occupation groups. Take Production Occupations, for example, which Figure 3 shows are predicted to see a fall in workforce share. According to the O*NET data, Production and Processing, Near Vision and Problem Sensitivity are the three most important or emblematic features for this occupation group. Our model predicts that increasing Customer and Personal Service, Technology Design and Installation in the presence of these features will have the greatest positive impact on future demand, while increasing Rate Control, Operation and Control and Quality Control Analysis) will have the greatest negative impact. Looking across all occupation groups, Customer and Personal Service and Technology Design (along with Science) appear to be the O*NET features most likely to appear as positive complementary variables.
Of course, any reconfiguration of skills, abilities and knowledge requirements entails an evolution of the occupation. Or, put differently, occupations may need to be redesigned in order to make effective use of skills and knowledge complements - and the results presented in Table 16 could be a useful guide in this exercise.
Table 16: For US major occupation groups, ranked lists (the highest ranked, top, and lowest ranked, bottom) of O*NET features that are: currently high-valued, complementary and anti-complementary
| SOC |
TITLE |
CURRENT FEATURES |
COMPLEMENTARY FEATURES |
ANTI-COMPLEMENTARY FEATURES |
| 11-0000 |
Management Occupations |
Administration and Management, Oral Expression, Oral Comprehension |
Science, Philosophy and Theology, Sociology and Anthropology |
Economics and Accounting, Medicine and Dentistry, Mathematics - Knowledge |
| 13-0000 |
Business and Financial Operations Occupations |
Oral Comprehension, Written Comprehension, English Language |
Science, Philosophy and Theology, Technology Design |
Medicine and Dentistry, Economics and Accounting, Mathematics - Knowledge |
| 15-0000 |
Computer and Mathematical Occupations |
Computers and Electronics, Critical Thinking, Problem Sensitivity |
Science, Technology Design, Design |
Economics and Accounting, Design Rate Control, Medicine and Dentistry |
| 17-0000 |
Architecture and Engineering Occupations |
Engineering and Technology, Mathematics - Knowledge, Design |
Science, Technology Design, Operations Analysis |
Operation and Control, Rate Control, Medicine and Dentistry |
| 19-0000 |
Life, Physical and Social Science Occupations |
Written Comprehension, Oral Comprehension, Reading Comprehension |
Science, Technology Design, Operations Analysis |
Medicine and Dentistry, Rate Control, Operation and Control |
| 21-0000 |
Community and Social Service Occupations |
Psychology, Therapy and Counseling, Active Listening |
Science, Operations Analysis, Science, Philosophy and Theology |
Medicine and Dentistry, Reaction Time, Therapy and Counseling |
| 23-0000 |
Legal Occupations |
Oral Expression, Law and Government, English Language |
Science, Sociology and Anthropology, Philosophy and Theology |
Economics and Accounting, Medicine and Dentistry, Mathematics - Knowledge |
| 25-0000 |
Education, Training and Library Occupations |
Education and Training, Oral Expression Operations, English Language |
Science, Analysis, Technology Design |
Mathematics - Knowledge, Medicine and Dentistry, Economics and Accounting |
| 27-0000 |
Arts, Design, Entertainment, Sports, And Media Occupations |
English Language, Oral Expression, Oral Comprehension |
Science, Philosophy and Theology, Education and Training |
Economics and Accounting, Rate Control, Mathematics - Knowledge |
| 29-0000 |
Healthcare Practitioners and Technical Occupations |
Medicine and Dentistry, Customer and Personal Service, Oral Comprehension |
Technology Design, Science, Operations Analysis |
Medicine and Dentistry, Rate Control, Operation and Control |
| 31-0000 |
Healthcare Support Occupations |
Customer and Personal Service, Oral Comprehension, English Language |
Customer and Personal Service, Technology Design, Science |
Rate Control, Mathematics - Knowledge, Computers and Electronics |
| 33-0000 |
Protective Service Occupations |
Public Safety and Security, Problem Sensitivity, English Language |
Customer and Personal Service, Technology Design, Science Quality |
Rate Control, Operation and Control, Control Analysis |
| SOC |
TITLE |
CURRENT FEATURES |
COMPLEMENTARY FEATURES |
ANTI-COMPLEMENTARY FEATURES |
| 35-0000 |
Food Preparation and Serving Related Occupations |
Customer and Personal Service, Oral Comprehension, Oral Expression |
Customer and Personal Service, Static Strength, Service Orientation |
Rate Control, Computers and Electronics, Operation and Control |
| 37-0000 |
Building and Grounds |
Customer and Personal Service, Trunk Strength, English Language |
Customer and Personal Service, Static Strength, Service Orientation |
Rate Control, Wrist-Finger Speed, Operation and Control |
| 39-0000 |
Personal Care and Service Occupations |
Customer and Personal Service, Oral Expression, Oral Comprehension |
Customer and Personal Service, Static Strength, Technology Design |
Rate Control, Mathematics - Knowledge, Operation and Control |
| 41-0000 |
Sales and Related Occupations |
Customer and Personal Service, Oral Expression, Oral Comprehension |
Customer and Personal Service, Science, Technology Design |
Economics and Accounting, Mathematics - Knowledge, Rate Control |
| 43-0000 |
Office and Administrative Support Occupations |
Customer and Personal Service, Oral Comprehension, Oral Expression |
Service Orientation, Customer and Personal Service, Technology Design |
Mathematics - Knowledge, Economics and Accounting, Rate Control |
| 45-0000 |
Farming, Fishing and Forestry Occupations |
Static Strength, Arm-Hand Steadiness, Multilimb Coordination |
Customer and Personal Service, Static Strength, Service Orientation |
Rate Control, Wrist-Finger Speed, Operation and Control |
| 49-0000 |
Installation, Maintenance and Repair Occupations |
Mechanical, Near Vision, Repairing |
Installation, Customer and Personal Service, Technology Design |
Operation and Control, Rate Control, Quality Control Analysis |
| 51-0000 |
Production Occupations |
Production and Processing, Near Vision, Problem Sensitivity |
Customer and Personal Service, Technology Design, Installation |
Rate Control, Operation and Control, Quality Control Analysis |
| 53-0000 |
Transportation and Material Moving Occupations |
Multilimb Coordination, Near Vision, Control Precision |
Customer and Personal Service, Static Strength, Installation |
Quality Control Analysis, Wrist-Finger Speed, Rate Control |
6.5.2. UK
Table 17 provides the equivalent complementary and anti-complementary O*NET features for UK sub-major occupation groups.
Here, take Customer Service and Sales Occupations, which according to the model are also likely to see a fall in future demand. According to the O*NET data, Customer and Personal Service, Oral Comprehension and Oral Expression are the three most important features for this group. Our model predicts that increasing Judgment and Decision-Making, Fluency of Ideas and Originality in the presence of these features will have the greatest positive impact on future demand, while increasing Public Safety and Security, Law and Government, Operation and Control, Engineering and Technology and Reading Comprehension will have the greatest negative impact.
Judgment and Decision-Making, Fluency of Ideas, Originality and Operations Analysis appear regularly across all occupation groups and present an illustrative case where changes in organisational design may be required to take advantage of them. Without enhanced delegation of formal authority and employee involvement in decision-making and the generation of ideas, the productivity gains from investing in these skills are likely to be modest. This is supported by a large body of evidence on the role and complementarity of high-performance work practices (Ben-Ner and Jones, 1995; Kruse et al., 2004; Lazear and Shaw, 2007). Decentralisation and the organisational structures and skills which support them appear particularly important for firms closer to the technological frontier, firms in more varied environments and younger firms (Acemoglu et al., 2007). The UK ranks around the OECD average in terms of the share of jobs which employ these practices, though the level of task discretion, defined as employees' immediate control over their work tasks has fallen sharply since the 1990s (Inanc et al., 2013; OECD, 2016d).
Science - defined here as the capacity to use scientific rules and methods to solve problems – is another cross-cutting complement. We find it to be a complementary feature not only among prototypical high-skill occupations but also Secretarial and Administrative occupations. Mastery of medium-skill science is already indispensable to a number of paraprofessional positions - from radiology technicians to electricians (Rothwell, 2013; Grinis, 2017). Our results suggest that clerical occupations may be ripe for a similar transformation. One can envisage scenarios where this is possible - for example, the credit controller occupation that increasingly applies aspects of data science to help investigate the credit worthiness of borrowers and collect arrears of payment.
Table 17: For UK sub-major occupation groups, ranked lists (the highest ranked, top, and lowest ranked, bottom) of O*NET features that are: currently high-valued, complementary and anti-complementary
| SOC |
TITLE |
CURRENT FEATURES |
COMPLEMENTARY FEATURES |
ANTI-COMPLEMENTARY FEATURES |
| 1100 |
Corporate Managers and Directors |
Administration and Management, Oral Expression, Oral Comprehension |
Science, Operations Analysis, Originality |
Public Safety and Security, Law and Government, Sound Localization |
| 1200 |
Other Managers and Proprietors |
Customer and Personal Service, Oral Expression, Oral Comprehension |
Science, Operations Analysis, Originality |
Public Safety and Security, Engineering and Technology, Law and Government |
| 2100 |
Science, Research, Engineering and Technology Professionals |
Computers and Electronics, Written Comprehension, Oral Comprehension |
Science, Operations Analysis, Fluency of Ideas |
Public Safety and Security, Sound Localization, Law and Government |
| 2200 |
Health Professionals |
Medicine and Dentistry, Customer and Personal Service, Problem Sensitivity |
Operations Analysis, Originality, Fluency of Ideas |
Public Safety and Security, Law and Government, Customer and Personal Service |
Table 17: Continued
| SOC |
TITLE |
CURRENT FEATURES |
COMPLEMENTARY FEATURES |
ANTI-COMPLEMENTARY FEATURES |
| 2300 |
Teaching and Educational Professionals |
Education and Training, Oral Expression, English Language |
Science, Operations Analysis, Originality |
Public Safety and Security, Law and Government, Customer and Personal Service |
| 2400 |
Business, Media and Public Service Professionals |
English Language, Oral Expression, Oral Comprehension |
Science, Operations Analysis, Originality |
Public Safety and Security, Law and Government, Customer and Personal Service |
| 3100 |
Science, Engineering and Technology Associate Professionals |
Oral Comprehension, Near Vision, Computers and Electronics |
Science, Operations Analysis, Fluency of Ideas |
Public Safety and Security, Sound Localization, Law and Government |
| 3200 |
Health and Social Care Associate Professionals |
Customer and Personal Service, Oral Expression, Oral Comprehension |
Science, Operations Analysis, Judgment and Decision-Making |
Public Safety and Security, Law and Government, Customer and Personal Service |
| 3300 |
Protective Service Occupations |
Public Safety and Security, Law and Government, English Language |
Gross Body Equilibrium, Science, Gross Body Coordination |
Public Safety and Security, Law and Government, Engineering and Technology |
| 3400 |
Culture, Media and Sports Occupations |
English Language, Oral Expression, Oral Comprehension |
Fluency of Ideas, Originality, Judgment and Decision-Making |
Public Safety and Security, Law and Government, Sound Localization |
| 3500 |
Business and Public Service Associate Professionals |
English Language, Oral Comprehension, Oral Expression |
Science, Operations Analysis, Fluency of Ideas |
Public Safety and Security, Law and Government, Customer and Personal Service |
| 4100 |
Administrative Occupations |
Customer and Personal Service, Oral Expression, Clerical |
Judgment and Decision-Making, Science, Fluency of Ideas |
Public Safety and Security, Engineering and Technology, Mechanical |
| 4200 |
Secretarial and Related Occupations |
Clerical, English Language, Oral Comprehension |
Judgment and Decision-Making, Science, Fluency of Ideas |
Public Safety and Security, Engineering and Technology, Operation and Control |
| 5100 |
Skilled Agricultural and Related Trades |
Oral Comprehension, Oral Expression, Active Listening |
Gross Body Equilibrium, Operations Analysis, Fluency of Ideas |
Sound Localization, Engineering and Technology, Mechanical |
Table 17: Continued
| SOC |
TITLE |
CURRENT FEATURES |
COMPLEMENTARY FEATURES |
ANTI-COMPLEMENTARY FEATURES |
| 5300 |
Skilled Construction and Building Trades |
Building and Construction, Manual Dexterity, Arm-Hand Steadiness |
Gross Body Equilibrium, Sales and Marketing, Gross Body Coordination |
Repairing, Mechanical, Computers and Electronics |
| 5400 |
Textiles, Printing and Other Skilled Trades |
Problem Sensitivity, Production and Processing, Oral Comprehension |
Sales and Marketing, Gross Body Equilibrium, Operations Analysis |
Engineering and Technology, Sound Localization, Public Safety and Security |
| 6100 |
Caring Personal Service Occupations |
Oral Expression, Oral Comprehension, Customer and Personal Service |
Judgment and Decision-Making, Fluency of Ideas, Originality |
Public Safety and Security, Engineering and Technology, Operation and Control |
| 6200 |
Leisure, Travel and Related Personal Service Occupations |
Customer and Personal Service, Oral Expression, Oral Comprehension |
Fluency of Ideas, Judgment and Decision-Making, Originality |
Public Safety and Security, Engineering and Technology, Reading Comprehension |
| 7100 |
Sales Occupations |
Customer and Personal Service, Oral Expression, Oral Comprehension |
Judgment and Decision-Making, Fluency of Ideas, Originality |
Public Safety and Security, Engineering and Technology, Reading Comprehension |
| 7200 |
Customer Service Occupations |
Customer and Personal Service, Oral Expression, Oral Comprehension |
Judgment and Decision-Making, Fluency of Ideas, Originality |
Public Safety and Security, Law and Government, Operation and Control |
| 8100 |
Process, Plant and Machine Operatives |
Near Vision, Production and Processing, Problem Sensitivity |
Gross Body Equilibrium, Sales and Marketing, Judgment and Decision-Making |
Repairing, Sound Localization, Mechanical |
| 8200 |
Transport and Mobile Machine Drivers And Operatives |
Transportation, Far Vision, Customer and Personal Service |
Gross Body Equilibrium, Sales and Marketing, Gross Body Coordination |
Engineering and Technology, Mechanical, Computers and Electronics |
| 9100 |
Elementary Trades and Related Occupations |
Manual Dexterity, Multilimb Coordination, Static Strength |
Gross Body Equilibrium, Sales and Marketing, Economics and Accounting |
Repairing, Computers and Electronics, Reading Comprehension |
| 9200 |
Elementary Administration and Service Occupations |
Customer and Personal Service, Oral Comprehension, Oral Expression |
Gross Body Equilibrium, Gross Body Coordination, Judgment and Decision-Making |
Repairing, Reading Comprehension, Computers and Electronics |
6.6. New Occupations
It is also useful to think about the occupations which may emerge in the future in response to the drivers of labour market change we consider in our study. These occupations correspond to high-demand locations in the feature space and are not associated with existing occupations. The model allows us to identify a hypothetical occupation which is 'almost certain' (see Section 5.5 for a formal interpretation) to experience an increase in workforce share and the combination of skills, abilities and knowledge features most associated with it.
6.6.1. US
For the US, the model identifies four hypothetical occupations which would almost certainly experience a rise in demand. Table 18 ranks the top five O*NET features in declining order of feature value for each hypothetical occupation. (S) denotes that the variable is an O*NET skills feature, (K) is an O*NET knowledge feature and (A) is an O*NET abilities feature.
We can understand something about these hypothetical occupations by looking at existing occupations that are closest to them (in declining order of proximity), as described in Figure 12. Of the 20 occupations presented here, 11 are defined by O*NET as enjoying a Bright Outlook and/or are expected to benefit from the growth of the green economy.
Table 18: The four new occupations found by our model for the US, as described by their top five O*NET features.
| NEW OCCUPATIONS |
FEATURE RANK 1ST |
2ND |
3RD |
4TH |
5TH |
| 1 |
Customer and Personal Service (K) |
Static Strength (A) |
Service Orientation (S) |
Biology (K) |
Arm-Hand Steadiness (A) |
| 2 |
Building and Construction (K) |
Customer and Personal Service (K) |
Static Strength (A) |
Manual Dexterity (A) |
Arm-Hand Steadiness (A) |
| 3 |
Engineering and Technology (K) |
Science (S) |
Written Comprehension (S) |
Critical Thinking (S) |
Design (K) |
| 4 |
Education and Training (K) |
Oral Comprehension (S) |
Social Perceptiveness (S) |
Written Comprehension (S) |
Reading Comprehension (S) |
Figure 12: 'Closest' occupations to hypothetical new high demand occupations for the US
A diagram illustrating "Closest" occupations to hypothetical new high demand occupations for the US.
Row 1:
Non-farm Animal Caretakers (icon of dog)
Massage Therapists (icon of hands)
Personal Care Aides (icon of person in wheelchair)
Maids and Housekeeping Cleaners (icon of star/sparkle over house)
Home Health Aides (icon of house with cross)
Row 2:
Construction Laborers (icon of bricks)
Painters, Construction and Maintenance (icon of paint roller)
Helpers - Pipelayers, Plumbers, Pipefitters and Steamfitters (icon of pipes)
Roofers (icon of roof)
Drywall and Ceiling Tile Installers (icon of tiles)
Row 3:
Aerospace Engineers (icon of plane)
Electrical Engineers (icon of circuit board)
Chemical Engineers (icon of atoms/molecules)
Nuclear Engineers (icon of atom)
Engineering Teachers, Post-secondary (icon of grid with boxes)
Row 4:
Directors, Religious Activities and Education (icon of open book)
Training and Development Specialists (icon of upward trending graph)
Communications Teachers Post-secondary (icon of speech bubbles)
Home Economics Teachers Post-secondary (icon of heart over house)
Library Science Teachers Post-secondary (icon of stacked books)
Figure 13: Time-series of employment for four of the 'closest' occupations to new US occupations, as tabulated in Figure 12
(a) Non-farm Animal Caretakers
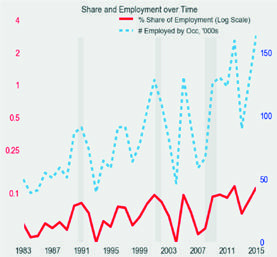
(b) Construction Laborers
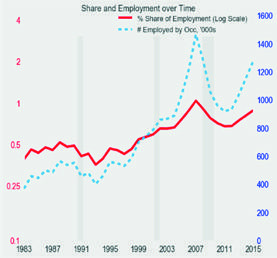
(c) Aerospace Engineers
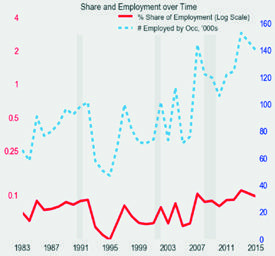
(d) Directors Religious Activities and Education
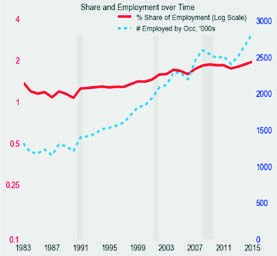
These results provide another rejoinder to the view that jobs in the middle of the education and earnings distributions will disappear in the future. Two of the four occupations can be plausibly viewed as middle-skill jobs. Our first hypothetical occupation - which has similarities to social care work - is particularly interesting. On the one hand, it is a textbook example of a sector where the availability of low-skilled employees, the budgetary squeeze on government programmes – Medicare and Medicaid account for roughly 70% of all long-term care dollars – and the legacy of the politics of race and gender have combined to create low-paid jobs with low status and precarious employment conditions (Institute of Medicine, 2008; Duffy et al., 2015). However, the model points to bright demand prospects for care work which, requires a mixture of tasks from across the skill spectrum, including formal knowledge and training which, in principle, would support wage growth and job quality. Finally it is worth noting the extent to which interpersonal competencies feature across these hypothetical occupations.
6.6.2. UK
For the UK, two new occupations are identified by the model. Table 19 shows the top five features of these occupations, in declining order of importance.
Table 19: The two new occupations found by our model for the UK, as described by their top five O*NET features.
| NEW OCCUPATIONS |
FEATURE RANK 1ST |
2ND |
3RD |
4TH |
5TH |
| 1 |
Fine Arts (K) |
Originality (A) |
Design (K) |
Fluency of Ideas (A) |
Visualization (K) |
| 2 |
Originality (A) |
Fluency of Ideas (A) |
Judgment and Decision-Making (S) |
Active Learning (S) |
Oral Expression (A) |
Again, we can learn something about these occupations by looking at existing occupations that are closest to them (in declining order of proximity). These closest occupations are described in Figure 14, and historical employment for two of these are plotted in Figure 15. One of the occupations has high levels of creativity and combines traditional craft and tech-based skills; the other fits hospitality and sales occupations and requires originality, flexibility and management skills.
Figure 14: The 'closest' occupations to hypothetical new high demand occupations for the UK.
A diagram illustrating "Closest" occupations to hypothetical new high demand occupations for the UK.
Row 1:
Artists (icon of paintbrush)
Merchandisers and Window Dressers (icon of shop window)
Florists (icon of flower)
Tailors and Dressmakers (icon of needle and thread)
Photographers, audio-visual and broadcasting equipment operators (icon of camera)
Row 2:
Catering and bar managers (icon of chef's cloche)
Publicans and managers of licensed premises (icon of wine bottle and glass)
Managers and directors in retail and wholesale (icon of percentage sign)
Sales Supervisors (icon of price tag)
Chefs (icon of fork and spoon)
Figure 15: Time-series of employment for two of the 'closest' occupations to new UK occupations, as tabulated in Figure 14
(a) Artists
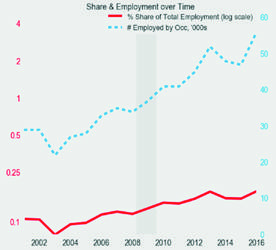
(b) Catering and bar managers
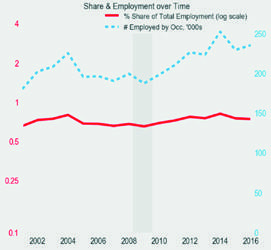
7. LIMITATIONS OF THE ANALYSIS
— While we believe that our research design has many appealing features that increase the usefulness of the findings compared with previous studies, we acknowledge that there are important limitations. First, directional predictions may frustrate policymakers who seek more detailed information on which to base their decisions. Experimenting with a larger number of labels to achieve a finer distinction between different rates of change might have value in this respect, though we need to be mindful of the aforementioned cognitive limits associated with prediction over a 15-year horizon.
— A second limitation is that we only assess the implications for employment of structural shifts in employer demand. In practice, however, employment opportunities will arise when workers retire from the workforce (or leave for other reasons) and need to be replaced. Indeed, replacement needs are expected to provide significantly more job openings than employment growth over the next decade (UK Commission for Employment and Skills, 2014; US Bureau of Labor Statistics, 2016). Even those occupations where employer demand is otherwise expected to fall may still offer attractive career prospects. As such, incorporating estimates of the age structure of the workforce to predict replacement needs would complement our approach and assessment of future employment opportunities.
— Third, it would be useful to understand more about the characteristics of jobs that are anticipated to become more important in coming years. Recent concerns that falling unemployment and the development of new business models have not been accompanied by the creation of 'good' jobs give this issue particular traction and timeliness (Taylor, 2017). Earnings levels, career progression, working environment, job security, voice in organisational decisions, among other things, provide objective and measurable benchmarks against which to assess job quality (OECD, 2016c). And, in addition to the value that jobs have for the people who hold them, they also have potential side-effects, both positive and negative, on the rest of society which a full assessment would take into account.
— Fourth, in future development of our analysis would be to integrate trends more explicitly into the labelling process - for instance, to choose occupations that are most representative of the trends and likely to encourage reflection about them (as opposed to, or possibly combined with, using the active learning algorithm). Alternatively, workshop participants could be asked to rank the trends by their importance or relevance when labelling occupations as an input for our model, which would help sharpen interpretation of the results. Finally, it would be useful to explore how estimates vary across countries (Hausmann et al., 2014; Beramendi et al., 2015). In the presence of cross-country variations in resources, institutions and technologies, even identical structural trends are likely to be channelled in different ways, which in turn give rise to different labour market disruptions and opportunities.
8. CONCLUSIONS
In this report, we have presented a novel mixed-methods approach for predicting the demand for skills, which we have applied to the US and UK economies in 2030. Specifically, we have: generated directional predictions for occupation growth for groups in the Standard Occupation Classification of the US and UK; identified which skills, knowledge types and abilities will, by association, most likely experience growth and decline; and determined, at the occupational level, which human capital investments will most likely boost future demand in 2030. We have grounded our analysis explicitly in the many sources of structural change likely to impact on US and UK labour markets over this horizon.
Although there has been an explosion of reports looking into the future of employment, we believe ours is the most comprehensive and methodologically ambitious and has results that are actionable. It also contains the most sophisticated treatment of uncertainty; this is important as our finding that most jobs are associated with high levels of uncertainty about future demand reminds us that the future for most occupations is far from inevitable. Lastly, we make great efforts to benchmark our predictions - to tease out our specific contributions to this important conversation - by comparing them with alternative forecasts. While this necessarily falls short of evaluation, we believe it further separates our study from some recent exercises of this nature.
Our approach takes the labour market judgments, gleaned at foresight workshops, of experts in a wide range of domain areas where structural change is expected to impact on employment, and combines it with a state of- the-art machine-learning algorithm. The model follows earlier studies in making use of the US Department of Labor's O*NET survey of more than 1,000 occupations which asks detailed questions of every occupation on skills, knowledge and abilities and the tasks and activities which make up jobs. However, we depart from these studies in making use of all 120 skills, knowledge and abilities features in the database.
We find that 9.6% (8.0%) of the current US [UK] workforce is in an occupation that will very likely experience an increase in workforce share and 18.7% (21.2%) in an occupation that will very likely experience a fall. These estimates imply that a large mass of the workforce in both the US and UK have highly uncertain demand prospects (that is, a probability of experiencing a higher workforce share of close to 50:50). This finding is significant. It contrasts sharply, for example, with the U-shaped distribution in the studies of future automation of Frey and Osborne (2014 and 2017), with their implication that the overwhelming majority of US and UK workers are employed in jobs with either very high or very low probability of automation. That our predictions are more uncertain is a result of the distinctions of our methodology from previous work: in particular, our foresight workshops force domain experts to confront the uncertainties arising from structural trends acting in complex and possibly offsetting ways. The experts' stated uncertainties reflecting this - and other sources - are explicitly factored into our machine-learning model.
Our skills results confirm the future importance of 21st century skills - the combination of interpersonal and cognitive skills that has been an increasing preoccupation of policymakers in recent years. In our US findings, there is a particularly strong emphasis on interpersonal competencies, consistent with the literature on the increasing importance of social skills. In addition, a number of knowledge fields, such as English Language, Administration and Management, and Biology are associated strongly with occupations predicted to see rising demand - a reminder that the future workforce will have generic knowledge as well as skills requirements. In the UK, the findings support the importance of 21st century skills too, though with an even stronger emphasis on cognitive competencies and learning strategies. System skills - Judgment and Decision-making, Systems Analysis and Systems Evaluation - feature prominently.
Our study makes contributions to all three literatures surveyed in Section 2. First, the foresight workshops employ a novel data collection methodology using active machine-learning algorithms, which intelligently queries participants to maximise the informativeness of the data collected. Second, the study employs an innovative approach to generating predictions about the future of skills, combining expert human judgment with machine-learning techniques that can flexibly respond to natural patterns in the data. Our approach thus permits for richer, more complex, non-linear interactions between variables - one that we exploit to assess complementarities between skills and the implications for new occupations. Third, the research is grounded in an explicit consideration of the diverse sources of structural change, any one of which can be expected to have major impacts on future employer skills needs. By making use of the detailed characterisation of occupations provided by the O*NET database, we are able to provide a higher resolution treatment of skills, knowledge types and abilities than is usually found in the skills literature. Finally, our research serves as a potentially important counterweight to the dominance of future automation in policy debates on employment.
This final point merits emphasis: it is tempting to focus on the risks and dangers of the period ahead rather than the opportunities it offers. This is both dangerous and misleading. It is dangerous because popular narratives matter for economic outcomes and a storyline of relentless technological displacement of labour markets risks chilling growth and innovation (Atkinson and Wu, 2017; Shiller, 2017). A backlash against technology would be particularly dangerous at a time when willingness to embrace risk is needed more than ever to improve flagging productivity (Phelps, 2013; Erixon and Weigel, 2016). It is misleading because our analysis points to the opportunities for boosting growth, though with one important caveat - that our education and training systems are agile enough to respond appropriately. History is a reminder that investments in skills must be at the centre of any long-term strategy for adjusting to structural change. A precondition for this is access to good information on skills needs - without which policymakers risk flying blind. We hope this report is a step towards improving understanding of this vital agenda.
APPENDIX A. SENSITIVITY ANALYSIS
Figure A1: Using trend extrapolation, the distribution of US employment according to its probability of future increased demand
Note that the total area under all curves is equal to total US employment.
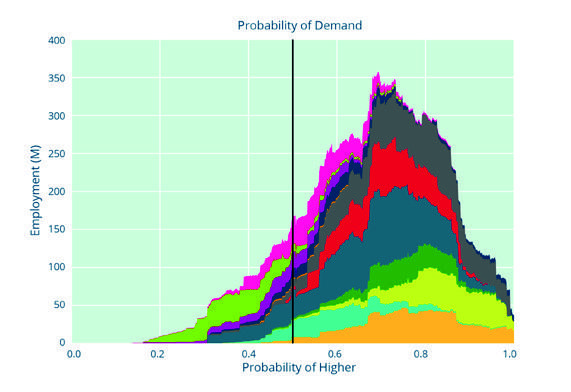
- Management, Business and Financial Occupations
- Computer, Engineering and Science Occupations
- Education, Legal, Community Service, Arts and Media Occupations
- Healthcare Practitioners and Technical Occupations
- Service Occupations
- Sales and Related Occupations
- Office and Administrative Support Occupations
- Farming, Fishing and Forestry Occupations
- Construction and Extraction Occupations
- Installation, Maintenance and Repair Occupations
- Production Occupations
- Transportation and Material Moving Occupations
Figure A2: Using trend extrapolation, the distribution of UK employment according to its probability of future increased demand
Note that the total area under all curves is equal to total UK employment.
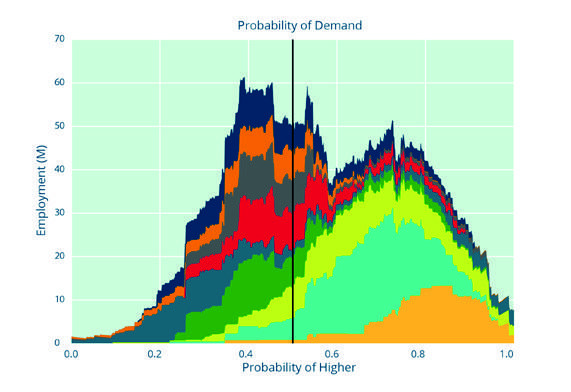
- Management, Directors and Senior Officials
- Professional Occupations
- Associate Professional and Technical Occupations
- Administrative and Secretarial Occupations
- Skilled Trades Occupations
- Caring, Leisure and Other Service Occupations
- Sales and Customer Service Occupations
- Process, Plant and Machine Operatives
- Elementary Occupations
US - Relative rankings
Table A1: Relative rankings of major occupation groups in the US by our model, trained on expert judgment and by independent forecasts from the BLS.
| RANKING FROM EXPERT JUDGMENT |
RANKING FROM BLS PROJECTIONS 2014-2024 |
| Education, Training and Library Occupations |
Healthcare Support Occupations |
| Community and Social Service Occupations |
Healthcare Practitioners and Technical Occupations |
| Personal Care and Service Occupations |
Personal Care and Service Occupations |
| Architecture and Engineering Occupations |
Computer and Mathematical Occupations |
| Management Occupations |
Community and Social Service Occupations |
| Arts, Design, Entertainment, Sports and Media Occupations |
Construction and Extraction Occupations |
| Legal Occupations |
Business and Financial Operations Occupations |
| Healthcare Support Occupations |
Education, Training and Library Occupations |
| Healthcare Practitioners and Technical Occupations |
Life, Physical and Social Science Occupations |
| Life, Physical and Social Science Occupations |
Food Preparation and Serving Related Occupations |
| Computer and Mathematical Occupations |
Installation, Maintenance and Repair Occupations |
| Building and Grounds Cleaning and Maintenance Occupations |
Building and Grounds Cleaning and Maintenance Occupations |
| Construction and Extraction Occupations |
Management Occupations |
| Protective Service Occupations |
Legal Occupations |
| Business and Financial Operations Occupations |
Sales and Related Occupations |
| Food Preparation and Serving Related Occupations |
Transportation and Material Moving Occupations |
| Sales and Related Occupations |
Protective Service Occupations |
| Farming, Fishing and Forestry Occupations |
Arts, Design, Entertainment, Sports and Media Occupations |
| Installation, Maintenance and Repair Occupations |
Architecture and Engineering Occupations |
| Office and Administrative Support Occupations |
Office and Administrative Support Occupations |
| Transportation and Material Moving Occupations |
Production Occupations |
| Production Occupations |
Farming, Fishing and Forestry Occupations |
UK - Relative rankings
Table A2: Relative rankings of sub-major occupation groups in the UK by our model, trained on expert judgment and by independent forecasts from the KCES.
| RANKING FROM EXPERT JUDGMENT |
RANKING FROM UKCES PROJECTIONS TO 2024 |
| Teaching and Educational Professionals |
Customer Service Occupations |
| Culture, Media and Sports Occupations |
Corporate Managers and Directors |
| Health Professionals |
Caring Personal Service Occupations |
| Science, Research, Engineering and Technology Professionals |
Business, Media and Public Service Professionals |
| Corporate Managers and Directors |
Health and Social Care Associate Professionals |
| Business, Media and Public Service Professionals |
Health Professionals |
| Textiles, Printing and Other Skilled Trades |
Business and Public Service Associate Professionals |
| Skilled Agricultural and Related Trades |
Culture, Media and Sports Occupations |
| Other Managers and Proprietors |
Science, Research, Engineering and Technology Professionals |
| Business and Public Service Associate Professionals |
Other Managers and Proprietors |
| Health and Social Care Associate Professionals |
Teaching and Educational Professionals |
| Protective Service Occupations |
Skilled Construction and Building Trades |
| Leisure, Travel and Related Personal Service Occupations |
Science, Engineering and Technology Associate Professionals |
| Science, Engineering and Technology Associate Professionals |
Elementary Administration and Service Occupations |
| Caring Personal Service Occupations |
Skilled Agricultural and Related Trades |
| Skilled Metal, Electrical and Electronic Trades |
Leisure, Travel and Related Personal Service Occupations |
| Skilled Construction and Building Trades |
Transport and Mobile Machine Drivers and Operatives |
| Elementary Administration and Service Occupations |
Elementary Trades and Related Occupations |
| Elementary Trades and Related Occupations |
Protective Service Occupations |
| Administrative Occupations |
Administrative Occupations |
| Sales Occupations |
Sales Occupations |
| Transport and Mobile Machine Drivers and Operatives |
Textiles, Printing and Other Skilled Trades |
| Secretarial and Related Occupations |
Skilled Metal, Electrical and Electronic Trades |
| Customer Service Occupations |
Process, Plant and Machine Operatives |
| Process, Plant and Machine Operatives |
Secretarial and Related Occupations |
APPENDIX B. MINOR OCCUPATION GROUPS
US Minor Occupation Groups
Table B1: Probabilities of future increased demand for minor occupation groups
| STANDARD OCCUPATION CLASSIFICATION (SOC) |
OCCUPATION TITLE |
AVERAGE PROBABILITY (EMPLOYMENT-WEIGHTED) |
| 39-2000 |
Animal Care and Service Workers |
0.796 |
| 21-2000 |
Religious Workers |
0.754 |
| 25-2000 |
Preschool, Primary, Secondary and Special Education School Teachers |
0.743 |
| 23-1000 |
Lawyers, Judges and Related Workers |
0.739 |
| 25-1000 |
Post-secondary Teachers |
0.734 |
| 17-2000 |
Engineers |
0.718 |
| 21-1000 |
Counselors, Social Workers and Other Community and Social Service Specialists |
0.707 |
| 25-3000 |
Other Teachers and Instructors |
0.683 |
| 39-9000 |
Other Personal Care and Service Workers |
0.680 |
| 19-3000 |
Social Scientists and Related Workers |
0.676 |
| 11-2000 |
Advertising, Marketing, Promotions, Public Relations and Sales Managers |
0.672 |
| 39-5000 |
Personal Appearance Workers |
0.672 |
| 25-9000 |
Other Education, Training and Library Occupations |
0.665 |
| 27-2000 |
Entertainers and Performers, Sports and Related Workers |
0.661 |
| 11-9000 |
Other Management Occupations |
0.658 |
| 39-1000 |
Supervisors Of Personal Care and Service Workers |
0.651 |
| 31-2000 |
Occupational Therapy and Physical Therapist Assistants and Aides |
0.637 |
| 31-1000 |
Nursing, Psychiatric and Home Health Aides |
0.636 |
| 43-1000 |
Supervisors of Office and Administrative Support Workers |
0.635 |
| 29-9000 |
Other Healthcare Practitioners and Technical Occupations |
0.629 |
| 29-1000 |
Health Diagnosing and Treating Practitioners |
0.627 |
| 19-1000 |
Life Scientists |
0.625 |
| 19-2000 |
Physical Scientists |
0.613 |
| 39-7000 |
Tour and Travel Guides |
0.611 |
| 17-1000 |
Architects, Surveyors and Cartographers |
0.611 |
| 39-4000 |
Funeral Service Workers |
0.605 |
| 27-3000 |
Media and Communication Workers |
0.600 |
| 39-6000 |
Baggage Porters, Bellhops and Concierges |
0.593 |
| 11-3000 |
Operations Specialties Managers |
0.580 |
| 11-1000 |
Top Executives |
0.579 |
| 13-1000 |
Business Operations Specialists |
0.579 |
| 27-1000 |
Art and Design Workers |
0.579 |
| 33-1000 |
Supervisors of Protective Service Workers |
0.566 |
| 15-1000 |
Computer Occupations |
0.556 |
| 37-1000 |
Supervisors Of Building and Grounds Cleaning and Maintenance Workers |
0.551 |
| 15-2000 |
Mathematical Science Occupations |
0.549 |
| 47-2000 |
Construction Trades Workers |
0.548 |
| 25-4000 |
Librarians, Curators and Archivists |
0.545 |
| 37-2000 |
Building Cleaning and Pest Control Workers |
0.542 |
| 49-1000 |
Supervisors Of Installation, Maintenance and Repair Workers |
0.535 |
| 47-3000 |
Helpers, Construction Trades |
0.530 |
| 33-3000 |
Law Enforcement Workers |
0.517 |
| 37-3000 |
Grounds Maintenance Workers |
0.515 |
| 47-1000 |
Supervisors Of Construction and Extraction Workers |
0.515 |
| 53-2000 |
Air Transportation Workers |
0.511 |
| 53-1000 |
Supervisors Of Transportation and Material Moving Workers |
0.499 |
| 41-1000 |
Supervisors Of Sales Workers |
0.496 |
| 33-2000 |
Fire Fighting and Prevention Workers |
0.493 |
| 31-9000 |
Other Healthcare Support Occupations |
0.492 |
| 41-9000 |
Other Sales and Related Workers |
0.482 |
| 51-1000 |
Supervisors of Production Workers |
0.477 |
| 35-3000 |
Food and Beverage Serving Workers |
0.474 |
| 29-2000 |
Health Technologists and Technicians |
0.474 |
| 35-1000 |
Supervisors of Food Preparation and Serving Workers |
0.473 |
| 27-4000 |
Media and Communication Equipment Workers |
0.459 |
| 41-4000 |
Sales Representatives, Wholesale and Manufacturing |
0.456 |
| 35-9000 |
Other Food Preparation and Serving Related Workers |
0.445 |
| 17-3000 |
Drafters, Engineering Technicians and Mapping Technicians |
0.439 |
| 49-2000 |
Electrical and Electronic Equipment Mechanics, Installers and Repairers |
0.433 |
| 33-9000 |
Other Protective Service Workers |
0.419 |
| 43-6000 |
Secretaries and Administrative Assistants |
0.412 |
| 19-4000 |
Life, Physical and Social Science Technicians |
0.407 |
| 47-4000 |
Other Construction and Related Workers |
0.406 |
| 45-2000 |
Agricultural Workers |
0.405 |
| 45-1000 |
Supervisors of Farming, Fishing and Forestry Workers |
0.391 |
| 41-2000 |
Retail Sales Workers |
0.390 |
| 49-9000 |
Other Installation, Maintenance and Repair Occupations |
0.387 |
| 43-4000 |
Information and Record Clerks |
0.374 |
| 43-5000 |
Material Recording, Scheduling, Dispatching and Distributing Workers |
0.367 |
| 53-5000 |
Water Transportation Workers |
0.366 |
| 45-3000 |
Fishing and Hunting Workers |
0.364 |
| 39-3000 |
Entertainment Attendants and Related Workers |
0.354 |
| 41-3000 |
Sales Representatives, Services |
0.335 |
| 35-2000 |
Cooks and Food Preparation Workers |
0.333 |
| 53-6000 |
Other Transportation Workers |
0.333 |
| 53-3000 |
Motor Vehicle Operators |
0.330 |
| 53-7000 |
Material Moving Workers |
0.314 |
| 23-2000 |
Legal Support Workers |
0.310 |
| 43-9000 |
Other Office and Administrative Support Workers |
0.304 |
| 13-2000 |
Financial Specialists |
0.289 |
| 43-2000 |
Communications Equipment Operators |
0.289 |
| 53-4000 |
Rail Transportation Workers |
0.286 |
| 49-3000 |
Vehicle and Mobile Equipment Mechanics, Installers and Repairers |
0.283 |
| 47-5000 |
Extraction Workers |
0.277 |
| 51-6000 |
Textile, Apparel and Furnishings Workers |
0.226 |
| 51-3000 |
Food Processing Workers |
0.221 |
| 51-8000 |
Plant and System Operators |
0.220 |
| 45-4000 |
Forest, Conservation and Logging Workers |
0.194 |
| 51-4000 |
Metal Workers and Plastic Workers |
0.173 |
| 51-7000 |
Woodworkers |
0.166 |
| 43-3000 |
Financial Clerks |
0.153 |
| 51-2000 |
Assemblers and Fabricators |
0.140 |
| 51-5000 |
Printing Workers |
0.133 |
| 51-9000 |
Other Production Occupations |
0.113 |
UK Minor Occupation Groups
Table B2: Probabilities of future increased demand for minor occupation groups
| SOC |
OCCUPATION TITLE |
AVERAGE PROBABILITY (EMPLOYMENT-WEIGHTED) |
| 3440 |
Sports and Fitness Occupations |
0.745 |
| 1180 |
Health and Social Services Managers and Directors |
0.700 |
| 5430 |
Food Preparation and Hospitality Trades |
0.699 |
| 2110 |
Natural and Social Science Professionals |
0.694 |
| 2220 |
Therapy Professionals |
0.689 |
| 1240 |
Managers and Proprietors in Health and Care Services |
0.681 |
| 2310 |
Teaching and Educational Professionals |
0.666 |
| 1220 |
Managers and Proprietors in Hospitality and Leisure Services |
0.659 |
| 3420 |
Design Occupations |
0.659 |
| 2210 |
Health Professionals |
0.646 |
| 2140 |
Conservation and Environment Professionals |
0.638 |
| 2120 |
Engineering Professionals |
0.637 |
| 1110 |
Chief Executives and Senior Officials |
0.633 |
| 3410 |
Artistic, Literary and Media Occupations |
0.633 |
| 2230 |
Nursing and Midwifery Professionals |
0.626 |
| 1130 |
Functional Managers and Directors |
0.622 |
| 2150 |
Research and Development Managers |
0.618 |
| 1210 |
Managers and Proprietors in Agriculture-related Services |
0.615 |
| 5240 |
Electrical and Electronic Trades |
0.613 |
| 2130 |
Information Technology and Telecommunications Professionals |
0.606 |
| 6240 |
Cleaning and Housekeeping Managers and Supervisors |
0.606 |
| 3560 |
Public Services and Other Associate Professionals |
0.601 |
| 2440 |
Welfare Professionals |
0.601 |
| 2450 |
Librarians and Related Professionals |
0.599 |
| 7130 |
Sales Supervisors |
0.599 |
| 1190 |
Managers and Directors in Retail and Wholesale |
0.599 |
| 2470 |
Media Professionals |
0.598 |
| 9270 |
Other Elementary Services Occupations |
0.587 |
| 1150 |
Financial Institution Managers and Directors |
0.570 |
| 2410 |
Legal Professionals |
0.570 |
| 5110 |
Agricultural and Related Trades |
0.567 |
| 2420 |
Business, Research and Administrative Professionals |
0.564 |
| 3550 |
Conservation and Environmental Associate Professionals |
0.557 |
| 1120 |
Production Managers and Directors |
0.557 |
| 6210 |
Leisure and Travel Services |
0.556 |
| 3130 |
Information Technology Technicians |
0.555 |
| 2430 |
Architects, Town Planners and Surveyors |
0.552 |
| 1160 |
Managers and Directors in Transport and Logistics |
0.551 |
| 3230 |
Welfare and Housing Associate Professionals |
0.551 |
| 2460 |
Quality and Regulatory Professionals |
0.548 |
| 3540 |
Sales, Marketing and Related Associate Professionals |
0.542 |
| 1170 |
Senior Officers in Protective Services |
0.541 |
| 4160 |
Administrative Occupations: Office Managers and Supervisors |
0.541 |
| 6220 |
Hairdressers and Related Services |
0.538 |
| 3530 |
Business, Finance and Related Associate Professionals |
0.535 |
| 3210 |
Health Associate Professionals |
0.528 |
| 3310 |
Protective Service Occupations |
0.525 |
| 3510 |
Transport Associate Professionals |
0.497 |
| 8140 |
Construction Operatives |
0.492 |
| 9120 |
Elementary Construction Occupations |
0.492 |
| 6120 |
Childcare and Related Personal Services |
0.484 |
| 3120 |
Draughtspersons and Related Architectural Technicians |
0.483 |
| 3110 |
Science, Engineering and Production Technicians |
0.480 |
| 5320 |
Building Finishing Trades |
0.480 |
| 6140 |
Caring Personal Services |
0.479 |
| 1250 |
Managers and Proprietors In Other Services |
0.468 |
| 5250 |
Skilled Metal, Electrical and Electronic Trades Supervisors |
0.466 |
| 7120 |
Sales-related Occupations |
0.458 |
| 5330 |
Construction and Building Trades Supervisors |
0.453 |
| 8230 |
Other Drivers and Transport Operatives |
0.424 |
| 4110 |
Administrative Occupations: Government and Related Organisations |
0.419 |
| 5310 |
Construction and Building Trades |
0.415 |
| 3520 |
Legal Associate Professionals |
0.361 |
| 5410 |
Textiles and Garments Trades |
0.351 |
| 6230 |
Housekeeping and Related Services |
0.350 |
| 4120 |
Administrative Occupations: Finance |
0.350 |
| 8210 |
Road Transport Drivers |
0.348 |
| 5230 |
Vehicle Trades |
0.345 |
| 6130 |
Animal Care and Control Services |
0.330 |
| 5440 |
Other Skilled Trades |
0.328 |
| 5220 |
Metal Machining, Fitting and Instrument-making Trades |
0.326 |
| 4130 |
Administrative Occupations: Records |
0.324 |
| 9240 |
Elementary Security Occupations |
0.321 |
| 4210 |
Secretarial and Related Occupations |
0.320 |
| 9230 |
Elementary Cleaning Occupations |
0.306 |
| 7110 |
Sales Assistants and Retail Cashiers |
0.289 |
| 7220 |
Customer Service Managers and Supervisors |
0.284 |
| 7210 |
Customer Service Occupations |
0.280 |
| 9210 |
Elementary Administration Occupations |
0.268 |
| 9110 |
Elementary Agricultural Occupations |
0.266 |
| 9130 |
Elementary Process Plant Occupations |
0.260 |
| 4150 |
Other Administrative Occupations |
0.244 |
| 8120 |
Plant and Machine Operatives |
0.241 |
| 8110 |
Process Operatives |
0.230 |
| 5420 |
Printing Trades |
0.218 |
| 5210 |
Metal Forming, Welding and Related Trades |
0.210 |
| 8220 |
Mobile Machine Drivers and Operatives |
0.192 |
| 8130 |
Assemblers and Routine Operatives |
0.164 |
| 9250 |
Elementary Sales Occupations |
0.102 |
| 9260 |
Elementary Storage Occupations |
0.061 |
APPENDIX C. SKILLS RANKING BY AVERAGE DERIVATIVE
US Skills Ranking
Table C1: A ranking, by average derivative, of the importance of O*NET variables to future demand for US occupations
| RANK |
O*NET VARIABLE |
CLASS |
AVERAGE DERIVATIVE |
| 1 |
Customer and Personal Service |
Knowledge |
2.578 |
| 2 |
Technology Design |
Skills |
2.565 |
| 3 |
Science |
Skills |
2.557 |
| 4 |
Service Orientation |
Skills |
2.229 |
| 5 |
Education and Training |
Knowledge |
2.087 |
| 6 |
Static Strength |
Abilities |
1.965 |
| 7 |
Philosophy and Theology |
Knowledge |
1.953 |
| 8 |
Instructing |
Skills |
1.847 |
| 9 |
Installation |
Skills |
1.843 |
| 10 |
Sociology and Anthropology |
Knowledge |
1.655 |
| 11 |
Fluency of Ideas |
Abilities |
1.602 |
| 12 |
Stamina |
Abilities |
1.570 |
| 13 |
Personnel and Human Resources |
Knowledge |
1.544 |
| 14 |
Complex Problem Solving |
Skills |
1.377 |
| 15 |
Management of Material Resources |
Skills |
1.227 |
| 16 |
Extent Flexibility |
Abilities |
1.226 |
| 17 |
Operations Analysis |
Skills |
1.189 |
| 18 |
Design |
Knowledge |
1.170 |
| 19 |
Equipment Selection |
Skills |
1.162 |
| 20 |
Psychology |
Knowledge |
1.071 |
| 21 |
Dynamic Strength |
Abilities |
1.067 |
| 22 |
Originality |
Abilities |
1.048 |
| 23 |
Management of Personnel Resources |
Skills |
1.041 |
| 24 |
Chemistry |
Knowledge |
1.040 |
| 25 |
Therapy and Counseling |
Knowledge |
1.016 |
| 26 |
Foreign Language |
Knowledge |
1.012 |
| 27 |
Arm-Hand Steadiness |
Abilities |
1.008 |
| 28 |
Learning Strategies |
Skills |
0.985 |
| 29 |
Physics |
Knowledge |
0.971 |
| 30 |
Active Learning |
Skills |
0.940 |
| 31 |
Memorization |
Abilities |
0.914 |
| 32 |
Administration and Management |
Knowledge |
0.902 |
| 33 |
Dynamic Flexibility |
Abilities |
0.844 |
| 34 |
Time Sharing |
Abilities |
0.841 |
| 35 |
Social Perceptiveness |
Skills |
0.745 |
| 36 |
Writing |
Skills |
0.737 |
| 37 |
Manual Dexterity |
Abilities |
0.721 |
| 38 |
Sound Localization |
Abilities |
0.659 |
| 39 |
Multilimb Coordination |
Abilities |
0.652 |
| 40 |
Gross Body Coordination |
Abilities |
0.634 |
| 41 |
Engineering and Technology |
Knowledge |
0.631 |
| 42 |
Speaking |
Skills |
0.622 |
| 43 |
Reading Comprehension |
Skills |
0.580 |
| 44 |
Trunk Strength |
Abilities |
0.552 |
| 45 |
Geography |
Knowledge |
0.533 |
| 46 |
Communications and Media |
Knowledge |
0.527 |
| 47 |
Telecommunications |
Knowledge |
0.514 |
| 48 |
Speech Recognition |
Abilities |
0.510 |
| 49 |
Information Ordering |
Abilities |
0.454 |
| 50 |
Inductive Reasoning |
Abilities |
0.441 |
| 51 |
Active Listening |
Skills |
0.391 |
| 52 |
Coordination |
Skills |
0.379 |
| 53 |
Depth Perception |
Abilities |
0.351 |
| 54 |
Far Vision |
Abilities |
0.348 |
| 55 |
Mechanical |
Knowledge |
0.341 |
| 56 |
Written Comprehension |
Abilities |
0.332 |
| 57 |
Problem Sensitivity |
Abilities |
0.330 |
| 58 |
Monitoring |
Skills |
0.267 |
| 59 |
Time Management |
Skills |
0.210 |
| 60 |
Deductive Reasoning |
Abilities |
0.171 |
| 61 |
Written Expression |
Abilities |
0.162 |
| 62 |
History and Archeology |
Knowledge |
0.160 |
| 63 |
Visual Color Discrimination |
Abilities |
0.155 |
| 64 |
Finger Dexterity |
Abilities |
0.142 |
| 65 |
Glare Sensitivity |
Abilities |
0.091 |
| 66 |
Judgment and Decision-making |
Skills |
0.069 |
| 67 |
Oral Expression |
Abilities |
0.050 |
| 68 |
Peripheral Vision |
Abilities |
0.046 |
| 69 |
Visualization |
Abilities |
0.043 |
| 70 |
Persuasion |
Skills |
0.034 |
| 71 |
Gross Body Equilibrium |
Abilities |
0.012 |
| 72 |
Oral Comprehension |
Abilities |
0.012 |
| 73 |
Spatial Orientation |
Abilities |
-0.053 |
| 74 |
Public Safety and Security |
Knowledge |
-0.081 |
| 75 |
Explosive Strength |
Abilities |
-0.103 |
| 76 |
Management of Financial Resources |
Skills |
-0.138 |
| 77 |
Critical Thinking |
Skills |
-0.176 |
| 78 |
Programming |
Skills |
-0.182 |
| 79 |
Speech Clarity |
Abilities |
-0.299 |
| 80 |
Speed of Limb Movement |
Abilities |
-0.326 |
| 81 |
Speed of Closure |
Abilities |
-0.328 |
| 82 |
Transportation |
Knowledge |
-0.365 |
| 83 |
Troubleshooting |
Skills |
-0.367 |
| 84 |
Systems Analysis |
Skills |
-0.391 |
| 85 |
Selective Attention |
Abilities |
-0.424 |
| 86 |
Sales and Marketing |
Knowledge |
-0.434 |
| 87 |
Near Vision |
Abilities |
-0.440 |
| 88 |
Category Flexibility |
Abilities |
-0.517 |
| 89 |
Negotiation |
Skills |
-0.559 |
| 90 |
Equipment Maintenance |
Skills |
-0.561 |
| 91 |
Systems Evaluation |
Skills |
-0.572 |
| 92 |
Clerical |
Knowledge |
-0.601 |
| 93 |
Night Vision |
Abilities |
-0.701 |
| 94 |
Repairing |
Skills |
-0.715 |
| 95 |
Response Orientation |
Abilities |
-0.737 |
| 96 |
Response Orientation |
Abilities |
-0.737 |
| 97 |
Auditory Attention |
Abilities |
-0.822 |
| 98 |
Operation Monitoring |
Skills |
-0.910 |
| 99 |
Flexibility of Closure |
Abilities |
-0.924 |
| 100 |
Hearing Sensitivity |
Abilities |
-0.944 |
| 101 |
Mathematics - Skills |
Skills |
-0.944 |
| 102 |
Law and Government |
Knowledge |
-0.949 |
| 103 |
Mathematical Reasoning |
Abilities |
-1.024 |
| 104 |
English Language |
Knowledge |
-1.079 |
| 105 |
Medicine and Dentistry |
Knowledge |
-1.233 |
| 106 |
Number Facility |
Abilities |
-1.399 |
| 107 |
Reaction Time |
Abilities |
-2.014 |
| 108 |
Quality Control Analysis |
Skills |
-2.027 |
| 109 |
Economics and Accounting |
Knowledge |
-2.043 |
| 110 |
Computers and Electronics |
Knowledge |
-2.052 |
| 111 |
Wrist-Finger Speed |
Abilities |
-2.053 |
| 112 |
Operation and Control |
Skills |
-2.334 |
| 113 |
Mathematics - Knowledge |
Knowledge |
-2.365 |
UK Skills Ranking
Table C2: A ranking, by average derivative, of the importance of O*NET variables to future demand for UK occupations
| RANK |
O*NET VARIABLE |
CLASS |
AVERAGE DERIVATIVE |
| 1 |
Judgment and Decision-making |
Skills |
4.528 |
| 2 |
Fluency of Ideas |
Abilities |
4.366 |
| 3 |
Originality |
Abilities |
4.229 |
| 4 |
Science |
Skills |
4.228 |
| 5 |
Operations Analysis |
Skills |
3.976 |
| 6 |
Gross Body Equilibrium |
Abilities |
3.708 |
| 7 |
Gross Body Coordination |
Abilities |
3.225 |
| 8 |
Medicine and Dentistry |
Knowledge |
2.896 |
| 9 |
Economics and Accounting |
Knowledge |
2.851 |
| 10 |
Sales and Marketing |
Knowledge |
2.834 |
| 11 |
Psychology |
Knowledge |
2.828 |
| 12 |
Complex Problem Solving |
Skills |
2.725 |
| 13 |
Sociology and Anthropology |
Knowledge |
2.616 |
| 14 |
Active Learning |
Skills |
2.493 |
| 15 |
Foreign Language |
Knowledge |
2.463 |
| 16 |
Systems Evaluation |
Skills |
2.351 |
| 17 |
Education and Training |
Knowledge |
2.283 |
| 18 |
Service Orientation |
Skills |
2.116 |
| 19 |
Management of Personnel Resources |
Skills |
2.107 |
| 20 |
Learning Strategies |
Skills |
2.077 |
| 21 |
Stamina |
Abilities |
2.047 |
| 22 |
Programming |
Skills |
1.873 |
| 23 |
Manual Dexterity |
Abilities |
1.843 |
| 24 |
Information Ordering |
Abilities |
1.831 |
| 25 |
Time Management |
Skills |
1.802 |
| 26 |
Trunk Strength |
Abilities |
1.710 |
| 27 |
Dynamic Strength |
Abilities |
1.645 |
| 28 |
Finger Dexterity |
Abilities |
1.612 |
| 29 |
Quality Control Analysis |
Skills |
1.578 |
| 30 |
Visual Colour Discrimination |
Abilities |
1.453 |
| 31 |
Physics |
Knowledge |
1.439 |
| 32 |
Far Vision |
Abilities |
1.347 |
| 33 |
Visualisation |
Abilities |
1.235 |
| 34 |
Extent Flexibility |
Abilities |
1.196 |
| 35 |
Arm-Hand Steadiness |
Abilities |
1.190 |
| 36 |
Deductive Reasoning |
Abilities |
1.136 |
| 37 |
History and Archeology |
Knowledge |
1.132 |
| 38 |
Coordination |
Skills |
1.095 |
| 39 |
Geography |
Knowledge |
0.940 |
| 40 |
Therapy and Counselling |
Knowledge |
0.938 |
| 41 |
Systems Analysis |
Skills |
0.935 |
| 42 |
Explosive Strength |
Abilities |
0.916 |
| 43 |
Chemistry |
Knowledge |
0.887 |
| 44 |
Administration and Management |
Knowledge |
0.826 |
| 45 |
Management of Material Resources |
Skills |
0.814 |
| 46 |
Dynamic Flexibility |
Abilities |
0.796 |
| 47 |
Oral Expression |
Abilities |
0.796 |
| 48 |
Spatial Orientation |
Abilities |
0.779 |
| 49 |
Communications and Media |
Knowledge |
0.772 |
| 50 |
Near Vision |
Abilities |
0.710 |
| 51 |
Mathematics - Knowledge |
Knowledge |
0.697 |
| 52 |
Social Perceptiveness |
Skills |
0.657 |
| 53 |
Active Listening |
Skills |
0.615 |
| 54 |
Category Flexibility |
Abilities |
0.462 |
| 55 |
Critical Thinking |
Skills |
0.439 |
| 56 |
Equipment Selection |
Skills |
0.434 |
| 57 |
Problem Sensitivity |
Abilities |
0.404 |
| 58 |
Management of Financial Resources |
Skills |
0.353 |
| 59 |
Writing |
Skills |
0.330 |
| 60 |
Inductive Reasoning |
Abilities |
0.265 |
| 61 |
Telecommunications |
Knowledge |
0.205 |
| 62 |
Oral Comprehension |
Abilities |
0.201 |
| 63 |
Technology Design |
Skills |
0.194 |
| 64 |
Philosophy and Theology |
Knowledge |
0.181 |
| 65 |
Installation |
Skills |
0.159 |
| 66 |
Personnel and Human Resources |
Knowledge |
0.150 |
| 67 |
Monitoring |
Skills |
0.108 |
| 68 |
Memorisation |
Abilities |
0.087 |
| 69 |
Rate Control |
Abilities |
0.070 |
| 70 |
Time Sharing |
Abilities |
0.037 |
| 71 |
Speed of Limb Movement |
Abilities |
0.035 |
| 72 |
Speed of Closure |
Abilities |
-0.030 |
| 73 |
Auditory Attention |
Abilities |
-0.070 |
| 74 |
Peripheral Vision |
Abilities |
-0.114 |
| 75 |
Selective Attention |
Abilities |
-0.148 |
| 76 |
Reaction Time |
Abilities |
-0.151 |
| 77 |
Wrist-Finger Speed |
Abilities |
-0.165 |
| 78 |
Written Expression |
Abilities |
-0.200 |
| 79 |
Clerical |
Knowledge |
-0.203 |
| 80 |
Depth Perception |
Abilities |
-0.219 |
| 81 |
Night Vision |
Abilities |
-0.225 |
| 82 |
Speaking |
Skills |
-0.267 |
| 83 |
Speech Recognition |
Abilities |
-0.326 |
| 84 |
Persuasion |
Skills |
-0.431 |
| 85 |
Multilimb Coordination |
Abilities |
-0.432 |
| 86 |
Customer and Personal Service |
Knowledge |
-0.522 |
| 87 |
English Language |
Knowledge |
-0.571 |
| 88 |
Glare Sensitivity |
Abilities |
-0.665 |
| 89 |
Instructing |
Skills |
-0.678 |
| 90 |
Flexibility of Closure |
Abilities |
-0.696 |
| 91 |
Transportation |
Knowledge |
-0.698 |
| 92 |
Operation Monitoring |
Skills |
-0.780 |
| 93 |
Number Facility |
Abilities |
-0.808 |
| 94 |
Hearing Sensitivity |
Abilities |
-0.848 |
| 95 |
Mathematical Reasoning |
Abilities |
-0.868 |
| 96 |
Negotiation |
Skills |
-1.058 |
| 97 |
Response Orientation |
Abilities |
-1.174 |
| 98 |
Design |
Knowledge |
-1.230 |
| 99 |
Troubleshooting |
Skills |
-1.277 |
| 100 |
Mathematics - Skills |
Skills |
-1.320 |
| 101 |
Mathematical Reasoning |
Abilities |
-1.024 |
| 102 |
English Language |
Knowledge |
-1.079 |
| 103 |
Medicine and Dentistry |
Knowledge |
-1.233 |
| 104 |
Number Facility |
Abilities |
-1.399 |
| 105 |
Reaction Time |
Abilities |
-2.014 |
| 106 |
Quality Control Analysis |
Skills |
-2.027 |
| 107 |
Economics and Accounting |
Knowledge |
-2.043 |
| 108 |
Computers and Electronics |
Knowledge |
-2.052 |
| 109 |
Wrist-Finger Speed |
Abilities |
-2.053 |
| 110 |
Operation and Control |
Skills |
-2.334 |
| 111 |
Mathematics - Knowledge |
Knowledge |
-2.365 |
| 112 |
Rate Control |
Abilities |
-2.684 |
| 113 |
Mathematics - Knowledge |
Knowledge |
-2.365 |
APPENDIX D. UK-US OCCUPATION CROSSWALK
METHODOLOGY
Given that the UK lacks a comprehensive system for collecting and disseminating information on occupational and skills requirements, it is necessary to exploit the US information that is already collected for O*NET. This is done by mapping, or 'crosswalking', the US and UK SOC taxonomies. Specifically, our crosswalk is based on the application programming interface (API) for the LMI for All/O*NET SOC to UK SOC crosswalk (UK Commission for Employment and Skills, 2017b) (under o-net/soc2onet/).
A feature of O*NET is that there are significantly more occupations in the database than in the UK SOC (at four-digit level). As a result, some UK occupations are crosswalked to more than one equivalent US occupation in LMI for All. Where a direct single match is not possible, we match the UK SOC to the occupation with the highest employment. This simple rule is justified on the grounds that it is more likely to be representative of the other occupations in the group.
To generate employment estimates, we use the BLS Occupational Employment Statistics (OES), a semi-annual survey of approximately 200,000 non-farm business establishments. As the O*NET occupational classification (eight-digit) is slightly more detailed than the six-digit 2010 SOC system, for which employment is reported, we are required to ignore the last two digits. After investigation, we believe that the information loss associated with this approach is minimal and superior to more complex procedures. We use May 2015 employment data - as in the rest of the analysis - and compare it with estimates from more recently available data (May 2016) and from 2006 (May 2006) to ensure that the results are robust over time.
In a small number of cases, two or more occupations account for the highest employment in a group. This arises from the fact while some occupation codes differ at the eight-digit level, they are identical at the six-digit level. As a general rule in such cases we select the more generic occupation since it better approximates the level of detail found in the UK SOC. In many cases this is easy to establish from the respective position of the occupations in the SOC hierarchy. For example, Statisticians (15-2041.00) is chosen over Biostatisticians (15-2041.01). In other cases, we apply our judgment to determine which code is most generic.
We assess the degree of error introduced by using only one O*NET code as a result of our 'highest employment' rule. Ideally, the code with the highest employment should account for all the employment in the group. We find evidence that, in many cases, these codes do account for the lion's share of employment. In sum, our one-to-one crosswalk generated using this rule contains 283 unique US SOC codes, which account for 70% of total US employment.
The LMI for All API does not provide a crosswalk for 23 UK occupations. As a result, we manually choose 23 satisfactory US matches (designated by * below). Four UK occupations have no US counterpart with relevant job tasks and skills data in O*NET and are consequently excluded.
Table D1: The UK-to-US Occupation Crosswalk basedon LMI for All data
| UK SOC |
UK TITLE |
US O*NET SOC |
US TITLE |
| 1115 |
Chief executives and senior officials |
11-1011.00 |
Chief Executives |
| 1121 |
Production managers and directors in manufacturing |
11-1021.00 |
General and Operations Managers |
| 1122 |
Production managers and directors in construction |
11-9021.00 |
Construction Managers |
| 1123* |
Production managers and directors in mining and energy |
11-3051.00 |
Industrial Production Managers |
| 1131 |
Financial managers and directors |
11-3031.02 |
Financial Managers, Branch or Department |
| 1132 |
Marketing and sales directors |
11-2021.00 |
Marketing Managers |
| 1133 |
Purchasing managers and directors |
11-9199.04 |
Supply Chain Managers |
| 1134 |
Advertising and public relations directors |
11-2031.00 |
Public Relations and Fundraising Managers |
| 1135* |
Human resource managers and directors |
11-3121.00 |
Human Resources Managers |
| 1136 |
Information technology and telecommunications directors |
11-3021.00 |
Computer and Information Systems Managers |
| 1139 |
Functional managers and directors n.e.c. |
43-1011.00 |
First-line Supervisors of Office and Administrative Support Workers |
| 1150 |
Financial institution managers and directors |
11-3031.02 |
Financial Managers, Branch or Department |
| 1161 |
Managers and directors in transport and distribution |
11-3071.01 |
Transportation, Storage and Distribution Managers |
| 1162 |
Managers and directors in storage and warehousing |
53-1021.00 |
First-line Supervisors of Helpers, Laborers and Material Movers, Hand |
| 1172 |
Senior police officers |
33-1012.00 |
First-line Supervisors of Police and Detectives |
| 1173 |
Senior officers in fire, ambulance, prison and related services |
33-2022.00 |
Forest Fire Inspectors and Prevention Specialists |
| 1181 |
Health services and public health managers and directors |
11-9111.00 |
Medical and Health Services Managers |
| 1184 |
Social services managers and directors |
11-9151.00 |
Social and Community Service Managers |
| 1190 |
Managers and directors in retail and wholesale |
41-1011.00 |
First-line Supervisors of Retail Sales Workers |
| 1211 |
Managers and proprietors in agriculture and horticulture |
19-1031.02 |
Range Managers |
| 1213* |
Managers and proprietors in forestry, fishing and related services |
19-1032.00 |
Foresters |
| 1221 |
Hotel and accommodation managers and proprietors |
39-9041.00 |
Residential Advisors |
| 1223 |
Restaurant and catering establishment managers and proprietors |
35-1012.00 |
First-line Supervisors of Food Preparation and Serving Workers |
| 1224 |
Publicans and managers of licensed premises |
11-9051.00 |
Food Service Managers |
| 1225 |
Leisure and sports managers |
39-1021.01 |
Spa Managers |
| 1226* |
Travel agency managers and proprietors |
41-3041.00 |
Travel Agents |
| 1241 |
Health care practice managers |
11-9111.00 |
Medical and Health Services Managers |
| 1242 |
Residential, day and domiciliary care managers and proprietors |
11-9111.00 |
Medical and Health Services Managers |
| 1251 |
Property, housing and estate managers |
11-9141.00 |
Property, Real Estate and Community Association Managers |
| 1252 |
Garage managers and proprietors |
49-1011.00 |
First-line Supervisors of Mechanics, Installers and Repairers |
| 1253 |
Hairdressing and beauty salon managers and proprietors |
39-1021.00 |
First-line Supervisors of Personal Service Workers |
| 1254 |
Shopkeepers and proprietors - wholesale and retail |
41-2031.00 |
Retail Salespersons |
| 1255 |
Waste disposal and environmental services managers |
17-2081.00 |
Environmental Engineers |
| 1259 |
Managers and proprietors in other services n.e.c. |
21-2021.00 |
Directors, Religious Activities and Education |
| 2111 |
Chemical scientists |
19-2031.00 |
Chemists |
| 2112 |
Biological scientists and biochemists |
17-2199.01 |
Biochemical Engineers |
| 2113 |
Physical scientists |
19-2042.00 |
Geoscientists, except Hydrologists and Geographers |
| 2114 |
Social and humanities scientists |
19-4061.00 |
Social Science Research Assistants |
| 2119 |
Natural and social science professionals n.e.c. |
11-9121.00 |
Natural Sciences Managers |
| 2121 |
Civil engineers |
17-2051.00 |
Civil Engineers |
| 2122 |
Mechanical engineers |
17-2141.00 |
Mechanical Engineers |
| 2123 |
Electrical engineers |
17-2071.00 |
Electrical Engineers |
| 2124 |
Electronics engineers |
17-2072.00 |
Electronics Engineers, except Computer |
| 2126* |
Design and development engineers |
17-2112.00 |
Industrial Engineers |
| 2127 |
Production and process engineers |
17-2112.00 |
Industrial Engineers |
| 2129 |
Engineering professionals n.e.c. |
13-1199.01 |
Energy Auditors |
| 2133 |
IT specialist managers |
11-3021.00 |
Computer and Information Systems Managers |
| 2134* |
IT project and programme managers |
15-1199.09 |
Information Technology Project Managers |
| 2135* |
IT business analysts, architects and systems designers |
15-1199.09 |
Information Technology Project Managers |
| 2136* |
Programmers and software development professionals |
15-1131.00 |
Computer Programmers |
| 2137 |
Web design and development professionals |
43-9031.00 |
Desktop Publishers |
| 2139* |
Information technology and telecommunications professionals n.e.c. |
15-1143.01 |
Telecommunications Engineering Specialists |
| 2141 |
Conservation professionals |
19-1031.01 |
Soil and Water Conservationists |
| 2142 |
Environment professionals |
19-2041.00 |
Environmental Scientists and Specialists, Including Health |
| 2150* |
Research and development managers |
11-9121.01 |
Clinical Research Coordinators |
| 2211 |
Medical practitioners |
29-1069.02 |
Dermatologists |
| 2212 |
Psychologists |
19-3031.02 |
Clinical Psychologists |
| 2213 |
Pharmacists |
29-1051.00 |
Pharmacists |
| 2214 |
Ophthalmic opticians |
29-1041.00 |
Optometrists |
| 2215 |
Dental practitioners |
29-1021.00 |
Dentists, General |
| 2216 |
Veterinarians |
29-1131.00 |
Veterinarians |
| 2217 |
Medical radiographers |
29-2032.00 |
Diagnostic Medical Sonographers |
| 2218 |
Podiatrists |
29-1081.00 |
Podiatrists |
| 2219 |
Health professionals n.e.c. |
31-9092.00 |
Medical Assistants |
| 2221 |
Physiotherapists |
29-1123.00 |
Physical Therapists |
| 2222 |
Occupational therapists |
29-1122.00 |
Occupational Therapists |
| 2223 |
Speech and language therapists |
29-1127.00 |
Speech-Language Pathologists |
| 2229 |
Therapy professionals n.e.c. |
29-1126.00 |
Respiratory Therapists |
| 2231 |
Nurses |
29-2061.00 |
Licensed Practical and Licensed Vocational Nurses |
| 2232 |
Midwives |
29-9099.01 |
Midwives |
| 2311 |
Higher education teaching professionals |
25-1011.00 |
Business Teachers, Postsecondary |
| 2312 |
Further education teaching professional |
25-1194.00 |
Vocational Education Teachers, Post-secondary |
| 2314 |
Secondary education teaching professionals |
25-2031.00 |
Secondary School Teachers, except Special and Career/Technical Education |
| 2315 |
Primary and nursery education teaching professionals |
25-2021.00 |
Elementary School Teachers, except Special Education |
| 2316* |
Special needs education teaching professionals |
25-2053.00 |
Special Education Teachers, Middle School |
| 2317 |
Senior professionals of educational establishments |
11-9033.00 |
Education Administrators, Post-secondary |
| 2318 |
Education advisers and school inspectors |
11-9032.00 |
Education Administrators, Elementary and Secondary School |
| 2319 |
Teaching and other educational professionals n.e.c. |
25-3021.00 |
Self-enrichment Education Teachers |
| 2412 |
Barristers and judges |
13-1041.06 |
Coroners |
| 2413 |
Solicitor |
23-1011.00 |
Lawyers |
| 2419 |
Legal professionals n.e.c. |
23-1011.00 |
Lawyers |
| 2421 |
Chartered and certified accountants |
13-2011.01 |
Accountants |
| 2423 |
Management consultants and business analysts |
13-2099.02 |
Risk Management Specialists |
| 2424 |
Business and financial project management professionals |
13-1111.00 |
Management Analysts |
| 2425 |
Actuaries, economists and statisticians |
15-2041.00 |
Statisticians |
| 2426 |
Business and related research professionals |
33-3021.03 |
Criminal Investigators and Special Agents |
| UK SOC |
UK TITLE |
US O*NET SOC |
US TITLE |
| 2429 |
Business, research and administrative professionals n.e.c. |
43-1011.00 |
First-line Supervisors of Office and Administrative Support Workers |
| 2431 |
Architects |
17-1011.00 |
Architects, except Landscape and Naval |
| 2432 |
Town planning officers |
19-3051.00 |
Urban and Regional Planners |
| 2433 |
Quantity surveyors |
13-1051.00 |
Cost Estimators |
| 2434 |
Chartered surveyors |
17-1022.00 |
Surveyors |
| 2435 |
Chartered architectural technologists |
17-3011.01 |
Architectural Drafters |
| 2436 |
Construction project managers and related professionals |
19-3099.01 |
Transportation Planners |
| 2442 |
Social workers |
21-1021.00 |
Child, Family and School Social Workers |
| 2443 |
Probation officers |
21-1092.00 |
Probation Officers and Correctional Treatment Specialists |
| 2444 |
Clergy |
21-2011.00 |
Clergy |
| 2449* |
Welfare professionals n.e.c. |
11-9151.00 |
Social and Community Service Managers |
| 2451 |
Librarians |
25-4021.00 |
Librarians |
| 2452 |
Archivists and curators |
25-4012.00 |
Curators |
| 2461 |
Quality control and planning engineers |
17-2199.02 |
Validation Engineers |
| 2462 |
Quality assurance and regulatory professionals |
11-9199.02 |
Compliance Managers |
| 2463 |
Environmental health professionals |
19-2041.00 |
Environmental Scientists and Specialists, Including Health |
| 2471 |
Journalists, newspaper and periodical editors |
27-3041.00 |
Editors |
| 2472 |
Public relations professionals |
27-3031.00 |
Public Relations Specialists |
| 2473 |
Advertising accounts managers and creative directors |
27-1011.00 |
Art Directors |
| 3111 |
Laboratory technicians |
29-2011.00 |
Medical and Clinical Laboratory Technologists |
| 3112 |
Electrical and electronics technicians |
17-3023.01 |
Electronics Engineering Technicians |
| 3113 |
Engineering technicians |
17-3023.03 |
Electrical Engineering Technicians |
| 3114 |
Building and civil engineering technicians |
17-3022.00 |
Civil Engineering Technicians |
| 3115 |
Quality assurance technicians |
19-4099.01 |
Quality Control Analysts |
| 3116 |
Planning, process and production technicians |
17-3029.09 |
Manufacturing Production Technicians |
| 3119 |
Science, engineering and production technicians n.e.c. |
19-4099.03 |
Remote Sensing Technicians |
| 3121 |
Architectural and town planning technicians |
19-4061.01 |
City and Regional Planning Aides |
| 3122 |
Draughtspersons |
17-3011.01 |
Architectural Drafters |
| 3131 |
IT operations technicians |
15-2041.02 |
Clinical Data Managers |
| 3132* |
IT user support technicians |
15-1151.00 |
Computer User Support Specialists |
| 3213 |
Paramedics |
29-2041.00 |
Emergency Medical Technicians and Paramedics |
| 3216 |
Dispensing opticians |
29-2081.00 |
Opticians, Dispensing |
| 3217 |
Pharmaceutical technicians |
29-2052.00 |
Pharmacy Technicians |
| 3218 |
Medical and dental technicians |
29-2021.00 |
Dental Hygienists |
| 3219 |
Health associate professionals n.e.c. |
29-1122.01 |
Low Vision Therapists, Orientation and Mobility Specialists and Vision Rehabilitation Specialists |
| 3231 |
Youth and community workers |
21-1093.00 |
Social and Human Service Assistants |
| 3233 |
Child and early years officers |
21-1021.00 |
Child, Family and School Social Workers |
| 3234 |
Housing officers |
11-9141.00 |
Property, Real Estate and Community Association Managers |
| 3235 |
Counsellors |
21-1012.00 |
Educational, Guidance, School, and Vocational Counselors |
| 3239 |
Welfare and housing associate professionals n.e.c. |
43-4051.03 |
Patient Representatives |
| 3312 |
Police officers (sergeant and below) |
33-3051.01 |
Police Patrol Officers |
| 3313 |
Fire service officers (watch manager and below) |
33-2011.01 |
Municipal Firefighters |
| 3314 |
Prison service officers (below principal officer) |
33-3012.00 |
Correctional Officers and Jailers |
| 3315 |
Police community support officers |
33-3051.01 |
Police Patrol Officers |
| 3319 |
Protective service associate professionals n.e.c. |
11-9199.08 |
Lost Prevention Managers |
| 3411 |
Artists |
27-1013.00 |
Fine Artists, Including Painters, Sculptors, and Illustrators |
| 3412 |
Authors, writers and translators |
27-3042.00 |
Technical Writers |
| 3413 |
Actors, entertainers and presenters |
27-2011.00 |
Actors |
| 3414 |
Dancers and choreographers |
27-2031.00 |
Dancers |
| 3415 |
Musicians |
27-2042.02 |
Musicians, Instrumental |
| 3416 |
Arts officers, producers and directors |
27-2012.01 |
Producers |
| 3417 |
Photographers, audiovisual and broadcasting equipment operators |
27-4021.00 |
Photographers |
| 3421 |
Graphic designers |
27-1024.00 |
Graphic Designers |
| 3422 |
Product, clothing and related designers |
27-1025.00 |
Interior Designers |
| 3441 |
Sports players |
27-2021.00 |
Athletes and Sports Competitors |
| 3442 |
Sports coaches, instructors and officials |
27-2022.00 |
Coaches and Scouts |
| 3443 |
Fitness instructors |
39-9031.00 |
Fitness Trainers and Aerobics Instructors |
| 3538 |
Financial accounts managers |
11-9199.03 |
Investment Fund Managers |
| 3511 |
Air traffic controllers |
53-2021.00 |
Air Traffic Controllers |
| 3512 |
Aircraft pilots and flight engineers |
53-2011.00 |
Airline Pilots, Copilots and Flight Engineers |
| 3513 |
Ship and hovercraft officers |
53-5021.01 |
Ship and Boat Captains |
| 3520 |
Legal associate professionals |
23-2011.00 |
Paralegals and Legal Assistants |
| 3531 |
Estimators, valuers and assessors |
13-1031.02 |
Insurance Adjustors, Examiners and Investigators |
| 3532 |
Brokers |
13-1199.03 |
Customs Brokers |
| 3534 |
Finance and investment analysts and advisers |
13-2051.00 |
Financial Analysts |
| 3535 |
Taxation experts |
13-2082.00 |
Tax Preparers |
| 3536 |
Importers and exporters |
13-1199.03 |
Customs Brokers |
| 3537 |
Financial and accounting technicians |
43-3031.00 |
Bookkeeping, Accounting and Auditing Clerks |
| 3539 |
Business and related associate professionals n.e.c. |
13-1111.00 |
Management Analysts |
| 3541 |
Buyers and procurement officers |
13-1023.00 |
Purchasing Agents, except Wholesale, Retail and Farm Products |
| 3542 |
Business sales executives |
41-4012.00 |
Sales Representatives, Wholesale and Manufacturing, except Technical and Scientific Products |
| 3543 |
Marketing associate professionals |
41-3011.00 |
Advertising Sales Agents |
| 3544 |
Estate agents and auctioneers |
41-9022.00 |
Real Estate Sales Agents |
| 3545 |
Sales accounts and business development managers |
11-2022.00 |
Sales Managers |
| 3546 |
Conference and exhibition managers and organisers |
13-1121.00 |
Meeting, Convention and Event Planners |
| 3550 |
Conservation and environmental associate professionals |
19-4091.00 |
Environmental Science and Protection Technicians, Including Health |
| 3561* |
Public services associate professionals |
11-3011.00 |
Administrative Services Managers |
| 3562 |
Human resources and industrial relations officers |
13-1041.03 |
Equal Opportunity Representatives and Officers |
| 3563 |
Vocational and industrial trainers and instructors |
25-9031.00 |
Instructional Coordinators |
| 3564 |
Careers advisers and vocational guidance specialists |
21-1012.00 |
Educational, Guidance, School and Vocational Counsellors |
| 3565 |
Inspectors of standards and regulations |
13-1041.01 |
Environmental Compliance Inspectors |
| 3567 |
Health and safety officers |
29-9011.00 |
Occupational Health and Safety Specialists |
| 4112 |
National government administrative occupations |
43-4061.00 |
Eligibility Interviewers, Government Programmes |
| 4113 |
Local government administrative occupations |
43-4031.02 |
Municipal Clerks |
| 4114* |
Officers of non-governmental organisations |
11-1011.00 |
Chief Executives |
| 4121 |
Credit controllers |
43-4041.01 |
Credit Authorizers |
| 4122 |
Book-keepers, payroll managers and wages clerks |
43-3031.00 |
Bookkeeping, Accounting and Auditing Clerks |
| 4123 |
Bank and post office clerks |
43-3071.00 |
Tellers |
| 4124 |
Finance officers |
43-3031.0 |
Bookkeeping, Accounting and Auditing Clerks |
| 4129 |
Financial administrative occupations n.e.c. |
11-3031.01 |
Treasurers and Controllers |
| 4131 |
Records clerks and assistants |
43-5061.00 |
Production, Planning and Expediting Clerks |
| 4132 |
Pensions and insurance clerks and assistants |
43-9041.01 |
Insurance Claims Clerks |
| 4133 |
Stock control clerks and assistants |
43-5081.01 |
Stock Clerks, Sales Floor |
| 4134 |
Transport and distribution clerks and assistants |
43-5071.00 |
Shipping, Receiving and Traffic Clerks |
| 4135 |
Library clerks and assistants |
43-4121.00 |
Library Assistants, Clerical |
| 4138 |
Human resources administrative occupations |
43-3051.00 |
Payroll and Timekeeping Clerks |
| 4151 |
Sales administrators |
43-4151.00 |
Order Clerks |
| 4159 |
Other administrative occupations n.e.c. |
43-9061.00 |
Office Clerks, General |
| 4161 |
Office managers |
11-3011.00 |
Administrative Services Managers |
| 4162 |
Office supervisors |
43-1011.00 |
First-line Supervisors of Office and Administrative Support Workers |
| 4211 |
Medical secretaries |
43-6013.00 |
Medical Secretaries |
| 4212 |
Legal secretaries |
43-6012.00 |
Legal Secretaries |
| 4213 |
School secretaries |
43-6014.00 |
Secretaries and Administrative Assistants, except Legal, Medical and Executive |
| 4214 |
Company secretaries |
43-6014.00 |
Secretaries and Administrative Assistants, except Legal, Medical and Executive |
| 4215 |
Personal assistants and other secretaries |
43-6014.00 |
Secretaries and Administrative Assistants, except Legal, Medical and Executive |
| 4216 |
Receptionists |
43-4171.00 |
Receptionists and Information Clerks |
| 4217 |
Typists and related keyboard occupations |
43-3021.01 |
Statement Clerks |
| 5111 |
Farmers |
19-4099.02 |
Precision Agriculture Technicians |
| 5112 |
Horticultural trades |
45-1011.07 |
First-line Supervisors of Agricultural Crop and Horticultural Workers |
| 5113 |
Gardeners and landscape gardeners |
37-1012.00 |
First-line Supervisors of Landscaping, Lawn Service and Groundskeeping Workers |
| 5114 |
Groundsmen and greenkeepers |
37-3011.00 |
Landscaping and Groundskeeping Workers |
| 5119 |
Agricultural and fishing trades n.e.c. |
45-1011.06 |
First-line Supervisors of Aquacultural Workers |
| 5211 |
Smiths and forge workers |
51-4022.00 |
Forging Machine Setters, Operators and Tenders, Metal and Plastic |
| 5212 |
Moulders, core makers and die casters |
51-4072.00 |
Molding, Coremaking and Casting Machine Setters, Operators and Tenders, Metal and Plastic |
| 5213 |
Sheet metal workers |
47-2211.00 |
Sheet Metal Workers |
| 5214 |
Metal plate workers and riveters |
47-2011.00 |
Boilermakers |
| 5215 |
Welding trades |
51-4121.06 |
Welders, Cutters and Welder Fitters |
| 5216 |
Pipe fitters |
47-2152.01 |
Pipefitters and Steamfitters |
| 5221 |
Metal machining setters and setter-operators |
51-4031.00 |
Cutting, Punching and Press Machine Setters, Operators and Tenders, Metal and Plastic |
| 5222 |
Tool makers, tool fitters and markers-out |
51-4111.00 |
Tool and Die Makers |
| 5223 |
Metal working production and maintenance fitters |
49-9041.00 |
Industrial Machinery Mechanics |
| 5224 |
Precision instrument makers and repairers |
49-9062.00 |
Medical Equipment Repairers |
| 5225 |
Air-conditioning and refrigeration engineers |
49-9021.02 |
Refrigeration Mechanics and Installers |
| 5231 |
Vehicle technicians, mechanics and electricians |
49-3023.01 |
Automotive Master Mechanics |
| 5232 |
Vehicle body builders and repairers |
49-3021.00 |
Automotive Body and Related Repairers |
| 5234 |
Vehicle paint technicians |
51-9122.00 |
Painters, Transportation Equipment |
| 5235 |
Aircraft maintenance and related trades |
49-3011.00 |
Aircraft Mechanics and Service Technicians |
| 5236 |
Boat and ship builders and repairers |
49-3051.00 |
Motorboat Mechanics and Service Technicians |
| 5237 |
Rail and rolling stock builders and repairers |
53-4011.00 |
Locomotive Engineers |
| 5241 |
Electricians and electrical fitters |
47-2111.00 |
Electricians |
| 5242 |
Telecommunications engineers |
49-2022.00 |
Telecommunications Equipment Installers and Repairers, except Line Installers |
| 5244 |
TV, video and audio engineers |
27-4011.00 |
Audio and Video Equipment Technicians |
| 5245 |
IT engineers |
17-2061.00 |
Computer Hardware Engineers |
| 5249 |
Electrical and electronic trades n.e.c. |
49-9051.00 |
Electrical Power-line Installers and Repairers |
| 5250 |
Skilled metal, electrical and electronic trades supervisors |
51-1011.00 |
First-line Supervisors of Production and Operating Workers |
| 5311 |
Steel erectors |
47-2221.00 |
Structural Iron and Steel Workers |
| 5312 |
Bricklayers and masons |
47-2081.00 |
Drywall and Ceiling Tile Installers |
| 5313 |
Roofers, roof tilers and slaters |
47-2181.00 |
Roofers |
| 5314 |
Plumbers and heating and ventilating engineers |
47-2152.02 |
Plumbers |
| 5315 |
Carpenters and joiners |
47-2031.01 |
Construction Carpenters |
| 5316 |
Glaziers, window fabricators and fitters |
47-2121.00 |
Glaziers |
| 5319 |
Construction and building trades n.e.c. |
47-4031.00 |
Fence Erectors |
| 5321 |
Plasterers |
47-2161.00 |
Plasterers and Stucco Masons |
| 5322 |
Floorers and wall tilers |
47-2044.00 |
Tile and Marble Setters |
| 5323 |
Painters and decorators |
47-2141.00 |
Painters, Construction and Maintenance |
| 5330 |
Construction and building trades supervisors |
47-1011.00 |
First-line Supervisors of Construction Trades and Extraction Workers |
| 5411 |
Weavers and knitters |
51-6063.00 |
Textile Knitting and Weaving Machine Setters, Operators and Tenders |
| 5412 |
Upholsterers |
51-6093.00 |
Upholsterers |
| 5413 |
Footwear and leather working trades |
51-6041.00 |
Shoe and Leather Workers and Repairers |
| 5414 |
Tailors and dressmakers |
51-6052.00 |
Tailors, Dressmakers and Custom Sewers |
| 5419 |
Textiles, garments and related trades n.e.c. |
51-9031.00 |
Cutters and Trimmers, Hand |
| 5421* |
Pre-press technicians |
51-5111.00 |
Prepress Technicians and Workers |
| 5422* |
Printers |
51-5112.00 |
Printing Press Operators |
| 5423* |
Print finishing and binding workers |
51-5113.00 |
Print Binding and Finishing Workers |
| 5431 |
Butchers |
51-3021.00 |
Butchers and Meat Cutters |
| 5432 |
Bakers and flour confectioners |
51-3011.00 |
Bakers |
| 5433 |
Fishmongers and poultry dressers |
51-3022.00 |
Meat, Poultry and Fish Cutters and Trimmers |
| 5434 |
Chefs |
35-1011.00 |
Chefs and Head Cooks |
| 5435 |
Cooks |
35-2014.00 |
Cooks, Restaurant |
| 5436 |
Catering and bar managers |
11-9051.00 |
Food Service Managers |
| 5441 |
Glass and ceramics makers, decorators and finishers |
51-9195.05 |
Potters, Manufacturing |
| 5442 |
Furniture makers and other craft woodworkers |
51-7011.00 |
Cabinetmakers and Bench Carpenters |
| 5443 |
Florists |
27-1023.00 |
Floral Designers |
| 5449 |
Other skilled trades n.e.c. |
51-9121.00 |
Coating, Painting and Spraying Machine Setters, Operators and Tenders |
| 6121 |
Nursery nurses and assistants |
39-9011.00 |
Childcare Workers |
| 6122 |
Childminders and related occupations |
39-9011.00 |
Childcare Workers |
| 6123 |
Playworkers |
39-9011.00 |
Childcare Workers |
| 6125 |
Teaching assistants |
25-9041.00 |
Teacher Assistants |
| 6126 |
Educational support assistants |
25-9041.00 |
Teacher Assistants |
| 6131 |
Veterinary nurses |
29-2056.00 |
Veterinary Technologists and Technicians |
| 6132 |
Pest control officers |
37-2021.00 |
Pest Control Workers |
| 6139 |
Animal care services occupations n.e.c. |
39-2021.00 |
Nonfarm Animal Caretakers |
| 6141 |
Nursing auxiliaries and assistants |
31-9099.01 |
Speech-language Pathology Assistants |
| 6142 |
Ambulance staff (excluding paramedics) |
53-3011.00 |
Ambulance Drivers and Attendants, except Emergency Medical Technicians |
| 6143 |
Dental nurses |
31-9091.00 |
Dental Assistants |
| 6144 |
Houseparents and residential wardens |
39-9041.00 |
Residential Advisors |
| 6145 |
Care workers and home carers |
39-9021.00 |
Personal Care Aides |
| 6146 |
Senior care workers |
39-1021.00 |
First-line Supervisors of Personal Service Workers |
| 6147* |
Care escorts |
39-9021.00 |
Personal Care Aides |
| 6148 |
Undertakers, mortuary and crematorium assistants |
39-4021.00 |
Funeral Attendants |
| 6211 |
Sports and leisure assistants |
39-9032.00 |
Recreation Workers |
| 6212 |
Travel agents |
43-4181.00 |
Reservation and Transportation Ticket Agents and Travel Clerks |
| 6214* |
Air travel assistants |
53-2031.00 |
Flight Attendants |
| 6215 |
Rail travel assistants |
53-4031.00 |
Railroad Conductors and Yardmasters |
| 6219* |
Leisure and travel service occupations n.e.c. |
43-4051.00 |
Customer Service Representatives |
| 6221 |
Hairdressers and barbers |
39-5012.00 |
Hairdressers, Hairstylists and Cosmetologists |
| 6222 |
Beauticians and related occupations |
39-5092.00 |
Manicurists and Pedicurists |
| 6231 |
Housekeepers and related occupations |
39-9021.00 |
Personal Care Aides |
| 6232 |
Caretakers |
37-2011.00 |
Janitors and Cleaners, except Maids and Housekeeping Cleaners |
| 6240 |
Cleaning and housekeeping managers and supervisors |
39-1021.00 |
First-line Supervisors of Personal Service Workers |
| 7111 |
Sales and retail assistants |
41-2031.00 |
Retail Salespersons |
| 7112 |
Retail cashiers and checkout operators |
41-2011.00 |
Cashiers |
| 7113 |
Telephone salespersons |
41-9041.00 |
Telemarketers |
| 7114 |
Pharmacy and other dispensing assistants |
31-9095.00 |
Pharmacy Aides |
| 7115 |
Vehicle and parts salespersons and advisers |
41-2022.00 |
Parts Salespersons |
| 7121 |
Collector salespersons and credit agents |
41-3021.0 |
Insurance Sales Agents |
| 7122 |
Debt, rent and other cash collectors |
43-3011.00 |
Bill and Account Collectors |
| 7123 |
Roundspersons and van salespersons |
53-3031.00 |
Driver/Sales Workers |
| 7124 |
Market and street traders and assistants |
41-9091.00 |
Door-to-Door Sales Workers, News and Street Vendors and Related Workers |
| 7125 |
Merchandisers and window dressers |
27-1026.00 |
Merchandise Displayers and Window Trimmers |
| 7129 |
Sales-related occupations n.e.c. |
41-9011.00 |
Demonstrators and Product Promoters |
| 7130 |
Sales supervisors |
41-1011.00 |
First-line Supervisors of Retail Sales Workers |
| 7211 |
Call and contact centre occupations |
43-4051.00 |
Customer Service Representatives |
| 7213 |
Telephonists |
43-2011.00 |
Switchboard Operators, Including Answering Service |
| 7214 |
Communication operators |
43-5031.00 |
Police, Fire and Ambulance Dispatchers |
| 7215 |
Market research interviewers |
43-4111.00 |
Interviewers, except Eligibility and Loan |
| 7219 |
Customer service occupations n.e.c. |
43-4051.00 |
Customer Service Representatives |
| 7220 |
Customer service managers and supervisors |
43-4051.00 |
Customer Service Representatives |
| 8111 |
Food, drink and tobacco process operatives |
51-3092.00 |
Food Batchmakers |
| 8112 |
Glass and ceramics process operatives |
51-9195.04 |
Glass Blowers, Molders, Benders and Finishers |
| 8113 |
Textile process operatives |
51-6064.00 |
Textile Winding, Twisting and Drawing Out Machine Setters, Operators and Tenders |
| 8114 |
Chemical and related process operatives |
51-9023.00 |
Mixing and Blending Machine Setters, Operators and Tenders |
| 8115 |
Rubber process operatives |
51-9197.00 |
Tire Builders |
| 8116 |
Plastics process operatives |
51-2091.00 |
Fiberglass Laminators and Fabricators |
| 8117 |
Metal making and treating process operatives |
51-4021.00 |
Extruding and Drawing Machine Setters, Operators and Tenders, Metal and Plastic |
| 8118 |
Electroplaters |
51-4193.00 |
Plating and Coating Machine Setters, Operators and Tenders, Metal and Plastic |
| 8119 |
Process operatives n.e.c. |
51-9195.07 |
Molding and Casting Workers |
| 8121 |
Paper and wood machine operatives |
51-9196.00 |
Paper Goods Machine Setters, Operators and Tenders |
| 8122 |
Coal mine operatives |
47-5061.00 |
Roof Bolters, Mining |
| 8123 |
Quarry workers and related operatives |
47-5013.00 |
Service Unit Operators, Oil, Gas and Mining |
| 8124 |
Energy plant operatives |
51-8013.00 |
Power Plant Operators |
| 8125 |
Metal working machine operatives |
51-4041.00 |
Machinists |
| 8126 |
Water and sewerage plant operatives |
51-8031.00 |
Water and Wastewater Treatment Plant and System Operators |
| 8127* |
Printing machine assistants |
51-5112.00 |
Printing Press Operators |
| 8129 |
Plant and machine operatives n.e.c. |
51-9041.00 |
Extruding, Forming, Pressing and Compacting Machine Setters, Operators and Tenders |
| 8131 |
Assemblers (electrical and electronic products) |
51-4121.07 |
Solderers and Brazers |
| 8132 |
Assemblers (vehicles and metal goods) |
51-2031.00 |
Engine and Other Machine Assemblers |
| 8133 |
Routine inspectors and testers |
51-9061.00 |
Inspectors, Testers, Sorters, Samplers and Weighers |
| 8134 |
Weighers, graders and sorters |
45-2041.00 |
Graders and Sorters, Agricultural Products |
| 8135 |
Tyre, exhaust and windscreen fitters |
49-3093.00 |
Tire Repairers and Changers |
| 8137 |
Sewing machinists |
51-6031.00 |
Sewing Machine Operators |
| 8139 |
Assemblers and routine operatives n.e.c. |
51-2092.00 |
Team Assemblers |
| 8141 |
Scaffolders, stagers and riggers |
49-9096.00 |
Riggers |
| 8142 |
Road construction operatives |
47-2051.00 |
Cement Masons and Concrete Finishers |
| 8143 |
Rail construction and maintenance operatives |
47-4061.00 |
Rail-track Laying and Maintenance Equipment Operators |
| 8149 |
Construction operatives n.e.c. |
47-4041.00 |
Hazardous Materials Removal Workers |
| 8211 |
Large goods vehicle drivers |
53-3032.00 |
Heavy and Tractor-Trailer Truck Drivers |
| 8212 |
Van drivers |
53-3033.00 |
Light Truck or Delivery Services Drivers |
| 8213 |
Bus and coach drivers |
53-3022.00 |
Bus Drivers, School or Special Client |
| 8214 |
Taxi and cab drivers and chauffeurs |
53-3041.00 |
Taxi Drivers and Chauffeurs |
| 8215 |
Driving instructors |
25-3021.00 |
Self-enrichment Education Teachers |
| 8221 |
Crane drivers |
53-7021.00 |
Crane and Tower Operators |
| 8222 |
Fork-lift truck drivers |
53-7051.00 |
Industrial Truck and Tractor Operators |
| 8223 |
Agricultural machinery drivers |
45-2091.00 |
Agricultural Equipment Operators |
| 8229 |
Mobile machine drivers and operatives n.e.c. |
47-2073.00 |
Operating Engineers and Other Construction Equipment Operators |
| 8231 |
Train and tram drivers |
53-4041.00 |
Subway and Streetcar Operators |
| 8232 |
Marine and waterways transport operatives |
53-5021.02 |
Mates - Ship, Boat and Barge |
| 8233 |
Air transport operatives |
53-2022.00 |
Airfield Operations Specialists |
| 8234 |
Rail transport operatives |
53-4021.00 |
Railroad Brake, Signal and Switch Operators |
| 8239 |
Other drivers and transport operatives n.e.c. |
53-1031.00 |
First-line Supervisors of Transportation and Material-moving Machine and Vehicle Operators |
| 9111 |
Farm workers |
45-2092.02 |
Farmworkers and Laborers, Crop |
| 9112 |
Forestry workers |
37-3013.00 |
Tree Trimmers and Pruners |
| 9119 |
Fishing and other elementary agriculture occupations n.e.c. |
37-3011.00 |
Landscaping and Groundskeeping Workers |
| 9120 |
Elementary construction occupations |
47-2061.00 |
Construction Laborers |
| 9132 |
Industrial cleaning process occupations |
47-4071.00 |
Septic Tank Servicers and Sewer Pipe Cleaners |
| 9134 |
Packers, bottlers, canners and fillers |
53-7064.00 |
Packers and Packagers, Hand |
| 9139 |
Elementary process plant occupations n.e.c. |
51-9198.00 |
Helpers-Production Workers |
| 9211 |
Postal workers, mail sorters, messengers and couriers |
43-5052.00 |
Postal Service Mail Carriers |
| 9219 |
Elementary administration occupations n.e.c. |
43-9051.00 |
Mail Clerks and Mail Machine Operators, except Postal Service |
| 9231 |
Window cleaners |
37-2011.00 |
Janitors and Cleaners, except Maids and Housekeeping Cleaners |
| 9232 |
Street cleaners |
47-4051.00 |
Highway Maintenance Workers |
| 9233 |
Cleaners and domestics |
37-2012.00 |
Maids and Housekeeping Cleaners |
| 9234 |
Launderers, dry cleaners and pressers |
51-6011.00 |
Laundry and Dry-Cleaning Workers |
| 9235 |
Refuse and salvage occupations |
53-7081.00 |
Refuse and Recyclable Material Collectors |
| 9236 |
Vehicle valeters and cleaners |
53-7061.00 |
Cleaners of Vehicles and Equipment |
| 9239 |
Elementary cleaning occupations n.e.c. |
37-2011.00 |
Janitors and Cleaners, except Maids and Housekeeping Cleaners |
| 9241 |
Security guards and related occupations |
33-9032.00 |
Security Guards |
| 9242 |
Parking and civil enforcement occupations |
53-6021.00 |
Parking Lot Attendants |
| 9244 |
School midday and crossing patrol occupations |
33-9091.00 |
Crossing Guards |
| 9249 |
Elementary security occupations n.e.c. |
33-3011.00 |
Bailiffs |
| 9251 |
Shelf fillers |
53-7062.00 |
Laborers and Freight, Stock and Material Movers, Hand |
| 9259 |
Elementary sales occupations n.e.c. |
43-5081.04 |
Order Fillers, Wholesale and Retail Sales |
| 9260 |
Elementary storage occupations |
53-7062.00 |
Laborers and Freight, Stock and Material Movers, Hand |
| 9271* |
Hospital porters |
31-9092.00 |
Medical Assistants |
| 9272 |
Kitchen and catering assistants |
35-3021.00 |
Combined Food Preparation and Serving Workers, Including Fast Food |
| 9273 |
Waiters and waitresses |
35-3031.00 |
Waiters and Waitresses |
| 9274 |
Bar staff |
35-3011.00 |
Bartenders |
| 9275 |
Leisure and theme park attendants |
39-3091.00 |
Amusement and Recreation Attendants |
| 9279 |
Other elementary services occupations n.e.c. |
39-3031.00 |
Ushers, Lobby Attendants and Ticket Takers |
REFERENCES
Abadi, M., Agarwal, A., Barham, P., Brevdo, E., Chen, Z., Citro, C., Corrado, G. S., Davis, A., Dean, J., Devin, M., Ghemawat, S., Goodfellow, I., Harp, A., Irving, G., Isard, M., Jia, Y., Jozefowicz, R., Kaiser, L., Kudlur, M., Levenberg, J., Mané, D., Monga, R., Moore, S., Murray, D., Olah, C., Schuster, M., Shlens, J., Steiner, B., Sutskever, I., Talwar, K., Tucker, P., Vanhoucke, V., Vasudevan, V., Viegas, F., Vinyals, O., Warden, P., Wattenberg, M., Wicke, M., Yu, Y., Zheng, X., 2015. TensorFlow: Largescale machine learning on heterogeneous systems. Software available from tensorflow.org
Abeliansky, A., Prettner, K., 2017. Automation and demographic change. Tech. Rep. 05-2017, Hohenheim Discussion Papers in Business, Economics and Social Sciences Discussion Paper.
Acemoglu, D., Aghion, P., Lelarge, C., Van Reenen, J., Zilibotti, F., 2007. Technology, information and the decentralization of the firm*. The Quarterly Journal of Economics 122 (4), 1759. URL http://dx.doi.org/10.1162/qjec.2007.122.4.1759
Acemoglu, D., Autor, D., 2011. Skills, tasks and technologies: Implications for employment and earnings. In: Handbook of Labor Economics. Vol. 4b.
Acemoglu, D., Restrepo, P., 2017a. Robots and jobs: Evidence from US labor markets.
Acemoglu, D., Restrepo, P., 2017b. Secular stagnation? the effect of aging on economic growth in the age of automation.
Adalet McGowan, M. andrews, D., 2015. Labour market mismatch and labour productivity: Evidence from PIAAC data. Tech. Rep. 1209, OECD Economics Department Working Papers.
Alpert, A., Auyer, J., October 2003. Evaluating the BLS 1988-2000 employment projections. BLS Monthly Labor Review.
Armstrong, S., Sotala, K., Ó hÉigeartaigh, S. S., Jul. 2014. The errors, insights and lessons of famous AI predictions - and what they mean for the future. Journal of Experimental & Theoretical Artificial Intelligence 26 (3), 317-342.
Arnold, R. D., Wade, J. P., 2015. A definition of systems thinking: a systems approach. Procedia Computer Science 44, 669-678.
Arntz, M., Gregory, T., Zierahn, U., 2016. The risk of automation for jobs in OECD countries: A comparative analysis. Tech. Rep. 189, OECD Social, Employment and Migration Working Papers.
Atkinson, R. D., Wu, J., 2017. False alarmism: technological disruption and the U.S. Labor market, 1850-2015. Tech. rep., Information Technology and Innovation Foundation.
Autor, D., Katz, L., Kearney, M., 2006. The polarization of the US labor market.
Autor, D., Katz, L., Kearney, M., 2008. Trends in US wage inequality: Reassessing the revisionists. Review of Economics and Statistics 90 (2), 300-323.
Autor, D. H., 2013. The "task approach" to labor markets: an overview. Tech. Rep. 7178, IZA discussion paper.
Autor, D. H., Dorn, D., 2013. The growth of low-skill service jobs and the polarization of the US labor market. American Economic Review 103 (5), 1553-97. URL http://www.aeaweb.org/articles?id=10.1257/aer.103.5.1553
Autor, D.., L. F., Murnane, R., 2003. The skill content of recent technological change: an empirical exploration. Quarterly Journal of Economics 116 (4), 1279-1333.
Baehrens, D., Schroeter, T., Harmeling, S., Kawanabe, M., Hansen, K., Muller, K.-R., 2010. How to Explain Individual Classification Decisions. Journal of Machine Learning Research 11, 1803-1831. URL https://is.tuebingen.mpg.de/fileadmin/user_upload/files/publications/baehrens10a_[0].pdf
Banerjee, A., Duflo, E., 2008. What is middle class about the middle classes around the world? Journal of Economic Perspectives 22 (2), 3-28.
Bank of America Merrill Lynch, 2017. Overdrive - global future mobility primer.
Barany, Z. L., Siegel, C., Mar. 2017. Job polarization and structural change. American Economic Journal: Macroeconomics. URL https://kar.kent.ac.uk/61271/
Baumol, W. J. and Bowen, W. G. 1966. Performing Arts: The Economic Dilemma. New York: The Twentieth Century Fund.
Baumol, W. J., de Ferranti, D., Malach, M., Pablos-Méndez, A., Tabish, H., Wu, L. G., 2012. The cost disease: why computers get cheaper and health care doesn't. Yale university press. URL http://www.jstor.org/stable/j.ctt32bhj9
Beblavý, M., Maselli, I., Veselkova, M., 2015. Green, Pink & Silver? The Future of Labour in Europe. SSRN Scholarly Paper ID 2577743, Social Science Research Network, Rochester, NY.
Becker, S., Hornung, E., Woessmann, L., 2009. Catch me if you can - education and catch-up in the industrial revolution. Tech. Rep. 2816, CESifo Working Paper Series.
Becker, S. O. and Muendler, M. 2015. Trade and tasks: an exploration over three decades in Germany, Economic Policy, 30(84), 589-641.
Ben-Ner, A., Jones, D. C., 1995. Employee participation, ownership and productivity: A theoretical framework. Industrial Relations: A Journal of Economy and Society 34 (4), 532-554.
Beramendi, P., Häusermann, S., Kitschelt, H., Kriesi, H., Apr. 2015. The Politics of Advanced Capitalism. Cambridge University Press.
Bix, A., 2000. Inventing ourselves out of jobs?: America's debate over technological unemployment. Johns Hopkins University Press.
Black, S., Spitz-Oener, A., 2010. Explaining women's success: Technological change and the skill content of women. Review of Economics and Statistics 92, 187-194.
Brandes, P., Wattenhofer, R., 2016. Opening the Frey/Osborne black box: Which tasks of a job are susceptible to computerization? arXiv:1604.08823 [cs.CY].
Broadbent, B., 2013. Forecast errors. Speech given at the Mile End Group of Queen Mary, University of London, Wednesday 1 May 2013.
Byrd, R. H., Lu, P., Nocedal, J., Zhu, C., 1995. A limited memory algorithm for bound constrained optimization. SIAM Journal on Scientific Computing 16 (5), 1190-1208.
Cappelli, P., 2015. Skill gaps, skill shortages and skill mismatches: Evidence and arguments for the United States. ILR Review 68 (2), 251-290.
Capra, F., Luisi, P. L., 2014. The systems view of life: a unifying vision. Cambridge University Press.
Caprettini, B., Voth, H.-J., 2017. Rage against the machines: labour- saving technology and unrest in england, 1830-32. SSRN Scholarly Paper ID 2904322, Social Science Research Network, Rochester, NY.
Carnevale, A., Smith, N., Strohl, J., 2010. Help wanted: Projections of jobs and education requirements through 2018. Tech. rep., Georgetown Center on Education and the Workforce.
CEDEFOP (European Centre for the Development of Vocational Training), 2008. Systems for anticipation of skills needs in the EU member states. Tech. Rep. 1, CEDEFOP Working Paper.
Chadha, J., 2017. Why forecast. Tech. Rep. 239, National Institute Economic Review.
Christodoulou, D., 2014. Seven myths about education. Routledge Press.
Chu, W., Ghahramani, Z., 2005. Gaussian processes for ordinal regression. Journal of Machine Learning Research 6 (Jul), 1019-1041.
Clark, B., Joubert, C., Maurel, A., 2014. The career prospects of overeducated Americans. Tech. Rep. 20167, National Bureau of Economic Research Working Paper.
Consoli, D., Marin, G., Marzucchi, A., Vona, F., 2016. Do green jobs differ from non-green jobs in terms of skills and human capital? Research Policy, 45 (5), 1046-60.
Covington, M. V., Müeller, K. J., 2001. Intrinsic Versus Extrinsic Motivation: An Approach/Avoidance Reformulation. Educational Psychology Review 13 (2), 157-176.
Canadian Scholarship Trust (CST), 2017. CST Careers 2030. URL http://careers2030.cst.org.
Davenport, T. H., Kirby, J., 2016. Only humans need apply: winners and losers in the age of smart machines. Harper Business.
David, P., 1990. The dynamo and the computer: An historical perspective on the modern productivity paradox. American Economic Review, 80 (2), 355-361.
David, P., Wright, G., 1999. General purpose technologies and surges in productivity: Historical reflections on the future of the ICT revolution. Tech. Rep. 31, Oxford University Discussion Papers in Economic and Social History.
Davis, S., Haltiwanger, J., 2014. Labor market fluidity and economic performance. Tech. Rep. 20479, NBER Working Paper.
Deming, D., 2015. The growing importance of social skills in the labor market. Tech. Rep. 21473, NBER Working Paper.
Dessein, W., Santos, T., 2006. Adaptive organizations. Journal of Political Economy 114 (5), 956-995.
Diamond, J. B., Randolph, A., Spillane, J. P., 2004. Teachers' expectations and sense of responsibility for student learning: the importance of race, class and organizational habitus. Anthropology & Education Quarterly 35 (1), 75-98.
Duffy, M., Armenia, A., Stacey, C. L., 2015. Caring on the clock: the complexities and contradictions of paid care work. Rutgers University Press.
Dustmann, C., Ludsteck, J., Schonberg, U., 2009. Revisiting the German wage structure. Quarterly Journal of Economics 124 (2), 809-842.
Ecken, P., Von Der Gracht, H., Gnatzy, T., 2011. Desirability bias in foresight: Consequences for decision quality based on Delphi results. Technological Forecasting and Social Change 78 (9), 1654-1670.
Erixon, F., Weigel, B., 2016. The innovation illusion: how so little is created by so many working so hard. Yale University Press.
Freeman, R. B., 2015. Who owns the robots rules the world. IZA World of Labor 5.
Frey, C., Berger, T., 2016. Industrial renewal in the 21st century: Evidence from US cities. Regional Studies, forthcoming.
Frey, C. B., Osborne, M. A., Oct. 2014. Agiletown: the relentless march of technology and London's response. Tech. rep., Deloitte. URL http://www.deloitte.com/view/en_GB/uk/market-insights/uk-futures/london-futures/index.htm
Frey, C. B., Osborne, M. A., 2017. The future of employment: how susceptible are jobs to computerisation? Technological Forecasting and Social Change 114, 254-280.
Galor, O., Moav, O., 2006. Das human-kapital: A theory of the demise of the class structure. Review of Economic Studies 73 (1), 85-117.
Gambin, L., Hogarth, T., Murphy, L., Spreadbury, K., Warhurst, C., Winterbotham, M., 2016. Research to understand the extent, nature and impact of skills mismatches in the economy. Tech. Rep. 265, BIS Research Paper.
Gathmann, C., Schonberg, U., 2010. How general is human capital? a taskbased approach. Journal of Labor Economics 28 (1), 1-49.
Ghahramani, Z., 2013. Bayesian non-parametrics and the probabilistic approach to modelling. Phil. Trans. R. Soc. A 371 (1984), 20110553.
Gigerenzer, G., 2010. Moral satisficing: Rethinking moral behavior as bounded rationality. Topics in Cognitive Science 2 (3), 528-554.
Goldin, C., Katz, L., 2009. The race between education and technology. Harvard University Press.
Goodwin, P., Wright, G., 2010. The limits of forecasting methods in anticipating rare events. Technological Forecasting and Social Change 77 (3), 355-368.
Goos, M., J., K., Vandeweyer, M., 2015. Employment growth in europe: The roles of innovation, local job multipliers and institutions. Tech. Rep. 10, Utrecht School of Economics Discussion Paper Series.
Goos, M., Manning, A., 2007. Lousy and lovely jobs: the rising polarization of work in Britain. Review of Economics and Statistics, 89 (1).
Graetz, G., Michaels, G., 2015. Robots at work. Tech. Rep. 10477, CEPR Discussion Paper.
Granovetter, M., 2017. Society and Economy: Framework and Principles. Harvard University Press.
Gregory, T., Salomons, A., Zierahn, U., 2016. Racing with or against the machine? Evidence from europe. Tech. Rep. 16-053.
Grinis, I., 2017. The STEM requirements of 'Non-STEM' jobs: evidence from UK online vacancy postings and implications for skills & knowledge shortages. Mimeo. URL https://papers.ssrn.com/sol3/papers.cfm?abstract_id=2864225
Guyon, I., Elisseeff, A., 2003. An introduction to variable and feature selection. Journal of Machine Learning Research 3 (Mar), 1157-1182.
Hajkowicz, S. A., Reeson, A., Rudd, L., Bratanova, A., Hodgers, L., Mason, C., Boughen, N., 2016. Tomorrow's digitally enabled workforce: Megatrends and scenarios for jobs and employment in Australia over the coming twenty years. Australian Policy Online.
Hampden-Thompson, G., Bennett, J., 2013. Science teaching and learning activities and students' engagement in science. International Journal of Science Education 35 (8), 1325-1343.
Handel, M., 2012. Trends in job skill demands in OECD countries. Tech. Rep. 143, OECD Social, Employment and Migration Working Papers.
Handel, M., 2016. Dynamics of occupational change: Implications for the occupational requirements survey. Mimeo.
Hausmann, R., Hidalgo, C. A., Bustos, S., Coscia, M., Simoes, A., Yildirim, M. A., 2014. The atlas of economic complexity: mapping paths to prosperity. MIT Press.
Heckman, J., 1995. Lessons from the bell curve. Journal of Political Economy 103 (5), 1091-1120.
Heckman, J., Kautz, T., 2012. Hard evidence on soft skills. Labour Economics 19 (4), 451-464.
Hirsch, E. D., 2016. Why knowledge matters: rescuing our children from failed educational theories. Harvard Education Press.
Hyatt, H., Spletzer, J., 2013. The recent decline in employment dynamics. IZA Journal of Labor Economics 2 (5).
Inanc, H., Felstead, A., Gallie, D., Green, F., 2013. Job control in Britain: First findings from the Skills and Employment Survey 2012.
Institute of Medicine, 2008. Retooling for an aging America: building the health care workforce. The National Academies Press, Washington, DC.
International Monetary Fund (IMF), 2017. World economic outlook, April 2017: Gaining momentum?
Jones, C. I., 2016. Life and growth. Journal of political Economy 124 (2), 539-578.
Kahneman, D., 2011. Thinking, fast and slow. Penguin Press.
Kambourov, G., Manovskii, I., 2009. Occupational specificity of human capital. International Economic Review 50 (1), 63-115.
Kasparov, G., 2017. Deep thinking: where machine intelligence ends and human creativity begins. John Murray.
Kautz, T., Heckman, J. J., Diris, R., ter Weel, B., Borghans, L., Dec. 2014. Fostering and measuring skills: improving cognitive and non-cognitive skills to promote lifetime success. Working Paper 20749, National Bureau of Economic Research.
Keynes, J. M., 1930. Economic possibilities for our grandchildren. Essays in Persuasion (1963), pp. 358-73. W.W. Norton.
King, M., Ruggles, S., Alexander, J. T., Flood, S., Genadek, K., Schroeder, M. B., Trampe, B., Vick, R., 2010. Integrated public use microdata series, current population survey: Version 3.0.[machine-readable database]. Minneapolis: University of Minnesota 20. URL http://doi.org/10.18128/D030.V4.0
Kruse, D., Freeman, R., Blasi, J., Buchele, R., Scharf, A., Rodgers, L., Mackin, C., 2004. Motivating employee-owners in ESOP firms: Human resource policies and company performance. In: Employee Participation, Firm Performance and Survival. Emerald Group Publishing Limited, pp. 101-127.
Lazear, E. P., Shaw, K. L., 2007. Personnel economics: The economist's view of human resources. The Journal of Economic Perspectives 21 (4), 91-114.
Levy, F., Murnane, R., 2004. The new division of labor: how computers are creating the next job market. Princeton University Press.
Lin, J., 2011. Technological adaptation, cities and new work. Review of Economics and Statistics 93 (2), 554-574.
Liu, Y., Grusky, D., 2013. The payoff to skill in the third industrial revolution. American Journal of Sociology 118 (5), 1330-74.
Robinson, C., 2011. Occupational mobility, occupation distance and basic skills: Evidence from job-based skill measures. Tech. Rep. 2011-5, CIBC Working Paper Series.
Rosen, S., 1983. Specialization and human capital. Journal of Labor Economics 1 (1), 43-49.
Rothwell, J., 2013. The hidden STEM economy. Metropolitan Policy Program at Brookings. URL http://kstp.com/kstpimages/repository/cs/files/TheHiddenSTEMEconomy610.pdf
Şahin, A., Song, J., Topa, G., Violante, G., 2014. Mismatch unemployment. American Economic Review, 104 (11), 3529-64.
Schleicher, A., 2015 December 17. How can we equip the future workforce for technological change?. World Economic Forum Agenda (blog).
Schneider, P., Armstrong, H., Bakhshi, H., 2017. The Future of US Work and Skills: trends impacting on employment in 2030. Tech. rep., Nesta/- Pearson.
Schunk, D. H., Zimmerman, B. J., 2007. Influencing children's self- efficacy and self-regulation of reading and writing through modeling. Reading & Writing Quarterly 23 (1), 7-25.
Shackle, G., 1972. Epistemics and economics: a critique of economic doctrines. Transaction Publishers.
Shah, J., Wiken, J., Williams, B., Breazeal, C., 2011. Improved humanrobot team performance using chaski, a human-inspired plan execution system. In: Proceedings of the 6th International Conference on Human-Robot Interaction. HRI '11. ACM, New York, NY, USA, pp. 29-36.
Shiller, R. J., 2017. Understanding Today's Stagnation. URL https://www.project-syndicate.org/commentary/secular-stagnation-future-of-work-fears-by-robert-j--shiller-2017-05.
Simonite, T., 2016. Prepare to be underwhelmed by 2021's autonomous cars. MIT Technology Review.
Spitz-Oener, A., 2006. Technical change, job tasks and rising educational demands: Looking outside the wage structure. Journal of Labor Economics 24 (2), 235-270.
Sutherland, J., 2012. Qualifications mismatch and skills mismatch. Education + Training 54 (7), 619-632.
Syverson, C., 2013. Will history repeat itself? comments on "Is the information technology revolution over?" International Productivity Monitor 25, 37-40.
Taylor, M., 2017. Good work: The Taylor review of modern working practice. Tech. rep., Department for Business, Energy and Industrial Strategy.
Tekinbas, K. S., Gresalfi, M., Peppler, K., Santo, R., Gee, J. P., 2014. Gaming the system: designing with gamestar mechanic. MIT Press.
Tett, G., 2017. An anthropologist in the boardroom. Financial Times
Tichy, G., 2004. Over-optimism among experts in assessment and foresight. Technological Forecasting and Social Change 71 (4), 341-363.
UK Commission for Employment and Skills, 2014. The future of work: Jobs and skills in 2030. Tech. Rep. Evidence Report 84.
UK Commission for Employment and Skills, 2017a. LMI for all. URL http://www.lmiforall.org.uk/about-lmi-for-all/
UK Commission for Employment and Skills, 2017b. LMI for all. URL http://api.lmiforall.org.uk
US Bureau of Labor Statistics, 2010. 2010 SOC user guide. URL https://www.bls.gov/soc/soc_2010_user_guide.pdf
US Bureau of Labor Statistics, 2015. May 2015 occupational employment statistics. URL https://www.bls.gov/oes/2015/may/oes_nat.htm
US Bureau of Labor Statistics, 2016. Replacement Needs. URL https://www.bls.gov/emp/ep_table_110.htm.
Van Rens, T., 2015. The skills gap: Is it a myth?. Global Perspectives Series: Paper 5, Social Market Foundation.
Waegeman, W., De Baets, B., Boullart, L., 2008. ROC analysis in ordinal regression learning. Pattern Recognition Letters 29 (1), 1-9.
Weaver, A., Osterman, P., 2017. Skill demands and mismatch in US manufacturing. ILR Review 70 (2), 275-307.
Weinstein, R. S., 2002. Reaching Higher. Harvard University Press.
Woolley, A., Chabris, C., Pentland, A., Hashmi, N., Malone, T., 2010. Evidence for a collective intelligence factor in the performance of human groups. Science 330 (6004), 686-688.
World Bank, 2013. World Development Report 2013: Jobs. World Bank Publishing.
World Economic Forum (WEF), 2016. The future of jobs: Employment, skills and workforce strategy for the fourth industrial revolution. World Economic Forum.
Wyatt, I., September 2010. Evaluating the 1996-2006 employment projections. BLS Monthly Labor Review.
Lucas, B., Claxton, G., Spencer, E., 2013. Progression in student creativity in school. OECD education working papers, Organisation for Economic Co-operation and Development, Paris.
MacCrory, F., Westerman, G., Alhammadi, Y., Brynjolfsson, E., 2014. Racing with and against the machine: Changes in occupational skill composition in an era of rapid technological advance. Thirty-fifth International Conference on Information Systems, Auckland.
MacKay, D. J., 2003. Information theory, inference and learning algorithms. Cambridge University Press.
ManpowerGroup, 2016. The talent shortage survey. URL http://manpowergroup.com/talent-shortage-2016
Matthews, A. G. d. G., van der Wilk, M., Nickson, T., Fujii, K., Boukouvalas, A., León Villagrá, P., Ghahramani, Z., Hensman, J., 2016. GPflow: A Gaussian process library using TensorFlow. arXiv preprint 1610.08733.
McKinsey Global Institute, 2017. A future that works: Automation, employment and productivity.
Mercier, H., Sperber, D., 2017. The enigma of reason. Harvard University Press.
Michaels, G., Natraj, A., Reenen, J. V., 2009. Has ICT polarized skill demand? Evidence from eleven countries over 25 years. Review of Economics and Statistics 96 (1), 60-77.
Miller, R., 2006. Futures studies, scenarios and the "possibility-space" approach. Schooling for Tomorrow, 93-105.
Mims, C., 2016 September 25. Self-driving hype doesn't reflect reality. The Wall Street Journal.
Mitchell, T., Brynjolfsson, E., 2017. Track how technology is transforming work. Nature 544, 290-292.
Mokyr, J., Vickers, C., Ziebarth, N., 2015. The history of technological anxiety and the future of economic growth: Is this time different? Journal of Economic Perspectives 29 (3), 31-50.
Montt, G., 2015. The causes and consequences of field-of-study mismatch: An analysis using PIAAC. Tech. Rep. 167, OECD Social, Employment and Migration Working Papers.
Moretti, E., 2012. The new geography of jobs. Houghton Mifflin Harcourt.
Mosca, I., Wright, R., 2013. Is graduate under-employment persistent? evidence from the United Kingdom. Tech. Rep. 6177, IZA Discussion Paper.
Murphy, K. P., 2012. Machine learning: a probabilistic perspective. MIT press.
National Research Council. 2012. Education for life and work: Developing transferable knowledge and skills in the 21st century. The National Academies Press. https://doi.org/10.17226/13398.
Nemet, G., Anadon, L., Verdolini, E., 2016. Quantifying the effects of expert selection and elicitation design on experts' confidence in their judgments about future energy technologies. Risk Analysis 7 (2), 315-330.
Nesta, 2017. Solved! Making the case for collaborative problem-solving.
Occupational Information Network (O*NET), 2017. O*NET online. URL https://www.onetonline.org
Ocejo, R. E., 2017. Masters of craft: old jobs in the new urban economy. Princeton University Press.
Organisation for Economic Co-operation and Development (OECD), 2012. Better Skills, Better Jobs, Better Lives: A Strategic Approach to Skills Policies.
OECD, 2016a. Fostering and assessing students' creativity and critical thinking in higher education. In: Workshop Summary Report.
OECD, 2016b. Getting skills right: assessing and anticipating changing skill needs.
OECD, 2016c. How good is your job? Measuring and assessing job quality. In: OECD Employment Outlook. pp. 79-139.
OECD, 2016d. OECD Employment Outlook 2016.
OECD, 2017. PISA 2015 Results (Volume 1): Excellence and Equity.
Office for National Statistics (ONS), 2017a. emp04: employment by occupation. URL https://www.ons.gov.uk/employmentandlabourmarket/peopleinwork/employmentandemployeetypes/datasets/employmentbyoccupationemp04
ONS, 2017b. Labour force survey 2017. URL https://discover.ukdataservice.ac.uk/series/?sn=2000026
Pearson, K., 1901. On lines and planes of closest fit to systems of points in space. Philosophical Magazine Series 6 2 (11), 559-572. URL http://dx.doi.org/10.1080/14786440109462720
Phelps, E. S., 2013. Mass Flourishing: How Grassroots Innovation Created Jobs, Challenge and Change. Princeton University Press.
Pierson, P., 2004. Politics in time: history, institutions and social analysis. Princeton University Press.
Poletaev, M., Robinson, C., 2008. Human capital specificity: Evidence from the dictionary of occupational titles and displaced worker surveys, 1984-2000. Journal of Labor Economics 26 (2), 387-420.
Poropat, A., 2009. Meta-analysis of the five-factor model of personality and academic performance. Psychological Bulletin 135 (3), 322-338.
PwC, 2016. The future of work - A journey to 2022.
PwC, 2017. Consumer spending prospects and the impact of automation on jobs. UK Economic Outlook, March.
Rasmussen, C., Williams, C., 2006. Gaussian processes for machine learning. MIT Press.
Reimers, F., Chung, C. (Eds.), 2016. Teaching and learning for the twenty- first century: educational goals, policies and curricula from six nations. Harvard Education Press.
TECHNICAL TERMS GLOSSARY
Application Programming Interface (API)
A system of tools and resources in an operating system, enabling developers to create software applications
Area Under The Curve (Auc)
The area between a graph curve and the 'x' axis, between two given 'x' values, regardless of whether the area is above or below the 'x' axis.
Baumol's cost disease hypothesis
Is the rise of salaries in jobs that have experienced no increase of labor productivity, in response to rising salaries in other jobs that have experienced the labor productivity growth [also known as the baumol effect]
Bayesian non-parametric model
A term used in statistics and the creation of machine learning algorithms. A key problem in statistical modeling is how to choose a model at an appropriate level of complexity. Bayesian nonparametric methods, are a class of statistical methods that enables the data to inform the complexity of the model.
Limited memory Broyden-Fletcher-Goldfarb-Shanno (BFGS)
An optimisation algorithm used in machine learning to solve mathematical challenges that are non linear). It is particularly well suited for optimisation problems with a large number of variables.
Covariance Matrix
In statistics, a covariance matrix is generated to investigate the similarities or differences of two variables across multiple dimensions.
Crosswalk
A term deployed to describe a mechanism or approach to translating, comparing or moving between meta data standards (http://marinemetadata.org/guides/mdatastandards/crosswalks) or converting skills or content from one discipline to another.
Crosswalked
A process for matching up the elements or variables of one list with the closest equivalent on another. In the case of this study, UK occupation categories were "crosswalked" to US occupation categories so that the US-based O*NET data set (containing occupation skills, knowledge areas and abilities), could be applied across both countries.
Delphi Method
A forecasting method based on the results of questionnaires sent to a panel of experts. Several rounds of questionnaires are sent out and the anonymous responses are aggregated and shared with the group after each round.
Dimensionality Reduction
In machine learning and statistics, dimensionality reduction or dimension reduction is the process of reducing the number of random variables under consideration, via obtaining a set of principal variables. It can be divided into feature selection and feature extraction.
Feature Selection
In machine learning and statistics, feature selection is the process of selecting a subset of relevant features (variables, predictors) for use in model construction
Gaussian Process
In probability theory and statistics, a Gaussian process is a particular kind of statistical model where observations occur in a continuous domain, e.g. time or space. In a Gaussian process, every point in some continuous input space is associated with a normally distributed random variable.
Green Economy
Defined as an economy that aims at reducing environmental risks and ecological scarcities and that aims for sustainable development without degrading the environment. It is closely related with ecological economics, but has a more politically applied focus.
Heteroskedastic
in statistics, heteroskedasticity is when the standard deviations of a variable, monitored over a specific amount of time, are nonconstant.
information-theoretic approach: a model for testing the data which simultaneously evaluates hypotheses by balancing between model complexity and goodness of fit.
Describes all kinds of information used to make labour market decisions. LMI can be a compilation of detailed statistical data on jobs and salaries, employers and employees, sectors, current employment conditions and future trends.
Machine-Learning
Is an application of artificial intelligence (Al) that provides systems the ability to automatically learn and improve from experience without being explicitly programmed. Machine learning focuses on the development of computer programs that can access data and use it learn for themselves.
Matérn Covariance
In statistics, the Matérn covariance (named after the Swedish forestry statistician Bertil Matérn) is a covariance function used in spatial statistics, geostatistics, machine learning, image analysis and other applications of multivariate statistical analysis on metric spaces.
Multinomial Distribution
A distribution that shows the likelihood of the possible results of an experiment with repeated trials in which each trial can result in a specified number of outcomes that is greater than two.
Noisy
statistical noise is a term that refers to the unexplained variation or randomness that is found within a given data sample.
extrapolation is the action of estimating or concluding something by assuming that existing trends will continue. When using a non-parametric method to do this, the boundaries of what is possible come from the data (or the training set), rather than the statistical model.
Occam's Razor
A scientific and philosophical rule that entities should not be multiplied unnecessarily which is interpreted as requiring that the simplest of competing theories be preferred to the more complex or that explanations of unknown phenomena be sought first in terms of known quantities.
Ordinal Regression Model
a type of regression analysis used for predicting an ordinal variable, i.e. a variable whose value exists on an arbitrary scale where only the relative ordering between different values is significant.
Over-Fitting
A modeling error which occurs when a function is too closely "fit" to a specific set of data points, limiting its generalisability.
Python Library
A Python library is a collection of functions and methods that allows you to perform lots of actions without writing your own code.
Principal Component Analysis (Pca)
Principal component analysis is an approach to factor analysis that considers the total variance in the data, which is unlike common factor analysis and transforms the original variables into a smaller set of linear combinations.
Time-Series
A time series is a sequence of numerical data points in successive order.
Uncertainty Sampling
An Active Learning approach in which the Machine Learning Algorithm selects the Documents as to which it is least certain about Relevance, for Coding by the Subject Matter Expert(s) and addition to the Training Set.
ENDNOTES
1Emblematic of this interest was the publication of the BLS Occupational Outlook Handbook and the OECD's Mediterranean Regional Project which popularised the use of manpower planning in developed and developing countries.
2Ireland, for example, uses foresight in its various sector studies, while Germany's BIB-BIAB Qualification and Occupational Fields programme produces qualitative scenarios to contrast their baseline quantitative projections.
3Making predictions about technological progress is also notoriously difficult (Armstrong et al., 2014).
4The direction of employment change - in both absolute and relative terms - was projected accurately for 70% of detailed occupations included in Handel's evaluation.
5An interesting study on the short-run dislocations of labour-saving technology is Caprettini and Voth (2017). It examines the diffusion of threshing machines through the English countryside during the 1830s and its impact on social unrest, the so-called 'Captain Swing' riots. To measure diffusion, the study uses farm advertisements in local newspapers, which provide detail on the location and use intensity of new threshing machines. The take-up of new technology was not exogenous, making causal assignment difficult. For example, landlords, alarmed by the outbreak of violence, might have introduced fewer machines, which would bias estimates downwards. To identify causality, the authors use soil suitability for wheat as an instrument for the adoption of threshing technology. The reason for this is that wheat was the only grain that could be threshed profitably by early threshing technology. This instrument is valid insofar as it does not affect rural workers' propensity to riot other than through its effect on the adoption of technology. Thus, among other things, wheat-growing areas were not poorer than other areas. The authors find that areas more suited to wheat cultivation exhibit both greater adoption of threshing machines and significantly higher incidence of riots.
6By mimic, we refer to the ability of a machine to replicate or surpass the results of a human rather than achieve those results in the same way.
7This poses a puzzle - if Arntz et al. (2016) proceed from a similar assessment of occupation level automatability as Frey and Osborne (2017), why do they arrive at such sharply different results? While the task-based approach may explain some of the difference, it is arguably overstated by aspects of their research design. This can be understood on three levels. First, the PIAAC data is available only at a two-digit International Standard Classification of Occupations (ISCO) level, in contrast to data on detailed occupations used by Frey and Osborne. Studying occupations in aggregate is likely to push employment towards the medium risk category insofar as it washes out variation between occupations' automatability at a more granular level. Second, differences may arise from the classification method used by Arntz et al (2016). Their modified logistic regression implies a linear relationship between features and whether a job is automatable. This is a simpler and less flexible model than Frey and Osborne's and again is likely to default towards predictive probabilities in the middle. Third, the authors include a number of variables such as gender, education, income, sector and firm size as predictors of automatability, even though these are not obviously supported or interpreted in terms of economic theory. In addition PwC (2017) finds that some of these results are an artefact of which variables from the PIAAC database are used. Its own estimates, using a different set of occupational features, are still lower than those of Frey and Osborne, but still much closer to them than to the estimates of Arntz et al.
8See also Rosen (1983) on the indivisibility of occupations.
9In the 19th century, 98% of the labour required to weave cloth was automated but employment in the weaving industry still increased due to increased demand for cheaper clothes.
10Exceptions include the public sector and non-automated manufacturing industries such as recycling, basic metals,
11The occupations labelled come from the US Bureau of Labor Statistics (BLS) 2010 SOC and the UK Office for National Statistics (ONS) SOC 2010.
12The selection of the first 10 occupations presented to the experts was random: specifically, 10 occupations were randomly selected, but individual occupations were replaced with another randomly selected occupation when historical time-series were not available at least back to 1983 for the US and 2001 for the UK. This constraint meant that, in the US, we drew the occupations from 125 of the total 840 six-digit SOC codes and from 163 of the total 369 four-digit SOC codes in the UK. textiles, paper, furniture and transportation equipment.
13As explained in 4.2, we adopt six-digit US SOC codes for US data. When we use US O*NET data for similar UK occupations, we present UK occupations at the four-digit UK SOC code level. The US and UK systems are the same level of detail, in that they refer to detailed occupations.
14According to O*NET, skills represent developed capacities which facilitate learning or the more rapid acquisition of knowledge; abilities are enduring attributes of the individual which influence performance and knowledge refers to organised sets of principles and facts applying in general domains.
15No dataset equivalent to O*NET exists for UK occupations. Instead, we perform a bespoke crosswalk from UK occupations to the closest match US occupation, as determined by using the 'LMI for All' database (UK Commission for Employment and Skills, 2017a) with some custom changes that we explain.
16Consider engineers and metal workers and plastic workers - two occupation groups which the BLS predicts will decline in share between 2014 and 2024. Over this period, metal workers and plastic workers are anticipated to lose 99,000 jobs, whereas engineers are expected to add 65,000 jobs.
17Observations consisted only of the ternary-valued labels and participant uncertainty was not incorporated. Reflecting the dataset used in Frey and Osborne (2017) only nine features were used, namely: Originality Systems Evaluation, Hearing Sensitivity, Arm-Hand Steadiness, Learning Strategies, Oral Comprehension, Social Perceptiveness, Manual Dexterity, Problem Sensitivity.
18Note that the Pearson correlation coefficient is often used for feature selection (as a filter), an exception to the inappropriate information-theoretic methods of feature selection we generically describe above.
19To be precise, this entails only redefining the expectations above as employment-weighted sums over that subset of occupations, rather than over all occupations.
20Our definition of complementarity is loosely related to that used by economists: two features are complementary if the marginal value product of one is increasing in the level of the second. This definition fails to meet our needs. The first problem is that the definition makes no accommodation for location in feature space. The economics definition is a statement about the second-order derivative of the function with respect to the two features being positive; for an arbitrary function, as may be learned by our flexible non-parametric model, the second-order derivatives may be in very different regions of space. The second related problem with the definition is that it may lead to highlighting feature combinations which, even if the second-order derivatives are positive and constant across space, are actively harmful. As a simple example, for a bivariate quadratic function with positive-definite Hessian (a convex bowl), an occupation on the wrong side of the critical point (the minimiser, or the location of the bottom of the bowl) would see its demand decreased with increases in either or both of the features. Our means of assessing complementarity, however, will more correctly identify the differing importances of features combinations at any point in feature space.
21This is clearest in the case of 'Public services and other associate professionals' and 'Welfare professionals'. However all other three-digit public sector occupations i.e. 'Senior officers in protective services', 'Protective services', 'Quality and regulatory professionals', 'Health associate professionals' and 'Welfare and housing associate professionals' have an average probability of increased workforce share > 0.5.
22Green occupations are defined here as 'Waste disposal and environmental services', 'Conservation professionals', 'Environment professionals', 'Environmental health professionals' and 'Conservation and environmental associate professionals' (four-digit level).
23Specifically, Bright Outlook occupations are ones that: are projected to grow much faster than average (employment increase of 14% or more) over the period 2014-2024; have 100,000 or more job openings over the period 2014-2024; or are new and emerging occupations in a high-growth industry.


