Omnislash
 www.nesta.org.uk/blog/omnislash/
www.nesta.org.uk/blog/omnislash/
www.nesta.org.uk/blog/omnislash/
In the innovation mapping team we often analyse large bodies of text to identify new technologies and industries. To do this effectively we need often need groups of related terms, or “synonyms” (in a loose sense of the word). Ideally we would automate this process, but that’s not always easy...

So here's the problem: there aren’t many algorithms on the market that give sensible results on very large, very high-dimensional data in a reasonable amount of time without my laptop running out of memory. I decided to go back to the drawing board, and developed a new clustering algorithm Omnislash which, although a little rough around the edges in some respects, is able to quickly slice up very large, very high-dimensional datasets. In the context of automatically generating synonyms, it also gives very sensible results.
omnislash
When data scientists want to split up a dataset into natural chunks, they employ clustering methods. A common example would be the identification of similar people or organisations (“rows”) based on the similarity of numerous fields (“columns”). In my example, I want to split up a list of words (see here for a very high-level description of how words become data) into groups of similar words (i.e. synonyms). Various algorithms take different approaches for doing this, and the most popular of these tend to be found in the sklearn library.
For moderately-sized datasets, a data scientist is free to choose from any of these clustering algorithms, and amongst other things, tend to optimise two quantities:
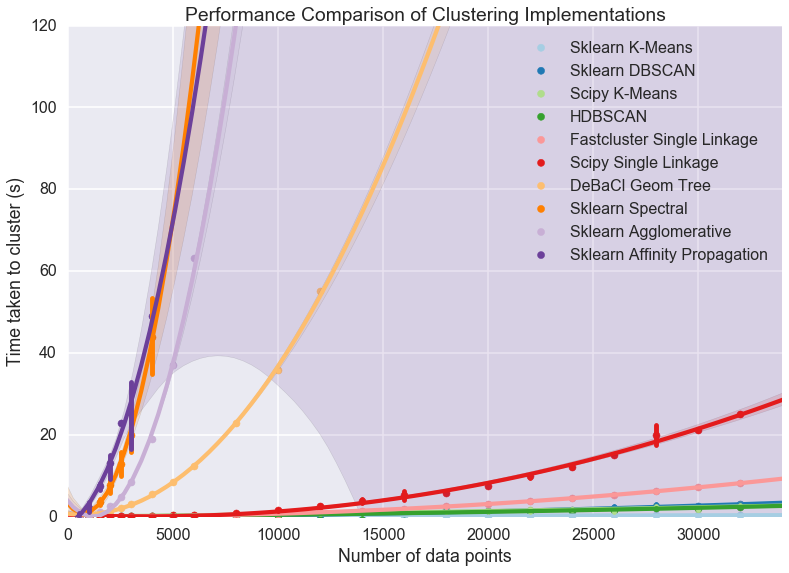
The second point really isn’t very flippant: some algorithms are known to “scale” very badly: i.e. if a dataset gets only a little bigger, the algorithm gets a lot slower. Why? Well, I’m sure that you can imagine that many algorithms could work by comparing every point (“row”) in the dataset with every other point. So if you have ten points in your dataset, the algorithm makes one hundred comparisons. If you have twenty points in your dataset, the algorithm must make four hundred comparisons. Doubling the size of the dataset increases the run-time of the algorithm by four times. Clearly, for very large datasets the average data scientist (working on a laptop) will have to find another algorithm. As shown in work by others it’s quite clear which algorithms scale well with dataset size, by taking approaches which don’t require every point to be compared to every other point.
So, if we want to cluster very large datasets we simply have to forget about half of the algorithms which would traditionally be at our disposal. As you might gather about where this blog is going, clustering of data also tends to scale with the dimensionality (“number of columns”) of the data. In a nutshell, for every additional dimension you have in your dataset, most clustering procedures will perform an additional distance measurement between every point the dataset.Perhaps we could just throw some heavy duty computing power at the problem. However, it would be wise to step back and consider another two problems with high-dimensional data: redundancy and sparsity. Various fields (“rows”) in the data are likely to be correlated (“related”), which means we could be wasting valuable computing time on a high-dimensional problem that could be described with fewer dimensions. Secondly, consider that with high-dimensional data any measurement of distance between two points starts to lose meaning - since most of the space is likely to be empty.Now combine the latter two thoughts: redundancy and sparsity; i.e. some correlations only exist in some part of the space. Omnislash works exactly with this in mind, by splitting the dataset recursively over increasingly small chunks of the data, whilst reducing the clustering procedure to a very low-dimensional problem.
Word of warning: this small subsection contains technical details.
Omnislash works by iterating through principal components (which reduces the dimensionality of the dataset using the fastPCA algorithm) and finding the optimal splitting location based on a simple heuristic. The data is then partitioned, and the procedure is followed iteratively until either:
Note from the latter condition, that the minimum cluster size is the main hyperparameter for Omnislash. The heuristic for determining the splitting location at each stage is given by:
omnislash
where the numerator is the sum of the variances on either side of the splitting location c, and the denominator is the variance in the region between the mean values of the data on either side of the splitting location. Minimising S favours a splitting location in a region with low amounts of data, whilst leaving well-defined regions intact. Some examples on toy data are given below:

The Omnislash heuristic in action. The top row shows the principal component profile of a dataset. The yellow lines indicate the 90th percentiles of each distribution, the red line indicates each distribution's mean and the black line indicates the segmentation cut. The bottom row shows the distribution of the heuristic. Note: the data for this is totally fake.
Interestingly (as demonstrated in the rightmost plot), the heuristic naturally favours no cut at all is there is no very-good splitting location. The heuristic can also be tightened by narrowing the “between” region, which I implement by default for the very first cut by Omnislash since (as the song goes) the first cut is the deepest.
Finally, the other problem I’ve been faced with is memory. Very large, very high-dimensional datasets, such as word vectors (my list of words which I would like to split into synonym groups), can contain up to ten million words, each represented in a 300-dimensional space. Such a dataset occupies around 3-4 GB of memory on your computer. Given that most laptops use around 1-4 GB of memory by running normally, and most algorithms tend effectively make one or two temporary copies of the input data, you could reasonably be faced with requiring 10 - 16 GB of memory on your laptop - which tends to be the absolute maximum that people have on their laptops these days. If you hit that maximum, any good operating system will pull the plug on your algorithm… and that was happening to me quite a lot by using the standard suite of clustering tools. This is why I’ve made Omnislash as memory efficient as possible: at any one time, an absolute maximum of one copy of the input exist (and generally the maximum is only 50% of the data is copied at any one time). The fraction of the copied data that is in memory at any one time also drops off over the run-time of the algorithm.
Below (in the rightmost column) I show the performance of Omnislash on a small compact dataset in order to compare with the standard sweet of sklearn tools (note that each colour corresponds to a unique cluster identified by the algorithm). One observation is that it appears to perform very similarly to the Mean Shift algorithm - and I believe (although I haven’t shown this yet), that Omnislash is indeed related to Mean Shift in that they roughly perform the same method in reverse. However, Mean Shift is amongst the type of algorithms that I described earlier that scales badly. Anyway, I hope you can see that Omnislash actually performs pretty well compared to the standard sklearn suite.

Omnislash clustering benchmarked (qualitatively) against sklearn's clustering algorithms. Different colours correspond to unique clusters discovered by each algorithm. Each dataset is a toy dataset designed for demonstrating limitations and strengths of clustering algorithms.
Next, I have chosen to benchmark the scalability of Omnislash against three algorithms: HDBSCAN, DBSCAN and K-means which are amongst the few algorithms that are scalable with respect to the size of the dataset. Note, that I am only considering large high-dimensionality datasets for this comparison - since this is the regime for which Omnislash was designed. As shown below, Omnislash outcompetes its rivals (in computing time) by an order of magnitude in running time, for a dataset with 100 dimensions.

Omnislash clustering benchmarked against other scalable clustering algorithms, by varying the size of the dataset. The test dataset consists of 100 "blobs" of data in a 100-dimensional space.
Furthermore, as shown below for a dataset with one million data points, Omnislash outcompetes its rivals (in computing time) by a factor of five to ten.

Omnislash clustering benchmarked against other scalable clustering algorithms, by varying the dimensionality of the data. The test dataset consists of 100 "blobs" of data, in a dataset containing one million points.
The outcome is that Omnislash is able to generate groups of synonyms from my list of words in around 20 minutes, rather than 5 hours. A few examples of “synonym” groups (i.e. words which appear in the same context) based on the Google news word vector are shown below. The data are generated from text extracted from Google’s news article dataset. The first synonym group shows words which are associated with climate and ecology. The second synonym group is a list of reporter names. The third group shows words associated with violent events.
Impacts, shortages, worrying, poses, predicting, encountered, predicts, spike, concludes, telephone_interview, measuring, comparing, contamination, forecasting, catastrophic, analyzing, alarming, measurements, researching, responds, susceptible, examines, unstable, feasible, outbreaks, geography, earthquakes, pinpoint, alarmed, culprit, meteorologist, air_pollution, collisions, Geological_Survey, panicked, worrisome, underestimated, detecting, underestimate, estimating, unreliable, currents, iceberg, plausible
By_LINDA_DEUTSCH, By_TOM_HAYS, MATT_APUZZO, By_DEVLIN_BARRETT, By_JILL_LAWLESS, By_PETE_YOST, By_GILLIAN_FLACCUS, HEBERT, By_IBRAHIM_BARZAK, By_GREG_BLUESTEIN, SCHMID, DAVID_B._CARUSO, By_JOHN_HEILPRIN, LOZANO, By_DAVID_STRINGER, QASSIM_ABDUL_ZAHRA, By_JOAN_LOWY, By_ROBERT_H., By_COLLEEN_LONG, By_HAMZA_HENDAWI, By_MIKE_BAKER, By_MATT_MOORE, By_VERENA_DOBNIK, SATTER, By_ALAN_FRAM, By_NICOLE_WINFIELD, By_MIKE_SCHNEIDER, By_NASSER_KARIMI, By_BRIAN_SKOLOFF, By_MATTHEW_DALY, By_DON_THOMPSON, By_LARRY_MARGASAK, By_JASON_STRAZIUSO, By_LISA_LEFF
Found_Dead, Plane_Crash, Police_Investigate, Soldier_Killed, Soldiers_Killed, Suspect_Arrested, Woman_Dies, Apartment_Fire, Bus_Crash, Shot_Dead, Woman_Arrested, Fatal_Shooting, Face_Charges, Bomb_Threat, Rescued_From, Recovering_From, Suicide_Bomber_Kills, Undergo, Helicopter_Crash, Chase_Ends, Arrests_Made, Bomb_Kills, Upheld, Teen_Arrested, Car_Bomb_Kills, Gunmen_Kill, Bridge_Collapse, Murder_Charges, Relief_Efforts, Troops_Killed
So I’ve demonstrated what Omnislash is capable of doing, but there are more avenues to explore. Inspired by the work of others, particularly by Spotify’s Annoy algorithm, I would like to implement a forest-like implementation, which takes random projections in order for the clustering procedure to be a little less rough. For example, if you take another look at the GIF at the top of the blog you’ll see some obviously misclustered points which (I speculate) would easily be tidied up with this type of implementation.
The direct applications of this are quite varied. As well as generating groups of synonyms (which can have applications in different types of analysis as well as aiding the search engines we are developing), we’ll also be able to detect large numbers of similar documents. Both of these applications will have a direct impact on our work with the Robert Woods Johnson Foundation and on EURITO. If you have any applications which you think would be suitable to your work, then please go ahead and let me know how you get on!


