The clubbing map: What has happened to London nightlife?
 www.nesta.org.uk/blog/the-clubbing-map-what-has-happened-to-london-nightlife/
www.nesta.org.uk/blog/the-clubbing-map-what-has-happened-to-london-nightlife/
www.nesta.org.uk/blog/the-clubbing-map-what-has-happened-to-london-nightlife/

London club closures are leading to widespread concern, due to the decline of London culture that they imply, but also the growing awareness of the economic impact on the wider night-time economy and creative sectors (1,2). In recent years there has also been greater international focus on cities’ cultural offer and how it affects their global reputation and creative ecosystems (3).
The importance of the issue has been recognised in the Mayor of London’s decision to appoint a Night Tsar with responsibility for the night-time economy and the debate surrounding the 2016 closure, and subsequent reopening, of Fabric one of London’s most famous clubs. London’s night-time economy is estimated to contribute £17-£26.bn in Gross Value Added (GVA) to the UK economy, and to directly support 723,000 jobs (4). The night time economy is also part of the city’s cultural ecosystem with venues providing spaces for performers and work for artists and designers (5). It is also often colocated with other creative and cultural facilities such as art galleries.
To inform debate in this area, we are publishing an interactive map of London nightlife and its closures with an accompanying analysis. The data used is listings information from the leading online electronic music magazine, community and listings site Resident Advisor (RA) (6). We find that although there are a lot of clubbing venues in central London, closures have meant that there has been a tendency for the centre of the city’s clubbing to be moving east and north in the city, with some areas such as the West End having experienced particularly high closure levels, relative to others like Dalston where the closure rates in the data are lower.
It is arguable that one would expect clubs to have a high closure rate as venues come and go out of fashion and people move on. Many of the most famous clubs, held to define a given period, for example Studio 54 in the 70s, the Hacienda in the 80s and 90s, no longer exist. The question is therefore not whether clubs are closing, which will always happen, but whether the pattern of closures is systematically changing London’s nightlife.
We investigate:
Clubbing is concentrated in particular parts of London. In the city overall there are 630 electoral wards, of these 246 wards are listed in the data as having had an event at some point on RA (7).
The wards with the highest number of open venues in Resident Advisor are Hoxton East and Shoreditch (56 venues), and the West End (23 venues). These two wards account for 16 per cent of all open venues in London, and the 10 wards with the most open venus account for 37 per cent of the total. Soho, within the West End, does not have official status as a London ward, but a high proportion of the West End venues in the analysis are located there, rather than in neighbouring Mayfair.
Open venues we define here, and elsewhere, as venues that are listed as open on Resident Advisor and which have had an event on the site in 2016 (The last year we have data for). Venues that are listed open, but which have not had an event for a long time may no longer be active in this area, perhaps they used the platform as a one-off, or alternatively have closed and Resident Advisor is not aware of it, neither suggests that they are very active in this space. We exclude these venues from the analysis as we are trying to examine venues where there is a greater focus on music and clubbing (8).
The picture below shows the distribution of these venues around London.

Figure 1: Distribution of open clubs in London
Clubbing is also highly concentrated within local areas, as for example happens on Kingsland Road (shown below), which runs north/south in the borough of Hackney and has a large number of venues. The orange venues are open, the purple are those that have closed.

How to see the location of clubbing and closures on the map:
The map shows the boundary of London and the clubs that we have obtained from Resident Advisor, both venues that are listed as closed and venues that are currently open. Clicking on a venue returns a pop-up with its name. The open venues are represented by a orange dot and the closed venues are represented by a purple dot. We estimate the year of closure by the venue being listed as closed on Resident Advisor and the year of the last event on the site. If you move the slider marked year of closure then the venues that have closed in that year change from open to closed status.
It has to be acknowledged that there are some things that the map does not show:
Updating venue information
Given the fast changing nature of London nightlife the map also contains the capability to update the venue information contained on the map. If you spot an issue with how we have classified a venue click on its location and a form appears which allows you to send us information on the venue name, location or closure status.
City centres are typically the one place in a large city that residents can easily access. If the cultural life of cities is pushed to the outskirts then this may result in poorer access to culture. As city centres are also where visitors typically spend the most time, cultural displacement can also affect a city’s wider reputation. This is a key reason why we care whether London nightlife is being displaced from the centre of the city.
The picture below shows how far open clubs in London are distributed from the geographic centre of London using clubs that are registered as open on the site and have held an event since 2015 in comparison to clubs that are listed as closed (10).
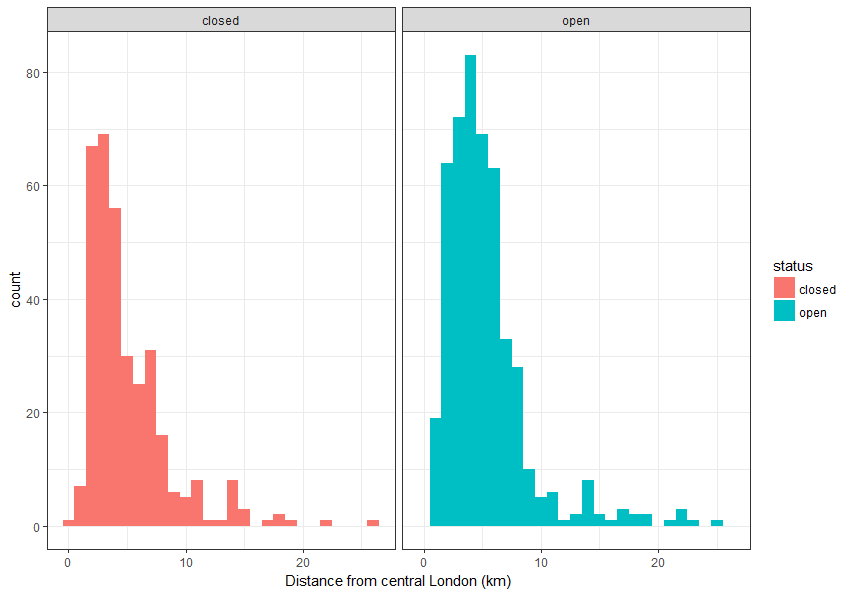
Figure 2: Distribution of open and closed clubs’ distance from central London
If we plot this data as a probability distribution i.e. a curve that shows the probability of clubs falling within given distances of the centre, and smooth it, we obtain the distribution below. This shows how levels of club activity and club closures are distributed relative to distance from the centre.

Figure 3: Probability distribution of open and closed clubs’ distance from central London
Although both distributions are similar, there appears to be a slight tendency for clubs that are closed to be nearer to the geographic centre of London. The average distance of open clubs from the centre is 5.3km versus closed clubs is 5km. Half of open clubs are within 4.6km of the centre. There is a statistical test we can perform as to whether two distributions of open and closed clubs are statistically equivalent i.e. does the distribution of closed clubs look like that of open clubs if you allow for the fact that there is statistical uncertainty as we do not have all open and closed clubs. When we test for this we find that there is evidence that closed clubs are systematically closer to the centre of London than open clubs (11). However, objectively the effect is not that large.
This kind of analysis is though based on the geographical midpoint of London, which may not correspond to people’s intuitive idea of where the centre is. Another way to look at how clubbing is moving is to compare the geographical midpoint of clubs that have closed with the geographical midpoint of clubs that are open, and how the geographical centre of clubbing is changing.
As London has two large clubbing centres, the West End and Shoreditch, the geographic midpoints of the clubs are not in areas where there are a lot of them, but somewhere in between.
When we compare the geographic midpoint for open clubs (which is somewhere just south of the current Museum of London) with the midpoint of closed clubs being just to the west of Kings College, we see that clubbing is moving north and east within the city, but not that far at the moment. The distance between the two points is just over a km. The move eastwards seems likely to relate to the cheaper property prices in that part of the city relative to the West End, the growth in the creative community in East London and the extension of the East London line in 2010-2011.

Figure 4: Change in the location of the geographical midpoint
Although there is evidence that clubs which are currently open are systematically further away from the centre of London than clubs that have closed the effect does not appear to be that large. It is though true that some areas of London have experienced higher levels of closures than others.
Wards which have had a significant number of venues open (>15), and which have experienced substantial number of closures relative to the number that are listed as ever having been open on the RA site include Holborn and Covent Garden (Borough of Camden) where 60 per cent of venues listed in the ward have been closed and 61 per cent in the West End (Borough of Westminster) and in the City of London 58 per cent.
By comparison, other areas which have had more than 15 venues open such as Camden Town with Primrose Hill (Borough of Camden) and Dalston (Borough of Islington) have had much smaller levels of closure relative to the total (21 per cent and 11 per cent respectively).
High rates of closure do not necessarily mean that an area’s nightlife is dying, it could just be very competitive with a high level of turnover and/or large numbers of temporary nights, however, it is certainly consistent with it.
How to see this on the map:
If you select the tab marked ‘closed %’ then this gives the ratio of closed venues to venues that have ever been open on the map for London wards that have had more than 10 venues operating in them colour coded according to the ratio of closed to clubs that have ever been open since 2005. The shading shows those which have the highest level of closures relative to venue numbers.
It has been argued that one of the factors behind club closures is rising property prices as it has meant their locations have become more economically valuable for other uses, in particular housing (12).
Figure 5 shows the rate of growth in London property prices 2005-2015 (at ward level) plotted against the ward’s distance from the centre using data from the Land Registry. There is variation across wards, but overall there is clear tendency for more central wards to have experienced higher property price growth (13). This is to be expected as central locations are seen as more desirable, and central London, being smaller than outer London, has fewer properties available. In the context of an overall increase of demand for property in London one would therefore expect property price growth to be higher in central areas.

Figure 5: % change in median house prices by London ward 2015-2005 vs distance to centre
This shows that, all other things being equal, business activities that are closer to the centre, unless their revenues are increasing at a comparable rate, are likely to be subject to pressure in terms of a) increasing rents or b) the sites that they are on being more valuable in terms of housing. As clubs are predominantly in central London wards one would therefore expect them to be particularly affected by property price increases.
As most London wards have no, or very few, clubs in them we examined areas which had at least 10 clubs to see whether the areas that experienced higher closure rates also had experienced higher levels of property price growth between 2015 and 2005. When we did this we found that there was no clear correlation between the two. That the connection is not that direct when looking at individual ward levels is perhaps to be expected as the wards are mostly fairly central so have almost all experienced high growth rates in property prices. The property price sales data contains a wide variety of sales within it. There are also other factors which affect venue closures such as issues related to alcohol licensing and the link between house price increases and rental rates is not perfect.
How to see the property price growth on the map
If you press the layer labelled Property growth, then the map is overlaid with the growth of property prices in London wards between 2005 and 2015. Clicking on the ward shows the median 2015 price for property sold on the ward. If you add in the clubs layer then you can overlay the locations of clubs on the map.
Is clubbing systematically moving out of central London? There is evidence of this. There are still a lot of clubbing venues in central London, although it is true that many venues have closed over the years. The average distance from the centre of London's clubs has increased, albeit not drastically. There is though a tendency for clubbing to be moving east and to a lesser extent north within the city, and for certain areas to have had much higher levels of closure.
Is clubbing leaving parts of London? There is evidence of this. One can see from the map places where there have been high levels of closure relative to the number of venues that have ever been open, such as the West End and Holborn.
Are closures related to property price increases? There has been a trend of more central areas of London becoming more expensive relative to the rest of the city, and currently much of London nightlife is centrally located. If the trend of the city centre becoming relatively more expensive continues than this could affect the long-term sustainability of London night life as the financial incentive to convert clubbing venues to other uses grows. When we examine wards with higher levels of clubbing activity there is no clear relationship between the rate of growth in property prices and closure levels. The absence of a clear link is not necessarily surprising as property price transactions contain a wide variety of property sales, the link between rental rates and property price growth is not straightforward and venue closures can be related to other factors such as licensing.
1) Night Time Industries Association (2015), ‘Forward into the Night’, London First (2016), ‘The economic value of London’s 24 hour economy’, Wickham, M. and Cominetti, N. ‘Closing time: London's public houses’, GLA economics 2017 and Haslem, D. (2015), 'Life after dark: A History of British Nightclubs and Music Venues' .
2) GLA (2015), ‘London’s grassroots venues a rescue plan’ GLA (2017). ‘London’s grassroots music venues a rescue plan - making progress. A report by Nordicity.Campkin, B. and Marshall, L. (2017), ‘LGBTQ+ Cultural Infrastructure in London: Night Venues, 2006–present’, GLA.
3) Currid, E. (2007), ‘The Warhol Economy: How Fashion, Art and Music Drive New York City’, Princeton University Press.
4) London First (2016), ‘The economic value of London’s 24 hour economy’.
5) Creative Industries Federation (2017),‘Because the Night Why what happens after dark matters to the creative industries.
6) The Resident Advisor data is based on venues that have been listed on the platform since 2005.
7) Due to their small size, for the purpose of the analysis we are treating the wards in the Borough City of London as a single ward.
8) There are 528 of these venues. Investigation of a sample of 191 of the venues revealed 60 per cent to be open, and that they are mostly bars.
9) Guardian (2017), ‘Plastic People remembered by its stars’.
10) The geographic centre of London calculated based on the centroid of the London border shapefile is -0.109226, 51.50049. This is a location to the south of Waterloo station, approximately 1 km from Charing Cross which is often listed as the traditional centre of London.
11) We therefore test whether the distribution of club closures in terms of distance from the centre is statistically equivalent. If we undertake the two-sample Kolmogorov-Smirnov test, we obtain the following values D= 0.14815, p-value = 0.0003236. The p value is less than 0.05, so we can reject the null hypothesis that the two distributions are the same at the 5% significance level. The sample size are 480 for open and 357 for closed.
12) Cafe, R. (2016), ‘Last Call: What’s happened to London night life?’ BBC Keeble, E. (2016), ‘The ever-growing list of night club closures is completely unacceptable’, Metro.
13) The data is based on Land Registry data of 9,022,400 London property transactions at postcode level between 1995 and 2016. This has then been matched to London ward level (with the exception of the City of London which was treated as a single ward). The growth is calculated based on the median house price in each ward in each year i.e. the house price that lies in the middle of all the sale values in a given year.


