A profile comprising 2% of households uses four times more electricity, on average, than households in the most commonly observed profile
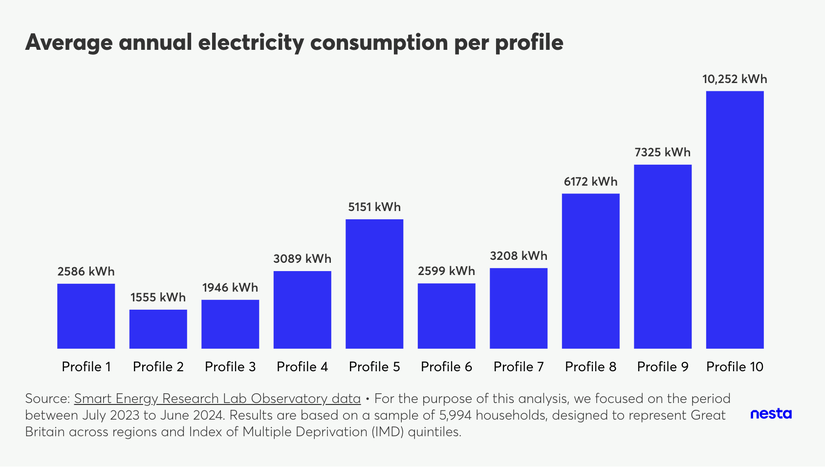
Average annual electricity consumption per profile
Image Description
A vertical bar chart titled "Average annual electricity consumption per profile" shows the average annual electricity consumption in kWh for each energy-use profile. There are 10 bars, one for each profile, where profile 2 has the lowest consumption, at 1555 kWh/per year, and profile 10 has the highest consumption, at 10,252 kWh/per year.
The footnote highlights the data source, Smart Energy Research Lab Observatory data and that "For the purpose of this analysis, we focused on the period between July 2023 to June 2024. Results are based on a sample of 5,994 households, designed to represent Great Britain across regions and Index of Multiple Deprivation (IMD) quintiles."
Consumption varies quite substantially by energy-use profile, with the average household in profiles 8, 9 and 10 (the smallest profiles) consuming substantially more electricity on average when compared to profiles 1, 2 and 3 (the biggest profiles). In fact, the average household in profile 10 consumes four times more electricity than the average household in profile 1.
These consumption disparities are partly influenced by household composition. While all profiles include a mix of single, double, and larger occupancy homes, the distribution of household occupancy within each profile isn't uniform.
Another key factor driving consumption differences is the presence of specific technologies. For example, profiles 3, 9, and 10 have a higher-than-average proportion of households with solar panels: over 20% in these profiles compared to less than 11% in others. This suggests that actual consumption for these households might be even higher than observed – this is true across all profiles, but might be affecting profiles 3, 9 and 10 more due to the higher rates of PV prevalence. They could be directly using electricity generated by their solar panels (electricity exported back to the grid is not included in the results or used to create energy-use profiles).
Key differences between profiles 1 and 10 include the following.
- Presence of solar panels and electric vehicles: over 20% of households in profile 10 have solar panels and/or electric vehicles, whereas less than 5% of households in profile 1 have solar panels and/or electric vehicles.
- Electric central heating: more than 50% of households in profile 10 have electric central heating (with at least 30% owning a heat pump). In contrast, less than 10% of households across all other profiles have electric central heating.
- Household composition: profile 1 has a lower percentage of larger households, with 25% of households having three or more occupants compared to approximately 50% in profile 10. Additionally, profile 1 has a smaller proportion of families with children (14% vs. 27% for profile 10) and a higher proportion of households composed of adults aged 65 or older (39% vs. 28% for profile 10).
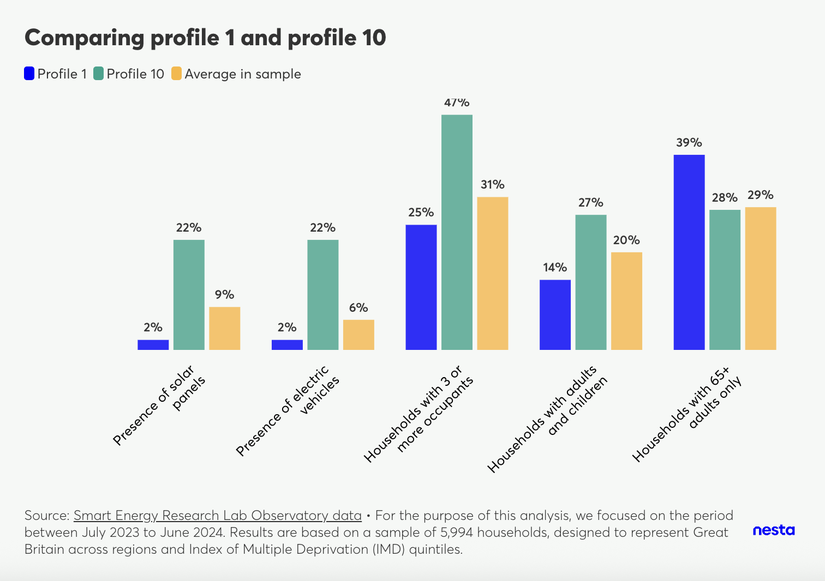
Comparing profile 1 and profile 10
Image Description
A vertical bar chart, titled "Comparing profile 1 and profile 10," compares these two profiles against the sample average based on the presence of solar panels, electric vehicles, and the composition of households (with 3 or more occupants, with children, or with only adults aged 65+).
The footnote highlights the data source, Smart Energy Research Lab Observatory data and that "For the purpose of this analysis, we focused on the period between July 2023 to June 2024. Results are based on a sample of 5,994 households, designed to represent Great Britain across regions and Index of Multiple Deprivation (IMD) quintiles."