Nesta Working Paper No. 15/06
Mining the grant-makers
David Kane
National Council for Voluntary Organisations
www.nesta.org.uk/wp15-06
Abstract
Below the radar organisations are small, unregistered, but form a vital part of communities across the country. The nature of below the radar organisations means they are difficult to quantify and measure, and so the assessment of them in NCVO's Civil Society Almanac series has always been a partial one. Our approach, outlined in the paper, aims to use data from grant-making bodies (both statutory and private) to identify below the radar organisations. By matching data about who these grant-making organisations fund with data on registered organisations, we hope to identify the remainder as below the radar. This approach, we believe, will enable us to pick up organisations outside the sphere of known, registered organisations. However, the method will pick up particular types of organisations - those that have an interest or an ability to seek out grant funding. In this sense, this method can be seen as a way of lowering the radar, rather than bypassing it entirely. The approach had some success in identifying below the radar organisations, allowing some of their characteristics to be explored. Some possibilities for future research and recommendations for improving the source open data are also included.
JEL Classification: L31
Keywords: Voluntary organisations, below the radar, open data.
Acknowledgements: Nesta; Community Foundations UK; Devon Community Foundation; Oxford Community Foundation; Northern Rock Foundation - Penny Wilkinson; Pete Bass; Will and Fran Perrin (360 Giving); Joni Browne; Véronique Jochum and Maria Pikoula (NCVO). Corresponding Author: [email protected].
The Nesta Working Paper Series is intended to make available early results of research undertaken or supported by Nesta and its partners in order to elicit comments and suggestions for revisions and to encourage discussion and further debate prior to publication (ISSN 2050-9820). © Year 2015 by the author(s). Short sections of text, tables and figures may be reproduced without explicit permission provided that full credit is given to the source. The views expressed in this working paper are those of the author(s) and do not necessarily represent those of Nesta.
Mining the grant-makers
A data driven method for identifying below the radar organisations in data released by grant-makers
David Kane, NCVO Research, June 2014 - February 2015
data.ncvo.org.uk
Aims of the project
To develop and test a methodology for identifying below the radar organisations within data held by grantmakers on who they fund.
Introduction
Below the radar organisations are small, unregistered, but form a vital part of communities across the country. The nature of below the radar organisations means they are difficult to quantify and measure, and so the assessment of them in NCVO's Civil Society Almanac series has always been a partial one. The estimate used in the Almanac is based on Low Flying Heroes, a publication published in 2001 by the New Economics Foundation. By aggregating a number of data collection techniques they produced a figure for the rate of "micro social enterprises" per head of population. This number was aggregated to produce the 600,000 figure used in the Almanac.
Approaches to measuring below the radar activity in a locality have used techniques such as the LOVAS method developed by the Home Office, or the Third Sector Research Centre. These methods allow a comprehensive and detailed survey of an area. However, they are labour intensive, and without significant resources could not produce a UK-wide dataset for data analysis.
Our approach, outlined in this paper, aims to use data from grant-making bodies (both statutory and private) to identify below the radar organisations. By matching data about who these grant-making organisations fund with data on registered organisations, we hope to identify the remainder as below the radar. This approach, we believe, will enable us to pick up organisations outside the sphere of known, registered organisations. However, the method will pick up particular types of organisations - those that have an interest or an ability to seek out grant funding. In this sense, this method can be seen as a way of lowering the radar, rather than bypassing it entirely.
Outline of the methodology
The project methodology is based on looking for below the radar organisations within data held by grant-makers. In the context of the project we are defining below the radar groups as associations of people with a charitable or social aim, but which don't have a formal registration as a charity, company or other legal form. They will usually be unregistered due to their small size (as measured by income, expenditure, assets or employees) though they may undertake significant activity. This definition is, however, focused on organisations (though they may not be formally constituted) and so won't capture some below the radar activity - particularly new forms of activity such as social media.
The project methodology uses three stages to identify these organisations. First, the source data is gathered from grant-makers (either directly or through the 360 Giving initiative). Secondly, the data is reconciled with official registers of organisations by application of reconciliation scripts. Lastly, the success of the process is tested and any results produced. The methodology is set up to be flexible and iterative, with improvements and refinements identified as the project progresses.
Gathering the data
Grant-making foundations are a largely untapped source of data for research purposes - they are often private and independent organisations which do not release data as a matter of course, and accessing data from large numbers of them would require talking separately to each foundation, a time-consuming process. This project took advantage of a current movement within the grant-making community to be more transparent and open up data, particularly data on how they spend their funds.
The 360 Giving project is at the forefront of this. The project, which was founded by Will and Fran Perrin of the Indigo Trust, has an ambitious aim to open up data relating to 80% of the UK's grants by value within five years. It has done this by working with grant-makers to open up their data, developing a standard for publishing data, and developing a tool for exploring the data.
In addition to the data released by 360 Giving, we also hoped to convince other grant-makers to open up their own data, and focused particularly on asking those grant-makers who were likely to work with below the radar organisations.
360 Giving data
Data from 360 Giving was downloaded from the grantNav site funded by 360 Giving. The bulk data download (CSV link - 27 MB) was used, producing data on over 185,000 grants from 14 funders. The file was downloaded in August 2014. Table 1 shows the number and value of grants in the data download, by funder. The data includes grants made between 1998 and 2014, with the bulk of grants relating to 2004 to 2013 (although the period included varies by funder).
| Funder |
Number of grants |
Amount awarded (£m) |
| Big Lottery Fund |
84,360 |
2,606.8 |
| Arts Council England |
26,343 |
432.0 |
| DSDNI |
14,719 |
618.3 |
| Wellcome Trust |
14,132 |
4,357.6 |
| TSB |
11,908 |
2,116.6 |
| Sport Wales |
9,413 |
118.7 |
| Sport England |
8,449 |
1,124.3 |
| Creative Scotland |
7,291 |
328.7 |
| Arts Council Wales |
4,218 |
126.0 |
| Sport Northern Ireland |
1,697 |
112.7 |
| Nominet Trust |
201 |
14.9 |
| Nesta |
172 |
9.6 |
| Total |
182,903 |
11,966.0 |
In general this data is sparsely populated. In the bulk data download no charity numbers were present, for example, and the "description" field was not filled in for any entries. For the Big Lottery Fund data, which makes up nearly half of the grants included in the file, the 360 Giving bulk data was supplemented with data sourced directly from the Big Lottery Fund, including charity numbers, company numbers and a description of the type of organisation. As well as including the needed data for 84,000 organisations, this supplementary data also allowed us to test the reconciliation and matching process.
Data from other funders
At the start of the project we identified a lack of interest from funders in releasing their data as a potential risk to the success of the project. The 360 Giving bulk download provided a mitigation of this risk - even with no additional data we had a large dataset to work with, but we were also keen to involve other organisations.
The 360 Giving data relates mainly to the largest grant-makers, and is largely based on data from Lottery- or government-funded grant-makers (with the exception of Wellcome Trust, TSB and Nominet Trust). We felt it was important to test the method on a diverse range of grant-makers, particularly those that are likely to fund smaller organisations.
The approach taken to encouraging other grant-makers to share their data had two avenues. First, we publicised the project on the NCVO blog platform, and promoted the blog post via Twitter and NCVO's other communication channels. We also proactively identified grant-making foundations that met our criteria and contacted them. We were particularly interested in Community Foundations, who often emphasise their relationships with smaller organisations in an area.
Both the blog post and proactive contact with organisations did not generate much activity, which was disappointing. With limited resource for publicising the ask and pursuing leads, it was difficult to generate much in the way of data. However, staff from Community Foundations UK (the association of Community Foundations) did get in touch after reading the blog post, and also agreed to publish a call for action on their own blog platform. This was successful in attracting a representative from Devon Community Foundation, who were willing to provide data on 580 grants worth £1.25 million.
Another funder that was willing to provide data was the Northern Rock Foundation, who are now no longer operating. As part of their preparations for closing they were keen that what they had learnt as a funder was available for others to use, including data on who they funded. Their data had been prepared using the 360 Giving standard, but wasn't included in the 360 Giving data. It was supplied separately to us and included in our analysis. The data included 2,100 grants worth £111 million, with grants going back to 1998.
Database structure
The data downloaded, whether from the 360 Giving project or gathered from other sources, is stored in a MySQL database, primarily accessed through phpMyAdmin. The database structure was largely based on the draft data standard used by the 360 Giving project, particularly the "flat file" version used in the data download. Data gathered from other sources was transformed into the same data format upon import. Where fields were not available but were needed (particularly the unique ID for each grant) they were created. We hope to feed back these IDs to the data providers to maintain consistency when the data is used again.
Reconciliation
The next step after the data was gathered and stored in the database is to reconcile it with various registers of organisations. The reconciliation process has two parts:
- A reconciliation service which holds a large database of organisations. The service accepts an organisation name as an input, and then attempts to find a match with the database of organisations. It returns a list of one or more organisations that may match the given organisation, and a score indicating how good the match is. In general, a good reconciliation service will attempt to look for close matches, not just exact ones. It does this by accounting for misspellings, abbreviations, etc, by standardising the names. For this project two reconciliation services were created, one which uses the Elasticsearch search engine, and one which applies custom searches to a MySQL database.
- A data cleaning program which applies the reconciliation service to a list of names and allows the matches to be examined and checked whether they are correct or not. OpenRefine (previously known as Google Refine) was used for this purpose.
Elasticsearch reconciliation service
Elasticsearch is an open source search engine which can be installed on a compatible computer in order to index a number of documents and return the most appropriate document based on a user's query. It is most commonly used for web search engines, for example a site search engine. A high profile example of Elasticsearch inaction is the main UK government website gov.uk.
Elasticsearch allows for quite complex search queries, and for the way it handles the query to be fine-tuned to produce the most appropriate results. It also allows complex documents with many fields to be indexed, making it suitable for our purpose. A record for each charity and company: a "document" is entered into Elasticsearch's database, with fields such as name, objects and postcode. For charities, it also includes additional names, former names and acronyms which are useful for matching purposes.
MySQL custom reconciliation service
The reconciliation service takes a name as input, and then attempts to match it to one of the charities or companies. The matching is based on various weightings, which were tweaked during testing to produce more accurate results. The name is given the highest weighting - matching a charity name exactly yields the strongest match. The previous names are also highly matched. The charities objects can be matched as well, but are given a low rating. A match is given a half weighting if the organisation is no longer registered and has been removed from the register. The weighting is also adjusted to give the larger organisations (by income) a higher weight.
This service is created though a combination of PHP and MySQL scripts. The service uses a MySQL database with information on charities and companies. When organisations are imported into the database, a standardised version of the name is created, which is used in the matching process. This standardised version includes the following changes:
- "The" is removed from the beginning or end of the name
- "Itd" and "limited" are removed from the end of the name
- "trust" is removed from the end of the name
- "charity" is removed from the name
- Ampersands ("&") are replaced with "and"
- Any non-alphanumeric characters (A-Z and 0-9) are removed from the name
- The string is turned into all lowercase
- Any double spaces are replaced with single spaces.
Two additional standardised versions of the name are also created which remove any text from brackets and reorder the words in the name in alphabetical searching. The purpose of these standardised versions is to maximise the chances of a match by removing parts of the name which commonly vary. For example, an organisation may be listed as "The National Council for Voluntary Organisations" in the official register, but "National Council for Voluntary Organisations, The" in a database. Applying the standardisation procedure above to both names would result in the text "national council for voluntary organisations" being shown for both.
This reconciliation service goes through a series of commands attempting to match a given input to organisations in the database. If a particular command retrieves a match then it returns the matches, otherwise it moves onto the next command. It starts by checking for exact matches, then uses the SQL "LIKE" command, then the "SOUNDS LIKE" command, and finally the "MATCH ... AGAINST" command which performs a full text search similar to that carried out by Elasticsearch. For charities, reconciliation is based on any of the names held in the Charity Commission database, which includes former names, trade names and acronyms.
The score given to the results returned is based on the similarity of the input name to the matched name, using PHP's similar_text function.
OpenRefine data cleaning
Originally created by Google, OpenRefine is now run by an open software community of developers. This software specialises in working with messy data, and allows us to send all our grants to the reconciliation scripts, deal with the results, and perform other data cleaning tasks. One other task we have used it for is to identify large groups of organisations that appear in the data but definitely will not be matched, such as universities, primary schools or county councils.
Testing matching success
Our first testing of the matching process focused on provided by the Big Lottery Fund. This is because this data already includes a charity number, so it can be compared to the result of the matching process to check whether our matches are correct, and whether they will be correct in other cases.
This kind of fuzzy-matching is notoriously difficult. Only small differences in names can be easy to spot for humans, but not for automated scripts. We believe that our matching processes will be effective, but we also know, having worked a lot with this messy data that it will not be perfect. We designed a process to test our initial matching of Big Lottery Fund data to assess the usefulness of the matching process. Initially this matching was based on the Elasticsearch reconciliation service only.
The first round of results had a high sensitivity (96%). This means that unregistered organisations (as identified by the Big Lottery Fund) are very unlikely to be incorrectly matched to an organisation using our process. However, this doesn't give a full picture of the success of the matching process. A further indication is provided by the positive predictive value. This indicates what proportion of unmatched organisations are actually unregistered organisations. This score was quite low in the first test - 83% - meaning that groups that should have provided matches are not.
A quick glance over the false negatives (organisations that should have matched, but didn't) shines some light into this lower score. Particular groups of charities were very likely to occur in those groups. Scout Groups were one example of this. The Scout Association is of course a registered charity, and so are many individual scout groups. But then, some aren't. In the test result a lot of scout groups that are registered were not picked up, and were guessed as being other scout groups, elsewhere in the country. The same was true for Age Concern, Age UK, Royal British Legions and other charities with a federal structure. It appears that when the same string is repeated over and over in both lists, then it becomes more difficult for the process to confidently make the match.
|
Unregistered |
Registered in England/Wales |
Prevalence |
| Not matched |
True positive: 886 |
False positive: 184 |
48% |
| Matched |
False negative: 35 |
True negative: 807 |
Positive prediction value: 83% |
|
|
|
Negative prediction value: |
|
Sensitivity (true positive rate): 96% |
Specificity (true negative rate): 81% |
Accuracy: 89% |
|
|
|
|
Two improvements were then put in place to refine the process. Keyword searches were used to remove the main "federal" charities - scouts, guides, boys/girls brigades, etc - from the matching list. This gave an improved positive predictive value of 86%. Further improvement would be possible by identifying other groups of federal charities.
A second improvement came from the confidence score attached by the script to each match. Where there is only one match for an organisation, and the score is above a certain threshold, a match is automatically marked as correct by Google Refine. Matches where there is a high score that doesn't meet these criteria did appear likely to be false negatives. When the threshold was lowered to include these values the positive predictive value increased to 91%. This does comes at the expense of some true negatives and some true positives. Given our target of below the radar organisations, this trade-off is expected to be worthwhile.
|
Unregistered |
Registered in England/Wales |
Prevalence |
| Not matched |
True positive: 668 |
False positive: 65 |
48% |
| Matched |
False negative: 30 |
True negative: 682 |
Positive prediction value: 91% |
|
|
|
Negative prediction value: 96% |
|
Sensitivity (true positive rate): 96% |
Specificity (true negative rate): 81% |
Accuracy: 93% |
However, these positive results for the matching process hide an important part of the picture. The results show that it is possible to identify which organisations are registered charities or companies to a useful level of accuracy, but do not show whether the unmatched organisation is another type of organisation. This issue becomes crucial for looking at the large mass of grant-making data gathered. Many of these grant-makers have made grants to a wide range of organisations, and have even included grants to individuals in the data (in the case of the Arts Council, who make grants to individual artists).
Improvements to methodology
Based on the testing, further enhancements were made to the methodology used. A further stage was introduced, at which groups of organisations would be identified. This would include looking for organisations that are not charities or companies - particularly public sector organisations. Universities, local authorities and schools were identified as organisations that would not be matched but could not be considered below the radar. However, as a complete register of these organisations is not available it was not possible to construct a reconciliation process. Instead, keyword searches would be used to identify particular groups.
Real world testing
In order to get an indication of the coverage of our data we opted to identify BTR organisations by looking at local sources of information in a given area. We opted for St Albans and used a number of online and offline sources.
Online sources
We were able to identify a range of BTR organisations through the website All about St Albans under "Clubs and Societies" as well as the Voluntary and Community Sector Directory published by The Centre for Voluntary Service St Albans.
Offline sources
We went to St Albans and visited places where we thought community activities would be advertised. We looked at notice boards in GP surgeries, churches, the Civic Centre, the public library, supermarkets and newsagents. Interestingly, many of the places we went to did not have noticeboards that included information on activities provided by other organisations or if they did they focused exclusively on activities that were in their specific field (for instance, the GP surgeries had posters and leaflets to promote health helplines and support groups) rather than on community activities more generally. When noticeboards did include information on a broader range of activities, these activities were run by community groups but also, to quite a large extent, by individuals operating as freelancers or sole traders (providing, for instance, leisure activities such as dance or language classes).
In some cases it wasn't easy to distinguish between the two. The most useful source of information was by far the public library that had two dedicated folders in which they had filed brochures and leaflets on activities provided by local community groups and voluntary organisations. Another useful source were the local newspapers (St Albans and Harpenden Review that published a list of activities for the week, and The Herts Advertiser).
Real world results
The result of the real world fieldwork were two lists of organisations. The fieldwork produced a list of 66 organisations, while there were 161 organisations identified through the website directory. These lists were compared to a list of 39 organisations identified from our source grant data, as well as 582 charities whose registered address is in the St Albans district.
We then undertook a process of matching the four lists. First, the web and fieldwork lists were matched to the Charity Commission register. Two out of 66 organisations on the fieldwork list and seven out of 161 organisations on the web list were identified as registered charities. This suggests that the majority of organisations on these lists are not registered, and so can be identified as "below the radar".
Next, the list of organisations from our grants data was looked at in detail, and a further six organisations were removed from this list because they were an unmatched charity or school. Four of the remaining 35 organisations were matched to the web list, while two were matched to the fieldwork list.
It's important to remember these results are from a small scale exercise to examine their validity in one area. The results suggest that there is some validity in the results - the fact that any organisations were found on both the grants-based list and local fieldwork gives an indication that valid organisations are being picked up through the grants-based method. But the large numbers of organisations that only appeared on one list suggests that this new method is picking up organisations that aren't found through more traditional mapping techniques, and that the most successful mapping exercises for an area will use a combination of methods to identify organisations.
Results
Have we found below the radar organisations?
After applying the matching process we identified over 111,000 grants out of our population of 240,000 grants made that were not matched to a registered organisation, or identified as a registered organisation or other "above the radar" organisation (such as a local authority or school) through keyword searches. If the matching process was perfect this would indicate around 46% of grants in our database were made to unregistered organisations.
The next step in producing results was to deduplicate the grants to produce a list of organisations. As the deduplication process is based on the name of the funded organisation, it does have some flaws - it may group together separate organisations that have generic names, and it may miss one organisation if it is under a slightly different name between funders.
After deduplication there were 125,000 organisations identified in the grants database. 88,000 of these organisations (70%) received only one grant, but the majority of grants went to the 36,000 organisations that received more than one grant. Of the 125,000 organisations, 63,000 had received one or more grants that we had previously identified as registered organisations. This would indicate that 49% of organisations in our dataset were unregistered, around 62,000 organisations.
Figure 1 below gives an overview of the results of the process.
Figure 1 - Result Flowchart:
This flowchart illustrates the reconciliation process and filtering of grant data to identify "below the radar" organisations.
- Initial population: 240,012 grants (125,149 organisations)
- Reconciliation:
- Filter by matching with registered organisations or identifying as registered organisation.
- Matches:
- Registered charity: 55,510 grants
- Companies: 24,475 grants
- Public sector: 19,787 grants
- Universities: 13,903 grants
- Registered charities (not matched): 10,839 grants
- Person: 4,444 grants
- Total Matched or identified as registered: 128,958 grants (63,264 organisations)
- Remainder: 111,054 grants (61,885 organisations)
- Filter by size of largest grant:
- Grant amount over £5,000: 28,668 organisations
- Remainder: 33,217 organisations - Most likely to be "below the radar"
However, examination of this data in detail reveals that this is likely to be a large overestimate of the number of below the radar organisations in this dataset. In the Big Lottery Fund dataset, a flag is available for the charitable status of the organisation, and one available flag is "Unregistered Organisation". Just over a third (36%) of organisations in the Big Lottery Fund dataset are assigned to this category. This itself indicates an overestimate in the number, particularly as the Big Lottery Data is included in the matched set. Comparing the organisations identified as unregistered in our dataset and the original Big Lottery Fund dataset, around three-quarters of organisations were identified in both sets as unregistered. Additionally, close examination of the Big Lottery Fund dataset indicates that it may not provide a reliable record itself of unregistered organisations. A small but significant number of the organisations marked as unregistered in the Big Lottery Fund dataset are in fact registered in one form or another - there appear to be around 2,400 limited companies, for example, and 1,100 Community Interest Companies.
A further issue is that the Big Lottery Fund dataset is not uniformly representative of the types of organisations that all grant-makers in our dataset make grants too. Data from the Arts Council contains a large number of grants to individual artists. As the matching process had no facility for identifying something that looked like a person's name (an enormously difficult task given the variety of first names and surnames) these were often either wrongly matched to an organisation or left as an unregistered organisation. The Wellcome Trust data contained a large number of grants to Universities, which were not systematically matched either. And lottery sports boards often made grants to sports clubs which can use a variety of legal forms, including Community Amateur Sports Club (CASC), charity, company or local authority-owned, not all of which were captured by our matching process. Give these issues we cannot automatically assume the "success" rate found for the Big Lottery Fund data would hold true for the rest of the dataset.
A further check of the results can be done by looking at the amount awarded. As the threshold for charitable registration in England and Wales is an income of over £5,000, this can be used as a proxy for the size of the organisation in the dataset. An organisation which had received a grant of greater than £5,000 could be expected to need to register as a charity if their aims were charitable, and so would not be below the radar. It is worth noting, however, that this will not apply in all cases, the grants may take place over a number of years, for example. Of the 62,000 unmatched organisations, 33,000 received no grants greater than £5,000, with some of those that did receive more in receipt of very large sums (millions of pounds). This may indicate that just over half of the unmatched organisations (33,000) could actually be classed as below the radar. An analysis of the amounts awarded for organisations identified as "unregistered" and "registered" did indicate some success in the matching process however, with unmatched organisations receiving smaller awards on average than matched ones (median of £5,000 and £9,750 respectively). The distribution of award sizes is explored below.
What can we find out about these organisations?
As explained above, we have not been able to arrive at a definitive list of below the radar organisations. However, based on our criteria above we can identify those organisations that are likely to be below the radar - those that haven't been matched to a registered organisation, and where the amount awarded is not greater than £5,000. This list won't consist only of below the radar organisations - there are likely to be some false positives that are wrongly included on it, and false negatives that aren't on it - but it should provide a base for some information about what these organisations look like.
It also needs to be remembered that, in effect, the dataset generated is based only on organisations that have been funded by a limited set of funders, with the Big Lottery Fund by itself accounting for nearly half the grants given. Therefore any conclusions about those organisations need to recognise that they reflect the priorities and strategies of those funders, sometimes over a long period.
Subsectors
The first criteria to look at is the subsector of the organisations - what their area of work is (health, education, etc). To ascertain this we have applied the International Classification of Non-project Organisations (ICNPO) to our list. As the only information available on each organisation is their name, we have assigned each organisation a category in ICNPO based on their name. As there were too many organisations to look through manually, we have instead assigned category based on naive bayesian probability. A script uses the names of organisations that have previously been manually classified to make an estimate of what the most likely category will be for a given organisation name, based on the number of times words appear in different categories. As with our matching process, this is not expected to give a 100% correct answer for every organisation - but we believe it is good enough to get a broad idea of the activities of these organisations.
We can first get some verification of how successful the classification has been by comparing the classifications assigned to organisations with the funder that has funded them. In specific cases we would expect some categories to appear more often - organisations funded by the Arts Council are more likely to be arts organisations, Sports England is more likely to fund sports organisations. The findings do seem to indicate some success in the classification process - 39% of organisations funded by lottery sports distribution bodies (Sport England, Sport Wales, Sport Northern Ireland) are assigned to the sport category, compared to 8% of all organisations, and 34% of organisations that are funded by the Arts distribution bodies (Arts Councils, Creative Scotland) are in the culture and arts category, compared to 15% of all organisations.
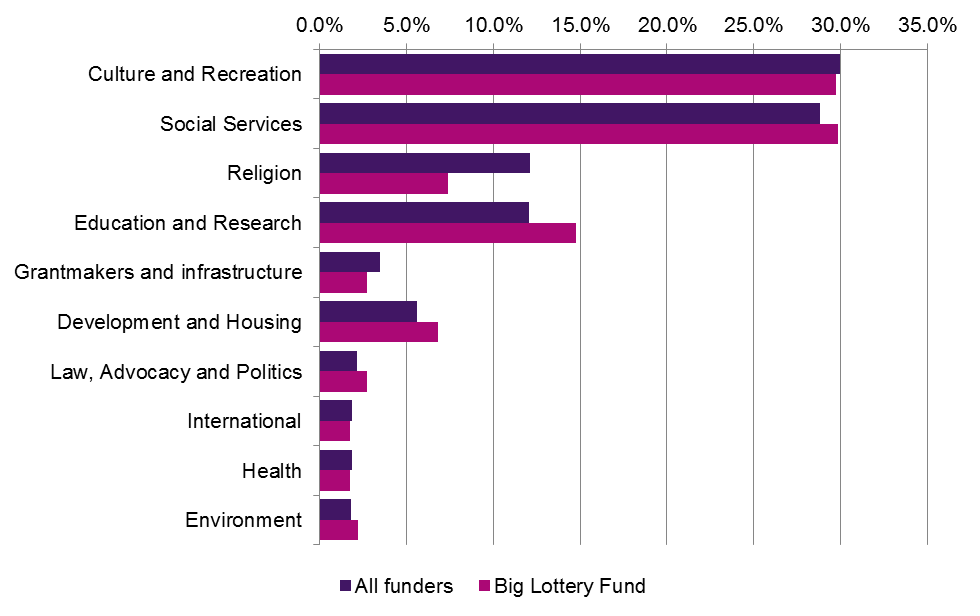
The initial analysis, shown in figure 2, shows that the largest category of below the radar organisations is culture and recreation (which includes arts and sport organisations), with 30% of organisations. The figures are also shown for just the Big Lottery Fund, to remove the impact that other funders that focus on a single category have (notably arts and sport). Social services is another large category, the largest for organisations that received funding from the Big Lottery Fund, with 29% of all organisations and 30% of organisations funded by the Big Lottery Fund. This category can end up being a "catch-all", encompassing a wide range of social activities, including children's clubs and support for the elderly.
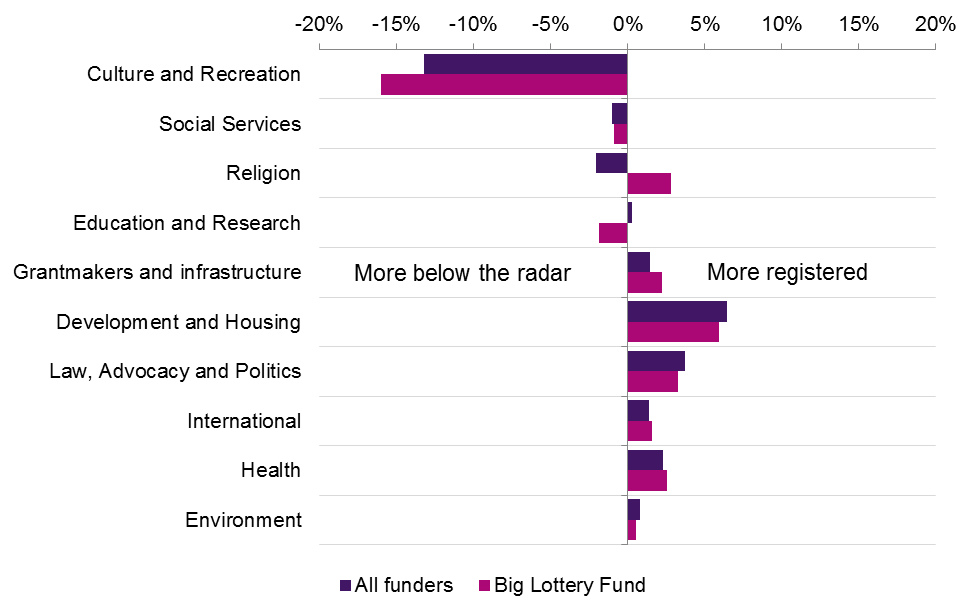
Given these categories, we can then see how classifications compare between organisations we have identified as potentially below the radar and registered organisations. Comparisons have been carried out only with registered charities, to provide a consistent set of organisations for comparison. Figure 3 compares the distribution of organisations in our below the radar population with those for registered charities, showing whether below the radar organisations are more likely to be found in a category (bars on the left) or in registered charities (bars on the right). Again, these figures are shown across all funders and just for the Big Lottery Fund. These figures show that culture and recreation organisations are not only the largest group, but also disproportionately represented in below the radar organisations. This demonstrates the importance of arts and sports organisations to below the radar activity, even outside of dedicated arts and sport funders.
Geography
We have limited ability to map the geography of these organisations. No geographical information was provided in the 360 Giving data, so for this analysis we are relying on information released by the Big Lottery Fund (and so the analysis only includes those organisations that received funding from them).
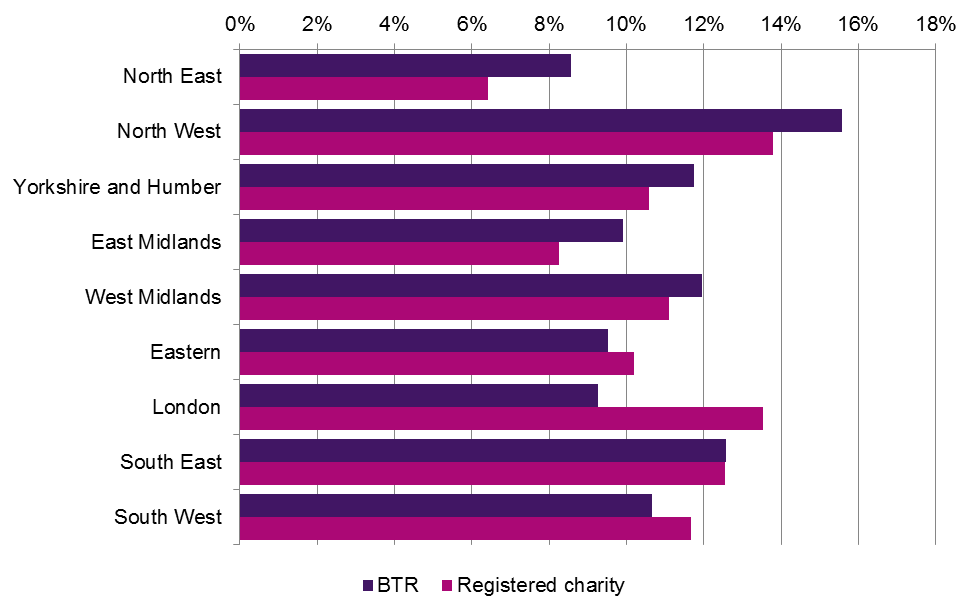
For registered organisations (particularly registered charities) there is a regional trend towards London-based organisations. This is in large part due to a "headquarters effect" - large national and international organisations are often based or registered in London, even if their activities take place elsewhere. We would expect to see no evidence of this effect for below the radar organisations, with a much more even distribution around the country. And this appears to hold true.
| Country |
Below the radar |
Registered charity |
| England |
71% |
75% |
| Northern Ireland |
3% |
4% |
| Scotland |
14% |
15% |
| Wales |
12% |
5% |
| UK-wide |
0.1% |
1.5% |
| International |
0.0% |
0.1% |
Looking just at England, we can clearly see a more even distribution across the country than for registered charities. 14% of registered charities funded by the Big Lottery Fund are based in London (although that is not necessarily the location of their activities), while 9% of organisations identified as below the radar organisations are. The North West, North East and East Midlands have a greater proportion of below the radar organisations than when compared to registered charities. This may provide some support to the idea that below the radar organisations are more active in areas where charities are less common.
Organisation size
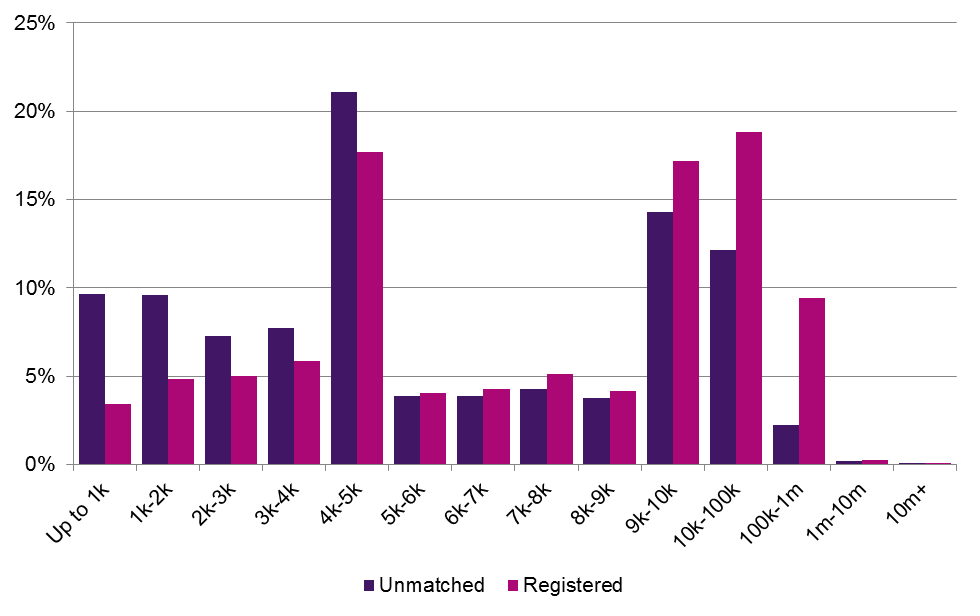
The data gathered does not provide a figure for the size of the organisations that are receiving funds. However, it is possible to use the size of the award as a proxy for the size of the organisation. While large organisations do get small awards, in most cases it may give an idea of size. The size of awards varies throughout the dataset, although there are peaks at £5,000 and £10,000 with a large number of grants made at these amounts. In the figures shown here the largest grant received by an organisation is used where that organisation has received more than one grant.
In Figure 5 we have also included those organisations that weren't matched but had award amounts greater than £5,000, which have been excluded from our other analyses of below the radar organisations. Looking at figure 5 we can see divergence at the top and bottom of award size, with unmatched organisations more likely to have smaller grants, and less likely to have larger ones. The preponderance of larger grants to unmatched organisations, particularly in the £10k to £100k band shows that the matching process is not perfect.
Conclusion - is the methodology successful?
The methodology has had mixed results. The process of matching organisations that have received funding to official registers of organisations (notably the Charity Commission register) appears to have gone well. But the picture is complicated by the difficulties in finding other registered organisations in the dataset. In particular, there is no comprehensive register of public sector organisations which includes, for example, parish councils, schools and other smaller organisations. Looking for discreet groups of organisations such as universities or local authorities is made difficult by the way these organisations are described.
However, it was possible to identify a group of organisations that could be considered as more likely to be below the radar - organisations that are likely to be small in size and cannot be easily matched with a registered organisation. To that extent we have been successfully in lowering the radar. The group of organisations that have been identified as likely to be below the radar do exhibit characteristics that might be expected from smaller unregistered organisations - in particular they are likely to be smaller in size (as measured by the size of the grant they received) on average than those identified as registered organisations.
The organisations do appear to differ in characteristics compared to registered organisations. These organisations are more likely to be arts- and sports-based, often running small arts projects or sport clubs. This is true even when the dedicated arts and sport funders in the dataset are excluded. Organisations identified as below the radar do not appear to have the same "headquarters effect" that registered organisations do, whereby looking at the registered address of an organisation shows over-representation of London and the South East, where many larger organisations have their headquarters. The organisations we have identified as below the radar show much more even spread throughout the country.
Recommendations for further work and development
The exercise has generated some possibilities for further work and development.
- A comprehensive register of organisations and reconciliation services needs to be available. Resources such as opencorporates and opencharities provide examples of what is needed. These will help researchers and others to repeat similar exercises using large lists of organisations.
- There is a particular gap around public sector organisations. There is no official list which contains every public organisation, and no unique identifier or URI scheme for organisations. This is vital when looking at a data resource that covers the boundaries between sectors as this one does.
- There are other gaps in available data on civil society organisations. Scottish and Northern Irish charities are not currently included, although Scottish charities are now available as open data from OSCR and the Northern Irish charities register has only recently been set up. Other types of bodies could also be incorporated - royal charter bodies and Community Amateur Sports Clubs (CASCs) are examples.
- The 360 Giving programme is providing useful data which is of value and offers insights that cannot be found elsewhere. We would encourage the continuation of that programme, and that both greater use of the data and improvements to the quality of data imported will make it a more useful resource. Of particular use would be the inclusion of charity numbers and company numbers which would remove the need for an imperfect matching process.


