

How do online data-gathering techniques compare to door-to- door research in understanding how a local community works?
Nesta Working Paper 15/07
Issued: May 2015
Abstract
This report presents the findings of a study undertaken between June 2014 and November 2014 with the LocalNets.org project at the Royal College of Art (RCA), using the RSA’s existing on-the-ground research conducted for the London Borough of Hounslow.
This collaborative research project, Community Mirror, was carried out to understand the ways in which online data-gathering techniques compared to door-to- door research in understanding how a local community works.
The study concludes that digital methodologies do offer a promising approach to mapping the ‘below the radar’ social economy assets. There was a significant amount of overlap between the community assets mapped by the two different research approaches, with 31% of the community assets surfaced in the offline research also discovered by the LocalNets online app.
Author
Gaia Marcus, RSA
Jimmy Tidey, Royal College of Art
The Nesta Working Paper Series is intended to make available early results of research undertaken or supported by Nesta and its partners in order to elicit comments and suggestions for revisions and to encourage discussion and further debate prior to publication (ISSN 2050-9820). The views expressed in this working paper are those of the author(s) and do not necessarily represent those of Nesta.
Community Mirror
A Data-Driven Method for 'Below the Radar' Research
Gaia Marcus, RSA Jimmy Tidey, Royal College of Art
Nesta Working Paper 15/07 May 2015 www.nesta.org.uk/wp15-07
Abstract
This report presents the findings of a study undertaken between June 2014 and November 2014 with the LocalNets.org project at the Royal College of Art (RCA), using the RSA's existing on-the-ground research conducted for the London Borough of Hounslow. This collaborative research project, Community Mirror, was carried out to understand the ways in which online data-gathering techniques compared to door-to-door research in understanding how a local community works. The study concludes that digital methodologies do offer a promising approach to mapping the 'below the radar' social economy assets. There was a significant amount of overlap between the community assets mapped by the two different research approaches, with 31% of the community assets surfaced in the offline research also discovered by the LocalNets online app.
Acknowledgements: This paper was prepared by Gaia Marcus to report on work undertaken while at the RSA. The relevant contact at the RSA is now Matthew Parsfield. Corresponding author: Gaia Marcus, c/o Matthew Parsfield, The RSA, John Adam Street, London WC2N 6EZ; [email protected].
The Nesta Working Paper Series is intended to make available early results of research undertaken or supported by Nesta and its partners in order to elicit comments and suggestions for revisions and to encourage discussion and further debate prior to publication (ISSN 2050-9820). © Year 2015 by the author(s). Short sections of text, tables and figures may be reproduced without explicit permission provided that full credit is given to the source. The views expressed in this working paper are those of the author(s) and do not necessarily represent those of Nesta.
About us
The RSA (Royal Society for the encouragement of Arts, Manufactures and Commerce) is an enlightenment organisation committed to finding innovative and creative practical solutions to today's social challenges. Through its ideas, research and 27,000-strong Fellowship it seeks to harness the extraordinary amount of untapped creative potential in society – by empowering people to be active participants in creating a better world.
The RSA Action and Research Centre combines practical experimentation with rigorous research to create a unique programme of work. Our approach is inspired by our history of solving big problems by unleashing the human potential for enterprise and creativity.
The RSA has been undertaking practical work with communities and services to put into action many of the ideas and aspirations in this paper. Our work is demonstrating ways in which people in communities can find creative, people-powered solutions to the challenges they face. Public services have a key role in supporting this, but they need to become much better at understanding how people connect, and want to connect, with other people and organisations.
The RSA Connected Communities team explores how an understanding of social connections and assets can help shift power to people and their communities to help them meet their social and economic needs and aspirations. Social network approaches can inform new policy and practice to address challenges to public services; drawing on research in New Cross Gate and Knowle West, the Connected Communities team has explored how to overcome some of the limitations of traditional, place-based redevelopment through understanding social networks. The team is currently completing action research on collaborative approaches to supply and demand management in health, and exploring the causes and effects of isolation and low wellbeing in a deprived neighbourhood in west London. Later in 2015 it will publish a report on its five year longitudinal study into social exclusion and mental wellbeing.
The Royal College of Art (RCA) LocalNets.org web app is a social media analysis tool designed to understand the digital footprint of communities. It is being developed by Jimmy Tidey, a PhD candidate at Royal College of Art. His research focuses on understanding how social media activity can generate information about community behaviour in geographic 'hyper-local' contexts.
Introduction
‘The less a community knows about itself and its citizens' capacities, the easier it is to fall into a pattern of seeing the community and its people only through a ‘needs' perspective. The more a community becomes familiar with itself and its citizens, the more obvious it becomes that what is good about a community far outweighs whatever needs it might have.'1
This report presents the findings of a study undertaken between June 2014 and November 2014 with the LocalNets.org project at the Royal College of Art (RCA), using the RSA's existing on-the-ground research conducted for the London Borough of Hounslow. This collaborative research project, Community Mirror, was carried out to understand the ways in which online data-gathering techniques compared to door-to-door research in understanding how a local community works.
Pub quiz nights, five-a-side football, street markets, and a myriad of other collective activities, pubs, parks, streets and halls place form the ‘social economy' of a community. As this Nesta research grant recognises, this takes place 'below the radar' - it is not recorded in any structured way, and sometimes only the direct participants know about it.
This information is incredibly valuable. Local residents, local authorities and third sector organisations can benefit from a deeper understanding of this social economy: to inform policy, to reduce duplication of effort, and encourage participation in the wider democratic process.
As the RSA has demonstrated in its Connected Communities programme, access to local information and richness of community connection are linked to wellbeing and happiness.
However, information about the social economy is difficult to access and quickly becomes obsolete. Most attempts to map the social economy of a community use surveys which are so resource intensive that they are difficult to scale beyond small pilots.
The LocalNets.org web app aims to address this problem. It collects and visualises the online activity of a community. The web app takes data from Twitter and blogs, and processes it to produce the following:
- A list of a community's assets, including people, places, organisations, and events.
- A geographic map of where the location's community members are talking about online (see Fig. 1).
- A network diagram of how the community assets are connected to one another.
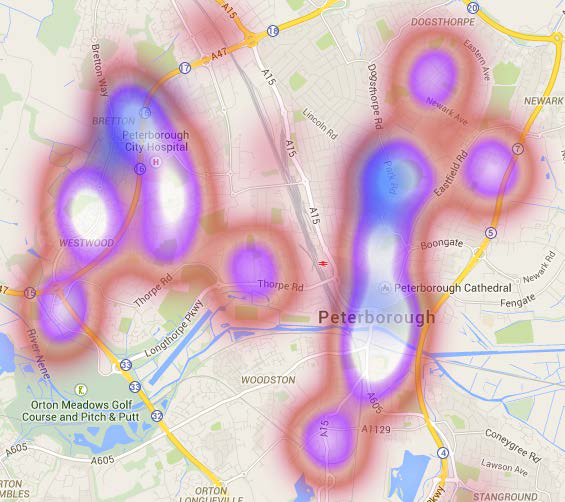 Figure 1: Example of a heat map showing the locations that are being talked about online by members of a community in Peterborough.
This research paper focuses primarily on the community assets list, and aims to answer two questions:
- Is the community assets list from the web app accurate?
- Is the community assets list from the web app useful?
- How do the two approaches compare – do the offline and online techniques map similar assets, and what is lost and gained between the two different approaches?
In our conclusions, we find that digital methodologies do offer a promising approach to mapping the ‘below the radar' social economy assets. There was a significant amount of overlap between the community assets mapped by the two different tools, with 31% of the community assets surfaced in the offline research also discovered by LocalNets. The benefits of using the digital tool are readily apparent: traditional methods typically require significantly more resources than digital tools. As such, reducing the resource intensity of mapping social economies is of primary importance in helping these ideas become more scalable. Furthermore, an interesting avenue has emerged in which digital asset mapping can be ‘seeded' by existing local knowledge and used to complement offline community asset mapping approaches.
This briefing paper sets out our research methods and findings, and concludes with a discussion and summary recommendations. The RSA/RCA research team is indebted to Nesta for its support in enabling the study.
Understanding Community
Traditional approaches
Belongingness – feeling part of a group, family or community, however defined – is an essential part of wellbeing and health. A community may be geographically delimited, it may be virtual, or even a community of interest. On a more personal level, the strong social connections that come to us through our interactions with others – partners, friends and to a lesser extent neighbours and acquaintances – form the basis of our subjective wellbeing and experience of the world.
A number of related fields of practice have emerged that seek to promote an 'asset-based' approach to people and communities. They hold that people, local areas and communities have skills, resources and knowledge of value. It follows that a community-centred approach should seek to build upon these assets. Projects that seek to do this will typically involve community mapping and co-production. These will seek to understand the local context and ensure that projects make sense for their local population. This community mapping can be carried out in many, overlapping ways:
- Asset Mapping: a fundamental part of asset-based community development, which is built on “the notion that communities have never been built on their deficiencies, rather on the capacities and assets of the people and the place."2 It involves the members of a community (however defined) mapping out what they value in their community. The resulting assets can be anything from physical bricks and mortar to sources of local pride or the strength of local relationships. The focus tends to be practical, aiming to surface the local capabilities and resources needed to make this happen at the local level.
- Participatory mapping: a way of working with groups of local people to create visual representations of local knowledge and local places. This allows for the understanding of the local area and its history, space or attitudes to emerge from the conversation and interaction between project participants. Participants will typically be given a series of materials and tools with which to construct their map. These tools can be physical (post-it notes, Lego pieces, string, maps) or virtual (an online workspace or Google map). Participants then work together to create a visual representation of a place using the tools and materials at their disposal. The stories that accompany the mapping will often become an important source of qualitative data for the projects going forward.3
- Community and Social Network surveys: a different way of understanding a community and its social connections is to physically map out the relationships within it as a social graph. This will involve surveys or interviews that ask people a series of questions that aim to surface relationships and connections that make up their social network and community. These might include who people trust locally, who they get information from, who they might go to and work with to change things.
'Below the radar' methods
The term 'below the radar' has a number of interpretations, but here we use it to describe the types of community activities and organisations that are unlikely to be found on national registers or formal databases. These include unregistered organisations, with the Office of the Third Sector stating in 2008 that ‘below the radar' is “the best available terminology for those organisations which are not included in the main national registers [and is] perhaps associated more closely with community building and participation than with service delivery."4
The term is broad enough to include the activities of organisations registered as charities and businesses, when these activities contribute to the wider social economy in unmeasured ways. For example, in Hounslow, Feltham Community Development Association, Feltham Arts, Southville Community and Children's Centre are all listed in official registers. However, these entities' existence has no intrinsic impact on the community; instead it is their actions that do. When they come together to run a community fun day this information will not be recorded in any systematic way. It did show up in the data gathered through the LocalNets.org software, as listed in the events nodes in the appendix.
Additionally, although parks, National Trust properties or local politicians are all on formal lists somewhere, drawing them together into a coherent picture of social economy is not possible without further information about their activities and interactions.
Finally, private individuals with no official role, often form an important part of the social economy, however they will rarely be recorded officially anywhere.
In this document, ‘below the radar' is taken to mean this network of unrecorded social activity, even in the case that some of the actors within the network are formally recorded somewhere.
Research Methodology
This research aims to test the accuracy and usefulness of the community asset list generated by LocalNets.org. This section will describe the existing data set generated by the RSA's “Cranford Stronger Together” project.
On-the-ground research
This study built upon the findings of offline research carried about by RSA in the Cranford area of Hounslow, commissioned by the London Borough of Hounslow and the Hounslow Together Local Strategic Partnership as part of the 'Cranford Stronger Together' project. Its aim was to provide a better understanding of what isolation and wellbeing look like in one neighbourhood in Hounslow and it comprised an ethnographic study, participant observation, and door-to-door questionnaire surveying that gathered both quantitative and social networks data. All the subjects lived in a particular Lower Super Output Area (LSOA) of the Cranford ward of Hounslow, known locally as the Meadows or Beavers Estate.
Nine community researchers were recruited and trained, and carried out door-to-door research on sixteen days between July and September 2014 while RSA lead researchers conducted ethnographic research during the same time period. The overall process included responses to 170 surveys, 50 people participating in focus groups and other forms of participant observation, and six in-depth ethnographies of individuals. This process uncovered 980 community assets, including all the research participants, plus other private individuals, community leaders, locations, services, organisations and events.
Social Network Analysis
In order to gain an understanding of how people are connected to each other, the survey included a ‘name generator' section to collect data for social network analysis. These questions elicited respondents’‘strong ties' by asking them to name up to five people or resources they know for each question. The questions prompted the respondent to name people or resources they know in different ways, or who fulfil different roles in the respondent's network. For example, one question asked the respondent which people they 'enjoy spending time with' or who they see socially, while another asked who the respondent would ask to borrow money from if she lost her purse.
Respondents were then asked to specify which of her contacts knew each other – for example a respondent might mention both her brother and her sister for different questions, and then state that her brother and sister share a connection with each other, as well as to the respondent.
The answers for the social networks section of each respondent's survey were later aggregated using social network analysis computer software (NodeXL and Gephi), in order to create a ‘network map' of all the social relationships reported by the 170 respondents, providing a visual representation of who knows who in the study area.
Online Research
The LocalNets.org web app aggregates tweets and blog posts from selected Twitter accounts and blogs. Each blog post or tweet is then coded with topic tags, geolocation where applicable, and any entities that are relevant to it. Entities that are captured include people, places, organisations and events.
If an item (tweet or blogpost) mentions two or more entities, those entities are considered to be linked. Through this method it is possible to draw a network diagram of the community, where people, places, events and organisations are nodes, and the edges are informed by being mentioned in the same context.
While the web app automates much of the process, for this research data was all checked, and if necessary corrected, by hand.
The online dataset contains 1,911 manually processed tweets and blog posts out of a total 12,000 gathered using the LocalNets.org software. These items were processed backwards in time, with the researcher processing the most recent of the 12,000 first, before working backwards as far as research time allowed given the amount of research hours allocated. This generated a list of 294 community assets, categorised as people, locations, organisations and events. These assets were from across Hounslow, not specifically in the Cranford ward. Cranford residents, unsurprisingly, often identified community assets outside of their own ward.
Research Findings
This section will compare the on-the-ground survey data with the data gathered through the LocalNets.org app.
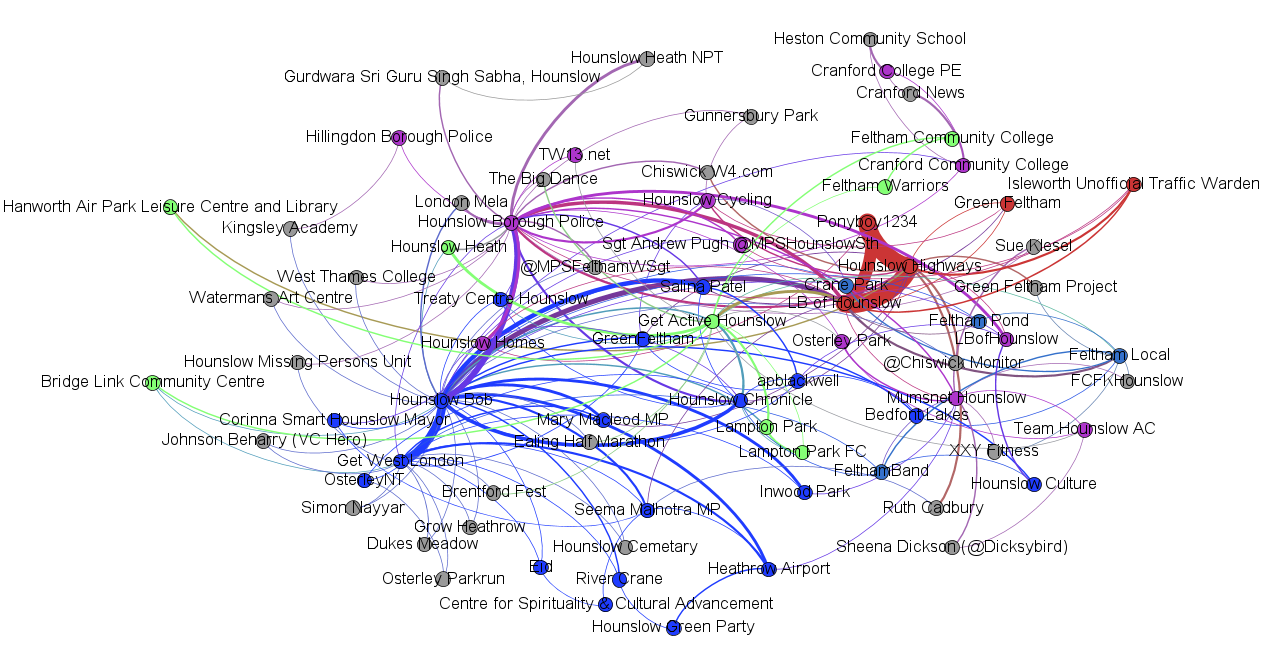 Figure 2: Social network map for Hounslow nodes found online by LocalNets.org
Figure 2 shows data from the LocalNets.org web app. Only nodes with three or more connections are shown. The weight of the line corresponds to the number of times a connection occurred, the colours represent an algorithmic clustering of the network.
Each of these connections indicates an interaction of some kind, many of which offer further qualitative information about needs, services or views within the community. Two examples of this are given in figure 3; one showing a complaint about fly-tipping, the other advertising a community bicycle ride.
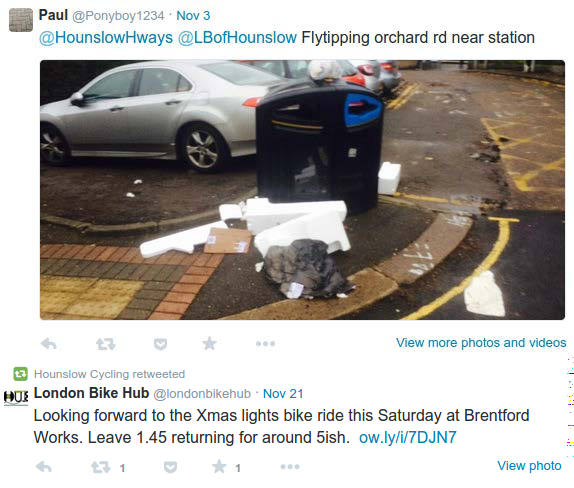 Figure 3: Examples of social media use in Hounslow
The community footprint, offline
The offline research captured the following people or resources for social support and trust (in decreasing order of magnitude) the local housing provider, Places for People; the local Citizen Advice Bureau; a range of local activist residents; local churches; online sources; local GPs and the Job Centre.
Respondents were further asked if there was anywhere they like to go that helps them feel part of the community. These community assets, and the connections between them and the respondents who mentioned them, can be visualised as a social network 'map' as in the image in figure 4:
 Figure 4: Social network map of the Cranford Estate in Hounslow using data collected in the offline research.
Comparing Online and Offline Data
The LocalNets.org software categorises nodes as events, people, organisations and places. These categories were treated separately, as the effectiveness of the process varied significantly between the categories.
Events
The digital asset mapping discovered 25 community events. Looking through the digital dataset with offline data revealed no matches between the two datasets. This is unsurprising since community events are not directly elicited in the survey. Additionally, during the digital coding process it's often hard to distinguish between a specific community event (‘The Goan Festival') and a generic event, which may have many, or no, local manifestations (‘Eid'). Generic events were not coded, reducing the tool's sensitivity in this area.
People
The digital asset mapping process discovered 72 people, a combination of private individuals on Twitter, bloggers, local councillors, religious leaders, the mayor, three local MPs (Mary Macleod, MP for Brentford and Isleworth, Seema Malhotra, MP for Feltham and Heston, and John McDonnell, MP for Hayes and Harlington), local football players and others. The comparison with the analogue dataset is problematic firstly because it is not possible to publish the names of the survey respondents due to data protection assurances given to research respondents, secondly because even if a name matches we cannot be sure it refers to the same person. However, one resident in the offline research referred to their local MP, Seema Malhotra.
Organisations and Places
Organisations and places are taken together because they yielded very similar results. The digital asset mapping found 168 locations and organisations in the Hounslow area.
The offline asset mapping found 51 relevant locations and organisations. Some items were excluded because they were too vague to match (‘football', ‘gym', ‘central london', ‘snakes & ladders', 'Kensington', 'local shops', ‘swimming', ‘zumba'), others were outside Hounslow and could not reasonably have been detected by the LocalNets (‘Kew', ‘Uxbridge', 'Park Royal Leisure Centre', 'Runnymede', 'Windsor Stables', 'Southwest Wimbledon Pentecostal Church').
20% of the assets mapped offline were picked up by the digital tool, with ten good matches between the two datasets. With a further six probable matches, it is reasonable to say that 31% of the place and location assets mapped offline were discovered by LocalNets. Additionally, another two assets were uncovered by LocalNets that were mentioned in the ethnography, 'Hounslow Community Foodbox' and ‘Hounslow Civic Centre'.
Matches are bound to be limited since the LocalNets.org web app looked at the whole of Hounslow, while the on-the-ground data focuses on the smaller area of Cranford, but a 31% rate of concurrence between the two approaches suggests that the LocalNets digital tool has validity in uncovering relevant local data, while at the same time supplementing this with a large volume of additional assets not mentioned in the offline research.
| Full matches | |
|---|---|
| Bedfont Sports FC | |
| The High Street | |
| West Middlesex University Hospital | |
| Hounslow Central Station | |
| Hounslow Heath | |
| Somali Community Centre | |
| Gurdwara Martindale Road | |
| West Thames College | |
| Osterley Park | |
| Feltham Swimming Baths | |
| Heathrow Airport | |
| Citizens Advice Bureau | |
| Food bank | |
| Jamia Masjid and Islamic Centre | |
| Hounslow Borough Council | |
| Church Meadows | |
| Hounslow Youth Club |
| Offline survey answer | Digital possible match |
|---|---|
| Canoeing | Bedfont Lakes (nearest canoeing location) |
| Brownie Pact | 3rd Hanworth Scouts |
| Heston School Basketball | Heston School |
| Job Centre | Hounslow Civic Center (houses Job Centre Plus) |
| Beavers Playgroup | Beavers Sports Lodge (houses playgroup) |
Conclusions
Did the LocalNets.org data appear valid?
The crossover between the two datasets gives us confidence that the types of community assets surfaced refer to real entities, and further investigation into entities that are not represented in the Offline dataset confirms their existence. However, it never seemed likely the LocalNets.org tool would return false positives.
The correlation also suggests that the LocalNets.org tool is able to discover assets that are salient to the community, and discussion with the on-the-ground researcher indicated that the data chimed with his experience of the area.
From this we conclude the data is broadly representative of some subsection of the activity within the Hounslow social economy.
Does the LocalNets.org data represent a useful approach to gather ‘below the radar’ data?
Overall, the study found that LocalNets.org software is an efficient way of collating hyper-local information about community activities and organisations in a given area. With further user interface development, it is possible that is could become a reasonably inexpensive way of gaining oversight into the below the radar activity in a local area as part of a social media analytics process.
The RSA research team recently conducted a series of focus groups about community and community mapping with stakeholders in other parts of the country where it has been running its "Connected Communities for Social Inclusion and Mental Wellbeing” research programme. The methodology for this programme is broadly similar to that used in the on-the-ground research in Hounslow. The stakeholders in these sessions stressed the benefits locally of door-to-door asset mapping and outreach, maintaining that since the research period these techniques have continued to serve as key ways of engaging with local residents. The benefits of such interpersonal engagement cannot easily be replicated with an automated digital tool.
However, the same stakeholders highlighted that the limitations of these approaches were the speed at which this information went out of date: given fluctuations in volunteer availability and the distribution of small funding pots, there is little guarantee that a group that is open one week will still be around a month or so later. It is here that using digital tools such as LocalNets potentially carries the most value, providing live, up-to-date information that makes use of local social media intelligence to provide a dynamic picture of local activity in the social economy, in a way that is more adaptable and less resource-heavy than the on-the-ground methods of door-to-door surveying and collaborative asset mapping.
How does the data collected by the digital tool compare to traditional offline approaches?
Events and private individuals are likely to constitute significant portions of the below the radar social economy, and it was difficult within the parameters of this particular study to compare these kinds of data between the two approaches, for the reasons outlined above. The pre-existing offline research did not specifically prompt for events, so very few were mentioned to compare with the online data, while assurances were made not to disclose the identities of individual participants in the offline research. We can disclose, though, that the handful of private individuals most active in the social economy who were found in the offline research did not appear in the LocalNets datasets. This is not surprising given the small number of these individuals and the isolated nature of the offline research site, which can be said in some ways to have a relatively under-developed social economy. The age profile of the individuals in question may also be of significance, and we cannot assume literacy in social media. The one clear match of an individual named person between the two datasets is a local MP; she was named only once in the offline research, suggesting that she is not especially central to the social networks in that locality, and as a Member of Parliament she cannot be said to be part of the 'below the radar' social economy in any case.
However, there was much greater overlap between the organisations and locations surfaced by the two research approaches, demonstrating the potential for the digital tool to discover similar data to the offline research. 31% of the organisations and locations mapped as community assets in the offline research were also discovered by the LocalNets web app. Whether these items can accurately be described as constituting the below the radar social economy, however, is open to question. Most of the assets included in both datasets - hospitals, parks, churches are well known to authorities and are key parts of the formal social economy rather than the below the radar one.
What the LocalNets data can provide, however, is a map of how these institutions engage with each other online – and it is this relational aspect of the social economy that is often below the radar, and one of the key benefits of LocalNets. The tool can produce up to date and locally valid assets maps, with some insight into how these instiutions interact with each other or do not - online.
Key benefits
- LocalNets.org provides an up-to-date list of community assets (including people, organisations, and events), with an emphasis on assets that are currently most salient in the community.
- Provides a network view of how those assets interact
- Less resource intensive than current approaches involving manual asset mapping.
- Can easily be combined with on-the-ground asset mapping; LocalNets.org can be primed with keywords that come from other asset mapping processes, and the output of LocalNets.org can be used as a starting point for deeper investigation.
Key Limitations
- Given the unbounded nature of online space, working in an area as small as a Lower Super Output Area brought some challenges.
- With a small sample of people, there is the possibility of misleading signals that are disproportionately visible.
- As with all techniques, some groups will be under represented (for example those who do not have access to the internet). However it should be noted that many community assets that do not themselves have a web presence are discovered because they are mentioned by others on social media.
Next steps
The RSA and RCA are continuing to test and refine LocalNets.org as a digital tool for mapping the below the radar social economy. This ongoing development encompasses:
- Increased automation. Currently the process requires manual intervention. While it may never be possible – or desirable - to make it wholly automatic, a new version of the software that decreases the amount of manual input and more improvement should be possible.
- Visualisation of the data in more informative ways
- Testing the software with community officers and other interested parties
The Department for Communities and Local Government (DCLG) is now collaborating with the RSA and the RCA to explore the potential of social media analytics to drive community action and, in particular, promote the take up of community rights. The next wave of research into the potential use of tools such as LocalNets.org will be used to identify nodes relevant to current or potential community activity in a local area. A series of interventions will be staged, and then a follow up evaluation will be undertaken to examine any changes to the sense of social inclusion and community empowerment for those affected.
Appendix: All nodes excluding people collected by Localnets.org
| 2000 Club Annual Sports & Funday | Event |
|---|---|
| Army in the park | Event |
| Back 2 Netball | Event |
| Brentford Fest | Event |
| Ealing Half Marathon | Event |
| Ealing Jazz Festival | Event |
| Eid | Event |
| Exercise 4 Everyone | Event |
| Feltham Fun Day | Event |
| Ganesh Chaturthi festival | Event |
| Goan Festival | Event |
| Inspire Hounslow Project | Event |
| Junior Cadet Summer Camp | Event |
| Lisa's Family Circuits | Event |
| London Mela | Event |
| Memory Cafe | Event |
| On Your Bike | Event |
| Osterley Parkrun | Event |
| Prakash Event | Event |
| Red Tractor Week | Event |
| Small Business Saturday | Event |
| The Big Dance | Event |
| The Big Iftar UK | Event |
| The Super Saturday road show | Event |
| X16 Programme | Event |
| Bedfont Lakes | Location |
| Bell Square Hounslow | Location |
| Boston Manor Park | Location |
| Chiswick Pier Trust | Location |
| Church Meadows | Location |
| Crane Park | Location |
| Cranford Community College | Location |
| Cranford Park | Location |
| Dukes Meadow | Location |
| Dukes Meadow | Location |
| Eastcote Cemetary | Location |
| Eastcote House | Location |
| Edward Pauling House | Location |
| Feltham Arena | Location |
| Feltham Pond | Location |
| Feltham shopping centre | Location |
| Greenham House Carehome | Location |
| Gunnersbury Park | Location |
| Hanworth Park | Location |
| Heathrow Airport | Location |
| Heston Community Centre | Location |
| Hounslow 'High Street Quarter' | Location |
| Hounslow Cemetary | Location |
| Hounslow Heath | Location |
| Hounslow High Street | Location |
| Hounslow Police Station | Location |
| Hounslow Youth Centre | Location |
| Inwood Park | Location |
| Isleworth Station | Location |
| Kingsley Park | Location |
| Lake Farm Country Park | Location |
| Lampton Park | Location |
| Marble Hill Park | Location |
| Market Place, Brentford | Location |
| Osterley Park | Location |
| Osterley Park | Location |
| Osterley Sports & Athletics Centre, | Location |
| Rainham Marshes | Location |
| River Crane | Location |
| St Helen's secondary school | Location |
| Tarbiyyah Primary School | Location |
| Turnham Common | Location |
| Twickenham Stadium | Location |
| 3rd Hanworth Scouts Group | Organisation |
| 4th Hounslow Scouts | Organisation |
| Beavers Sports Lodge | Organisation |
| Bedfont & Feltham FC | Organisation |
| Bedfont Lane Community Association | Organisation |
| BedfontFeltham | Organisation |
| Brabazon Community Centre | Organisation |
| Brentford Fountain Leisure Centre | Organisation |
| Bridge Link Community Centre | Organisation |
| CB Hub Multisports | Organisation |
| Cedars Youth and Community Centre | Organisation |
| Centre for Spirituality & Cultural Advancement | Organisation |
| Chiswick Riverside Greens | Organisation |
| Chiswick School | Organisation |
| Chiswick W4.com | Organisation |
| Civic Centre Hounslow | Organisation |
| Connexions Hounslow | Organisation |
| Crane Park Childrens Centre | Organisation |
| Cranford College PE | Organisation |
| Cranford Community College | Organisation |
| Cranford Council | Organisation |
| Cranford News | Organisation |
| Dome Badminton Centre | Organisation |
| Eastcote Lawn Tennis Club | Organisation |
| FCFKHounslow | Organisation |
| Feltham Band | Organisation |
| Feltham Community College | Organisation |
| Feltham Community Sports Hall | Organisation |
| Feltham Local | Organisation |
| Feltham Police | Organisation |
| Feltham Scouts | Organisation |
| Feltham Warriors | Organisation |
| FelthamBand | Organisation |
| FelthamShopping | Organisation |
| Get Active Hounslow | Organisation |
| Get West London | Organisation |
| Green Feltham Project | Organisation |
| Green Gym Hounslow | Organisation |
| GreenFeltham | Organisation |
| Grow Heathrow | Organisation |
| Gurdwara Sri Guru Singh Sabha, Hounslow | Organisation |
| Guru Nanak Sikh Academy | Organisation |
| HRCH_NHS_Trust | Organisation |
| Hanworth Air Park Leisure Centre and Library | Organisation |
| Harrow Churches Housing Association | Organisation |
| Harrow Food Bank | Organisation |
| Heston Community School | Organisation |
| Heston Community Sport Hall | Organisation |
| Hillingdon Borough Police | Organisation |
| Hogarth Health Club | Organisation |
| Holy Trinity Curch | Organisation |
| Hounslow Advice Centre | Organisation |
| Hounslow Badminton / Dome | Organisation |
| mpshounslow | Organisation |
| Hounslow Chronical DELETED | Organisation |
| Hounslow Chronicle | Organisation |
| Hounslow Civic Centre | Organisation |
| Hounslow Community Foodbox | Organisation |
| Hounslow Culture | Organisation |
| Hounslow Cycling | Organisation |
| Hounslow Green Gym | Organisation |
| Hounslow Green Party | Organisation |
| Hounslow HC (Hate Crime) | Organisation |
| Hounslow Heath NPT | Organisation |
| Hounslow Highways | Organisation |
| Hounslow Homes | Organisation |
| Hounslow Jamia Masjid and Islamic Centre | Organisation |
| Hounslow Leisure | Organisation |
| Hounslow Missing Persons Unit | Organisation |
| HounslowReTweet | Organisation |
| Hounslow Somali Community | Organisation |
| Hounslow Travel Active | Organisation |
| Hounslow Volunteer Centre | Organisation |
| HounslowHomes | Organisation |
| Indian Gymkhana HC | Organisation |
| Isleworth Leisure Centre and Library | Organisation |
| Isleworth Public Hall | Organisation |
| Isleworth Working Men's Club | Organisation |
| Keep Botwell Common | Organisation |
| Kingsley Academy | Organisation |
| LBofHounslow | Organisation |
| LBofHounslow | Organisation |
| Lampton Park Conference Centre | Organisation |
| Lampton Park FC | Organisation |
| Lampton School | Organisation |
| MPSHounslowSth | Organisation |
| Mo_tivators | Organisation |
| Mumsnet Hounslow | Organisation |
| OTB Dance Company | Organisation |
| Oak Hill Academy | Organisation |
| Osterley Park | Organisation |
| OsterleyNT | Organisation |
| Paul Robeson Theatre | Organisation |
| QPR Trust | Organisation |
| Radio JACKIE | Organisation |
| Reach Academy Feltham | Organisation |
| Rivers Academy West London | Organisation |
| Royal British Legion Hanworth | Organisation |
| SW London Environment Network | Organisation |
| Smallberry Green Primary School | Organisation |
| South Isleworth Children's Centre | Organisation |
| Sparrow Farm Residents Association Club | Organisation |
| TW13.net | Organisation |
| Team Hounslow AC | Organisation |
| Thameside Enterprise | Organisation |
| The Spot | Organisation |
| Treaty Centre Hounslow | Organisation |
| Watermans Art Centre | Organisation |
| West Middlesex Hospital | Organisation |
| West Thames College | Organisation |
| XXY Fitness | Organisation |
| Young Hounslow | Organisation |
| green feltham project | Organisation |
| hounslow community foodbox | Organisation |
| hounslowculture | Organisation |
| theheathlandsch | Organisation |
Footnotes
Reference List
Kretzmann, J. and McKnight, J. (1997) A Guide to Capacity Inventories: Mobilizing The Community Skills of Local Residents.Chicago Il:ACTA Publications
McKnight, John, and John Kretzmann (undated), via Raising Attainment for All: The Scottish Government at http://www.scotland.gov.uk/Resource/0045/00455927.pdf
Office of the Third Sector (2008) Draft Guidance: National Survey of Third Sector Organisations 'Under the Radar' Pilot. London: Office of the Third Sector.
Pathways Through Participation, (2010), Using Participatory Mapping to Explore Participation in Three Communities, at http://pathwaysthroughparticipation.org.uk/wp-content/uploads/2009/09/Using-participatory-mapping-to-explore-participation-in-three-communities_June-2010.pdf
-
Kretzmann, J. and McKnight, J. (1997) A Guide to Capacity Inventories: Mobilizing The Community Skills of Local Residents.Chicago Il:ACTA Publications ↩
-
McKnight, J. and Kretzmann, J via http://www.scotland.gov.uk/Resource/0045/00455927.pdf ↩
-
http://pathwaysthroughparticipation.org.uk/wp-content/uploads/2009/09/Using-participatory-mapping-to-explore-participation-in-three-communities_June-2010.pdf ↩
-
Office of the Third Sector (2008) Draft Guidance: National Survey of Third Sector Organisations 'Under the Radar' Pilot. London: Office of the Third Sector. ↩
