How to track innovative jobs in real time
 www.nesta.org.uk/blog/how-track-innovative-jobs-real-time/
www.nesta.org.uk/blog/how-track-innovative-jobs-real-time/
www.nesta.org.uk/blog/how-track-innovative-jobs-real-time/

Planners on the national, regional, and local levels have a never-ending appetite for data on employment in cutting-edge sectors of the economy.
That’s why recent months have seen the publication of three excellent and detailed research studies on the size and geography of the United Kingdom’s tech economy. 'Mapping Information Economy Businesses With Big Data', 'The Geography of The UK’s Creative and High–Tech Economies', and 'Tech Nation: Powering The Digital Economy 2015'. Taken together, the impressive depth and formidableness of these studies provides unparalleled insights into the nature of UK innovativeness.
However, by their nature, such benchmark studies are time-consuming, expensive, and bounded in many ways by the availability of government statistics and the need to pay for expensive surveys.
In our paper, 'A Low-Cost and Flexible Approach for Tracking Jobs and Economic Activity Related to Innovative Technologies', we propose a complementary approach to analysing the geography of innovation in the UK. Our approach, based on structured analysis of online help-wanted advertisements (want ads), produces low-cost, flexible and real-time estimates of innovative jobs by national, regional, and local levels.
This want-ad approach was first developed by South Mountain Economics as a way of estimating the number of 'App Economy' jobs in the United States. (Mandel, 2012; Mandel and Scherer, 2012). It does not replace the sort of large-scale benchmark studies cited above.

However, this estimation procedure uses publicly available want-ad data that is updated in real-time, and can be easily adapted to the particular and unique needs of individual economic development agencies or policy-making bodies. Moreover, the want-ad approach is very flexible and can be used to track the jobs and economic activity associated with almost any innovative growth technology.
In this paper, we develop the basic procedures for the want-ad approach. First we show how it can be used to estimate the distribution of IT occupations in the United States and the United Kingdom. For example, Figure 3 (from the paper) shows the close correlation between IT want-ads and IT employment by US states.
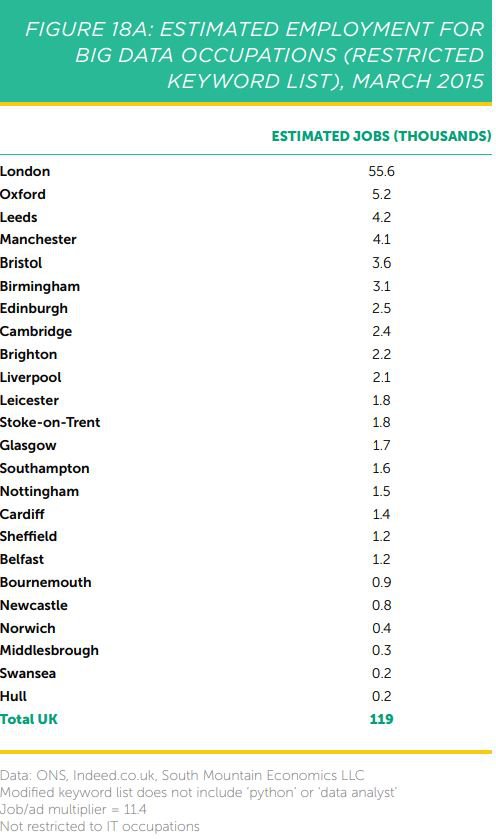
We looked at IT, big data, and medtech occupations in the United Kingdom. For IT occupations, the want-ad approach suggests that London has an IT employment of 316,000, while Manchester follows with an IT employment of 60,000. These accord well with the results of the Tech City UK study. We then look at the number and distribution of big data occupations in the United Kingdom. We use two different specifications of keywords, yielding estimates of 203,000 and 119, 000 big data jobs in the United Kingdom, respectively.
Figure 18A (from the paper) shows our estimate of the distribution of big data jobs in the United Kingdom, which are noticeably concentrated in London.
The study ends with a discussion of how the want-ad approach can be used as a low-cost methodology for tracking innovative jobs, even on a very local level. We suggest it should be in the tool kit of any economic planning agency.


