MAPPING INFORMATION ECONOMY BUSINESSES WITH BIG DATA
FINDINGS FOR THE UK
Max Nathan¹ and Anna Rosso² with Francois Bouet³
November 2014
Information and Communications Technologies – and the digital economy they support – are of enduring interest to researchers and policymakers. National and local government are particularly keen to understand the characteristics and growth potential of ‘their’ digital businesses. Given the recent resurgence of interest in industrial policy across many developed countries (Rodrik 2004, Aiginger 2007, Harrison and Rodríguez-Clare 2009, Aghion, Dewatripont et al. 2012, Aghion, Besley et al. 2013), there is now substantial policy interest in developing stronger, more competitive digital economies. For example, the UK's current industrial strategy (Cable 2012) combines horizontal interventions with support for seven key sectors, of which the ‘information economy' is one (Department for Business Innovation and Skills 2012, Department for Business Innovation and Skills 2013). The desire to grow high-tech clusters is often prominent in the policy mix – for instance the UK's Tech City UK initiative, Regional Innovation Clusters in the US and elements of ‘smart specialisation' policies in the EU (Nathan and Overman 2013).
In this paper we use novel, 'big data' sources to improve our understanding of information economy businesses in the UK - that is, those involved in the production of ICTs. We use this experience to critically reflect on some of the opportunities and challenges presented by big data tools and analytics for economic research and policymaking.
For policymakers, a solid understanding of these sectors, products and firms is necessary to design effective interventions. However, it is hard to do this using conventional administrative datasets and industry codes. Data coverage is often imperfect, industry typologies can lack detail, and product categories do not closely align with sector space. These challenges stem from the underlying fact that real-world features of an industry tend to evolve ahead of any given industrial typology.
The UK government is clear about the challenges here:
The information economy is a recognisable new dynamic force. At its core, it spans the familiar sectors of software, IT services and telecommunications services, and this is the definition we use ... However, the reach of the information economy is broader than this as it is constantly evolving and pushing into new areas ... Addressing the lack of clear and universally-agreed metrics will be an early priority for Government and industry. There will be a need for continual re-assessment of scope and definition of the information economy as it evolves.
BIS (2013) 'Information Economy Strategy.' London: BIS. p 11.
To tackle these issues we use an innovative commercial dataset developed by Growth Intelligence (hence Gi). Our data covers the entire population of active UK companies, and deploys an unusual combination of public administrative data, observed information, and modelled variables built using machine learning techniques. We use this off-the-shelf material to develop a novel 'sector-product' mapping of ICT firms. We also text-mine elements of the underlying raw data, in order to explore key sector-product cells. We run these analyses on a benchmarking sample of companies that allows direct comparisons of conventional and big data-driven estimates.
METHODOLOGY OVERVIEW
THE GI DATASET
Gi use layers of administrative data (from Companies House and other sources), plus modelled data from unstructured sources (such as websites and newsfeeds). Gi use machine learning to turn raw text into modelled variables about companies, such as industry sector and the firm's principal product/service.
BUILDING A BENCHMARKING SAMPLE
To compare estimates from SIC codes and Gi data, we build a benchmarking sample. We clean Companies House data, modelling for corporate structure, and keep observations where we have both SIC codes and Gi categories. We validate our sample against ONS and BIS administrative data.
COMPARING SECTOR AND SECTOR-PRODUCT ESTIMATES
We compare information economy counts based on SIC codes with those based on sector-by-product cells. SIC codes provide broad sector context: sector-by-product cells go further, allowing us to identify companies in information economy industries whose principal output is also a 'digital' product/ service. Gi coding may also be more accurate than SICs for company level data, since it draws on a richer range of sources.
MAPPING SIC CODES TO GI CODES
First, we take all the companies with SIC codes in the information economy, as defined by BIS. Second, we map the corresponding Gi sector and product categories. Third, we apply cleaning rules, dropping 'sparse' categories from our longlist and recovering any 'relevant' spare categories. Fourth, we create information economy sector-by- product cells by combining Gi sector and product information.
The differences are non-trivial: in our alternative estimates we find that the 'ICT production space' is over 42 per cent larger than SIC-based estimates, with at least 70,000 more companies. We also find employment shares over double the conventional estimates, although this result is more speculative. The largest sector-product cells are in information technology (sectors) and consultancy (products); text analysis suggests software, internet tools, system management and business/finance are particular strengths of companies in these cells. More broadly, ICT hardware, games, ICT-related engineering/manufacturing, telecoms, care and maintenance are key activities across the UK's ICT production activity space.
SIZE OF INFORMATION ECONOMY BY CLASSIFICATION TYPE: AUGUST 2012
A bar chart displaying the number of businesses based on two classification types.
* Estimates based on standard industry classifications (SIC): 158,810 businesses
* Estimates based on Gi sector product classifications: 225,800 businesses
ICT firms are slightly younger than non-ICT firms, with a slightly higher share of startups; while their average revenues are lower, on some measures revenue growth for ICT firms is higher than for their non-ICT counterparts. ICT firms employ more people on average than non-ICT firms (although median differences are much smaller). Patents and technology-orientated trademark holdings are higher for information economy businesses than for non-information economy firms, although the differences are not always statistically significant. Information economy businesses are highly clustered across the country, with very high counts in the Greater South East, notably London (especially central and east London), as well as big cities such as Manchester, Birmingham and Bristol. Looking at local clusters, we find hotspots in Middlesbrough, Aberdeen, Brighton, Cambridge and Coventry, among others.
PREVALENCE OF INFORMATION ECONOMY BUSINESSES BY GEOGRAPHY:* AUGUST 2012
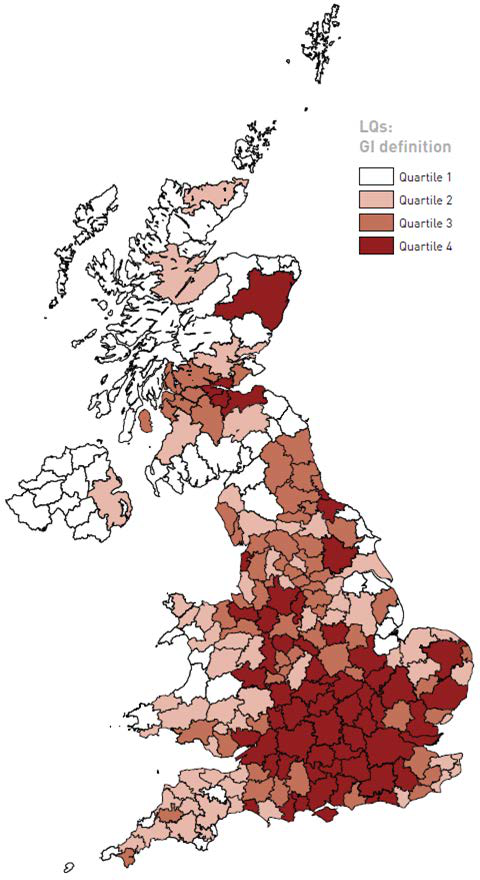
LQs: GI definition legend:
* Quartile 1
* Quartile 2
* Quartile 3
* Quartile 4
*Reporting location quotients for Travel To Work Areas (TTWAs).
We thus find a set of companies that is larger, more established and perhaps more resilient than popular perceptions. Our analysis also suggests diffusion of digital platforms and products out of computer hardware and software into other parts of the economy, notably business services and engineering/high-end manufacturing. This is consistent with specific industry studies (see e.g., Nathan and Vandore (2014)), and supports our case that big data can shine a light on real-world economic shifts that are moving ahead of current administrative data and classifications.
Our results are robust to multiple validation of the core dataset and a series of robustness checks. Some care has to be taken with the revenue and employment findings, since these derive from non-random sub-samples, but Gi is able to provide some workarounds for these (such as modelled revenue).
This proof of concept exercise highlights both affordances and limitations of big data-driven analysis. This is critically important for the research community and policymakers, as the use of non-traditional/unstructured sources, and scraping/mining/learning tools, is growing rapidly in the social sciences (Einav and Levin 2013, King 2013, Varian 2014). Enthusiasts point to huge potential in closing knowledge gaps, and taking research closer to the policy cycle. Sceptics highlight potentially limited access and relevance of these 'frontier' datasets.
Our experiences so far with the Growth Intelligence dataset also provides us with some valuable lessons on the pros and cons of using frontier data in an applied setting. The value of internet search data in forecasting settings is now fairly well-established (Choi and Varian 2012; Chamberlin, 2010). Gi data has excellent reach and granularity and, as we have shown, provides rich detail on fast-changing parts of the economy. Gi data has obvious potential for policymakers to use in mapping and tracking sectors and firms of interest, both nationally and at local level.
However, there are some constraints to big data sources and analytics that policymakers should bear in mind. Like other commercial products such as FAME, the Gi dataset is not free to researchers or analysts in government. Web and news-based information on companies is extremely rich but is not always comprehensive. The use of learning routines to generate probabilistic variables is ideal for exploring aggregate patterns in very large datasets, but can become noisy when researchers wish to look at smaller blocs of the data.
Together, these imply broader issues for researchers and policymakers. First, researchers should carefully consider the advantages and limitations of 'off the shelf' big datasets, and consider developing their own bespoke information as a complement (see for example Mateos-Garcia, Bakhshi and Lenel (2014) which constructs a bespoke big dataset to map the UK's video games industry). Second, government and universities need to develop researcher capacity to generate, as well as analyse, unstructured and other frontier data resources. Third, there is a clear need for secure sharing environments where proprietary and public data can be pooled, explored and validated. In the UK, the Secure Data Service provides one potential model for such a platform. Fourth, and linked to this, there is a need for structured partnership projects to incentivise researchers and data providers to work together.
The Gi dataset also suggests various avenues for future research. One is further exploring co-location and clusters. Another is to use modelled events as predictors of future observed behaviour. A third is to look at determinants of growth or lifecycle events. In the last two cases, the analysis would benefit from merging with administrative datasets such as the BSD. More broadly, this company-level data could be combined with worker-level information to explore how ICTs are changing patterns of labour use and workforce organisation.
REFERENCES
- Aghion, P., Besley, T., Browne, J., Caselli, T., Lambert, R., Lomax, R., Pissarides, C. and Van Reenen, J. (2013) 'Investing for Prosperity: Skills, Infrastructure and Innovation.' Report of the LSE Growth Commission. London: Centre for Economic Performance/Institute for Government.
- Aghion, P., Dewatripont, M., Du, L., Harrison, A. and Legros, P. (2012) 'Industrial Policy and Competition.' NBER Working Paper 18048. Cambridge MA: NBER.
- Aiginger, K. (2007) Industrial Policy: A Dying Breed or A Re-emerging Phoenix. 'Journal of Industry, Competition and Trade'. 7(3): 297-323.
- Cable, V. (11 September, 2012) 'Industrial Strategy.' Speech to Imperial College London.
- Chamberlin, G. (2010) Googling the Present. 'Economic and Labour Market Review.' 4(12): 59-95.
- Choi, H. and Varian, H. (2012) Predicting the Present with Google Trends. 'Economic Record.' 88: 2-9.
- Department for Business Innovation and Skills (2012) 'Industrial Strategy: UK sector analysis.' London: BIS.
- Department for Business Innovation and Skills (2013) 'Information Economy Strategy.' London: BIS.
- Einav, L. and Levin, J. D. (2013) 'The Data Revolution and Economic Analysis.' National Bureau of Economic Research Working Paper Series. No. 19035. Cambridge MA: NBER.
- Harrison, A. and Rodríguez-Clare, A. (2009) 'Trade, Foreign Investment, and Industrial Policy for Developing Countries.' National Bureau of Economic Research Working Paper Series No. 15261. Cambridge MA: NBER.
- King, G. (2013) 'Restructuring the Social Sciences: Reflections from Harvard's IQSS.' Cambridge MA: Institute for Quantitative Social Science.
- Mateos-Garcia, J., Bakhshi, H. and Lenel, M. (2014) 'A Map of the UK Games Industry.' London: Nesta.
- Nathan, M. and Overman, H. (2013) Agglomeration, clusters, and industrial policy. 'Oxford Review of Economic Policy.' 29(2): 383-404.
- Nathan, M. and Vandore, E. (2014) Here Be Startups: Exploring London's 'Tech City' digital cluster. 'Enviroment and Planning.' A 46(10): 2283-2299.
- Rodrik, D. (2004) 'Industrial Policy for the Twenty-First Century.' CEPR Discussion Paper 4767. London: Centre for Economic Policy Research.
- Varian, H. R. (2014) Big Data: New Tricks for Econometrics. 'Journal of Economic Perspectives.' 28(2): 3-28.
ACKNOWLEDGEMENTS
Many thanks to Tom Gatten, Prash Majmudar and Alex Mitchell at Growth Intelligence for data, and help with its preparation and interpretation. Thanks to Rosa Sanchis-Guarner for maps. For advice and helpful comments, thanks also to Hasan Bakhshi, Theo Bertram, Siobhan Carey, Liam Collins, Steve Dempsey, Juan Mateos-Garcia, Jonathan Portes, Rebecca Riley, Chiara Rosazza-Bondibene, Brian Stockdale, Dominic Webber and Stian Westlake plus participants at Google, NIESR, NEMODE and TechUK workshops. The paper gives the views of the authors, not the funders or the data providers. Any errors and omissions are our own.
This work includes analysis based on data from the Business Structure Database, produced by the Office for National Statistics (ONS) and supplied by the Secure Data Service at the UK Data Archive. The data is Crown copyright and reproduced with the permission of the controller of HMSO and Queen's Printer for Scotland. The use of the ONS statistical data in this work does not imply the endorsement of the ONS or the Secure Data Service at the UK Data Archive in relation to the interpretation or analysis of the data. This work uses research datasets that may not exactly reproduce National Statistics aggregates. All the outputs have been granted final clearance by the staff of the SDS-UKDA.
Nesta
1 Plough Place
London EC4A 1DE
[email protected]
@nesta_uk
www.facebook.com/nesta.uk
www.nesta.org.uk
November 2014
Nesta is a registered charity in England and Wales with company number 7706036 and charity number 1144091. Registered as a charity in Scotland number SC042833. Registered office: 1 Plough Place, London, EC4A 1DE.
Creative Commons Attribution-NonCommercial-ShareAlike (CC BY NC SA)




