Into the Gallery: how digital tech is changing art and design
 www.nesta.org.uk/blog/gallery-how-digital-tech-changing-art-and-design/
www.nesta.org.uk/blog/gallery-how-digital-tech-changing-art-and-design/
www.nesta.org.uk/blog/gallery-how-digital-tech-changing-art-and-design/

When you walk through a gallery, imagine if you could see the social network between the artists. Sometimes you can. As part of our exploration of the interface of art and tech, we’ve studied the social network of an online artistic community. This illustrates aspects of social networks and creative activity, but also some of the ways the digital revolution is changing art and design.
OpenProcessing is an online platform hosting a community who share sketches in Processing, an open-source programming language developed for visual designers and artists.[1] Writing code in Processing generates animated images, and on OpenProcessing people share the art and associated code with each other. The site was created by Sinan Ascioglu and provides an interesting example of an artistic community, revealing the networks produced by artistic education, creation and appreciation.
Three digital phenomena becoming more important in the arts
OpenProcessing embodies three important digital phenomena that are becoming more central in the arts:
The social networks of OpenProcessing
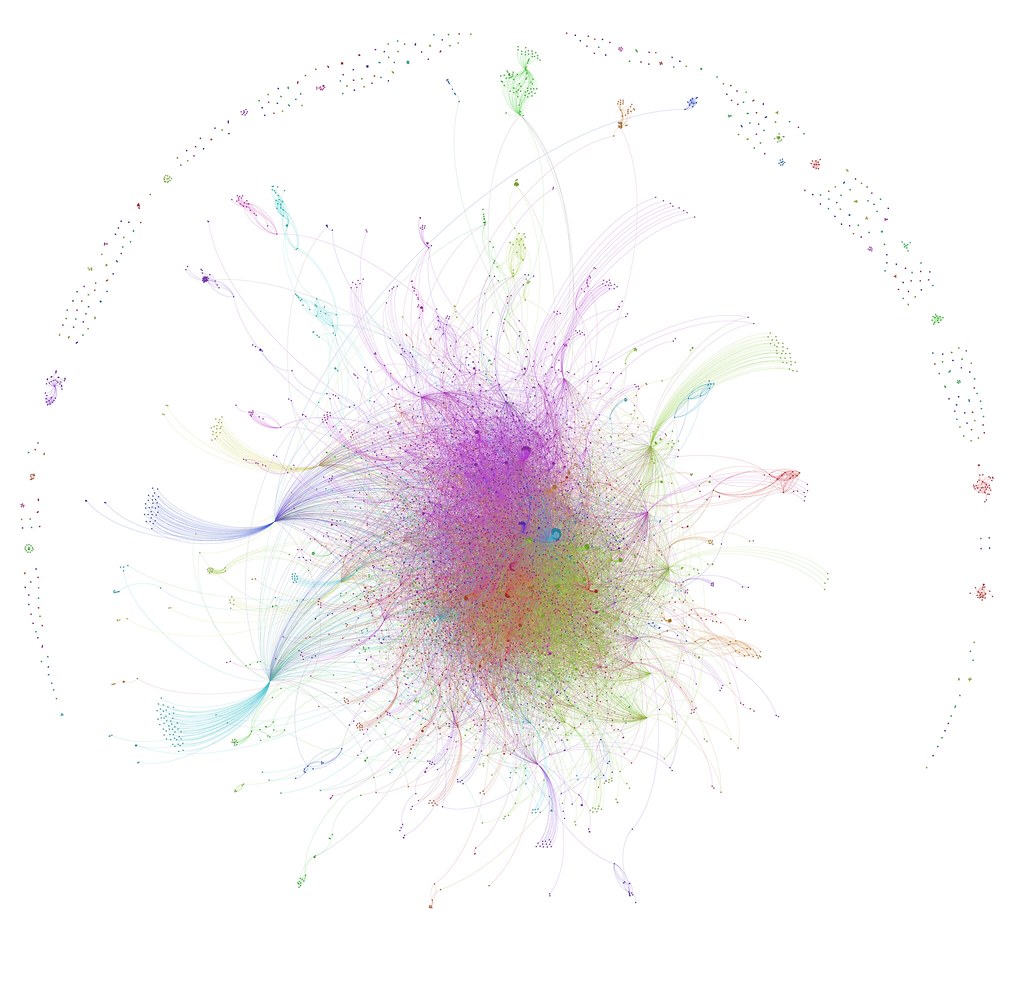
OpenProcessing also has social network functionality and the image above shows the connections between members of the community reconstructed from a large sample of the public website data.[5] The network is quite complicated, however we can use social network analysis to start to unpack things.
Firstly, let's look at the network’s overall structure. The diagram shows that although the platform’s social network consists of a series of disconnected networks, the bulk of members (84%) belong to the large inter-connected block in the centre (in social network terminology, these disconnected networks are called ‘components’, where every member of the component can be reached by following the links between members).[6] This is quite a general phenomenon in social networks; it can be shown mathematically that if people in the network randomly form connections at a certain rate, then a large component in which most people are connected to each other will form. [7]

What determines people’s positions in the network?
Its global structure aside, some individuals within the network will have more followers than others, i.e. they will be more central in the network, due to having a greater number of connections. The figure below shows how connectivity is distributed across the different members of the network with at least one follower. As the platform has a few people with a high number of followers, we transform the data by taking logarithms of it to make the chart less spread out (this has the effect of compressing the scale by making the larger numbers smaller). The scale starts at 0, which in log terms corresponds to one follower, whereas a value of 5 corresponds to over 500 followers).

The chart shows there are a small number of individuals in the network with high levels of connectivity, but that having a few connections in the network is much more common. One explanation for a skewed distribution of connectivity in social networks is that centrality in the network can become self-perpetuating, with people who are more central being more visible and therefore acquiring more followers, reinforcing their centrality.However, one might also expect that people who have produced more work on the platform had gained more followers. The figure below plots the number of a person's works on the OpenProcessing platform compared to their degree in the social network (both in log scale again).[8] Some of the points in the diagram will be representing multiple individuals who have the same characteristics.
The figure shows that people who had more works on the platform also tended to have a larger number of followers. It indicates that there is a broadly positive relationship between the number of works people had produced on the site and how well connected in the network they are – though this is not as strong as a first glance may suggest as there are greater numbers of people to the lower right hand side of the chart. The log scale also makes it look as if the people with more works on the site are not that different from those with fewer works, but in practice (because the scale is compressed) they have a lot more works.
There is also still a lot of variation within the relationship, which may well be explained by differences in the popularity of people’s works (as measured by, say, how many times it has been favourited, or registered adaptions of the code underlying the art (known as a 'tweak' on the platform), which could be analysed further.
Another factor likely to be affecting the platform’s network structure is the role of teaching. The picture below, which zooms in on part of the central cluster, shows that it contains groups of people all following specific individuals, but not otherwise connected to the main cluster. It seems plausible that these are students taking university classes in Processing who are following one person - their teacher (the picture’s colours are based on clustering individuals by their connectedness with groups more closely connected coloured the same).[9] For a more detailed study of the interactions between teachers and students, see this visualisation that Ascioglu has produced.

Three implications of the increasing importance of digital technologies in the arts
The growth and increasing pervasiveness of digital as means of creative production, distribution and consumption reflected in this post, probably has some associated implications:
1. The role of user experience (ux) and algorithms in the discovery of creative content is likely to increase in importance
A wide range of design decisions go into sites like OpenProcessing, for example the question of whether groups on the site should be open or closed and the role the site plays in how people discover and rate new content. Content discovery through social networks, search engines and automatic recommendation plays a key part in how many people now find creative content. Due to the volume of content being distributed online, these decisions are already often based on algorithms, be they derived from data on existing review scores, network structures or personal preferences.[10] As more and more creative content's success depends on the design of particular platforms and their algorithms, this already important area is likely to be an increasing focus in the creative industries.
2. Systematically understanding the conditions that stimulate creative activity will get more and more attention
Online platforms that are also creative communities allow us to study how the conditions of the platform affect the work that is created, in turn influencing site design. How we can understand the characteristics of the environments that make people more creative is likely to become an expanding area (and indeed was the focus of a recent Nesta report on Innovative spaces). This reflects the growing recognition of the importance of creativity, but also that the growth of data is making it easier to understand not just the effects of digital places, but also how we respond to physical places and events too.[11][12]
3. Data will become much more central in understanding aesthetics in art and design
The scanning of existing artistic content or its computational creation is generating data that can be used to study it directly, be it literary, musical or visual. For example, techniques developed from computer vision in machine learning can be used to study photographic data and we have recently seen work to develop measures of artworks' originality and influence from directly analysing the appearance of paintings and sculpture, and the study of trends in fashion from analysing catwalk and street photography.[13] The quantitative analysis of aesthetics and trends is likely to become much more important and affect not just the study of art and design, but ultimately creativity itself.
Thanks go to Sinan Ascioglu for allowing the use of OpenProcessing data in this post, to him and Lydia Nicholas for their helpful comments and to Zita Abila for her help with the post.
[1] Reas, C. and Fry, B. (2014), ‘Processing: A programming handbook for visual designers and artists’, 2nd ed. London MIT press.
[2] Broadbent, S, and Gallotti, M. (2015), ‘Collective Intelligence: How does it emerge?’.
[3] For an analysis of activity on 3D printing platforms see Mendis, D. and Secchi, D. (2015) ‘A Legal and Empirical Study of 3D Printing Online Platforms and an Analysis of User Behaviour’ Study 1, Intellectual Property Office (IPO).
[4] GitHub hosts all of the open-source projects listed in the previous paragraph.
[5] This relates only to public accounts on the platform. The data was accessed in August 2015.
[6] The social network analysis in this post was undertaken with R igraph package. The graph was produced with Gephi. Csardi, G. and Nepusz, T. (2006) ‘The igraph software package for complex network research. ‘InterJournal.’ Complex Systems 1695. Bastian, M., Heymann, S. and Jacomy, M. (2009) ‘Gephi: an open source software for exploring and manipulating networks.’ International AAAI Conference on Weblogs and Social Media.
[7] For more on this, see section 2.3 of Vega-Redondo, F. (2007), ‘Complex social networks’, Cambridge University Press.
[8] This includes only public sketches on the site. It is possible to host private sketches and accounts. However, these are not included in the analysis. Between 2008 and August 2015, 97,300 sketches have been added to the platform.
[9] The analysis was undertaken using the graph modularity algorithm in gephi. The algorithm partitions the graph of the network’s nodes into a set of communities (i.e. each community being a group of nodes) that aims to maximise modularity of the graph. The modularity being the number of connections that fall within communities for a given partition relative to the expected number of connections within the communities, if connections were generated at random. A community partition characterised by higher modularity is thus less likely to have arisen by chance.
[10] For a discussion for what is known to underlie some of these algorithms on the major internet platforms see. Chuang, M.(2012), ‘Networked Life’. Chapter 3 (Internet search), Chapter 4 (recommendations) and Chapter 5 (review aggregation).
[11] Creativity vs Robots. The creative economy and the future of employment.
[12] This theme of the effects of places on innovation is covered in the new Nesta report on Spaces for Innovation. Other recent works in this area both quantitative and qualitative include:
[13] Elgammal, A. and Saleh, B. (2015), ‘Quantifying creativity in art networks’, International conference on computational creativity. Vittayakorn, S., Yamaguchi, K., Berg, A. and Berg, T. (2015) ‘Runway to Realway: Visual Analysis of Fashion’.
Image credit: Openprocessing by John Davies via Flickr


