


Early Years Toolkit
This toolkit is designed for early years teams in local authorities across the UK. It lays out step-by-step how local authorities can use behavioural insights to boost the number of parents accessing childcare.
This toolkit has two aims: first, to offer ideas for increasing the number of parents taking up their entitlement for free childcare schemes. Second, to be a one-stop-shop with all the information that local authorities need to run their own randomised controlled trials (RCTs). In the past, we have heard that many local authorities find the prospect of running RCTs daunting, but with the resources in this toolkit they don’t have to be.
What is the problem we are trying to solve? We think that too few children get the opportunity to access the childcare available to them. Government support available to help parents with childcare costs has increased over the past decade, with the introduction of the 15 hour free childcare offer for disadvantaged 2 year olds in England in 2013, the Early Learning and Childcare expansion to 1,140 hours for all three and four year olds and eligible two year olds in Scotland in 2021 and through the Flying Start Scheme in Wales. But many parents are still missing out. Take-up of the 2 year-old offer has never been particularly high, peaking at 72% in 2018 in England, and disadvantaged children remain the group who are least likely to use childcare.
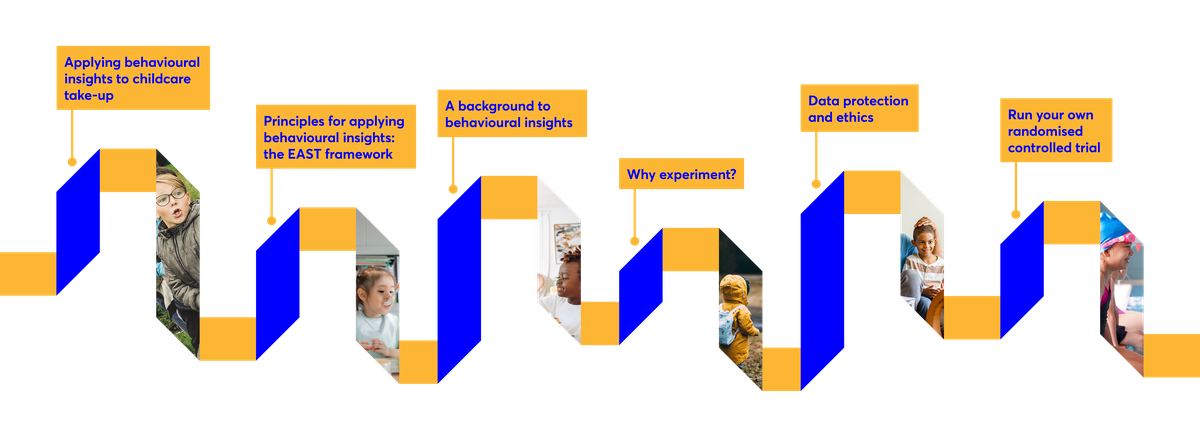
This toolkit includes:
How to use behavioural insights to increase take-up of childcare
- Applying behavioural insights to childcare take-up
- Principles for applying behavioural insights: the EAST framework
- A background to behavioural insights
How to run your own randomised control trial
- Why experiment?
- Data protection and ethics
- Run your own randomised controlled trial
- Step 1: Decide what outcome measure you are going to use
- Step 2: Make sure your experiment has statistical power
- Step 3: Randomise your participants
- Step 4: Implement the new process for the intervention group
- Step 5: Clean and merge your data
- Step 6: Understand how to analyse your results
- Step 7: Apply your results and scale
Covariates: Other factors (eg, age or gender) which are associated with your outcome measure. Called covariates because they vary with the outcome measure. You can adjust for covariates in your regression (although we do not explain how in this guide) – for example, looking at the impact of a new letter controlling for differences in age and gender between the control and intervention groups.
Data cleaning and merging: Preparing your data in a format that can be used for analysis. This includes deleting duplicates, ensuring outcome data is stored in units of 0 and 1, and merging outcome data with data on which group participants are in.
Effect size: A number measuring the strength of the relationship between two variables. In randomised controlled trials, it refers to the effect of your policy or intervention compared to the control group.
Intervention: A term for a policy change or communication (eg, sending a new version of the two-year-old letter). People who receive the policy or intervention are in the intervention group.
Intervention assignment (or intervention status): Whether a person is in the intervention group or the control group.
Intervention effect: The quantitative impact of the policy change or intervention (eg, a new version of the two-year-old offer letter increasing applications by five percentage points).
Null and alternative hypothesis: Hypotheses you generate as part of the process to test for statistical significance. The null hypothesis is always that there is no effect, eg, no difference between the two two-year-old offer letters. The alternative hypothesis is always that there is an effect, e.g. a difference between the two two-year-old offer letters.
Outcome measure: A specific, quantifiable measure used to assess whether your policy or intervention has been effective. The most common outcome measures in this field are applications for childcare and take-up of childcare.
P value: A number between 0 and 1 that represents the probability that the null hypothesis is true, given the data observed in the analysis. The conventional threshold for statistical significance is P values under 0.05 (5% probability).
Randomised controlled trials: A type of evaluation that is considered the most robust way to understand whether a programme, policy or intervention is effective. Participants in the trial are randomly divided into two or more groups – at least one receives the intervention and one is a control group. At the end, we can compare outcomes to precisely estimate the impact of the programme. Because the groups are randomly assigned, we can assume any differences between them at the end are because of the programme, and not another factor.
Sample size: The number of participants taking part in your study. A sample is drawn from a wider population, for example, of all the parents eligible for the two-year-old offer.
Statistical power: The probability that your study will be able to detect a statistically significant effect if the alternative hypothesis (see Null and alternative hypothesis) is true. We use statistical power calculations to work out how many participants you need in your study to detect an effect of a certain size.
Statistical significance: A result is statistically significant if it’s very unlikely to have occurred just by chance (a slight simplification: the technical definition is that it’s very unlikely to have occurred if the null hypothesis were true). The conventional threshold for statistical significance is a P value under 0.05.
Regression: A statistical process which gives us information about the strength of the relationship between two variables (e.g. homework time and exam results). We use regression as the main analysis tool for RCTs to understand whether our intervention is effective.
Regression coefficient: A value that quantifies the relationship between two variables, such as homework time and exam results. Specifically, it tells you how one extra unit of a variable (eg, one extra hour of homework) is associated with a change in the other variable (exam results). With RCTs, it can tell you how a difference in intervention assignment (whether one is in the control or intervention group) affects the outcome measure (eg, application rate); or more simply, the difference in application rates between the control and intervention groups.
95% confidence intervals: A range of values which show the uncertainty around regression coefficients (eg, uncertainty about the size of an intervention effect).
- Randomisation guides (Excel randomisation guide, Word randomisation guide)
- Data cleaning and merging guides (Excel data guide, Word data guide)
- Analysis guides (Excel analysis guide, Word analysis guide)
Video tutorials
- Introduction to RCTs
- Data cleaning and merging walkthrough video
- Power calculations walkthrough video
- Randomisation walkthrough video
- Analysis Walkthrough video
Sample letters
Applying behavioural insights to childcare take-up
Choosing whether to use formal childcare is a big decision for any parent. The way an offer is presented and advertised can make a big difference. And with take-up of the two year-old free childcare offer at just 62% in England in 2021, there is lots of scope for local authorities to boost the number of parents choosing to use it. This section provides ideas for how you can use the principles from behavioural science to do that, based on the Behavioural Insights Team and Nesta’s work with local authorities across the country.
An introduction to behavioural insights
A behavioural insights approach incorporates lessons from psychology and economics into policymaking.
Here’s a practical example. In 2017, the UK government introduced its flagship tax-free childcare scheme to replace childcare vouchers. Under the scheme, parents create a dedicated childcare account and receive a £2 government contribution for every £8 they pay in. In principle this is a generous subsidy, but in practice very few parents have taken advantage of it.
In 2018, the Behavioural Insights Team worked with HMRC to test out a series of different letters encouraging parents to take up the scheme. In one of the letters, a simple checklist of all the documents parents would need to apply was included, to reduce the hassle of the process ever so slightly. This increased the number of parents applying by 12%.

Applying behavioural insights to a two-year-old offer letter
In 2018, the Behavioural Insights Team worked with a local authority in England to increase the number of parents taking up the two-year-old offer. The focus was on the letter that they used to advertise the offer to parents.
Barriers to applying
We began by conducting interviews with parents to understand their perspectives on childcare in more depth. When we asked parents about their views on the letter, we heard about two main problems with it that deterred some parents from applying.
- Some thought the letter looked so formal that it could have been mistaken for a bill. This was off-putting, and prevented some parents from even wanting to open it.
- The letter was not very clear on what parents needed to do to apply, what information they would need and how long the process would take. The prospect that all of this could be a major hassle was enough to put some parents off.
What we did
With this feedback in mind, we set about re-designing the letter. We incorporated lots of lessons from behavioural science to produce an updated letter.
The main additions and changes we made were:
- A clear call to action. We put the main message (“Claim your free childcare today…”) at the very top of the letter and bolded it, so nobody could mistake the letter for a bill.
- Highlighting the exclusivity of the offer. We added a line emphasising that eligibility for the two-year-old offer is limited. This is based on a lesson from the world of advertising, that we tend to find products and services more attractive if we think supplies of them are scarce. A classic example is that sales of beans increased after a “max five per customer” sign was introduced.
- A social norms message. We told parents that they would be joining thousands of others in using the offer. Our aim here was to emphasise that using childcare was normal or even ubiquitous.
- A next steps checklist. We made it clear exactly what parents needed to do to apply, with a simple bullet pointed list to make the information easy to digest.
What happened when the letter was introduced?
We tested the updated letter in a randomised controlled trial against the ‘business as usual’ letter. The updated letter increased the application rate by about three percentage points, or by 9% in relative terms. If everyone in our study had received the updated letter, an extra 89 low-income parents would have received free childcare. This was not quite statistically significant (for an explainer of what we mean by this, see module 2) but it was a good starting point and warranted further testing.
The ‘golden ticket’ approach

Tweaks such as the changes to the two-year-old offer letter can be impactful. But they still assume a process in which parents receive an eligibility letter and then go through an application process. What about a system that takes out the parent application altogether?
That is what some local authorities across the country (including Newcastle, Dorset, Staffordshire, and Durham) have started to do with the golden ticket approach. These local authorities send parents an eligibility ticket rather than sending them a letter asking them to apply. All parents have to do is take the ticket to their chosen nursery or other childcare setting. This takes a good deal of the friction out of the process for parents.
The data so far suggests that the scheme is working well. Dorset County Council reported that take-up improved by six percentage points (from 81% in 2018 to 87% in 2019) when they introduced the scheme. More recently, some local authorities have scaled back the golden ticket because of new government data protection guidance that requires an eligibility check at some point in the process. Still, we think this is a really promising approach for increasing access to childcare.

The EAST™ framework
If you want to encourage a behaviour, make it Easy, Attractive, Social and Timely. These are four principles that can help you incorporate behavioural science into your policies and communications. The rest of this section contains examples of how the Behavioural Insights Team and Nesta have used EAST™ in our work in the past.
To learn more about applying EAST in your work, look at the full framework here.
Make it Easy
We are more likely to do something if it is quick, easy and hassle-free. Even small, seemingly irrelevant details that make a task more challenging or effortful can make the difference between us doing something and putting it off.
Some of the things you can do to make it easy are:
- Change the default. We are more likely to select the default or pre-selected option – for example, most of us never get around to changing the default settings on our phones.
- Minimise the hassle factor. Even something as simple as linking directly to a form, as opposed to a landing page containing the form, can considerably increase the number of people completing it.
- Simplify messages and instructions. Present the key information early, ideally at the top and distinguish it using colour or bolding. Keep language simple and cut unnecessary text.
Case study on switching defaults to boost engagement with EdTech
MemRi is a feature on HegartyMaths, an EdTech platform widely used by schools. MemRi uses retrieval practice – the process of practising familiar content every once in a while to keep students’ memories fresh.
Originally, MemRi was automatically set to being turned off and teachers needed to actively turn it on. We tested the effect of switching the default, so that all HegartyMaths users were defaulted into receiving the MemRi feature.
This simple change had a big impact. In the week after the change was introduced, the number of students with a MemRi goal rose by 42% and the number completing MemRi quizzes rose significantly too.

Make it Attractive
We tend to pay more attention to novel stimuli, things that are personalised to us and things that offer rewards. Do you know someone who buys everything with a reduced price sticker on it in a supermarket, even if it’s only a tiny discount? The way that the discount sticker acts as a simple visual cue to grab our attention helps to explain why.
When designing policies and services you can make it attractive by:
- Personalising. Simply adding someone’s name to otherwise generic text messages or emails tends to increase response rates.
- Attracting attention. We are more likely to engage with information that contains visually appealing stimuli (colour, images and bolding).
- Using rewards and incentives. These can be effective tools at encouraging a given behaviour, whether or not the reward is financial. In one previous study, offering a bag of sweets more than tripled the proportion of employees who donated a day’s wages to charity.
Make it Attractive: Case study on reducing no-shows at GP appointments
More than 15 million GP appointments are wasted each year because patients do not turn up or fail to cancel. On top of the disruption, this incurs costs of more than £200 million for the NHS every year.
The Behavioural Insights Team worked with the NHS to test out a range of pre-appointment reminder text messages designed to reduce no-shows. The most effective message, which warned patients that each appointment costs the NHS £160, reduced non-attendance by a quarter.


Make it Social
The social influences and networks around us often have profound influences on our behaviour. One reason why there is so much interest in community champions and peer mentors as a way of delivering public services is on the basis that we’ll pay more attention to information if it comes from someone within our network.
Some of the things you can do to make it social are:
- Emphasise that most people do the desired behaviour. Messaging that emphasises the ubiquity of a behaviour is widely used in advertising ("Join the millions already using our product"), and it can be effective in government communications too.
- Invite people to make a commitment. Commitments can lock us into a desired goal, as we have a strong impulse for consistency between what we’ve said we’ll do and what we actually do.
Make it Social: Case study on increasing tax repayments using social norms messaging
The Behavioural Insights Team worked with HMRC to test different letters encouraging taxpayers who file using self-assessment to pay their outstanding tax debts.
Just adding one sentence to the letters, informing recipients that 9 out of 10 people pay their tax on time, significantly increased the proportion of people paying off their debt.

Make it Timely
Timing is an important factor in shaping the way that people interact with public services. Sending prompts and reminders at the right moment can have more of an impact on behaviour than you might expect. Likewise, we can often nudge people into a behaviour by helping them plan the steps they need to take.
You can make your work more sensitive to timing by:
- Sending timely prompts and reminders. A study in the US found that simple text message reminders to appear at court reduced no-shows by a quarter.
- Emphasising the immediate costs and benefits. People tend to be present biased, in other words, more focused on what something means for them now than what it will mean for them in 10 years.
- Helping people to plan step by step. For example, asking people to jot down the date and time they will get vaccinated has been shown to increase vaccination rates.
Make it Timely: Case study on boosting student engagement with parent texts
The Behavioural Insights Team trialled a text message programme that sent parents timely prompts at key touchpoints. The information covered upcoming tests, whether homework was submitted on time, and what their children were learning at school.
Pupils whose parents received the texts improved maths grades by the equivalent of one month’s teaching. Feedback on the programme from pupils was also positive – although it might be annoying to be reminded, they felt it helped them to keep up useful study habits in the long run.

A background to behavioural insights
Imagine that you want to buy a subscription to The Economist. You can choose from the following three subscription options:
- Online subscription (£59.00)
One-year subscription to Economist.com.
- Print subscription (£125.00)
One-year subscription to the print edition of The Economist
- Online + print subscription (£125.00)
One-year subscription to the print edition of The Economist plus online access.
Which would you pick?
Whatever your views on the merits of reading on paper as opposed to screens, we expect that you did not choose option two. It’s not a great deal. Why would you go for a print-only subscription if it’s the same price as a print and online subscription combined?
When some researchers performed this experiment with a group of MBA students, this is what they found - most selected option three, and a minority selected option one. Nobody selected the print-only subscription.

What’s interesting is what happened next. The researchers also did a version of the experiment where they only showed participants two options: print & online (option three) and online only (option one). They found that the students’ preferences flipped, and many more chose the cheaper option.

What’s happening here is that our judgments are not just determined by how good or bad the subscription offer actually is. They are comparative choices, affected by the other alternatives available to us. The middle option in the first scenario (print-only) is acting as a decoy, which makes the print & online option look more appealing. It diverts our attention away from how much cheaper the online only option is.
What’s the lesson of this example? It’s that our choices, preferences and behaviour can be highly sensitive to context.
An introduction to dual systems theory
This example comes from a large body of psychology research about how we process information and make decisions. A key part of this research, and a foundation of behavioural insights approaches, is Dual Systems Theory, usually associated with the work of Nobel Laureate Daniel Kahneman.
Kahneman’s work divides the brain into two ‘systems’. We have a fast system (System 1), which operates automatically and effortlessly, and allows us to make quick decisions. We also have a slow reflective system (System 2), which is used for effortful mental activities. You could think of System 2 being what we use to learn to drive and System 1 as what we use to drive once we’ve learned.
We like to think of ourselves as operating in System 2 when making decisions – carefully weighing up pros and cons and deciding what to do. But what the research suggests is that in reality, we often make decisions with limited time or information, or based on snap judgments. This is System 1 thinking.
Designing for system 1 can lead to dramatic successes
In 2012, the UK Government introduced pension auto enrolment, meaning that if an employee did not want a workplace pension they needed to actively opt out. As a result, the proportion of employees with a workplace pension rose from 55% in 2012 to 87% by 2018.

Most people understand the importance of paying into a pension. But sometimes the perceived complexity of the decision can mean that they procrastinate indefinitely. Using System 1 thinking, people tend to stick with whatever the default option is and previously the default was not to have a workplace pension. This example shows how policies can be enhanced when we bear System 1 in mind.
It also brings us back to childcare. As it stands, most parents and carers need to proactively apply to receive a funded childcare place. Changing the default would be a good way to ensure more children are receiving the childcare they are eligible for.

Why experiment?
This section contains all the resources that local authorities need to run their own randomised controlled trials to increase childcare take-up.
Experimentation is very common in the private sector. Companies such as Google and Amazon regularly run online A/B tests to identify what works best on their platforms. It is not as straightforward to do this in government as it is on a website, but it is possible – especially when it comes to testing communications. Local authorities send out lots of letters and other communications. We think that they should be aiming to adopt a culture of regular experimentation, trying out different versions and seeing what works best.
In the first part of this module, we lay out the reasoning for why it is important to evaluate policy initiatives at all. The second section goes through the steps of how to do this in practice.
Randomised controlled trials (RCTs)
The most reliable way to know whether or not a policy initiative is working is to conduct a randomised controlled trial (RCT). They have been common for a long time in medicine and have become more popular in recent years as a way to evaluate government policies.
Historically, the most common way to evaluate a policy was just to implement it and then observe what happened. For example, you might introduce a new programme for unemployed job seekers and then measure how quickly they found work.

This approach has a lot of problems that mean that, at the end of the evaluation, you’re very unlikely to know whether or not the programme worked.
Problem 1: Factors outside your control affect your outcomes. For example, the number of people finding jobs is affected by the state of the wider economy. A sudden recession might make it seem like your policy is ineffective – even if it actually works well.
Problem 2: Selection bias. If you introduce an optional job training programme and compare outcomes for those who choose to use it to those who choose not to, you will get biased data. The people who use the programme are likely to be more motivated and engaged and they might have found jobs more quickly anyway.
The value of RCTs
Randomised controlled trials get around these problems altogether. In a trial, we take a group of people (to stick with the example above, unemployed job seekers) and randomly divide them into groups. One group gets the new job training programme and the other does not. At the end, we can compare outcomes to precisely estimate the impact of the programme. Because the groups are randomly assigned, we can assume any differences between them at the end are because of the programme, and not another factor.

Scared Straight is a programme designed to deter young people from crime. Participants in the programme see what prison is like by meeting serious offenders serving time. The hope was that, after this, the idea of a criminal lifestyle wouldn’t seem as appealing.
Several early studies of Scared Straight suggested positive results. But none of these studies had a control group showing what would have happened to participants if they hadn’t taken part.
When researchers began to conduct more rigorous randomised controlled trials, they found that Scared Straight wasn’t just ineffective – it actually increased crime compared to no intervention at all.

How to run your own RCT
Once you have identified a policy you want to test and decided who you want to test it with, there are 7 main steps to running a trial. This section goes through each of these steps in turn. Download the accompanying resources and work through them as you go.
- Step 1: decide what outcome measure you are going to use
- Step 2: make sure your experiment has statistical power
- Step 3: randomise your participants
- Step 4: implement the new process for the intervention group
- Step 5: clean and merge your data
- Step 6: understand how to analyse your results
- Step 7: apply your results and scale
Resources to run your own RCT
- Randomisation guides (Excel randomisation guide, Word randomisation guide)
- Data cleaning and merging guides (Excel data guide, Word data guide)
- Analysis guides (Excel analysis guide, Word analysis guide)
Data protection and ethics
When handling data about members of the public or making changes to service delivery, it is important to ensure that appropriate data protection procedures are followed, and any ethical considerations have been identified and addressed.
Data protection
Things to consider:
- Check that you are adhering to your organisation’s Data Protection Policy
- Ask your data protection officer to review your plans to check that they are compliant
Ethical considerations
When your project involves activities and data that are a routine part of your service delivery, then any associated ethical considerations are unlikely to be complex. It is, however, always important to think through ethical issues when you are setting up and running an experiment.
If you are trying out something completely new, or collecting more data than you would routinely use in the course of your day-to-day work, then there will be deeper ethical considerations to make, and it can be helpful to get some external advice or review.
Things to consider:
- Does your organisation have research governance procedures in place that you should follow? This may include ethical review.
- Are there any circumstances where additional consents from participants should be sought?
- Have you considered any implications for equality and diversity?
- Have you identified potential risks and mitigations?
- Have you thought about how to make your project design in keeping with standards for best practice (for example by following the advice in this toolkit!)
- Is there a designated person with responsibility for the project?
- It is best practice to record your thinking about the ethical issues that are relevant to your project as part of your project documentation. We’ve included an example below.
Resources
Equality Framework for Local Government (Local Government Association, 2021)
The Local Government Association has published a range of guidance and resources about the General Data Protection Regulation here.
British Educational Research Association guidance for research can be found here.
Example documentation of ethical considerations from a behaviourally informed letter trial:
There will be benefits to children if by changing the text of our standard letter we can encourage more parents to take up the childcare offer for 2-year olds. As well as benefits to individual children, there will be benefits for society if more disadvantaged children access high quality care. This project will help us find out how to do this best.
The risk of harm is minimal. Parents won’t give direct ‘consent’ to take part but they can reasonably expect to be contacted because we routinely send out invitation letters and monitor uptake as part of our statutory service delivery.
We will follow our organisational data protection guidelines when carrying out this project.
Considerations for families from protected groups: we will make sure that the planned changes to the letter are checked for culturally appropriate language and are inclusive of all family types.
We followed the guidance in the NESTA-BIT EY Toolkit to ensure our project is well-designed.
X has been nominated as project lead.

Step one: decide what outcome measure you are going to use
It is crucial to decide at the outset what outcome you are trying to achieve and exactly how you are planning to measure it.
This is important in part because it challenges you to think through whether and how you can actually collect the outcome data. It also protects the integrity of your trial. If you have decided on an outcome at the beginning, it can help with the temptation to look at several different outcomes and pick the one that looks most promising.
When conducting trials that test ways to improve childcare take-up, there are likely to be two options for your main outcome measure:
- Applications: Did a parent in the trial apply for a funded childcare place or not?
- Take-up: Did a parent in the trial actually take up a funded childcare place for their child or not?
Which outcome you choose will depend on the specific trial, your objectives and the data that is available.
Step two: make sure your experiment has statistical power
An introduction to statistical power
Statistical power is the probability of your study finding a statistically significant effect if one is really there. It is probably the most complex concept involved in this toolkit, but it is worth taking the time to understand because it influences one of the big decisions involved in any trial: how many participants you need to take part.
In order to understand statistical power, there are two other concepts that you need to be familiar with first:
- Sample size: how many people are in your study
- Effect size: how big an effect does your policy change have
There’s one other concept that is important too: statistical significance. This is discussed in detail in step six. For now, it is enough to know that it is about how confident you can be that the results of your study are real and not a fluke.
Key concept 1: sample size
Sample size means the number of participants taking part in a study. The general rule is that more is better and gives you more confidence that your result is reliable. It is often referred to using the letter N (so a study with 1,000 participants would be N = 1,000).
An intuitive way to think about it is to imagine a coin flip. If you flip a coin twice and it lands heads both times (N = 2), you wouldn’t think anything was strange. If you flipped it 100 times and it landed heads every time (N = 100), you would know the coin is biased.
You can also think about this using a visual metaphor. As the picture below shows, larger samples = clearer findings.

Key concept 2: effect size
The effect size refers to how big an effect your policy change has.
There are lots of different ways to express an effect size, depending on the study. For childcare take-up, the easiest way is in percentage points.
Module 1 discussed a previous Behavioural Insights Team project to increase take-up of the tax-free childcare scheme. In this trial, the behaviourally informed letter increased take-up from 3.4% to 3.8%. This is an effect size of 0.4 percentage points, or a relative increase of about 12%.
Both concepts influence statistical power
To return to the definition from earlier, statistical power is the probability of your study finding a statistically significant effect (we’ll come back to this concept in step 6) if one is really there.
Conventionally, scientific studies aim for at least 80% power:
- This means that a study has an 80% probability of finding a statistically significant effect if there really is an effect.
- For example, a trial comparing two two-year-old offer letters with 80% power would have an 80% chance of finding a statistically significant difference between them if one letter really was more effective than the other.
A key thing about statistical power is that it depends on both your effect size and your sample size:
- If you already know your sample size, you can use this to calculate the smallest effect size you are able to detect in your study – this is called your Minimum Detectable Effect Size (see the video below for instructions).
- If you already know roughly what effect size you are likely to find, you can estimate the minimum sample size you need in your study.
How do you know what effect size you are likely to find?
- The best way is to look at previous similar studies. Often we find that communications trials find impacts of around two or three percentage points, and this is a good place to start.
- Generally speaking, you should expect communications trials (eg, testing different versions of a letter) to have smaller impacts than more intensive and costly policy changes.
Calculating power for your study
You can conduct your own power calculations using an online power calculator. The video below walks you through how to do it.
Power calculations walkthrough
What if my sample size is too small?
When you conduct your power calculations, you might find that your sample is too small to achieve the kind of effect size you think is likely. For example, you might be limited by the number of parents eligible for the two-year-old offer in your area. This means your trial is underpowered and you are unlikely to find a statistically significant result.
This is a common problem, but there are two main things you can do:
- Run several waves of the trial, so that in total your sample size is large enough (if you do this you will need to do a statistical adjustment to reflect that there were several waves).
- Go ahead anyway as a pilot trial. This means you are unlikely to find a statistically significant result, but it might be worthwhile if the trial is low cost, there are few risks, and you are going to implement the policy in any case (eg, if it’s a letter you regularly send out). If you do this, it’s important not to put too much weight on findings that aren’t statistically significant.
Step three: randomise your participants
Randomising your participants can be quite straightforward once you know how. The main thing you need is a list of participants in a spreadsheet (either Excel or Google Sheets). You can use our randomisation guides (links below) to turn this into a randomised list.
In a simple trial, there are usually two groups: the intervention group exposed to your new policy, and the control group that gets the business-as-usual policy. However, there can be many more groups in complex trials testing out different changes against one another.
How to randomise
You can randomise a list of participants in three simple steps:
- Generate a random number for each participant
- Sort the random numbers in numerical order
- Categorise your list into control and intervention groups
We have produced two short guides to walk you through this process. You can download them below. Begin with the Word guide to explain the process, and then practice using the Excel guide:
You can also watch the short video below, which walks you through how to do it.
Randomisation walkthrough video
What to randomise?
At the beginning of your trial you need to decide the unit of randomisation. In the case of a trial looking at take-up rates of childcare within a local area, individual randomisation – randomising parents or carers to receive either the intervention or business-as-usual – is probably the most appropriate way to do it. But other trials will be different. For example, you could conduct a trial where children’s centres are the unit of randomisation; some children’s centres deliver a new intervention and some continue to deliver ‘business as usual’.
Step four: implement the new process for the intervention group
Once you have randomised your list, you are ready to start your trial.
The process of planning and implementing a trial will vary depending on what you’re doing. Complex trials testing out multi-part interventions can last for years (a recent evaluation of the Family Nurse Partnership programme was published 12 years after the first parents were recruited). But for trials involving changes to communications the process is much simpler and usually only requires small tweaks to existing processes. See below for a practical example.
Conducting your trial: a letter intervention
The diagram below gives an example of the process for a local authority testing out two versions of a two-year-old offer letter. In this trial the local authority uses Excel’s mailmerge function, but you could adapt this depending on the specific processes in your local authority.

Step five: clean and merge your data
Data cleaning and merging involves transforming your data into a format that’s ready to use for analysis.
It’s likely that the data you need for analysis is held in different places. You might have a spreadsheet with participants’ group assignments (whether they are in the intervention or the control group) in one place, and a spreadsheet of outcomes (eg, whether or not they applied for childcare) in another. Merging means ensuring that all this information is in one place. You may do something similar to this in your local authority already.
How to clean and merge your data
Cleaning and merging your data involves the steps below:
Cleaning
- Removing any duplicates
- Making sure all the variables (eg, parent names) are in the same format
Merging
- Decide which variable will be used for merging
- Clean the merging variable in both datasets, if you haven’t already
- Perform the merging itself
- Check that everything worked as expected
Re-coding your variables
- Transform verbal variables like ‘Applied / Did not apply’ to 0s and 1s for Excel to use for analysis.
We have produced two short guides to walk you through this process. You can download them below. Begin with the Word guide to explain the process, and then practice using the Excel guide:
You can also watch the short video below, which walks you through how to do it.
Data cleaning and merging walkthrough video
Step six: understand how to analyse your results
Once your data has been cleaned and formatted correctly, you’re ready to analyse it.
You can find a video and a written guide below to walk you through the process of analysing your data step by step. There are two important concepts you’ll need to know for your analysis – statistical significance and regression. Most of the section is dedicated to explaining these. If you already feel familiar with them, feel free to skip straight to the analysis.
Conducting your analysis in Excel
Analysing your data involves the following steps:
- Conducting your regression analysis
- Generating your results graph
We have produced two short guides to walk you through this process. You can download them below. Begin with the Word guide to explain the process, and then practice using the Excel guide:
You can also watch the short video below, which walks you through how to do it.
Analysis Walkthrough video
Statistical significance: a primer
We usually study a sample to estimate the likely effect of our policy on a wider population. For example, we might test a new policy for increasing childcare take-up with a few thousand parents to estimate how big an impact it would have on all the parents eligible for free childcare.
Because of chance, every sample you take will be slightly different. If you take lots of different samples of parents, each sample is likely to have slightly different rates of childcare take-up.
Imagine that the actual rate of take-up of childcare was 75%. If you took lots of different samples and plotted them on a graph, the graph might look something like this:

This natural randomness generates some uncertainty when you introduce a policy change. In this example, if you ran a trial and one version of your policy resulted in 76% rather than 75% take-up, it might be that your change made a small difference – but given the natural randomness, this might just be down to chance.

The bigger the change, the less likely it is to just be down to chance. If your change resulted in 82% rather than 75% take-up, that’s unlikely to be due to chance.
That is the basic idea behind statistical significance. A slightly simplified definition is that a result is statistically significant if it’s very unlikely to have occurred just by chance.
Testing for statistical significance
There are three main steps to find out whether a result is statistically significant:
- Set up a null hypothesis. This is always the hypothesis that you haven’t found anything. For example, that there is no difference between your control group and your intervention group. We always assume the null hypothesis is true until proven otherwise – equivalent to innocent until proven guilty in a court case.
- Set up an alternative hypothesis. This is the opposite of the null hypothesis – for example, that there is a difference between your control group and your treatment group. It’s equivalent to a guilty verdict in a court case.
- Calculate the probability of getting the results from your study if the null hypothesis was true.
The final stage of the process gives you a p value, or the probability of getting the effect from your study if the null hypothesis was true. This is a number between 0 and 1, which is equivalent to a percentage between 0% and 100%.
The conventional threshold for statistical significance is p = 0.05 or lower. This means we say a result is statistically significant if there is a 5% probability or less that it could have occurred by chance, if in reality, there really was no effect.
The analysis video and guide below will walk you through these stages in practice and teach you how to calculate the p value for your study.
A few things about p values to bear in mind
- Even if your result looks positive, if it isn’t statistically significant it might have happened by chance and shouldn’t be thought of as reliable evidence.
- The statistical significance threshold is slightly arbitrary. It’s important to have a threshold in place so that everyone is on the same page, but there isn’t really that much difference between a p value of 0.049 (significant!) and 0.051 (not significant).
- Statistically significant doesn’t mean significant in practice. If you have a big enough sample size, a result can be statistically significant but practically negligible.
Regression: a primer
Regression is a statistical technique that you can use to analyse the data from your trial. It lets you estimate the strength of the relationships between different variables. Importantly for our purposes, it automatically produces a p value and tells you whether your results are statistically significant.
Imagine that you want to study the link between two different variables – for example, homework time and exam results in a school. You could plot how much homework time each student does and their exam score on a graph like this.

You can draw a line that captures the relationship between the two variables. Here, the line slopes upwards which means that students who do more homework tend to get better exam results (although note that this doesn’t mean homework causes better exam results – just that they are linked in some way).

The steepness of the line tells us how strong the relationship is. A steeper line would mean that every extra hour of homework is associated with a bigger boost in exam results.
Regression looks at data like this and determines how much a change in one variable is linked to a change in the other. In this example, it tells us what exam result change is associated with one extra hour of homework.

Now let’s switch examples. Let’s imagine that you’re looking at the relationship between exam results and extra tutoring. There are two groups – one that gets extra tutoring and the other that doesn’t. As above, each student is represented by a single blue dot. You can plot their exam results on another graph like this.

Just like the first example, you can draw a regression line which calculates the relationship between the two variables (exam results and whether or not the students receive tutoring). You can think of the regression line as telling you the average impact of getting tutoring compared to not getting it.

This is exactly how you can use regression to analyse your trial data. The regression analysis will calculate the impact of your policy change, just like in the example above it tells you the impact of the tutoring on average.
Why do you need to do this?
You might ask why you need regression at all. Can’t you just compare take-up between the groups in your trial and see which one is higher?
In fact, you can do this. But regression has three big advantages, including one big practical advantage when conducting your first trial:
- Regression automatically calculates your p value and tells you whether your result is statistically significant.
- In more complex trials, regression allows you to control for other factors that might affect the outcome (eg, the relationship between exam results and homework, controlling for gender and school type).
- Regression is more versatile and can deal with different types of outcomes. Again, this is an advantage for more complex trials.
Step seven: apply your results and scale
The final step in the process of running a trial is working out what to do with the results.
An effect size (for example, a two percentage point increase in take-up) isn’t always the easiest thing to interpret or communicate to others. What we really want to know is the impact in meaningful, real-world terms.
Translate your results into meaningful impacts
Let’s imagine that you’ve tested a new two-year-old offer communication and observed a three percentage point increase in take-up. What does this mean in practice?
Go through these three steps to translate your results into a meaningful long-term estimate of impact:
- Develop some assumptions
- Estimate the overall impact
- Calculate the costs and benefits
The very final stage of the process is deciding whether or not to implement your intervention in the future or not. Whether or not you have a statistically significant result will play a big role here, but it is not the only consideration.
Some other questions to consider are:
- What was the effect size? Is it meaningful in practice?
- Are the benefits of the intervention worth the costs?
- What feedback did we get from parents and staff about the new process?
- Can we make any further tweaks to make it more effective?
- Do we need to test it further to make a decision?