


The drivers of change shaping the future of US and UK employment and the need for different skills
To prepare our children and those already in employment for the world of work in decades to come, we need to better understand what that future is going to look like, what skills, knowledge and attributes will be important for success.
We know that many of the jobs around today will likely be changed beyond recognition by global trends.This makes it all the more important that we set learning priorities for young people today based on a rigorous assessment of what will be required of them when they enter the workforce, rather than relying on what we know about the current labour market.
These are the goals of an ambitious research project predicting the skills mix required of the workforce in 2030 that Nesta is undertaking in collaboration with the education provider Pearson, and in partnership with with Associate Professor Michael Osborne at the Oxford Martin School and independent researcher, Philippe Schneider. We will shortly be publishing the full results of this study as well as policy recommendations later this year.
As part of this project, we have looked at a number of major global trends, or drivers of change, that have important implications for the future of work and skills, presented here as a trends slide deck. This slide deck was used to inform a key part of the research, two foresight exercises in the UK and USA, where it helped enable a discussion of the workforce implications for occupations of these trends and their interactions, and ground it in hard evidence.
While much of the recent debate around the future of work has focused on the impact of automation and technologies like machine learning, the picture is considerably more complex and uncertain. Automation is just one of a number of technology trends - such as biotechnology, nanotechnology and the Internet of Things - that will have profound implications for the composition of the workforce.
Technological change in turn is just one of multiple global trends that will impact on employment. Consider the ageing population, climate change, urbanisation and rising income inequality - each of which will have important sectoral implications.
This slide deck sets out seven major trends that will shape the future of the UK labour market and skills needs by 2030.
1. Technological Change
- Automation
- Technological progress and job creation
- Adoption and diffusion
- Digital technologies
- Sharing economy
- Internet of things
- Hardware and materials
- Biotechnology
2. Globalisation
- Unwinding trade imbalances
- Peak globalisation?
- The importance of place
- Specific trade opportunities
- Growing global middle class
3. Demographic Change
- Ageing population
- Macroeconomic impacts
- Sector impacts
- Millennials
4. Environmental sustainability
- Impact of climate change
- Transition to low carbon economy
5. Urbanisation
- Latest wave of urbanisation
- Growing demand for infrastructure
6. Increasing inequality
- Inequality and its drivers
- Macro and microeconomic impacts
7. Political uncertainty
- Economic impacts of uncertainty
- Rising political uncertainty?
- Drivers of policy uncertainty
What’s next?
Shortly we will be publishing the full results from the research project, exploring which skills, knowledge and attributes are going to be important to the UK and US workforces in 2030.
Foreword
Given recent debates about automation and the future of work you'd be forgiven for thinking the job of policymakers was easy: governments should simply upskill workers to move from routine-intensive occupations in manufacturing and services that will be automated in the future to those that are not. However, the picture is considerably more complex and uncertain: not least because automation is just one of a number of technology trends - such as biotechnology, nanotechnology and the Internet of Things - that will have profound implications for the composition of the workforce. And technology change in turn is just one of multiple global trends that will impact on employment. Consider the ageing population, climate change, urbanisation and rising income inequality - each of which will have important sectoral implications.
As part of an ambitious study predicting the skills mix required of the workforce in 2030, in late 2016 we held two foresight exercises in the UK and the USA. We brought together a group of leading domain experts, and asked them to reflect on the implications of global structural change in all its forms for the future labour market. Their task was to provide the human intelligence needed to train a machine learning algorithm that predicts the future demand for individual occupations. To enable a discussion of the workforce implications of these trends and their interactions, and to ground it in hard evidence, we produced a global trends slide deck, which we are publishing today. The positive reaction we received made us realise that we had produced a resource that could be of independent value in informing strategic labour market planning, whether that is in policy, education or business. We'd very much welcome your feedback.
Hasan Bakhshi, Executive Director, Creative Economy and Data Analytics, Nesta
Predicting the future of work is one of the most exciting - and difficult - areas of research within education today. The implications of changing demand for particular skills on our education systems are enormous. This is why I was delighted to be a part of the foresight exercise to determine the changing demand for skills.
The discussions were rich and sophisticated, in large part because of the quality of the thought leaders convened. The discussion was made richer still because we were provided with what you now have: a rigorous catalogue of the trends that will shape the future of work.
Our aim in sharing this set of insights is twofold: one, to make visible as much of the research process as possible, and two, to provide you with insights that you can apply, build on, and, of course, critique.
I hope you will share my excitement for the eventual results of this research. Given that learners who are starting formal education now will be graduating into jobs in 2030, the implications of this work for learning are far reaching--meaning action is needed not in some distant future, but today.
That's why we think the future of jobs is one of the most important conversations in education.
Amar Kumar, SVP Efficacy & Research, Pearson
Technological change
Automation: force for job destruction or creation?
Historically, over optimism about potential of new technology has sat alongside fears about impacts on jobs
- Perennial fears about impact of technology, particularly automation, on employment (especially in times of economic stagnation) (Mokyr et al., 2015).
- At the same time, predictions about future pace of technological change, especially artificial intelligence, repeatedly over-optimistic (Armstrong et al, 2014).
- Jobs and skills composition of workforce have changed only gradually over time (Handel, 2012).
- Most dramatic historical shift was from agriculture to industry rather than ICT-driven transformation.
This newspaper headline is from the New York Times in 1928

Jobs are a complex bundle of tasks, many of which are complementary with technology
Going forward
- Estimates of impact of future automation vary. Frey and Osborne (2013) estimate 47 per cent of US employment at risk.
- In contrast, using task-based analysis, share of automatable jobs estimated at 9 per cent (Arntz et al., 2016).
- For other jobs, specific tasks may be automatable but separating these from other tasks may also create coordination costs.
- For example, lawyers carry out document reviews which could be automated in some contexts, such as discovery but they also perform factual investigation, client advice, legal writing and negotiation which are harder to automate. Technology will also be complementary with some types of labour and amplify comparative advantage of human ability. For example, possible roles in marketing.
| How to add value | Example | |
|---|---|---|
| Step up | You may be senior management material - you’re better at considering the big picture than any computer is. | A brand manager orchestrates all activities required to position brand successfully. |
| Step aside | You bring strengths to the table that aren't about purely rational, codifiable cognition. | A creative can intuit which concept will resonate with sophisticated customers. |
| Step in | You understand how software makes routine decisions, so you monitor and modify its function and outputs. | A pricing expert relies on computers to optimise pricing on a daily basis and intervenes as necessary for special cases or experiments. |
| Step narrowly | You specialise in something for which no computer program has yet been developed (although theoretically it could be). | A wrap advertising specialist has deep expertise in using vehicles such as mobile billboards. |
| Step forward | You build the next generation or application of smart machines - perhaps for a vendor of them. | A digital innovator seizes on new way to use data to optimise some key decision, such as cable video ad buys. |
Source - Kirkby and Davenport (2016)
Organisational and job design affects whether technology complements or replaces labour
Routineness and susceptibility to automation are not inevitable features of occupations.
Job and organisational design important too: Even seemingly routine jobs can be designed in ways that permit and reward creativity, judgment and commonsense (Hendel and Spiegel, 2014).
Share of jobs with high performance work practices (HPWP) and mean HPWP score
High performance work practices include: * Autonomy * Task discretion * Collaboration * Mentoring * Job rotation * Application of new learning
In the UK, task discretion fell sharply in 1990s and remained flat since 2001 (Inanc et al., 2013).
Task discretion in UK workforce, 1991-2012
Technological progress and job creation
Technological progress gives rise to entirely new occupations and sectors
US employment growth faster in occupations with more novel tasks Evidence from the US: In 1990, 8.2 per cent of US workers employed in occupations not catalogued in 1977.
More recently, this has decreased: (See chart on 'Employment growth by decade plotted against the share of new job titles')
- In 2000, only 4.4 per cent of workers in jobs not catalogued in 1990.
- In 2007, <0.5 per cent of workers in jobs not catalogued in 2000 (Berger and Frey, 2016).
In parallel, stark reversal in demand for high skill occupations in 2000s, notwithstanding growth in the supply of high education workers (Beaudry, Green and Sand, 2016).
Employment growth by decade plotted against the share of new job titles
Source - Acemoglu and Restrepo (2016). Methodology based on Lin (2011) which uses data on new occupational titles from revisions to the census occupation classification system.
Even in cases where technological change destroys jobs, it triggers offsetting market adjustments
- Lowers production and distribution costs and therefore prices for some goods and services, stimulating aggregate demand. (See chart on 'Labour time needed to buy selected US Products, 1908-2014')
- Surplus income can be spent on healthcare, education and arts - 'cost disease' sectors that are resistant to automation and have consequently experienced sharply rising costs but demand for which is typically raised by growth in purchasing power. (See chart on 'Growth of real health spending and GDP per capita (2000-2015)' )
- By helping to grow market, introduction of ATMs in 1970s actually boosted employment of human tellers in US even though number of tellers per branch fell (Bessen, 2015).
- Moretti (2010) estimates that each job created by US high-tech sector created five additional jobs through multiplier effects - higher than other industries. For European evidence, see Goos et al., (2015) and Gregory et al., (2016). (See chart on 'Number of additional nontradable jobs created by sector (US)')
Technological change
Technological progress and job creation
Labour time needed to buy selected US Products, 1908-2014
A line chart showing the number of minutes or hours of labour time required to purchase various US products from 1908 to 2014. Products include Eggs (1 dozen), Milk (1/2 gal), Woman's Haircut, NY to LA Flight, Dishwasher, and Car. Most items show a significant decrease in labour time required over the century, except for a Woman's Haircut which increases towards 2014, and Car which shows complex changes.
Source – Blackrock Investment Institute (2014). Calculations are based on US prices divided by average manufacturing wages (excl. taxes and benefits).
Growth of real health spending and GDP per capita (2000-2015)
A scatter plot showing the relationship between growth in real health spending per capita and growth in real GDP per capita for various countries from 2000-2015. Countries like Latvia, Slovak Republic, Poland, and Estonia show higher growth in both, while Portugal, Greece, and Italy show lower or negative growth. A diagonal line indicates a general positive correlation.
Source – OECD
Number of additional nontradable jobs created by sector (US)
A bar chart showing the number of additional non-tradable jobs created by sector in the US. The "High-tech sector" shows the highest number (4.9), followed by "Tradable skilled sector" (2.5) and "Tradable nondurable goods sector e.g food" (1.9). "Tradable Sector" is 1.6, "Tradable durable goods sector e.g cars" is 0.7, and "Tradable unskilled sector" is 1.
Source – Moretti (2010) Note: Skilled sector represents workers with college education or greater.
Adoption and diffusion
Are adoption lags decreasing?
- Evidence of accelerating consumer adoption. However, PCs, Internet, smartphones and music streaming services based on similar underlying technologies and infrastructure leading to lower learning and switching costs. (See chart on ‘US technology adoption rates (1900-2014)’)
- Slower productivity growth suggests business adoption not as fast. OECD (2015) argues that problem lies in ‘diffusion machine’ not slowing of innovation by most advanced firms.
US technology adoption rates (1900-2014)
A line chart showing the adoption rates of various technologies in the US from 1900 to 2014, as a percentage of households or per capita. Technologies include Telephone, Electricity, Autos, Radios, Color TVs, VCRs, Computers, Mobile Phones, Internet Access, and Smart Phones. The chart illustrates S-curve adoption patterns, with newer technologies generally adopting faster than older ones.
Source – Blackrock Investment Institute (2014) (Adoption rates are based on household ownership except for cell phone and smart phones, which are based on ownership per capita.)
Any number of microeconomic reasons why new technologies take time to diffuse
- Behavioural reasons: potential losses tend to loom larger than potential gains. Value of new technologies lies in scope for long- rather than short-term improvement.
- Organisational reasons: including need for complementary investments in management structures, incentive schemes and skills. Weaknesses in management practices may further prevent the trickle-down of innovation (Haldane, 2017).
- Labour market institutional reasons: Unions may be sceptical about new technologies, fearing headcount cuts. (See Chart on ‘Trade union density’) But reality is more complex. It has been suggested that countries with more regulated labour markets typically see less union resistance, in contrast to countries like UK and US with higher labour market flexibility (Doucouliagos and Laroche, 2012).
Adoption is also affected by wages which are endogenous e.g., automation might lead to falling wages making further substitution of capital for labour less attractive.
Trade union density by industry in UK (2015)
A horizontal bar chart showing trade union density by industry in the UK in 2015. Industries with highest density include Education, Public administration and defence, compulsary social security, and Electricity, gas, steam and air conditioning supply (all above 40%). Agriculture, forestry and fishing has the lowest density.
Source – BIS (2015)
And there are macroeconomic barriers to diffusion too
-
Strong societal preferences: concerns about safety and growing power of Monsanto in 1990s led to bans on cultivating GM crops in almost 60 states, against advice of scientists. Autonomous vehicles face challenge of how to distribute liability in case of accident (e.g. algorithmic morality).
Public may also put special weight on ideals and values of certain occupations. (See pages 76, 84) For instance, lawyering is deeply rooted in, and essential for, rule of law; nursing and caring entails respect for dignity and autonomy of patient - features which might be lost with greater use of technology. 2. Fast growth can lead society to value safety over further growth. New technologies, while raising growth, may also introduce small chance of catastrophe e.g. environmental disasters, bioengineered viruses, killer robots. Countries may value more days of life to enjoy their high consumption over prospect of still higher future consumption (Jones, 2016) 3. Vested interests can block innovation: UK rail companies used safety regulation - so-called Red Flag Acts in the 1860-1890s - to discourage people from using cars. Sharing economy platforms like Uber banned by states worried about impact on local firms (See figure on 'Uber bans worldwide').
Research finds that technologies diffuse more slowly in countries where legislative authorities have more flexibility; but also in nondemocratic regimes and ones with a weak judiciary (Comin and Hobijn, 2009).
Uber bans worldwide
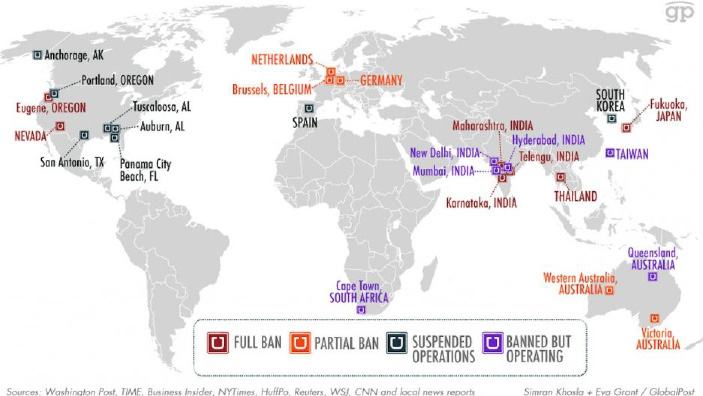
Source – Washington Post, TIME, Business Insider, NYTimes, Huffington Post, Reuters, Wall Street Journal, CNN and local news reports
Specific technology trends
Digital technologies
Wave of new Information Technologies (ITs) since late 1960s to present
ITs and digital technologies recognised as General Purpose Technology (Bresnahan and Trajtenberg, 1996):
- Continual technological progress.
- Pervasive use in wide range of sectors.
- Complementary innovations and spillovers.
However, productivity may fall in short run as economy adjusts.
Media, retail, transport and hotels well down the road to full digitisation. Healthcare, financial services and capital goods relative laggards (Morgan Stanley, 2017).
Timeline of Digital Technologies and Their Impact (1960s - 2010s)
A detailed timeline diagram illustrating the evolution of digital technologies, their business impact, and impact on people across decades from the 1960s to the 2010s.
- 1960s: Mainframes and databases. Assets/technologies: Modern programming languages, Algorithmic advancement. Business impact: Business calculations/analyses, Database management systems. People impact: Limited.
- '70s: Desktop and personal computing emerges. Assets/technologies: Desktop and PCs, Basic office software, Games and visual graphics. Business impact: Document processing, File storage. People impact: Individuals with computers in larger firms, Gaming and document processing.
- '80s: Business software takes off. Assets/technologies: Enterprise software. Business impact: Efficiency and automated business processes. People impact: Creative destruction of jobs.
- '90s: Internet and e-commerce. Assets/technologies: Internet technologies, Personal computing. Business impact: B2B and B2C e-commerce, Email, chat. People impact: Email, chatting, and VoIP, E-commerce, Remote work via VPBs.
- 2000s: Mobile broadband and Social media. Assets/technologies: GPS, Wi-Fi, 2G/3G, Laptops, Mobile phones. Business impact: Remote work and 24/7 connectivity, Digital advertising and marketing. People impact: Multiple devices per person, Individual as content creators.
- '10s: Big data. Assets/technologies: Smart devices and sensors, Predictive algorithms, machine learning. Business impact: Predictive analytics, natural language, big data, Internet of Things. People impact: Data generation, content creation, Digital devices everywhere, consuming hours each day.
Source – McKinsey Global Institute (2015)
Productivity impacts: Solow paradox renewed
- Increase in US labour productivity growth in mid-1990s largely reflected diffusion of ITs, resolving Solow Paradox: 'you can see the computer age everywhere except in the productivity statistics'. Modest increase in IT diffusion clouded by weak non-IT productivity in UK. (See chart on ‘Trend in Labour productivity growth in UK’)
- However, even in the US, productivity surge ended in 2000s prior to global financial crisis, especially in IT-producing and IT-using sectors (Fernald, 2014).
- Moreover, Acemoglu et al., (2014) shows for US manufacturing that where there is evidence of more IT-intensive industries having faster labour productivity growth, it is associated with falling output and even more rapidly falling employment. With employment declines in IT-intensive industries leveling off after 2000, so productivity growth returns to its earlier pace.
Trend in labour productivity growth in the UK (GDP per hour worked; average annual rate)
A line chart showing the annual growth rate of labour productivity (GDP per hour worked) in the UK from 1970 to 2015, alongside a trend growth estimate. The chart shows fluctuations in the annual growth rate, with a general downward trend in the latter part of the period, while the 'Trend growth' line maintains a relatively stable but declining path.
Source – OECD data (2016) with simple trend growth estimate
Digital debates and controversies
Pros
- Mis-measured productivity: consumers have free access to Google, Wikipedia and Facebook.
- Digital technologies enable experimentation and more rapid knowledge creation. Cost of sequencing human genome fallen sharply due to techniques such as polymerase chain reaction.
- Tech revolutions always proceed in fits and starts. Models such as S-curve, which implies technology bursts onto scene, gives what it has and then matures, simplistic. US productivity during electrification experienced acceleration, then slowdown (1924-32), then second boom (1932-1940). (See chart on ‘Labour productivity growth during the electrification era (1890-1940) and the IT era (1970-2012) in the US (1915=100 and 1995=100)’)
Cons
- Consumer surplus from IT falls short of the $2.9 trillion 'missing output' resulting from productivity growth. Productivity associated with innovations has always been mis-measured. Alternative measures e.g. business startup rates also point to declining dynamism.
- With expanding knowledge base, innovators compelled to devote more time to keeping pace with, rather than pushing, technology frontier. To sustain constant growth in GDP per person, one estimate for US suggests that it must double amount of research effort searching for new ideas every 13 years to offset increased difficulty of finding them (Bloom et al., 2016).
- Comparisons with electrification should be treated with caution given data limitations and fact that productivity boom may have been driven by pressures to innovate during WWII and Cold War.
Labour productivity growth during the electrification era (1890-1940) and the IT era (1970-2012) in the US (1915=100 and 1995=100)
A line chart comparing labour productivity growth in the US during two periods: the electrification era (1890-1940, indexed to 1915=100) and the IT era (1970-2012, indexed to 1995=100). Both lines show periods of growth, acceleration, and deceleration, suggesting similar patterns of technological impact on productivity over time, despite different starting points and scales.
Source – Kendrick (1961) Byrne, Oliner, and Sichel (2013)
Specific technology trends – Sharing economy
The rise of the sharing economy?
0.5 per cent of workers sell services through online platform (Katz and Krueger, 2016). Between 2012 and 2015, cumulative percentage of adults who had ever earned income through an online platform increased 47-fold (Farrell and Greig, 2016).
Market impacts
- Platforms like Airbnb highly differentiated from established providers - cannibalisation limited to particular market segments: net effect on supply positive (Zervas et al., 2016).
- Services like Uber and Lyft less differentiated from traditional ones, though may increase ease of access: net effect on supply less clear (Sundararajan, 2016).
- But even in cases of lower supply, secondary occupations e.g. car mechanics, may benefit as assets used more intensively require ongoing repair and maintenance.
- Sharing assets, such as cars, may leave consumers with more money to spend on things they enjoy (e.g. experiences).
Activity likely due to
- Growth of micro-businesses and contract work.
- Changing attitudes to asset ownership.
- Greater role for platforms in buffering income and spending shocks.
- Revival of community-based exchange.
Factors affecting sharing of goods and services
| Price | The higher the price of a good/service, the more likely it is to be rented out. |
|---|---|
| Frequency of usage | Goods that are used frequently by owners are less conducive to being shared. Frequently rented goods can also entail significant transaction costs (for example costs of delivery). |
| Income | Rental markets may also emerge in areas where the latent rental value of the asset represents a higher percentage of its owner's income. |
| Depreciation rate | The more rapidly an asset depreciates, the more likely it will be rented as owners seek to maximise its value before it 'perishes'. |
| Predictability of usage | Goods for which usage can be planned in advance are typically easier to rent. |
| Ownership value | Where a product has personal significance or the act of ownership provides value in itself, it may be less well suited to peer-to-peer rental. |
| Customisation | Goods that are idiosyncratic or full value of which is realised through repeated use are more likely to remain owned than rented. |
The risk of regulatory backlash
Employment terms e.g. in US, Californian court has given green light to Uber drivers to sue to establish legal status as employees (and so entitled to be reimbursed for expenses).
- Service quality e.g. the Uber driver with poor qualifications or rowdy Airbnb guest disrupting neighbours (cities like Berlin, New York and Paris have passed laws banning short-term rentals for this reason).
- Monopoly power because of platform network effects e.g. growing number of initiatives such as Platform Cooperativism movement seeking to reclaim power of platforms over decision-making and personal data for users.
- As many regulations were designed with traditional business in mind, open question whether policymakers can resolve these issues without stifling continued development of sharing economy. Other issues e.g. platform workers who cannot access credit because they do not earn a steady income also require consideration.
Different regulatory visions for sharing economy
| Regulation via Third Party online platform | Self-regulatory Organisation (SRO) | Government Direct Regulation | |
|---|---|---|---|
| Definition | Regulation via sharing platforms' technology reducing information asymmetries | Regulation rests with privately-run SROs with no or limited govt. involvement | Government sets explicit rules for sharing economy |
| Example | Online feedback; digitally verified government IDs of providers | Medical Association, Bar Association (law) | Government's accreditation for online courses; health and safety standards |
| Enforcement | Reputational damage | SRO has audit and penalising powers | Government fines and sanctions, if rules are breached |
Source - Morgan Stanley (2016)
Specific technology trends – Internet of Things
Increasing computing power and smaller chips have allowed for advances in Internet of Things
New sensors, big data and cloud computing improve:
- Process efficiencies
- Understanding of customer behaviour
- Speed of decision-making
- Consistency of delivery
- Transparency of costs
Impacts on
- Industries with complex supply chains, short lead times and uncertain preferences, such as manufacturing, oil and gas, consumer packaged and fashion-led products.
- Business models: firms can monitor use of their products and provide customised pay-as-you-go services.
- Service-oriented occupations, such as customer advisors, account managers, marketing specialists, researchers and sales/business experts.
Pace of adoption will depend on
- Cheap and energy-efficient chips.
- Availability of good and unique datasets.
- Development of common standards for interoperability and solutions to privacy and cybersecurity concerns.
Specific technology trends – Hardware and materials
Computing growth drivers over time (1960-2030)
A bubble chart showing the growth drivers of computing over time from 1960 to 2030, with 'Devices/Users (MM in Log Scale)' on the y-axis. It plots different technologies like Mainframe, Minicomputer, PC, Desktop Internet, Mobile Internet, and Internet of Things, showing an exponential increase in units/users over time for each technology.
Source - Morgan Stanley (2014)
Commercial 3D printing could overhaul design and production in broad range of sectors
- Large manufacturing companies are lead users of technologies like 3D printing to support distributed manufacturing e.g. GE reportedly uses 300 3D printers to produce 25,000 fuel nozzles p.a. for its LEAP jet engine. The assembly combines 18 different parts into one piece that is less prone to ice accumulation and joint and welding weakness and requires limited assembly labour.
- Manufacturing, transport and medical industries present greatest opportunities for 3D printing: activities that rely on highly complex, low-volume, highly customisable parts e.g. prototyping, automotive tooling, aerospace and medical devices.
- However, even in next decade, traditional manufacturing techniques likely to retain an advantage over 3D printing for most high-volume products due to differences in material costs and build speeds.
Impacts
McKinsey Global Institute (2013) estimates that 3D printing could generate economic impact of $230 billion to $550 billion by 2025 based on shorter production cycles, reduced waste and value of customisation.
The rise of the robots
Estimated that 120,000 industrial robots sold in 2013, with China overtaking US.
Adoption lags in SMEs
They do not have production volumes to justify use. Only 36 per cent of medium-sized European companies use industrial robots, compared with 74 per cent of companies with >1,000 employees (OECD, 2016).
Adoption heavily concentrated in car industry
- Seven times greater than in other sectors.
- Increasing customisation has led some manufacturers to return to human labour.
Evidence that industrial robots increase labour productivity and wages
Though diminishing marginal returns to use. Little effect of robots on overall labour share or total hours worked, though some reduction in low-skilled employment (Michaels and Graetz, 2015). Stronger effects tentatively found by Acemoglu and Restrepo (2016) for US local labour markets: each additional robot reduces employment by about seven workers with limited evidence of offsetting employment gains in other industries.
Going forward
- Use of collaborative robots ('cobots') that work alongside humans small but growing fast (60 per cent growth in annual sales in 2014 vs. 27 per cent for traditional robots).
- Use of mobile robots ('mobots') to perform tasks like inventory management (Amazon and Kiva Systems). However, Google sold Boston Dynamics due to weak near-term earnings visibility.
- Development of machine learning (ML) techniques that can generalise from learned concepts to solve related problems or use them to learn more complex concepts e.g. commonsense reasoning based on sparse data (Davis and Marcus, 2015; DARPA, 2016 on current limits of ML); debates around how to achieve sufficient computing power to scale ML for broad use.
Global sales of industrial robots (1993-2013)
A line graph showing global sales of industrial robots from 1993 to 2013, segmented by region: EU, OECD, North America, China, Japan, and Korea. The y-axis represents sales from 0 to 140,000 units. The graph indicates fluctuations and general growth in sales, with different regions contributing varying amounts over the period.
Source - IFR Statistical Department at World Robotics, quoted in OECD (2016)
New materials such as graphene have many potential applications but long lead times for commercialisation
Nanotechnology research has found that at dimensions of 1 to 100 nanometers, physical, chemical and biological properties of materials can differ in profound and valuable ways e.g. graphene (developed in Manchester):
- One-sixth weight of steel per unit of volume but more than 100 times as strong.
- Can be compressed without fracturing.
- 35 per cent less electrical resistance than copper.
- Ten times conductivity of copper and aluminum.
Going forward
Deloitte predicts graphene sales unlikely to pass $100 million by end of decade. On average, commercialisation of advanced materials can take 20 years (e.g. development of polyethylene applications beyond insulation and radar housing).
Factors slowing adoption
- Current limited production volume.
- High production, storage and transport costs.
- Need for complementary processing techniques so that graphene can be integrated into final products.
- Uncertainty in health and safety issues (e.g. research suggests that nanomaterials exhibit widely varying levels of toxicity).
Graphene applications classified by technology readiness level
A diagram classifying graphene applications by technology readiness level, organized into four main stages: Research, Applied research and development, Demonstration, and Commercial. It differentiates between 'Graphene Films' and 'Go Flakes and GNP' as raw material types. Various applications are mapped across these stages, showing different levels of maturity. For example, 'Electron microscopy' is under Commercial for Graphene Films, while 'Water membranes', 'OLED/LED lighting', 'Photodetectors', 'Flexible transparent conductors', 'Optoelectronics', 'Semiconductor growth', and 'Sensors' are in earlier stages. For Go Flakes and GNP, applications include 'Filtration systems', 'Metal alloys', 'Ceramic composites', 'Li-ion batteries', 'Supercapacitors', 'Polymer composites', 'Multifunctional coatings', and 'Thermal interfaces and heat spreaders'. The bottom row shows corresponding technology readiness levels from 'Technology concept' to 'Operation'.
Source - Zurutuza and Marinelli (2014)
Specific technology trends – Biotechnology
Synthetic biology and gene editing, allied with modern genomics, are in place to begin a bio-based revolution
Fast and affordable DNA sequencing technology and better understanding of biological systems means it is increasingly possible to design and build biological parts, devices and systems.
For example, full genome synthesis, when combined with evolutionary screening or selection, can generate improved cellular strains for biomanufacturing while enabling 'reverse genetics' that underpin faster scientific discovery.
UK activity concentrated in healthcare: concentration of health biotech companies higher in UK than most OECD countries (OECD, 2014).
Impacts
Biggest impacts on chemicals, pharmaceuticals, energy and agriculture industries. Outside health, biotech has potential to improve environmental performance by decoupling activities such as agriculture from fossil fuels.
Challenges
- Fit for purpose government regulations.
- Ownership and Intellectual Property rights.
- Development of standards.
- Ethical and security concerns (e.g. controversy around H5N1 avian influenza research).
Going forward
Steady growth likely to continue, though applications more advanced at the molecular or cellular than the systems level. Developments in use of computer models as well as quick, accurate and cheaper DNA manipulation e.g. CRISPR and sequencing technologies opening up new applications, with promise of higher productivity in other sectors.
Share of number of UK companies by sub-component of industrial biotechnology and bioenergy
A pie chart illustrating the share of UK companies by sub-component within industrial biotechnology and bioenergy. The largest shares are Biofuels (25%) and Food/drink (25%), followed by Environmental (15%), Pharmaceutical intermediaries (12%), Fine and speciality chemicals (7%), Agro-industry (6%), Specialist services (4%), Commodity chemicals (3%), and Personal care/Cosmetics (3%).
Source - BIS (2013)
Globalisation
Unwinding trade imbalances
Globalisation is an important force shaping labour markets
Extent of globalisation:
- World trade growing twice rate of global GDP.
- Developing countries doubling share of exports to over 40 per cent.
- Global Foreign Direct Investment flows almost back at pre-financial crisis levels.
- Fourfold rise in effective world labour force.
Sizeable impacts on employment
Globalisation and job creation
- Access to more goods and services at lower prices.
- Efficiency savings.
- Increased innovation.
However, benefits not spread equally across population.
Globalisation and job destruction
- Acemoglu et al (2016): job losses from rising Chinese import competition (1999-2011) 985,000 in manufacturing and 2.0-2.4 million in all of US.
- Indirect effects through supply chains and second-round effects via reduced aggregate demand also affect employment opportunities.
Rebalancing trade - looking ahead
Unwinding of trade imbalances should increase output and employment in tradable sectors in deficit countries
Rebalancing could have large scale effects. For example, in US, McKinsey Global Institute (2013) estimates that deficit reduction from 2 per cent to 1.3 per cent of GDP in knowledge-intensive manufacturing alone could:
- Raise US GDP by $200 billion annually by 2020 (~ 1 per cent of GDP);
- Create 600,000 new jobs (or ~0.4 per cent of workforce).
UK trade in goods and services with China
A stacked bar chart showing UK trade in goods and services with China from 2004 to 2014, with values in billions of pounds on the y-axis (ranging from -50 to 30). The chart shows components for service exports, goods exports, goods imports, and service imports, along with a line representing the overall balance of trade.
Source - Office for National Statistics
Unwinding trade imbalances
Capital inflows have benefited housing and construction
Capital inflows in trade deficit countries have reduced interest rates, supporting sectors like housing and construction (Aizenman and Jinjarak, 2014; Sa et al., 2015).
House prices and the current account
Looking ahead, as trade imbalances unwind, other downward pressures on interest rates should protect sectors like housing and construction from capital outflows.
Chart showing percentage growth in real house prices against current account/GDP. Data points for various countries are plotted, including New Zealand, United Kingdom, Spain, Austria, Ireland, United States, Italy, Netherlands, Finland, Switzerland, Germany, Japan, Belgium, Denmark, Sweden, Canada, and Norway.
Source - Sa, Towbin and Wieladek (2011) estimate a cross-country panel vector autoregressive model and identify monetary policy and capital inflows shocks to establish effects on housing.
Factors affecting rebalancing of trade
- Nature of real exchange rate movements.
- Fall in precautionary household savings in surplus countries with deepening social safety net.
- Financial development of surplus countries enabling the creation of financial instruments attractive for local savers.
- Improved corporate governance in emerging economies increasing dividends and reducing incentives for firms to retain earnings and save.
- Policy resistance in emerging economies to more flexible exchange rates.
- Rising capital flows with integration of emerging economies into global capital markets.
- Higher saving rates in surplus countries as larger share of population reaches 'prime savings' age.
- Later retirement dates in surplus countries with ageing populations boosting household saving.
- Households in deficit countries continuing to repair balance sheets.
Peak globalisation?
Rapid expansion of global trade may have run its course
Evidence that trade has become less responsive to global GDP growth – suggesting that trade slowdown is not just a temporary phenomenon reflecting the crisis (Constantinescu, Mattoo and Ruta, 2014).
- Leveling off of offshoring?
- Stabilisation of China's manufacturing share
- Stronger domestic production base in emerging economies
- Weaker (trade-intensive) business fixed investment as percentage of GDP in advanced economies
Chart titled "World trade (percentage of GDP)" showing global trade as a percentage of GDP from 1965 to 2015, with a general upward trend but a leveling off in recent years.
Source - World Bank (2016)
Chart titled "Four-year rolling sensitivity (elasticity) of global real-trade growth to global real-gdp growth" showing the sensitivity over time, with notable events like the US recession (1960-61), Oil Shock (1979), and End of Soviet Union (1991) marked. It also labels GATT (1947-94) and WTO (1995-Present) periods.
Source - Goldman Sachs (2016)
Going forward
If trade slowdown is structural, impacts of trade on labour market will in future be very different from what they have been in past.
Protectionist sentiment is rising, but impact on trade minimal so far
Protectionist, anti-immigration, anti-globalisation sentiment all on the rise, in part reaction to perception that globalisation does not benefit all and inability of social insurance policies to keep up with trade shocks e.g. Chinese import shock found to be key driver of regional support for Brexit (Colantone and Stanig, 2016).
Evidence that voters respond more to job losses caused by offshoring than to job losses from other causes, such as technological change or domestic competition (Margalit, 2011).
Growing number of restrictions
- Since 2008, new trade restrictions have outnumbered positive trade measures by factor of four (WTO, 2016). (See chart on 'Number of discriminatory measures implemented November 2008 – May 2016')
- However, to date these measures have affected only 5 per cent of global imports and focus on commodities with clear supply glut such as steel and other metals (WTO, 2016).
- Evidence that threats to raise tariffs can reduce trade even if not followed through (Crowley et al., 2016).
Bar chart titled "Number of discriminatory measures implemented" showing the count of such measures by country from November 2008 to May 2016. Countries include USA, India, Russia, Argentina, Brazil, Germany, United Kingdom, Italy, China, France, Indonesia, Turkey, Japan, Canada, Australia, South Africa, Mexico, South Korea, and Saudi Arabia, with USA having the highest number.
Source - Global Trade Alert
The importance of place
Barriers to offshoring have limited employment losses in some manufacturing sectors
Limits to offshoring activities: - Lack of capacity to manage high value-added activities in low-cost locations. - Learning and coordination benefits from keeping production and R&D together. - Poor access to raw materials, high transportation costs, and lack of proximity to demand limit tradability. - Growing demand for customisation. - Customer awareness and concern about supply chain and inventory risks. - Emerging markets losing manufacturing cost advantage over developed economies domestic competition (Margalit, 2011). (See table on 'Percentage change in emerging and developed market manufacturing cost differential; 2014 vs. 2004')
Regional producers e.g. food, printing and sectors that are R&D-intensive and need close proximity to markets e.g. cars, chemicals, have only seen modest decline in employment over last two decades compared with other industries (McKinsey Global Institute, 2012).
| 9 per cent | 8 per cent | 5 per cent | |
|---|---|---|---|
| CHINA | 9 per cent | 8 per cent | 5 per cent |
| SOUTH KOREA | 5 per cent | 4 per cent | 1 per cent |
| MEXICO | 0 per cent | -1 per cent | -3 per cent |
| INDIA | 0 per cent | -1 per cent | -2 per cent |
- = emerging costs higher than developed market
- = emerging market has closed part of the gap with developed market
Source - BCG (2014)
Going forward, could this lead to manufacturing renaissance in advanced economies?
Where these considerations are particularly salient, this may drive reshoring of activity. PWC (2014) estimates that this could create ~100-200,000 UK jobs over next decade, and boost sales by £6-12 billion p.a. in today's prices by mid-2020s (See chart on 'EY reshoring index').
Other 'catalysts' could help favour reshoring:
- Exploration and appraisal of economic potential of shale gas.
- Policy could support specialised clusters, upgrading transport infrastructure, access to finance, especially among manufacturing supply chains.
- Digital manufacturing, 3D printing and Internet of Things could all reduce supply chain costs. (See pages 34, 36)
Evidence to date of manufacturing renaissance limited
But companies likely to add new production capacity at home rather than abroad or relocate previously offshored activities to neighbouring countries - 'nearshoring'.
Questionable whether it will see large number of low-skilled manufacturing jobs, insofar as production simultaneously becomes more digital, intelligent and technology-intensive.
Horizontal bar chart titled "EY reshoring index" showing various product and service categories along the y-axis (Electrical and optical products, Repair of aerospace, Leather products, Aerospace, Paints and Varnishes, Pharmaceutical, Paper and paper products, Tobacco products, Other chemical products, Coke and refined petroleum, Inorganic chemicals, Other transport, Repairs of ships, Other manufactured goods, Ships and boats, Electrical equipment, Motor vehicles, Wearing apparel, Fabricated metal products, Machinery, Dairy products, Processed food, Other food products, Soft drinks, Rubbers and plastics, Bakery products, Meat products, Concrete, cement and plaster, Printing and recording services, Glass and ceramics) and an index score from 0 to 0.40 along the x-axis. Different colored bars indicate higher and lower reshoring potential.
Source - EY (2015) The reshoring index takes into account a number of country and sector drivers. Country drivers compare the UK's ability to attract businesses against the global average in areas such as tertiary educational attainment, import intensity, imports as a share of trade, GVA over output of the industry, sector productivity and energy costs. Sector drivers examine sector characteristics that favour reshoring such as expenditure on R&D and transportation costs, capital intensity of production, skills requirements and length of supply chains.
Specific trade opportunities
Trade creates employment opportunities in sectors where advanced economies enjoy comparative advantage
For example advanced manufacturing and knowledge-intensive services.
Small number of products typically dominate country's exports. Globally, country's top export on average accounts for 23 per cent of all exports, with top three exports at 46 per cent, though concentration ratios typically decline with country's level of income (Hanson, 2012). (See chart on 'Net export of mature economies, percentage of GDP')
Top 10 UK exports, 2015 (source: ITC)
- Other business services ($93.2 billion).
- Financial services ($84.7 billion).
- Machinery, mechanical appliances, nuclear reactors, boilers; parts thereof ($64.3 billion).
- Natural or cultured pearls, precious or semi-precious stones, precious metals, metals clad ($55.1 billion).
- Vehicles other than railway or tramway rolling stock, and parts and accessories thereof ($50.7 billion).
- Travel ($42.9 billion).
- Transport ($41.2 billion).
- Pharmaceuticals ($35.9 billion).
- Mineral fuels, oils, products of their distillation ($32.8 billion).
- Electrical machinery and equipment and parts thereof; sound recorders and reproducers, television ($29.1 billion).
Line chart titled "Net export of mature economies¹, percentage of GDP" showing trends from 1994 to 2009. Multiple lines represent different categories: Knowledge-intensive manufacturing, Capital-intensive services, Labour-intensive manufacturing, Knowledge-intensive services², Labour-intensive services³, Capital-intensive manufacturing, Health, education, public service, and Primary resources, indicating their surplus or deficit as a percentage of GDP.
Source - OECD; McKinsey Global Institute analysis 1. Mature economies; United States, Japan and EU-15 excluding Luxembourg. 2. Knowledge intensive; Services and businesses heavily reliant on professional knowledge. 3. Labour intensive; Services and businesses reliant on large workforce or large amount of work in relation to output.
However, there are barriers to growth of global market in services
Services still five times less likely to be exported than manufacturing products (Jensen, 2011).
Non-trade barriers such as licences, quotas, standards and other regulatory constraints prevent efficient provision of services across borders.
Tackling these barriers would deliver substantial benefits, but progress patchy: trade in services virtually neglected in Doha Round and increasing reliance on bilateral and plurilateral efforts.
Bar chart titled "STRI average, minimum and maximum scores by sector" displaying the Services Trade Restrictiveness Index for various sectors including Distribution, Road freight, Sound recording, Construction, Computer, Motion pictures, Banking, Insurance, Engineering, Telecoms, Rail freight, Architecture, Maritime, Courier, Broadcasting, Accounting, Legal, and Air transport. Each sector shows average, minimum, and maximum scores.
Source - OECD Services Trade Restrictiveness database (2014). The indices cover 40 countries. STRI = Services Trade Restrictiveness Index
Growing global middle class
Rise of emerging market middle class globally will lead to growth in spending and consumption
- Emerging market economies have produced three-quarters of global growth in recent years.
- Consumption in Asia Pacific region set to increase seven-fold to 2030 and its share of global consumption swell to 60 per cent.
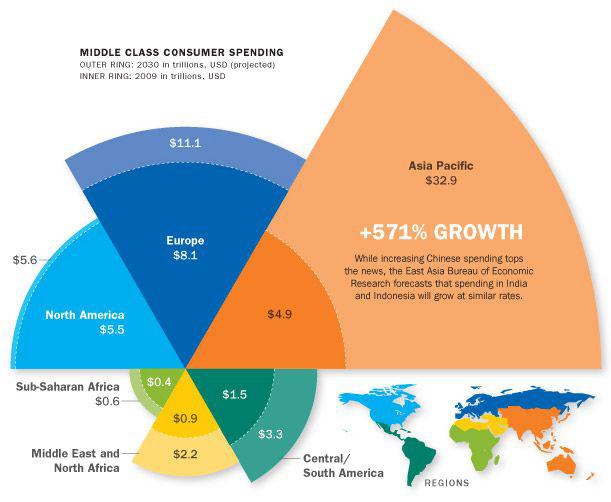
Source - Kharas (2010) Middle class is households with daily expenditures between USD10 and USD100 per person in purchasing power parity (PPP) terms
Growth in middle class consumption associated with demand for specific goods and services
Looking ahead, commodity spending may have peaked but global demand for consumer durables, particular high-end durable goods such as dishwashers or luxury cars will increase.
Dual-panel chart titled "Ladder of spending in 2012 and 2030" showing per capita income (US$) against categories of consumption (Commodities, Durables, Services). The charts illustrate how spending shifts from basic commodities to durables and services as income grows, with specific countries (India, China, Brazil, Russia, Germany, United States) positioned on the "ladder" for 2012 and 2030.
The marker for each spending category denotes the 'sweet spot' or income level at which per capita demand is at its maximum (income level associated with peak spending impact) Source - Goldman Sachs (2013)
Emerging markets face hurdles in fulfilling growth expectations
- Growth in emerging economies has slowed since financial crisis.
- Transitioning from resource-driven growth to growth based on innovation and high quality institutions is difficult. Of 101 middle-income economies in 1960, only 13 became high income by 2008 (World Bank, 2012).
- Premature industrialisation - manufacturing's share of output and employment peaking at much earlier per capita GDP levels than advanced economies, shutting off a historically potent engine of growth. Latin American and African countries particularly hard hit (Rodrik, 2015).
- Emerging economies vary greatly in terms of productivity, demographics, debt levels, commodity reliance, trade openness and political stability.
- Forecasts only extrapolating recent performance miss important sources of heterogeneity and tend to be over-optimistic, particularly at longer horizons (Ho and Mauro, 2014). (See chart on 'Average GDP growth in large emerging economies')
Scatter plot titled "Average GDP growth in large emerging economies" comparing average real GDP growth from 2000-07 against average real GDP growth from 2012-2015. Data points for various countries (Brazil, China, India, Russia) and an "EME aggregate" are shown.
Source - ECB (2016) Note: The sample includes Argentina, Brazil, Chile, China, Colombia, Czech Republic, Egypt, Hong Kong, Hungary, India, Indonesia, Malaysia, Mexico, Poland, Russia, Saudi Arabia, Singapore, South Africa, South Korea, Taiwan, Thailand, Turkey and Venezuela. The EME aggregate is a GDP-weighted average of these countries.
Growing global middle class
UK will benefit from emerging market opportunities, but only to limited extent
Emerging economies account for increasing, but small, share of UK trade:
- UK only commands 0.9 per cent China's import share, making it 24th largest exporter to China.
- In India, UK is 21st largest exporter.
- By 2030, share of UK exports to largest seven emerging economies forecast by PWC (2015) to grow to 13 per cent, up from 9 per cent, even as exports to China slow.
- Focus likely to remain on established trading partners such as EU and US. Even in 2030, share of UK exports to Germany projected to remain higher than that going to China, though uncertainties about Brexit.
Emerging markets face challenges in competing with advanced economies in their traditional areas of export strength
- Despite growth in R&D spending, composition of exports from emerging economies still different from advanced economies and pace of convergence has slowed (Fontagne, Gaulier and Zignago, 2008; Edwards and Lawrence, 2013).
- Even when exports classified in same product category, differences in unit values suggest that emerging market exports are more standardised and thus only imperfect substitutes for advanced economy exports.
- History suggests specialisation patterns will converge when emerging economies approach advanced economy per capita income levels - unlikely for many years yet (Edwards and Lawrence, 2013).
- Emerging economies will also find it harder to move up value chain if they cannot retain their young, educated workforce (Gaulé 2010; Breschi et al., 2015). (See figure on 'Ten largest Ten largest South-North migration corridors for inventors (net), 2001-2010')
- Rather than head-to-head competition in global markets, most likely change is rise of credible local competitors within emerging markets.
Ten largest South-North migration corridors for inventors (net), 2001-2010
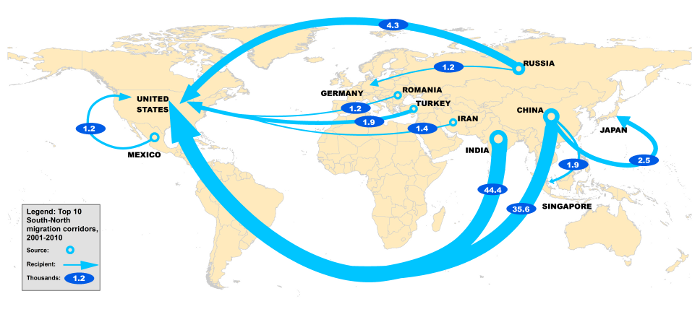
Source - Miguelez and Fink (2013) map migratory patterns of inventors, extracted from residency and nationality information included in patent applications filed under the Patent Cooperation Treaty. Note UK, France and Germany saw more inventors emigrating than immigrating over this period.
Demographic change
Ageing population – Macroeconomic impacts
Slowing population growth, and population ageing due to low fertility rates and increasing life expectancy.
Total fertility (children per woman)
A line graph showing total fertility rates (children per woman) from 1955 to 2095. "More developed regions" show a decline from over 3 in 1955 to under 2 by 2015. "Less developed regions" show a sharp decline from over 6 in 1955 to under 2 by 2015. The "United Kingdom" and "United States" lines generally follow the "More developed regions" trend, starting between 2 and 3 and declining to under 2.
- More developed regions
- Less developed regions
- United Kingdom
- United States
Source - United Nations Population Division (2015)
Longevity (life expectancy at age 20)
A line graph showing life expectancy at age 20 from 1955 to 2095. All regions show an increase over time. "More developed regions" and "United Kingdom" and "United States" lines start around 50-55 and rise to 70-75 by 2095. "Less developed regions" start around 40 and rise to over 60 by 2095.
- More developed regions
- Less developed regions
- United Kingdom
- United States
Source - United Nations Population Division (2015)
Proportion of population >60 years old
A bar chart showing the proportion of the population over 60 years old from 1950 to a projected 2090. All categories show an increasing trend. "More developed regions," "United Kingdom," and "United States" consistently show higher proportions, reaching over 30% by 2090E, with "Less developed regions" starting lower but also rising significantly.
- More developed regions
- Less developed regions
- United Kingdom
- United States
Source - United Nations Population Division (2015)
Ageing reduces labour force growth: a 'headwind' for economic growth
- Working-age population already contracting in some advanced countries, including Japan, Italy, and Germany, but set to accelerate in many large emerging economies, such as China.
- Increasing dependency ratios mean smaller proportion of population entering productive years, reducing saving and therefore investment.
Working age (15-64) population growth by regions
A line graph displaying the percentage growth of the working-age population (15-64) across regions from 1955 to 2095. "Less developed regions" show high initial growth (up to 12%) then decline. "More developed regions", "United Kingdom", and "United States" generally show lower growth, fluctuating and trending towards 0-2% by 2095.
- More developed regions
- Less developed regions
- United Kingdom
- United States
Source - United Nations Population Division (2015)
Dependency ratios across regions (ratio of population aged 65+ per 100 population 15-64)
A line graph illustrating dependency ratios from 1950 to 2090. All regions show an increasing trend. "More developed regions," "United Kingdom," and "United States" consistently show higher dependency ratios, rising from around 10-20 in 1950 to over 50 by 2090. "Less developed regions" start lower (under 10) but also rise significantly towards 35% by 2090.
- More developed regions
- Less developed regions
- United Kingdom
- United States
Source - United Nations Population Division (2015)
Weaker labour force growth means that without faster labour productivity growth, GDP growth is slower.
- Looking ahead, McKinsey (2015) predicts GDP growth could fall by 40 per cent globally and by 10 per cent in UK over next 50 years even assuming productivity grows at its historical rate.
- Productivity would need to grow 80 per cent faster over next 50 years than historical average to negate effect.
- However, older people slower at adopting new technologies so productivity growth may also be lower.
Arnott and Chaves (2012) show that larger populations of retirees (65+) erode economic growth.
From a purely supply perspective, automation may be less a threat than a solution as it compensates for a shrinking workforce.
Accordingly, it is found that countries undergoing more rapid population ageing adopt more robots (Abeliansky and Prettner, 2017; Acemoglu and Restrepo, 2017).
This does not address risk of lower household demand (robots do not buy things), adding to the question 'who owns the robots' and the pathways to widened ownership e.g. employee stock ownership plans (Freeman, 2016).
GDP growth and demographic shares
A line graph showing implied regression coefficients for GDP growth across different age groups (10-14, 20-24, ..., 70+). The coefficients peak for middle age groups and decline for younger and older groups, suggesting their contribution to GDP growth.
Source - Arnott and Chaves (2012)
Demographic pressures on labour markets moderate in UK relative to other advanced countries
- Working age population in UK projected still to grow, albeit more slowly than current rate, while other advanced economies may see decline.
- UK also enjoys high and stable labour force participation rates due to:
- High self-employment rate which provides flexibility to older workers and women
- High immigration rates since 2005 and higher participation rate of immigrants, especially important in sectors such as food processing, cleaning, clothers, manufacturing, R&D and IT. (See chart on 'Net immigration: UK Vs US')
- Policy change examples:
- UK has raised retirement age and introduced single tier pension
- Exploring systems for strengthening lifelong learning
- Employment rate for older people around the OECD average with scope for improvement: increasing rates to Swedish levels, the best performing EU country would increase annual UK GDP by around £100 billion (PWC, 2015).
Net immigration: UK vs. US
A line graph showing the percentage of working population for net immigration in the United States and United Kingdom from 1990 to 2015, with projected lines. The United States shows more fluctuation, generally higher, while the United Kingdom shows a steadier, lower trend, but with an increase towards 2015.
- United States
- Projected
- United Kingdom
- Projected
Source - Bank of England (2016)
Political obstacles to responding to these demographic pressures
- Older people consider public pensions and healthcare higher priority than public education. Particular risk for countries with a large share of young people not in employment, education or training (UK=14.6 per cent; OECD=13.9 per cent). Despite increase in retirement age across OECD, pace has been modest (2.5 years=men and 4 years=women between 2010 and 2050). (See chart on 'First or second priority for extra government spending: Western Europe')
- Voter participation increases with age up to 60, further skewing political incentives.
- Discrimination in workplace - perceptions of ageism in UK are among the highest in Europe (Eurobarometer, 2015).
- Backlash against immigration.
Silver lining
Need to replace retiring workers will support jobs even in occupations where demand will otherwise fall.
First or second priority for extra government spending: Western Europe
A line graph showing the percentage of respondents who prioritize different areas for extra government spending across various age groups (21 to 79). Healthcare and Pensions are generally higher priorities, especially for older age groups, while Environmental and Assisting the poor show lower percentages. Education priorities fluctuate.
- Healthcare
- Pensions
- Education
- Environmental
- Assisting the poor
Source - De Mello, Schotte, Tiongson and Winkler (2016) using Life Transition Survey 2010
Pressure on public finances, intensifying need for reforms
Age-related spending like pensions, healthcare, long-term care and education projected to rise by 3.4 per cent of GDP 2015-2050 in advanced economies, though with country variation (UK =2 per cent of GDP) (Standard & Poor's, 2016).
Without policy action, S&P estimates net general government debt will rise to 135 per cent of GDP by 2050 in these countries (UK=175 of GDP per cent).
Fiscal vulnerabilities reflect UK's initial budgetary position and debt level, rather than surge in age-related entitlements.
Fiscal space: distance to country-specific limits on debt (debt/GDP ratio, ppts)
A horizontal bar chart showing fiscal space for various countries. Norway has the highest at 246, followed by South Korea at 241.1, New Zealand at 228.1, Sweden at 188.8, Finland at 171.7, Germany at 167.9, United States at 165.1, Netherlands at 158.1, Austria at 156.6, Malta at 151.1, Canada at 149.8, Iceland at 145.3, United Kingdom at 132.6, Belgium at 124.3, France at 116.9, Spain at 115.2, Ireland at 105.5, and Portugal at 58.8.
Source - IMF (2015)
This figure highlights wide estimates in room for manoeuvre between current debt ratios and public debt limits; however, with already high debt levels there may be more limited scope for policy to support growth and employment than in the past.
Ageing population – Sector impacts
How ageing population spends disposable income has implications for sectors and occupations
- 50 plus generation has substantial economic sway in terms of wealth and income e.g. in US, it controls almost 80 per cent of aggregate net worth while 60 per cent of those earning $200,000+ p.a. are baby boomers.
- So, ongoing shift in consumption shares towards this group:
- Now makes up majority of consumption spending in US, Japan and Germany.
- UK an exception: consumption expenditure share for 50+ group only 42.8 per cent, but growing.
2015-30 projected consumption growth (percentage)
Three bar charts showing projected consumption growth by age group for North America, Western Europe, and Northeast Asia.
North America: - 75-plus: 21.7% - 60-74: 25% - 45-59: 11.6% - 30-44: 19.3% - 15-29: 12.3% - 0-14: 10.2%
Western Europe: - 75-plus: 24.7% - 60-74: 34.6% - 45-59: 7.9% - 30-44: 12.1% - 15-29: 11.5% - 0-14: 9.2%
Northeast Asia: - 75-plus: 39.9% - 60-74: 18.4% - 45-59: 23.8% - 30-44: 3.9% - 15-29: 6.6% - 0-14: 7.3%
The legend indicates "Age groups 60-plus" and "Age groups 0-59".
Source - McKinsey Global Institute (2016)
Changing age-specific consumption expenditure shares: 2005-2013
| Age | Japan 2005 | Japan 2013 | USA 2005 | USA 2013 | Germany 2005 | Germany 2013 | UK 2005 | UK 2013 |
|---|---|---|---|---|---|---|---|---|
| Under 20 | 0.5 per cent | 0.4 per cent | 0.2 per cent | 0.2 per cent | 0.3 per cent | 0.3 per cent | 0.2 per cent | 0.2 per cent |
| 20-29 | 8.1 per cent | 6.3 per cent | 9.2 per cent | 8.7 per cent | 10.9 per cent | 9.9 per cent | 9.4 per cent | 11.0 per cent |
| 30-39 | 16.6 per cent | 14.8 per cent | 19.1 per cent | 17.3 per cent | 15.3 per cent | 11.5 per cent | 24.4 per cent | 20.7 per cent |
| 40-49 | 18.4 per cent | 20.1 per cent | 23.6 per cent | 19.7 per cent | 19.8 per cent | 18.7 per cent | 24.6 per cent | 25.3 per cent |
| 50-59 | 22.9 per cent | 18.1 per cent | 20.5 per cent | 21.7 per cent | 19.9 per cent | 23.4 per cent | 20.3 per cent | 19.7 per cent |
| 60+ | 33.5 per cent | 40.3 per cent | 27.4 per cent | 32.5 per cent | 33.9 per cent | 36.2 per cent | 21.1 per cent | 23.1 per cent |
Source - Credit Suisse (2015)
That people live for longer and more healthily has implications for industries traditionally targeted at younger consumers
Living for longer increasingly defined as younger for longer, not older for longer. Three-stage view of life - education, career and retirement - giving way to a more fluid pattern. As more people from different age groups pursue similar life stages, greater potential for cross-generational understanding? (Gratton and Scott, 2016).
Also viewed as a time when people pursue creative interests and grow emotionally.
Consistent with evidence that relationship between wellbeing and age is U-shaped: high in youth, falling in midlife, and rising again in old age. Socio-economic drivers, though evidence that relationship is also rooted in biology: similar pattern exists in great apes (Weiss et al., 2012). Retirement linked with leisure satisfaction though not necessarily life and income satisfaction.
Over 65s spend more than other groups across broad range of leisure services - in 2014, average expenditure by 65-plus age group was £3,372 versus £2,469 for 55-64 year olds, £2,664 for 35-54 year olds and £1,626 for 18-34 year olds (Barclays, 2014).
With 65-plus age group projected to account for most of the increase in leisure time in next decade, activities from tourism, film-going, reading through to cosmetics, fashion and fitness likely to benefit (McKinsey Global Institute, 2016). Leisure time also used to invest in skills, health and relationships.
Elderly are the largest consumers of healthcare; expanding costs means healthcare sector ripe for innovation
- In UK, average healthcare spending for 65+ and 85+ is 2 and 3.6 times national average respectively. (Nuffield Trust, 2016).
- Health problems such as neurodegenerative disorders do not sharply curtail patient lifespans and care likely to remain labour-intensive.
- Science-based and organisational innovation have potential to boost productivity, though new medicines and surgical techniques can also contribute to growth in health spending and in public expectations (Smith et al., 2009).
- NHS has seen improvements through greater horizontal and vertical integration, but take up of new technologies and plurality of provision comparatively low (Evennett and Barlow, 2013).
- Uneven public willingness to share health data, reducing potential of self-diagnostic technologies to put GPs out of business (25-40 per cent of population have low levels of patient activation).
- Cost-containment may prompt move away from inpatient and outpatient care (currently ~two-thirds of healthcare spending in OECD) to home health, skilled nursing facilities and other means to engage communities.
Long-term projections and other cost pressures
A line chart showing long-term projections and other cost pressures as a percentage of GDP, from 2015-16 to 2065-66. Four lines are shown: - FSR 2015 (Updated population projections and spending plans) - Low productivity - Constant other pressures - Declining other pressures
Source - OBR (2016) Chart shows OBR (FSR) central projection as well as projections based on other cost pressures e.g. relative healthcare costs and technological progress which central projection does not take into account. Low productivity scenario in line with long-term average rate of health sector productivity growth of 1.2 per cent a year.
Growing preference among older people to 'age in place' has implications for housing-related sectors
- Older individuals increasingly want to age comfortably and safely in place: 85 per cent of over 65s plan to remain in their neighbourhood for a number of years (Lloyd and Parry, 2015).
- Current housing stock lacks easy access and manoeuvrability: over half of mainstream housing requires adaptation and over a quarter of inaccessible homes are not adaptable at all. Housing is also too large for older people raising levels of under-occupation against a backdrop of constrained supply (Torrington, 2015).
- Over-60s in England alone have £1,200 billion in unmortgaged housing wealth to address these constraints:
- May give rise to important market in retrofitting and remodelling of housing stock: from 'Do It Yourself' to hire someone to 'Do It For Me'.
- Specialist developments may benefit though owner-occupied retirement housing represents just 2 per cent of UK's total housing stock due to lack of competition and regulatory barriers.
- 'Ageing in place' may also be associated with shift in demand from rental to owner-occupied housing at aggregate level, as elderly substitute owner occupation for renting, which will in turn have implications for sectors like construction, legal and financial services.
- Possible demand for long-term care which currently accounts for 2 per cent of employment in OECD. In Japan, number of long-term care workers more than doubled since 2001 following introduction of long-term care insurance programme.
Population ageing creates major opportunities for financial savings industry
- With longer lives, individuals face greater risk of outliving savings: estimates of global annuity and pension-related longevity risk exposure $15-$25 trillion (Bank for International Settlements, 2014). Even in optimistic scenarios, individuals face considerable shortfall in retirement saving.
- Closure of defined benefit pension schemes (~85 per cent UK schemes now closed to new members and further accruals from existing members) and tumbling value of state pension (OECD, 2016).
- More onus on individuals who may have trouble planning for retirement because of behavioural and cognitive barriers - potentially higher demand for financial advisors, though scope for self-service tools too (See table on 'Estimated number of individuals aged 22 to state retirement with inadequate income under pensions commission replacement rate targets.')
- Low interest rate environment poses risks for savers, retirees, pension funds and insurance companies that cannot meet funding liabilities.
- Doubts whether investors can continue to rely on past investment performance to justify future return prospects (Deutsche Bank, 2013; MGI, 2016).
- Search for yield and uncorrelated returns present opportunities for alternative investments, such as real assets.
- Will more money in retirement savings and demand for predictable returns steer investee companies away from experimentation and innovation? (Erixon and Weigel, 2016).
Estimated number of individuals aged 22 to state retirement with inadequate income under pensions commission replacement rate targets
| Target replacement rate | 80 per cent | 70 per cent | 67 per cent | 60 per cent | 50 per cent | All |
|---|---|---|---|---|---|---|
| Income bracket | Under £12,000 | £12,000-£22,100 | £22,100-£31,600 | £31,600-£50,500 | Over £50,500 | All |
| Total individuals (millions) | 1.3 | 4.3 | 4.4 | 8.9 | 9.0 | 27.8 |
| Number with income below target (millions) | 0.1 | 1.2 | 1.7 | 3.4 | 4.2 | 10.7 |
| Percentage with income below target | 11 per cent | 29 per cent | 39 per cent | 39 per cent | 47 per cent | 38 per cent |
Source - DWP (2012) Replacement rate refers to income in retirement expressed as percentage of income before retirement. Simulations run before introductions of automatic enrollment.
Millennials
Millennials show different consumption behaviours which create new market opportunities and risks
- Millennials, the cohort born between 1980 and 2000, make up one-fifth of UK population. Likely to emerge as main source of wealth and spending as they inherit assets over next few decades.
- Millennials first group to come of age after Internet, social media, mobile and video gaming became widespread. They have more information and choice than previous generations, but have heightened expectation of immediacy, participation and transparency that is driving innovation in many industries.
- Technology may have increased the value of leisure time: among lower-skilled male millennials, evidence in US of weakening attachment to the labour force due to allure of video games (Aguiar et al., 2016).
- Millennials postponing major life decisions, such as getting married, saving and having children and spending more time when young on travel, culture and artisanal products ('experiences'). Millennials devote more time and money to exercising and eating than previous generations. (Some choices may reverse as they grow older and become wealthier).
- Not all industries can respond to these preferences without major disruption, however e.g. survey evidence identifies banking as industry most likely to be transformed by millennials given perception it is excessively transactional and poorly aligned with their personal values.
Home ownership rates by age for each generation: UK
A line chart showing home ownership rates by age for different generations in the UK. - Silent gen (1926-1945) - Baby Boomers (1946-1965) - Gen X (1966-1980) - Millennials (1981-2000)
The Y-axis represents Percentage from 0 to 80, and the X-axis represents Age from 20 to 70.
Source - Resolution Foundation (2016)
The UK workforce is engaged in alternative working arrangements.
Estimated that 25 per cent of working age population in UK derive primary or secondary income from alternative work e.g. self-employment, multi-jobbing (McKinsey Global Institute, 2016).
But surprisingly little evidence of change in past two decades.
However, many occupations are amenable to new forms of work.
Changes in structure of UK employment 1996-2016
A bar chart showing changes in the structure of UK employment between 1996 (orange) and 2016 (purple) across various employment categories.
| Category | 1996 (%) | 2016 (%) |
|---|---|---|
| Employees | 85.1 | 84.5 |
| Permanent Employees | 78.9 | 79.3 |
| Full-time Employees | 63.5 | 62.5 |
| Self-employees | 13.4 | 14.9 |
| Temporary | 6.3 | 5.2 |
| Second job holders | 5.0 | 3.5 |
| Zero hours | 0.8 | 2.5 |
| Other jobs | 1.1 | 0.6 |
Source - The Work Foundation (2016) Permanent employees are total employees minus temporary employees. Second job holders include self-employed. Other jobs are unpaid family workers and people on government training schemes.
Occupations amenable to alternative work arrangements
- More amenable
- Transient workers
- Workers with widely available skills, in jobs with high turnover or seasonality.
- Food service
- Retail sales
- Experts
- Workers with specialised, scarce skills who can split their time between multiple clients or employers, given the demand for their service.
- Computer scientists
- Doctors
- Generalists
- Workers with widely available skills, in jobs made up of discrete tasks and easily transferable knowledge.
- Electricians
- Drivers
- Project-based managers
- Managers in project-based occupations.
- Construction managers
- Transient workers
- Less amenable
- Traditional 'company workers'
- Workers in jobs that consist of discrete tasks but require some contextual knowledge.
- Accountants
- Metal Workers
- Managers
- Managers or executives with ongoing, typically non-project-based work.
- Managers
- Executives
- Production supervisors
- Operational workers
- Workers who carry out ongoing operations and long-term projects and strategies.
- Media Specialists
- Traditional 'company workers'
Source - McKinsey Global Institute (2016)
Mixed evidence that millennials are embracing alternative working arrangements
Despite popular view that millennials especially likely to avoid traditional careers (WEF, 2016), US evidence suggests they stay longer with employers than Generation X workers did at same age. UK evidence finds millennials 30 per cent less likely to move jobs in their 20s than generation X (Resolution Foundation, 2017).
(See chart on 'Job tenure in years for millennials and Generation X at age 18 to 30 (percentage)')
One explanation is that labour markets have become less fluid since 1990s with fewer employer switches, reflecting predominance of older, larger firms that do not contract or expand as rapidly (Hyatt and Spletzer, 2013; Davis and Haltiwanger, 2014).
Another explanation stems from finding that cohorts like millennials which experience recession during their formative years tend to:
- Adopt more conservative attitudes to risk
- Believe individual success depends more on luck than hard work
- Support more government redistribution and have less confidence in public institutions and democracy (Giuliano and Spilimbergo, 2009; Malmendier and Nagel, 2011).
Benefits of job security, better matches and on-the-job learning accompanied by costs: switching jobs important determinant of wage growth for younger workers while increased job tenure across the economy can raise long-term unemployment.
Job tenure in years for millennials and Generation X at age 18 to 30 (percentage)
A bar chart showing job tenure in years for millennials and Generation X at age 18 to 30.
| Job Tenure | Generation X (%) | Millennials (%) |
|---|---|---|
| <1 | 44 | 39 |
| 1 | 19 | 20 |
| +1 | 34 | 39 |
Source - Council of Economic Advisors (2014)
Environmental sustainability
Impact of climate change
Global warming: 1983-2012 warmest 30-year period for Northern Hemisphere in 1,400 years and accompanied by rise in extreme weather and climate events
Signatories to Intergovernmental Panel on Climate Change now 95 per cent certain that warming of climate system attributable to human influences. To keep average global temperature rise below 2°C - the de facto target for global policy - cumulative CO2 emissions need to be capped at one trillion metric tons above levels of late 1800s. Global economy has already produced over half that amount.
Global land-ocean temperature index
Line chart showing global land-ocean temperature index from 1880 to 2020.
The chart displays temperature anomaly (in degrees Celsius) relative to the 1951-1980 average. Both annual mean and 5-year mean lines show a general upward trend in temperature anomaly, with significant increases observed from around 1980 onwards, reaching values above 0.5°C by 2020.
- Annual mean (Purple line)
- 5 years mean (Orange line)
Temperature anomaly refers to the departure from 1951-1980 average temperatures.
Source - NASA's Goddard Institute for Space Studies (GISS)
Number of natural disasters in the world (1980-2012)
Stacked bar chart showing the number of natural disasters in the world from 1980 to 2012, categorized by type.
The total number of disasters generally increased over this period, with significant peaks in the 2000s.
Disaster Categories:
- Geophysical (Purple)
- Meteorological (storms) (Orange)
- Hydrological (floods) (Pink)
- Climatological (temperature anomaly) (Dark Purple)
Source - Munich Re (2012)
Climate change has wide-ranging consequences which impact on many industries.
- Increased severity of natural disasters.
- Environmental changes like desertification and loss of biodiversity.
- Higher heating and cooling costs.
- Declines in labour productivity.
Agriculture, tourism, insurance, forestry, water, infrastructure and energy directly affected, though linkages with socio-economic and technological systems mean that risks can accumulate, propagate and culminate in larger impacts (See figure on 'Global risks interconnections map').
Economic stakes huge: damage from climate change could shave 5 per cent-20 per cent off global GDP p.a. by 2100 according to Stern Review, though estimates vary depending on sector, assumed damage function and discount rate.
Global risks interconnections map
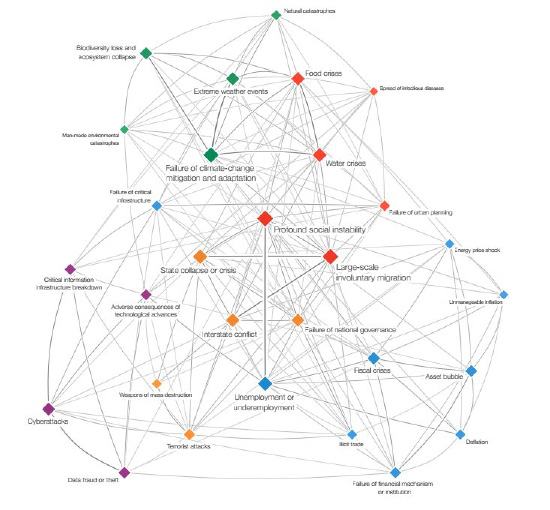

Source - WEF (2016)
Massive implications for insurance strategies
- Some regions may be able to adapt to changes in temperature and precipitation by adopting farming practices from warmer or drier climates i.e. more tolerant crops. May not be feasible for regions already at climate thresholds.
- Increase in extreme weather events may lead to higher insurance premia in vulnerable regions. Natural catastrophe reinsurance demand could increase by 50 per cent in developed markets and 100 per cent in emerging markets by 2020 (vs. 2012) (Swiss Re, 2016). (See chart on 'Increasing trend of natural catastrophes over the last four decades')
Opportunities but also challenges for insurers, notably capacity to assess and price financial risk (Bank of England, 2015; Bank of Canada, 2016). Also increases government contingent liabilities e.g., overall risk exposure of US National Flood Insurance Program increased four-fold from 1980 to $1 trillion in 2005.
Increasing trend of natural catastrophes over the last four decades
Line chart showing increasing trend of natural catastrophes over the last four decades (1970-2012) in billions of dollars.
The chart shows both total losses and insured losses, along with their respective trend lines. Both total and insured losses show a clear upward trend, with significant spikes in the 2000s, indicating a growing financial impact of natural catastrophes.
- Total losses (Orange bars)
- Insured loses (Purple bars)
- Trend line (Total losses) (Black line)
- Trend line (Insured losses) (Grey line)
Source - Swiss Re Sigma
Transition to low carbon economy
Meeting emissions reduction targets requires investment in low carbon technologies and reducing fossil fuel subsidies
LED lighting, onshore wind, solar PV, and hybrid and electric vehicles stand out as technologies with most potential to disrupt markets and lower emissions in next 10-15 years. Adoption driven by falling costs e.g. global electricity generation costs for new onshore wind farms and large solar panel plants fell by ~30 per cent and 65 per cent respectively between 2010 and 2015 (IEA, 2016). Prospect of large scale, distributed storage capacity promises further efficiencies.
Investments in green technology and infrastructure (~$93 trillion through 2030E) present opportunities for finance e.g. $50-60 billion of green bonds issued in 2016.
UK enjoys comparative advantage in electric vehicles and has potential innovation strengths in wind turbines (Zachmann, 2016).
However, 'dirty' technologies continue to have structural advantages:
- Network effects and switching costs direct innovation efforts to improving dirty technologies and intermediate sources of energy e.g. carbon capture and storage, geoengineering and extraction of shale gas.
- Incumbent fossil fuel companies politically influential and make up sizeable proportion of public pension funds.
- Entrenched consumer behaviour particularly in areas such as heating and transport.
- Market and policy support for new technologies volatile e.g solar PV.
- Technology and sector-specific factors e.g. bioenergy operates at major production levels at comparable costs to fossil fuels, but causes pollution and puts pressure on land devoted to producing food crops.
Low carbon technologies by market size and the three-year compound annual growth rate (CAGR)
Donut chart showing low carbon technologies by market size and their three-year compound annual growth rate (CAGR).
The chart highlights various low-carbon technologies and their respective market shares and growth rates. Solar PV represents the largest segment with a 36.3% CAGR, followed by Onshore wind (10.3% CAGR) and Hybrids and EVs (32.3% CAGR). LEDs show the highest CAGR at 73.0%.
Technologies and their 3-year CAGR:
-
- Solar PV (36.3% CAGR)
-
- Onshore wind (10.3% CAGR)
-
- Hybrids and EVs (32.3% CAGR)
-
- LEDs (73.0% CAGR)
- Biomass (6.8%)
- Smart grid (5.7%)
- 1st gen biofuels (4.3%)
- Hydro (3.5%)
- Nuclear (-1.7%)
Other technologies listed (CSP, Offshore wind, Geothermal, 2nd gen biofuels, FCV, Stationary battery storage, CCS, Smart appliances, Marine) are implicitly part of the smaller segments.
Source - Goldman Sachs (2016)
The implications for employment are ambiguous
1 Will the green economy create more jobs than it destroys?
For
Evidence that job gains in green sectors exceed losses in polluting sectors due to higher labour intensity of green activities, particularly in construction, manufacturing and installation. Many activities non-tradable e.g. retrofitting buildings, implying greater share of overall spending and job creation remains within country. Benefits especially large for countries relying on imported oil and gas (Pollin, 2015).
Against
Higher prices and costs for clean energy in medium term could reduce purchasing power of consumers, lowering aggregate demand.
2 How much of the economy and employment will be affected?
For
Firm-level evidence that environment-related innovation has substantially larger spillovers than fossil-fuel technologies and even emerging fields such as robotics, biotech and 3D printing, meaning wider impacts for the economy (See pages 37, 41, 36) (Dechezleprettre et al., 2013; Gagliardi et al., 2016).
Against
OECD (2012) estimates that by 2030, change in sectoral composition of employment will be minor (c.1-2 per cent of all jobs).
In UK, ONS estimates that green economy contributed 357,200 full-time equivalent jobs in 2012, an increase of 5.3 per cent (18,000 jobs) since 2010.
Green jobs include
- Production of environmental goods such as windmills and energy-efficient buildings.
- Services such as recycling and work related to reducing emissions and energy and resource consumption, such as environmental and work safety and facilities and logistics management.
Tackling climate change and transitioning to low-carbon economy is fundamentally dependent on government
Supportive regulation has grown across major advanced and emerging economies. In UK, 2008 Climate Change Act was first law in world to set emissions reduction targets (toughened by Parliament to 'at least 80 per cent below 1990 levels by 2050'). It also created five-yearly carbon budgets to help ensure cost-effective trajectory towards long-term goal. It operates one of the world's toughest carbon pricing schemes and has decided to phase out coal by 2025. However, subsidies for wind and solar have been scaled back.
National laws and regulations related to CO2 emissions
Stacked bar chart showing national laws and regulations related to CO2 emissions by period (Before 2000, 2000-04, 2005-09, 2010-14).
The chart indicates a significant increase in both 'Legibility' and 'Executive' regulations over time, with the period 2010-14 showing the highest number of regulations.
Categories:
- Legibility (Orange)
- Executive (Purple)
Source - Grantham Research Institute/LSE (2015)
Database covers 99 countries (33 developed countries and 66 developing countries)
Policies for low carbon economy likely to remain piecemeal over next 15 years
Efforts are likely to be:
- Set nationally rather than multilaterally with China, EU and US key veto players.
- Sector- and technology-specific, rather than supported by comprehensive measures such as carbon pricing. Where carbon pricing arrangements operate, they suffer from low price levels and limited emissions coverage.
- Politically controversial and subject to change (Pew 2015).
International Energy Agency modelling of impact of Paris Agreement - most important global deal since Kyoto Protocol - suggests that while commitments will slow global emissions growth, it will continue to rise towards 2030.
Price of EU carbon emission allowance
Line chart showing the price of EU carbon emission allowance (Carbon price per tonne) from November 2010 to August 2015.
The chart shows significant volatility in the carbon price, with a general decline from late 2010, reaching a low in 2013-2014, and then a slight recovery towards mid-2015.
Source - Goldman Sachs (2016)
Is climate change a very serious problem?

The chart shows the percent of respondents across 40 countries who consider climate change is a very serious problem. A global median of 54 per cent consider it a very serious problem, compared with only 45 per cent in US and 41 per cent in UK. Pew (2015).
Urbanisation
Latest wave of urbanisation
Over half of world's population now lives in urban areas, up from 30 per cent in 1950
Context: pace of current wave of urbanisation without precedent - population in cities risen by average of 65 million people p.a. over past 30 years.
Led by emerging economies:
- 17 of world's 22 megacities – with >10 million populations are in emerging economies;
- By 2030, eight of world's 10 largest cities will be in emerging economies (UN, 2013).
Cities also playing more important role in advanced economies:
In US, large metropolitan areas (>1 million inhabitants) have grown twice as fast as smaller metropolitan areas (<250,000 inhabitants), while population living in non-metropolitan areas has seen overall decline in recent years (Frey, 2013).
Traditionally magnets for young, cities are greying:
Number of over 65s in urban areas in OECD countries grew 23.8 per cent over 2001-2011 vs 18.2 per cent in non-urban areas. Growth in older population contrasts with total population increase in cities of just 8.8 per cent over same period (OECD, 2015).
Cities need to review urban design to be attractive for older populations e.g. greater emphasis on public transport vs. private automobiles.
COMPARISON IMAGES OF SHANGHAI
Visual comparison of Shanghai in 1990 versus 2010.
The world's urban and rural populations, 1950-2030
Chart showing the world's urban and rural populations from 1950 projected to 2030. The urban population, starting significantly lower than rural in 1950, is shown to surpass the rural population around 2010 and continue to grow, while rural population growth flattens. Data is in billions.
Source - UNDP (2014)
Urbanisation brings with it important changes in industrial structure, employment, living environment and lifestyle
- Urban life offers greater and more varied consumption and employment opportunities.
- Lack of decent affordable housing means opportunities not even evenly distributed. In 2014, UK house prices per square metre were the second highest in the world, surpassed only by Monaco. Average house price-earnings ratio (6.6) at highest level in eight years (Lloyds Bank, 2016). (See figure on ‘The affordability gap’)
- For some, this means foregone spending on other essentials; for others, it limits affordable housing choices to suburbs or low income areas centred around declining industries (Dix-Carneiro, 2014).
- Growing calls for authorities to build low-cost new homes or introduce rent controls and improve public transport so that individuals can commute to high-growth areas. House prices in South East would be 30 per cent lower than today if planning regulation as permissive as in North East (Hilber and Vermeulen, 2016). (See figure on ‘Client group rate change in London, 2004-14’).
- Medical conditions such as obesity and diabetes also linked to features of urban environments: more high-calorie foods, more passive transportation, less open space, more mass media and less work-related physical activity (worldwide obesity more than doubled over past 30 years).
The affordability gap
The affordability gap in leading world cities, annual
McKinsey Global Institute (2014): housing affordability gap is defined as the difference between the cost of an acceptable standard housing unit which varies by location and what households can afford to pay using no more than 30 per cent of income.
Client group rate change in London, 2004-14
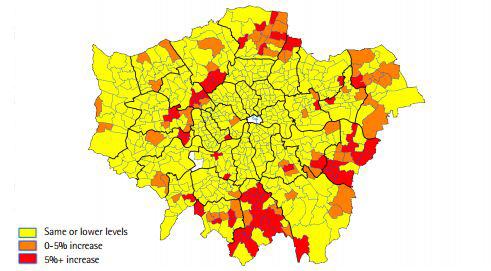
Client group rate measures percentage of working-age people claiming one or more key Department for Work and Pensions benefits. While deprivation is still more concentrated centrally, percentage of most deprived areas is rising rapidly in suburbia. In London there are now more poor people living in outer boroughs than inner ones.
New innovation districts build on strengths of cities
Cities conducive to high-value, knowledge-intensive sectors:
- Proximity allows trust, collaboration and flow of ideas - benefits that dissipate rapidly with distance.
- Large numbers of firms and workers for improved labour pooling and matching.
These features of cities particularly valuable in periods of 'combinatorial innovation' where different inputs - digital, material, process and artistic - can be combined to create new applications.
Urban planners are building these elements into fabric of cities via investment in innovation districts that seek to integrate work, housing, and recreation. These include:
- Offices configured with flexible work spaces e.g. hackable buildings.
- New forms of micro-housing (private spaces typically 300 to 600 square feet) with easy access to larger public spaces.
- Growth of cafes, concerts and art shows providing social context for interactions.
To date innovation districts remain a hypothesis, not a proven development strategy; though with increasing competition for talent between cities, interest is likely to grow – along with potential for blind duplication and overinvestment.
Progress also depends on significant devolution of budgetary and other powers to city-regions, including a greater say for local employers in shaping training and apprenticeships - an agenda that has been impeded by high levels of political and economic centralisation (Emmerich, 2017).
Models of innovation district
| Name | Characteristics | Examples |
|---|---|---|
| Anchor plus | Mixed-use developments centered around major institution i.e. research university or research-oriented medical hospitals and supportive base of firms, entrepreneurs and spin-off companies. Typically found in city downtowns and mid-towns. | * Here East, London (key tenant - BT Sports) * Advanced Manufacturing Innovation District, University of Sheffield |
| Reimagined urban areas | Transformation of once industrial or warehouse areas, enabled by availability of historic building stock, access to transport and proximity to downtown in high rent cities. Sometimes found near or along historic waterfronts. | * Media City, Manchester * Bristol Temple Quarter * Custard Factory, Birmingham |
| Urbanised science park | Leveraging innovation capabilities in suburban and ex-urban areas that have traditionally been isolated and effectively 'urbanising' them with introduction of businesses, housing and restaurants. | * Cambridge Science Park |
Adapted from Katz and Wagner (2014)
Growing demand for infrastructure
Cities becoming 'smarter', leveraging information generated by infrastructure to optimise performance
History shapes design of cities e.g. European cities established mass rail transit systems at turn of 20th Century, while Australia and US built automotive and suburban cities after WW2.
Today, cities are gearing up for more data-led development:
- Bristol (UK) has introduced two city-wide projects - Bristol is Open and SPHERE to monitor interactions, opening up ~200 of city's data sets on traffic flows, energy use, crime and health. It has also built tools to simulate other cities to improve learning.
- Intel and San Jose (US) installing air quality, sound and microclimate sensors to measure particulates in air, noise pollution, and traffic flow.
Smart cities likely to raise demand for digital infrastructure, technology and engineering services and urban planning (UK government expects global smart cities market to be over £245 billion by 2020).
This may imply lower fixed investment relative to previous episodes of urbanisation as technology enables assets to be used more efficiently.
Smart cities may need less commercial real estate per capita e.g. retail, offices and bank branches owing to online alternatives and telecommuting. In areas such as digital infrastructure, greenfield cities may be able to leapfrog to cheaper and newer technologies.
↔
Transport and energy will still likely require significant capital outlays, notwithstanding changes in materials, civil construction and better information flow. Cities with legacy investments may find it harder and costlier to upgrade.
The smart cities agenda has increasingly come to focus on sustainability and resilience.
- This is often played out through environmental consideration and innovations.
- European cities produce most waste per capita at 511kg compared with 465kg in Latin America and 405kg in Africa.
- US and Canadian cities recycle more than European cities at 26 per cent compared to 18 per cent of waste.
- Scope for additional policy focus and investment in 'greening' of both US and Canadian and European cities.
Libelium Smart World
Source - Siemens Green City (2015)
CO₂ Emissions: The US & Canada Index cities have higher per capita CO₂ emissions the Europe and Asia combined. The infographic displays CO₂ emissions per person (in metric tons): 14.5 t UC, 5.2 t EU, 4.6 t AS.
Infrastructure investment as percentage of GDP has declined in UK and US
Emerging economies projected to account for 60 per cent of global infrastructure investment (~$2 trillion per annum) 2016-20; however, advanced economies also face challenges.
UK gross government investment in infrastructure lower than peers but has picked up since 2013. Levels remain low even after accounting for rising private spending following privatisation and liberalisation of the 1980s (OECD, 2015).
Gross government fixed capital formation
Line chart showing Gross government fixed capital formation as a Percentage of GDP for United Kingdom, United States, and France from 1971 to 2010. The UK and US show a general decline and lower levels compared to France, with a slight upturn in the UK after 2000.
Source - OECD (2015)
Quality of infrastructure deteriorating too
In UK, roads and railways are perceived to be of low quality; despite progress in rollout of high-speed digital services, it trails leading countries in the uptake of fast and ultrafast fixed broadband. Electricity generating market viewed as providing poor value for money.
McKinsey Global Institute (2016) estimates that UK and US will need to raise infrastructure spending by 0.4 and 0.7 percentage point of GDP respectively each year to support current growth projections.
Quality of overall infrastructure, 2015-2016, 1 to 7 (best)
Bar chart comparing the Quality of overall infrastructure for 2015-2016 and 2005-2007 across various countries. Countries are listed on the x-axis, and a scale from 4.5 to 7.0 (best) is on the y-axis. Switzerland and Netherlands consistently rank highest, while United Kingdom, Norway, and Australia show lower rankings and some decline from 2005-2007 to 2015-2016.
Source - WEF
Infrastructure quality vs. Spending
Scatter plot showing Infrastructure quality relative to income Index (y-axis, from -1.2 to 1.2) against Infrastructure spending gap % of GDP (x-axis, from -3.0 to 3.0). Countries are plotted in quadrants indicating high/low quality and high/low spending. Japan and Switzerland are in the "High quality, high spending" quadrant. United Kingdom and United States are in the "High quality, low spending" quadrant.
Source - McKinsey Global Institute (2016) Difference between historical spending levels from 2008-13 and the investment spending as a share of GDP that will be needed in 2016-30
Over next 15 years, ongoing debates about role of fiscal policy will shape outlook for infrastructure investment
Austerity and concerns about debt sustainability have limited scope for fiscal policy. However, signs that fiscal easing is moving up political agenda, prompted by:
- Continued slow growth.
- Low borrowing costs.
- Recognition of limits and risks of further monetary stimulus.
- Growing appetite for infrastructure projects from institutional investors.
Impacts:
Closing UK infrastructure gap in next 15 years would have powerful stimulus effect, assuming project pipeline and regulatory barriers are addressed (McKinsey Global Institute, 2016).
However, looking ahead, how much investment occurs constrained by competing calls on public purse, lack of political consensus and difficulties in making cost-benefit case for next-generation infrastructure. Support for additional spending on research, expansion of benefits for low- and middle-income households combined with steps to offset age-related spending may have more traction.
Increasing inequality
Inequality and its drivers
Gap between rich and poor in advanced economies highest in decades: ex-President Obama's 'defining challenge of our times'
Measures of overall inequality based on Gini coefficients of incomes have increased since mid-80s in most developed economies, though have levelled off more recently. Evidence finds that two-thirds of this increase arises from growing wage gap between high-paying and low-paying firms.
Top 1 per cent has experienced largest gains:
In UK and US, share of income more than doubled since 1980 to around 15 per cent.
Picture even starker with respect to wealth:
Top 1 per cent's share of wealth now around one-third – more than bottom half of population put together. Wealth dynamics are driven largely by increases in house prices.
Middle class squeeze:
Distribution of labour income has shifted towards higher and lower ends of distribution, squeezing income share going to middle.
Being in work not necessarily a guarantee against poverty:
In UK, two-thirds of children growing up in poverty live in household where at least one parent works (IFS, 2016).
Gini coefficients of income inequality, mid-1980s and 2013, or latest date available
Source – OECD
Top 1 per cent and bottom 90 per cent of wealth distribution, 1980-2010
Source – IMF (2015)
A number of factors have driven this higher inequality
- Rising skills premia.
- Superstar effects supported by technology allow top performers to capture larger share of returns.
- Rising concentration and monopoly power in sectors like finance and insurance, retail and transport accounting for higher profit share, and supported by lower rates of firm entry.
- Declining unionisation.
- Regressive taxation.
- Changes in corporate governance favouring executives.
However, changing demographics may work against rising inequality in future:
- Larger labour force in 1970s and '80s, underpinned by integration of low- and middle-income countries into global economy, drove real wages lower and inequality higher in advanced economies. As labour force ages and labour force growth weakens, real wage growth may increase.
Uncertain outlook for future investment returns may also limit inequality (financial and real assets disproportionately owned by the rich).
Overall, good reasons to think inequality will persist - history suggests delivering deep and lasting reductions in inequality may be difficult in the absence of violent shocks (Scheidel, 2017).
Still inequality is becoming harder to ignore politically:
- Consider growing interest in radical ideas such as basic income e.g. pilots in Finland and Utrecht.
Macro and microeconomic impacts
Macroeconomic relationship between inequality and growth contested - recent studies highlight costs of rising inequality
Channels highlighted in literature include:
Sustainability
Unequal societies can enjoy spells of rapid growth; however, these tend to be shorter-lived. Regions and countries with high levels of inequality may be more divided and less able to deal with external shocks. (See chart on 'Effect of increase of different factors on growth spell duration')
Demand
Affluent households have lower propensity to consume which means that higher inequality may dampen aggregate consumption, which may in turn disincentivise innovation. This economic drag may have been concealed in past by unsustainable expansion in credit among lower income groups.
Social mobility
Lower-income households may be unable to afford higher education resulting in less human capital accumulation. Countries with higher levels of income inequality tend to have lower levels of mobility between generations with implications for efficient allocation of talent. (See chart on ‘Income equality and social mobility')
Effect of increase of different factors on growth spell duration
Source – Berg and Ostry (2011) For each variable the length of the bar shows the percentage increase in growth spell duration resulting from an increase in that variable from the 50th to the 60th percentile, with other variables at the 50th percentile. A 10 percentile improvement in the Gini coefficient from 0.40 to 0.37 increases the expected length of a growth spell by 50 per cent.
Income equality and social mobility
Source – Corak (2013)
Increasing inequality will have microeconomic implications too
- Increasing inequality and poverty may contribute to greater health and social problems, raising demand for healthcare and social services.
- Occupations dedicated to protecting property rights and managing conflict like police, lawyers and security larger in countries with higher levels of income inequality (Bowles, 2012).
- Increasing disparities in income mirrored by disparities in consumption, particularly of non-durables and services such as education and childcare (Aguiar and Bils, 2015).
- Lower income groups have seen disposable incomes rise slightly since financial crisis, in contrast to higher income groups. Rent, however, has increased as percentage of household income, eating into disposable income.
This may have tempered non-housing consumption growth among lower income groups. Product categories that would benefit most strongly from a more widely shared recovery include food for off-premise consumption, vehicles, recreational goods, healthcare, clothing and footwear.
Political uncertainty
Economic impacts of uncertainty
Decisions that impact on labour markets sensitive to domestic political and geopolitical uncertainty
- Uncertainty increases cost of capital, which lowers desired capital stocks and investment.
- Uncertainty also creates an option value for agents of waiting to invest in cases where economic decisions involve sunk costs, such as when firms delay investing in new technologies, households put off purchasing big ticket items and individuals are reluctant to invest in cutting-edge skills. Decisions that can be more easily reversed will be less affected: uncertainty tends to have greater impact on business investment than employment.
-
Uncertainty also harms productivity by hindering reallocation of resources from low to high productivity firms.
-
Way in which managers are remunerated may amplify negative effects of uncertainty. Evidence suggests that when equity-based compensation becomes more important - exposing managers to greater firm-specific risks - investment falls (Panousi and Papanikolaou, 2012).
Rising political uncertainty?
Indicators of geopolitical uncertainty have doubled after 9/11
Heightened geopolitical risks even if terms related to terrorism and Middle East are excluded. Sectors like oil and gas, aviation and tourism particularly exposed to geopolitical instability.
Benchmark Geopolitical Risk Index
Source - Caldara and Iacoviello (2016). Index based on references in 11 newspapers to 99 phrases related to actual geopolitical events and geopolitical threats
Three-fold increase in policy uncertainty post-financial crisis in UK
Rising policy uncertainty refers to the weakening in remits, frameworks and institutional structures that enable authorities to act credibly and consistently.
Evidence suggests that migration-related fears spillover into policy uncertainty. Since 2005, these fears have trended upward strongly. Measures of migration fear today twice as high as they were in late 1990s - period that coincided with Kosovo War and refugee crisis as well as Tony Blair's promise of tougher immigration controls (Bloom et al., 2016).
Rising populism e.g Brexit and President Trump election has reinforced both these trends.
United Kingdom economic policy uncertainty: all Brexit/EU
Source - Baker, Bloom and Davis (2016) UK post-2001 index constructed from daily count of articles from 650 national and local UK newspapers that contain terms related to economics, uncertainty, and policy terms like 'deficit', 'regulation', or terms relating to fiscal and monetary policy.
This depresses economic activity in sectors that are capital-intensive and/or exposed to government
An increase in policy uncertainty comparable to that experienced from 2005 to end-2011 is associated with the following impacts:
- 1.2 per cent decline in industrial production.
- 6 per cent decline in gross investment.
- 0.5 per cent decline in employment (Baker, Bloom and Davis, 2016).
Declines bottom out after 12-18 months and converge only slowly back to trend.
Impacts of increased uncertainty largest in sectors like defence, finance, construction, engineering and healthcare that require extensive investment commitments and/or have high government exposure.
Policy uncertainty may also threaten trade: 1 per cent increase in uncertainty is associated with a 0.02 pp. reduction in goods and services trade volume growth (Constantinescu et al., 2017).
Drivers of policy uncertainty
Growth in government spending, taxes, and regulation, while often beneficial, can raise policy-related uncertainty by adding to complexity of environment in which businesses make decisions.
Policymakers' actions can become more uncertain in times of trouble. When economy doing well, governments prefer to stick with policies which appear successful. When conditions weaken, they may look to experiment with new ways to restore growth.
Growing interconnections and interdependencies in global economy mean there are multiple pathways through which risks can spread when systems fail. The ubiquity of communications mean that people can mobilise and ideas spread across borders with much greater speed e.g. Arab Spring.
Geopolitical landscape characterised by a greater distribution of power that has strained the capacity of the international system to provide public goods and respond effectively to a host of security and economic challenges.
Sources OECD (2011) Pastor and Veronesi (2012) Davis (2015)
Drivers of policy uncertainty
Political institutions can drive policy uncertainty
Political landscape in UK less polarised than US, but may hide deep divisions: main parties have in recent years elected moderate leaders. However, centrism leaves many voters without voice and dissatisfied as seen in falling levels of election turnout, party membership and trust in politicians (Ford, 2014).
Problem exacerbated by first-past-the-post voting which struggles with an electorate wanting to back more and more parties over time.
Electoral landscape also dominated by safe seats, with little competition for votes within them. With little ability to shape outcomes, voters may have few incentives to become informed about choices (Milazzo, 2015).
Danger that if political and economic differences are suppressed, may generate disaffected voters and insurgent politicians, who react against a system which they perceive as not reflecting their interests, raising policy uncertainty e.g. Brexit.
Proportionality of elections over time
Source - Blumenau et al., (2015) The chart shows the 'proportionality' of elections in the UK since 1945: where a score of 100 means that each party wins exactly the same proportion of seats in the House of Commons as its proportion of votes
Do you think that British politicians are out merely for themselves, for their party, or to do their best for their country?
Source - Jennings et al., (2014) Survey question originally asked by Gallup in 1944 and replicated by YouGov/University of Southampton.
References
Technological change
Acemoglu, D., Autor, D., Dorn, D., Hanson, G. and B. Price (2014) 'Return of the Solow Paradox? IT, Productivity, and Employment in US Manufacturing', American Economic Review: Papers & Proceedings 2014, 104(5): 394-399.
Acemoglu, D. and P. Restrepo 'The Race Between Machine and Man: Implications of Technology for Growth, Factor Shares and Employment', NBER Working Paper No. 22252.
Armstrong, S., Sotala, K. and S. O'Heigeartaigh (2014) 'The errors, insights and lessons of famous AI predictions - and what they mean for the future', Journal of Experimental & Theoretical Artificial Intelligence, Volume 26, Issue 3.
Arntz, M., Terry, G. and U. Zierahn (2016) 'The Risk of Automation for Jobs in OECD Countries: A Comparative Analysis', OECD Social, Employment and Migration Working Papers.
Autor, D., Levy, F. and R. Murnane (2003) 'The Skill Content of Recent Technological Change: An Empirical Exploration,' The Quarterly Journal of Economics, 118(4): 1279-1333.
Autor, D. (2015), 'Why Are There Still So Many Jobs? The History and Future of Workplace Automation', Journal of Economic Perspectives, 29(3), pp. 3-30.
Baumol, W., Malach, M., Pablos-Mendez, A., Wu, L. and D. De Ferranti (2013) The Cost Disease: Why Computers Get Cheaper and Health Care Doesn't, Yale University Press.
Becker, S. and M. Muendler (2015), 'Trade and tasks: An Exploration over Three Decades in Germany', Economic Policy, 30(84): 589-641.
Beaudry, P., Green, D and B. Sand (2016) 'The Great Reversal in the Demand for Skill and Cognitive Tasks,' Journal of Labor Economics Vol.34, no.1 pp.199-247.
Berg, M. (1980) The Machinery Question and the Making of Political Economy, 1815-1848, Cambridge University Press
Berger, T. and Frey, C.B. (2015) 'Industrial Renewal in the 21st Century: Evidence from US Cities?', Oxford Martin School Working Paper.
Bessen, J. (2015), Learning by Doing: The Real Connection between Innovation, Wages, and Wealth, Yale University Press, New Haven.
Bloom, N., Jones, C., Van Reenan, J. and Webb, M. (2016) 'Are Ideas Getting Harder to Find?', mimeo.
Bix, A. Inventing Ourselves Out of Jobs?: America's Debate over Technological Unemployment, 1929-1981, Johns Hopkins University Press. Blackrock Investment Institute (2014) 'Interpreting Innovation'.
Bonnefon, J., Shariff, A. and I. Rahwan (2015) 'The social dilemma of autonomous vehicles', Science, Vol. 352, Issue 6293, pp. 1573-1576.
Botsman, R. and R. Rogers (2011) What's Mine Is Yours: The Rise of Collaborative Consumption, HarperCollins Business
Brynjolfsson, Erik, Hitt, Lorin M., and Yang, Shinkyu (2002). 'Intangible Assets: Computers and Organizational Capital,' Brookings Papers on Economic Activity no. 1, 137-81.
Brynjolfsson, Erik and Andrew McAfee (2014), The second machine age: work, progress, and prosperity in a time of brilliant technologies, WW Norton & Company.
Carson, R. (2016) 'Estimating the biotech sector's contribution to the US economy', Nature Biotechnology 34 pp. 247-255.
Caselli, Francesco (1999) 'Technological Revolutions,' American Economic Review, 89(1): 78-102.
Comin, D. and B. Hobijn (2009) 'Lobbies and technology diffusion, The Review of Economics and Statistics', 91(2): 229-244.
Comin, D. and M. Mestieri (2013) 'Technology Diffusion: Measurement, Causes and Consequences' NBER Working Paper No. 19052.
DARPA (2016) 'Fun LoL to Teach Machines How to Learn More Efficiently'.
David, P. and G. Wright (2003) 'General Purpose Technologies and Productivity Surges: Historical Reflections on the Future of the ICT Revolution' in The Economic Future in Historical Perspective, eds. Paul A. David and Mark Thomas, Oxford University Press.
Davis, E, and G. Marcus (2015) 'Commonsense Reasoning and Commonsense Knowledge in Artificial Intelligence', Communications of the ACM, Vol. 58 No. 9, Pages 92-103.
Deming, D. (2015) 'The Growing Importance of Social Skills in the Labor Market', NBER Working Paper No. 21473.
Doucouliagos, H. and P. Laroche (2012) 'Unions, Innovation, and Technology Adoption: New Insights from the Cross-Country Evidence', Working Paper.
Farrell, D. and Greig, F. (2016) 'Paychecks, Paydays, and the Online Platform Economy: Big Data on Income Volatility' JP Morgan Chase & Co. Institute.
Fernald, J. (2014). Productivity and Potential Output Before, During, and After the Great Recession, NBER Working Paper No. 20248.
Frey, C.B. and M.A. Osborne (2013), The Future of Employment: How Susceptible are Jobs to Computerization?, Oxford Martin School Working Paper.
Goldin, Claudia and Lawrence F. Katz (2008) The Race between Education and Technology, Harvard University Press: Cambridge.
Goldman Sachs (2016) 'Data is Everywhere', Fortnightly Thoughts, Issue 111.
Goos, M., Konings, J. and M. Vandeweyer (2015), 'Employment growth in Europe: The roles of innovation, local job multipliers and institutions', Utrecht School of Economics Discussion Paper Series, Vol. 15/10, Utrecht.
Gordon, R. (2016) The Rise and Fall of American Growth: The U.S. Standard of Living since the Civil War, Princeton University Press. Volume 12, NBER.
Government Office of Science (2014) 'The Internet of Things: Making the Most of the Second Digital Revolution: A report by the UK Government Chief Scientific Adviser'.
Graetz, G. and G. Michaels (2015) 'Robots at Work', CEPR Discussion Paper 10477.
Gregory, T., A. Salomons, and U. Zierahn (2016) 'Technological Change and Regional Labor Market Disparities in Europe', Centre for European Economic Research.
Haldane, A. (2017) 'Productivity puzzles', Speech given at the London School of Economics.
Haltiwanger, J. (2012) Job Creation and Firm Dynamics in the United States' chapter in Lerner, J and S. Stern, eds. Innovation Policy and the Economy, Volume 12, NBER.
Handel, Michael (2012) 'Trends in Job Skill Demands in OECD Countries, OECD Social, Employment and Migration Working Papers.
Harris, S. and A. Krueger (2015) 'A Proposal for Modernizing Labor Laws for Twenty-First-Century Work: The 'Independent Worker", The Hamilton Project.
Hendel, Igal and Yossi Spiegel (2014) 'Small Steps for Workers, a Giant Leap for Productivity', American Economic Journal: Applied Economics, Vol. 6 No.1 pp. 73-90.
Hoffman, W., and L. Furcht (2014) The Biologist's Imagination: Innovation in the Biosciences, Oxford University Press.
Holzer, H. (2015) Job Market Polarization and U.S. Worker Skills: A Tale of Two Middles' Brookings Institution Economic Studies.
Inanc, Hande, Felstead, Alan, Gallie, Duncan and Francis Green (2012) 'Job Control in Britain First Findings from the Skills and Employment Survey 2012'.
Jones, B. (2009) 'The Burden of Knowledge and the 'Death of the Renaissance Man': Is Innovation Getting Harder?', Review of Economic Studies 76, 1: 283-317.
Jones, Charles (2016) 'Life and Growth', Journal of Political Economy, April 2016, Vol. 124 (2), pp. 539-578.
Joyce, S., A Mazza and S. Kendall (2013) Positioning Synthetic Biology to Meet the Challenges of the 21st Century, National Academies Press.
Juma, Calestous (2016) Innovation and Its Enemies: Why People Resist New Technologies, Oxford University Press.
Keasling, J. (2015), 'Building an opportunity space for synthetic biology', International Innovation 185, 24-25.
Katz, L. and A. Krueger (2016) 'The Rise and Nature of Alternative Work Arrangements in the United States, 1995-2015', Working Paper.
Kirkby, J. and T. Davenport (2016) Only Humans Need Apply: Winners and Losers in the Age of Smart Machines, HarperCollins Press.
Lin, Jeffrey (2011) 'Technological Adaptation, Cities, and New Work' Review of Economics and Statistics, 93(2): 554-574.
McKinsey Global Institute (2013) 'Disruptive technologies: Advances that will transform life, business, and the global economy'.
Mokyr, Joel (1990) The Lever of Riches: Technological Creativity and Economic Progress, Oxford University Press: New York.
Mokyr, Joel, Vickers, Chris and Nicolas Ziebarth (2015) 'The History of Technological Anxiety and the Future of Economic Growth: Is This Time Different?' Journal of Economic Perspectives Vol.29, No.3 pp.31-50.
Moretti, Enrico. 2010 'Local Multipliers' American Economic Review, 100(2): 373-77.
Morgan Stanley (2014) 'The 'Internet of Things' Is Now: Connecting the Real Economy', Morgan Stanley Blue Paper.
Nuzzo, C. and J. Alford (2016) 'Worth Sharing?', Morgan Stanley.
OECD (2015) The Future of Productivity, OECD Publishing.
OECD (2015) Fiscal Sustainability of Health Systems: Bridging Health and Finance Perspectives, OECD Publishing.
OECD (2016) Enabling the Next Production Revolution: The Future of Manufacturing and Services - Interim Report', Meeting of the OECD Council at Ministerial Level.
OECD (2016) Skills Matter, OECD Publishing.
OECD (2016) Compendium of Productivity Indicators, OECD Publishing.
OECD (2016) 'ICT and Jobs: Complements or Substitutes? The Effects of ICT Investment on Labour Demand by Skills and by Industry in Slected OECD Countries', Working Party on Measurement and Analysis of the Digital Economy.
Oliver Wyman (2015) 'The Internet of Things: Disrupting Traditional Business Models'.
Pfeiffer, S. and A. Suphan (2015), 'The Labouring Capacity Index: Living Labouring Capacity and Experience as Resources on the Road to Industry 4.0', Working Paper 2015, No. 2, University of Hohenheim.
Philp, J. (2015), 'Balancing the Bioeconomy: Supporting Biofuels and Bio-based Materials in Public Policy', Energy and Environmental Science 8, 3063-3068.
Pidgeon, N., Kasperson, R. and P. Slovic eds. (2003) The Social Amplification of Risk, Cambridge University Press.
Pratt, G. (2015) 'Is a Cambrian Explosion Coming for Robotics?', Journal of Economic Perspectives, 29(3), pp. 51-60.
Remus, D, and F. Levy (2015) 'Can Robots Be Lawyers? Computers, Lawyers, and the Practice of Law', mimeo.
Smith S., Newhouse J., and M. Freeland (2009) 'Income, insurance, and technology: why does health spending outpace economic growth?', Health Affairs, Vol.28, No. 5, pp. 1276-84.
Spitz-Oener, A. (2006), 'Technical Change, Job Tasks, and Rising Educational Demands: Looking outside the Wage Structure', Journal of Labor Economics, Vol. 24, pp. 235-270.
Summers, L. (2014), 'Reflections on the 'New Secular Stagnation Hypothesis" chap. 1, pp. 27-38, Secular Stagnation: Facts, Causes and Cures, CEPR Press.
Sundararajan, Arun (2016) The Sharing Economy: The End of Employment and the Rise of Crowd-Based Capitalism, MIT Press.
Syverson, C. (2016) 'Challenges to Mismeasurement Explanations for the U.S. Productivity Slowdown', NBER Working Paper No. 21974.
Weil, D. (2014) The Fissured Workplace: Why Work Became So Bad for So Many and What Can Be Done to Improve It., Harvard University Press.
Winner, L. (1977) Autonomous Technology: Technics-out-of-Control as a Theme in Political Thought, MIT Press.
Woirol, G. (1996) The Technological Unemployment and Structural Unemployment Debates, Greenwood Publishing.
Zervas, G., Proserpio, D. and Byers, J. (2016) 'The rise of the sharing economy: Estimating the impact of Airbnb on the hotel industry', Boston U. School of Management Research Paper.
Zurutuza, A. and C. Marinelli (2014) 'Challenges and Opportunities in Graphene Commercialization', Nature Nanotechnology 9 pp. 730-734
Globalisation
Acemoglu, D., Autor, D., Dorn, D., Hanson G. and B. Price (2016) 'Import Competition and the Great US Employment Sag of the 2000s', Journal of Labor Economics, Vol. 34, No. 1, pp. 141-198.
Agénor, P.. Otaviano, C. and M. Jelenic (2012) 'Avoiding Middle-Income Growth Traps', Economic Premise No. 98.
Aizenman, J. and Y. Jinjarak (2013) 'Real-estate valuation, current-account and credit growth patterns, before and after the 2008-09 Crisis', Journal of Urban Economics 66(2), 75-89.
Arkolakis, C., Costinot, A. and A. Rodríguez-Clare, 'New Trade Models, Same Old Gains?,' American Economic Review, Vol. 102 (1), 94-130.
Autor, D., Dorn, D. and G. Hanson (2015) 'Untangling Trade and Technology: Evidence from Local Labour Markets', The Economic Journal, 125 pp. 621-646.
Autor, D., Dorn, D., Hansen, G. and K. Majlesi (2016) 'Importing Political Polarization? The Electoral Consequences of Rising Trade Exposure', CEPR Discussion Paper 11511.
Baily, M. and B. Bosworth (2014) 'US Manufacturing: Understanding Its Past and Its Potential Future', Journal of Economic Perspectives, Vol. 28 No. 1 pp. 3-26.
Bernard, A. and T. Fort (2015) 'Factoryless Goods Producing Firms', American Economic Review, Vol. 105 (5) pp. 518-523.
Brainard, S. (1997) 'An Empirical Assessment of the Proximity-Concentration Trade-off Between Multinational Sales and Trade', American Economic Review Vol. 87 (4): 520-544.
Caliendo, L., Dvorkin, M. and F. Parro (2015) 'Trade and Labor Market Dynamics', Research Division Federal Reserve Bank of St. Louis Working Paper 2015-009C.
Celasum, O., Di Bella G., Mahedy, T. and C. Papageorgiou (2014) 'The US Manufacturing Recovery: Uptick or Renaissance?'. IMF Working Paper WP/14/28.
Charles, K., Hurst, E. and M. Notowidigo (2016) 'The Masking of the Decline in Manufacturing Employment by the Housing Bubble', Journal of Economic Perspectives, Vol. 30, No.2 pp.179-200.
Chor, D. (2010) 'Unpacking Sources of Comparative Advantage: A Quantitative Approach,' Journal of International Economics, November 2010, 82 (2), 152-67.
Colantone, I. and P. Stanig (2016) 'Global competition and Brexit', BAFFI CAREFIN Centre Research Paper 2016-44, November.
Constantinescu, C., Mattoo, A. and M. Ruta (2016) 'The Global Trade Slowdown: Cyclical or Structural?', IMF Working Paper WP/15/6.
Credit Suisse (2015) 'The End of Globalization or a more Multipolar World?'.
Crowley, M,, Song, H. and N. Meng (2016) 'Tariff Scares: Trade policy uncertainty and foreign market entry by Chinese firms', CEPR Discussion Paper no. 11722.
De Backer, K., Menon, C., Desnoyers-James, I. and L. Moussiegt (2016) 'Reshoring: Myth or Reality?', OECD Science, Technology and Industry Policy Papers No.27.
Economic Report of the President (2014).
Edwards, L. and R. Lawrence (2013) Rising Tide: Is Growth in Emerging Economies Good for the United States?, Peterson Institute for International Economics.
European Central Bank (2016) 'The slowdown in emerging market economies and its implications for the global economy', ECB Economic Bulletin, Issue 3, Article 1.
Evenett, S. (2013) 'Five More Years of the G20 Standstill on Protectionism?', VoxEU, 3 September 2013.
EY (2015) 'Reshoring Manufacturing - Time to Seize the Opportunity'.
Feyrer, J. (2009) 'Distance, Trade, and Income-The 1967 to 1975 Closing of the Suez Canal as a Natural Experiment', NBER Working Paper No. 15557.
Fontagné, L., Gaulier, G. and Zignago, S. (2008) 'Specialization across Varieties and North-South Competition', Economic Policy 53.
Frankel, J. and D. Romer (1999) 'Does Trade Cause Growth?', American Economic Review 90, no. 3: 379-99.
Frankel, J. (2016) 'Globalization and Chinese Growth: Ends of Trends?', Harvard Kennedy School Working Paper No. 16-029.
Freund, C, (2009), 'The Trade Response to Global Downturns: Historical Evidence', World Bank Policy Research Working Paper No. 5015.
Gill, I. and H. Kharas (2007) 'An East Asian Renaissance: Ideas for Economic Growth', World Bank.
Goldman Sachs (2013) 'What the World Wants', Global Economics Paper No. 220.
Goldman Sachs (2016) 'Trade Trends', Global Macro Research, Issue 49.
Goldman Sachs (2016) 'Factory of the Future: Beyond the Assembly Line', Equity Research.
Goni, E. and W. Maloney (2014) 'Why Don't Poor Countries Do R&D', World Bank Policy Research Working Paper 6811.
Haldane, A. (2010) 'Global imbalances in retrospect and prospect', Speech at the Global Financial Forum, Chatham House Conference on 'The New Global Economic Order'.
Hanson, G. (2012) 'The Rise of Middle Kingdoms: Emerging Economies in Global Trade', Journal of Economic Perspectives Vol. 26, no. 2:41-64.
Hanson, G. (2016) 'The Dynamics of Comparative Advantage', mimeo.
Hidalgo, C., Klinger, B., Barabási, A. and R. Hausmann (2007) 'The Product Space Conditions the Development of Nations', Science, Vol. 317, Issue 5837, pp. 482-487.
Ho, G. and P. Mauro (2014) 'Growth: Now and Forever?', IMF Working Paper WP/14/117.
HSBC (2015) 'HSBC Global Connections Trade Forecast: United States'.
Im, F. and D. Rosenblatt (20130 'Middle-Income Traps A Conceptual and Empirical Survey', World Bank Policy Research Working Paper 6594.
Jensen, B. (2011) Global Trade in Services: Fears, Facts and Offshoring, Peterson Institute for International Economics.
Jensen, B. (2015) 'The Tradability of Services: Geographic Concentration and Trade Costs', Peterson Institute for International Economics Working Paper 15-12.
Jensen, B., Quinn, D. and S. Weymouth (2016) 'Winners and Losers in International Trade: The Effects on U.S. Presidential Voting', NBER Working Paper No. 21899.
Keller, W. and S. Yeaple (2009) 'Global Production and Trade in the Knowledge Economy', CEPR Discussion Paper 7175.
Kharas, H. (2010) 'The Emerging Middle Class in Developing Countries', OECD Development Centre Working Paper No. 285.
Kneller, P. (2013) 'What are the constraints on potential UK exporters?', Future of Manufacturing Project: Evidence Paper 17, Government Office for Science.
Leamer, E. (2007) 'A Flat World, a Level Playing Field, a Small World After All, or None of the Above? A Review of Thomas L Friedman's The World is Flat', Journal of Economic Literature, Vol.45, No.1 pp.83-126.
Lewer, J. and H. Van Der Berg (2003) 'How Large Is International Trade's Effect on Economic Growth?', Journal of Economic Surveys, Volume 17, Issue 3, pp. 363-396.
Lombard Street Research (2014) 'The Slow Motion EM Crisis', LSR View.
Margalit, Y. (2011) 'Costly Jobs: Trade-Related Layoffs, Government Compensation, and Voting in U.S. Elections', American Political Science Review 105, no. 1: 166-88.
McKinsey Global Institute (2012) 'Manufacturing the future: The next era of global growth and innovation'.
McKinsey Global Institute (2013) 'Game changers: Five Opportunities for US Growth and Renewal'.
Mellick, W. (2014) 'The Energy Boom and Manufacturing in the United States', Board of Governors of the Federal Reserve Board International Finance Discussion Papers No. 1108.
Miguelez, E. and C. Fink (2013) 'Measuring the International Mobility of Inventors: A New Database', WIPO Economics & Statistics Series Working Paper No.8.
Peng, M. and K. Meyer (2013) 'Winning the Future Markets for UK Manufacturing Output', Future of Manufacturing Project: Evidence Paper 25, Government Office for Science.
Pettis, M. (2013) The Great Rebalancing: Trade, Conflict, and the Perilous Road Ahead for the World Economy, Princeton University Press.
Prasad, E. (2011) 'Rebalancing Growth in Asia', International Finance. 14:27-66.
Pritchett, L. and L. Summers (2013) 'Asiaphoria Meet Regression to the Mean,' Harvard University mimeo.
PWC (2014) 'Reshoring a New Direction for the UK economy'.
PWC (2015) 'The Future Shape of UK Exports', UK Economic Outlook November 2015.
Rodrik, D. (1999) 'Why Do More Open Economies Have Bigger Governments?', Journal of Political Economy Vol. 106, No. 5, pp. 997-1032.
Rodrik, D. (2015) 'Premature Deindustrialization', NBER Working Paper No. 20935.
Sa, F. and T. Wieladek (2015) 'Capital Inflows and the U.S. Housing Boom', Journal of Money, Credit and Banking, Volume 47, Issue 1 pp. 221-256.
Sharma, R. (2016) Breakout Nations: In Pursuit of the Next Economic Miracles, Allen Lane.
Sirkin, H., Xinser, M. and J. Rose (2014) 'The Shifting Economics of Global Manufacturing: How Cost Competitiveness is Changing', Boston Consulting Group.
Tassey, G. (2014) 'Competing in Advanced Manufacturing: The Need for Improved Growth Models and Policies.' Journal of Economic Perspectives, 28(1): 27-48.
Demographic change
Abeliansky, A. and K. Prettner (2017) 'Automation and Demographic Change', Hohenheim Discussion Papers in Business, Economics and Social Sciences, No. 05-2017.
Abrams, D., Swift, H., Lamont, R. and L. Drury (2015) 'The barriers to and enablers of positive attitudes to ageing and older people, at the societal and individual level', Government Office for Science, Future of an Ageing Population: Evidence Review.
Acemoglu, D. and P. Restrepo (2017) 'Secular Stagnation? The Effect of Aging on Economic Growth in the Age of Automation', mimeo.
Agarwal, S., Driscoll, J., Gabaix, X. and D. Laibson 'The Age of Reason: Financial Decisions over the Life Cycle and Implications for Regulation', Brookings Papers on Economic Activity, Fall 2009 pp. 51-117.
Arnott, D. and D. Chaves (2012) 'Demographic Changes, Financial Markets, and the Economy', Financial Analysts Journal, Vol.68, No.1 pp. 23-46.
Aguiar, M., Bils M., Charles K. and E. Hurst (2016) 'Leisure Luxuries and the Labor Supply of Young Men', mimeo.
Bank of America Merrill Lynch (2015) 'Generation Next - Millennials Primer'.
Bank of America Merrill Lynch (2016) 'The Silver Economy - Global Ageing Primer'.
Barclays (2014) 'An Ageing Population: The Untapped Potential for Hospitality and Leisure Businesses'.
BCG (2012) 'The Millennial Consumer: Debunking Stereotypes'.
Benito, A. and P. Bunn (2011) 'Understanding Labour Force Participation in the United Kingdom', Bank of England Quarterly Bulletin.
Benartzi, S. and R. Thaler (2007) 'Heuristics and Biases in Retirement Savings Behavior,' Journal of Economic Perspectives 21, no. 3 (2007): 81-104.
Berry, S., Corder, M., Duffy, C., Hacksworth, C. and B. Speigner (2015) 'Trends in UK Labour Supply', Bank of England Quarterly Bulletin.
Blakely, S. (2016) 'What Moves the Retirement Readiness Needle: Quantification and of Risk and Evaluation', Employee Benefit Research Institute Notes, Vol.37, No.5.
Council of Economic Advisers (2014) '15 Economic Facts about Millennials'.
Credit Suisse (2011) 'Longer Lives, Changing Life Cycles: Exploring Consumer and Worker Implications'.
Credit Suisse (2015) 'Demographic Focus - Changing Global Consumers'.
Davis, S. and J. Haltiwanger (2014) 'Labor Market Fluidity and Economic Performance', NBER Working Paper No. 20479.
Deloitte (2016) 'Passion for leisure A view of the UK leisure consumer'.
De Mello, L., Schotte, S., Tiongson E. and H. Winkler (2016) 'Greying the Budget: Ageing and Preferences Over Public Policies', IZA Discussion Paper No. 9681.
Deutsche Bank (2013) 'Long-Term Asset Return Study A Nominal Problem'.
Erixon, F. and B. Weigel (2016) The Innovation Illusion: How So Little is So Many Working Hard, Yale University Press.
European Commission (2015) 'Growing the European Silver Economy', Background Paper.
Evennett, C. and J. Barlow (2013) 'Twenty-thirty: Healthcare Scenarios: Exploring Potential Changes in Healthcare in England over the next 20 years', Policy Innovation Research Unit.
Freeman, R.B. (2015) ''Who Owns the Robots Rules the World', IZA World of Labor.
Forbes, K. (2016) 'A Tale of Two Labour Markets: the UK and US', Speech given at the Henry Jackson Society.
Gennaioli, N., Shleifer, R. and R. Vishny (2015) 'Money Doctors', Journal of Finance, Volume 70, Issue 1 pp. 91-114.
Goodhart, C., Pradhan, M. and P. Pardeshi (2015) 'Could Demographics Reverse Three Multi-Decade Trends?' Morgan Stanley Research.
Giuliano, P. and A. Spilimbergo (2009) 'Growing Up in a Recession: Beliefs and the Macroeconomy', NBER Working Paper No. 15321.
Gratton, L. and A. Scott (2016) The 100-Year Life: Living and Working in an Age of Longevity, Bloomsbury Information Ltd.
Hacker, J. and A. O'Leary eds. (2012) Shared Responsibility, Shared Risk: Government, Markets and Social Policy in the Twenty-First Century, Oxford University Press.
Hathaway, I. and M. Muro (2016) 'Tracking the gig economy: New numbers', Brookings Institution.
Henry J. Kaiser Family Foundation (2015) 'The Facts on Medicare Spending and Financing'.
Hyatt, H. and J. Spletzer (2013) 'The Recent Decline in Employment Dynamics' IZA Journal of Labor Economics 2(5).
The Kings Fund (2015) 'Reading List: Future Demands on Health and Social Care'.
Krueger, A. (2016) 'Where Have all the Workers Gone?', Paper prepared for the Boston Federal Reserve Bank's 60th Economic Conference, October 14, 2016.
Licchetta, M. and M. Stelmach (2016) 'Fiscal sustainability and public spending on health', Office for Budget Responsibility.
Lloyd, J. and W. Parry (2015) 'Older Owners: Research on the lives, aspirations and housing outcomes of older homeowners in the UK', Strategic Society Centre.
Malmendier, U. and S. Nagel (2011) 'Depression Babies: Do Macroeconomic Experiences Affect Risk-Taking?', The Quarterly Journal of Economics 126(1): 373-416.
McKinsey Global Institute (2015) 'Global Growth: Can Productivity Save the Day in an Ageing World'.
McKinsey Global Institute (2016) 'The Urban World: the Global Consumers to Watch'.
McKinsey Global Institute (2016) 'Diminishing Returns: Why investors may need to Lower their Sights'.
McKinsey Global Institute (2016) 'Independent Work: Choice, Necessity and the Gig Economy'.
Mullainathan, S., Noeth, M. and A. Schoar (2012) 'The Market for Financial Advice: An Audit Study', NBER Working Paper No. 17929.
National Research Council (2012) 'Aging and the Macroeconomy: Long-Term Implications of an Older Population', Committee on the Long-Run Macroeconomic Effects of the Aging U.S. Population, National Academies Press.
Nordas, H. (2016) 'Services Trade Restrictiveness Index (STRI): The Trade Effect of Regulatory Differences', OECD Trade Policy Papers No. 189.
Ostry, J., Ghosh, A. and R. Espinoza (2015) 'When Should Public Debt Be Reduced?', IMF Staff Discussion Note SDN/10/15.
Oxford Economics (2016) 'The Longevity Economy: How People Over 50 Are Driving Economic and Social Value in the US'.
Pew Research Center (2014) 'Millennials in Adulthood: Detached from Institutions, Networked with Friends'.
Pine III, J. and J. Gilmore (2011) The Experience Economy, Harvard Business Review Press.
PWC (2015) 'PWC Golden Age Index: How Well are OECD Countries Adapting to an Older Workforce?'.
Resolution Foundation (2016) 'Stagnation Generation: The Case for Renewing the Intergenerational Contract', Intergenerational Commission.
Resolution Foundation (2017) 'Study, Work, Progress, Repeat? How and Why Pay and Progression Outcomes Have Differed Across Cohorts', Intergenerational Commission.
Silcock, D. (2015) 'Challenges for the Retirement Income Market over the Next Few Decades', Government Office for Science, Future of an Ageing Population: Evidence Review.
Smith S., Newhouse J., and M. Freeland (2009) 'Income, insurance, and technology: why does health spending outpace economic growth?' Health Affairs, Vol.28, No. 5, pp. 1276-84.
Standard and Poor's (2016) 'Global Aging 2016: 58 Shades Of Gray'.
Torrington, A. (2015) 'What developments in the built environment will support the adaptation and 'future proofing' of homes and local neighbourhoods so that people can age well in place over the life course, stay safe and maintain independent lives?', Government Office for Science, Future of an Ageing Population: Evidence Review.
Viacom Media Network (2014) 'The Millennial Disruption Index'
Weiss, A., King, J., Inoue-Murayama, M., Matsuzawa, T. and A. Oswald (2012) 'Evidence for a midlife crisis in great apes consistent with the U-shape in human well-being', Proceedings of the National Academy of Sciences, Vol. 109 No. 49 pp. 19949-19952.
Will, A. (2015) 'Aging in Place: Implications for Remodeling', Joint Center for Housing Studies Harvard University W15-4.
World Economic Forum (2016) 'The Future of Jobs Employment, Skills and Workforce Strategy for the Fourth Industrial Revolution'.
Environmental sustainability
Acemoglu, D., Aghion, P., Bursztyn, L. and D. Hemous (2012) 'The environment and directed technical change', American Economic Review, 102(1), 131-166.
Bank of England (2015) 'The impact of climate change on the UK insurance sector', A Climate Change Adaptation Report by the Prudential Regulation Authority.
Blackrock Investment Institute (2016) 'Adapting Portfolios to Climate Change: Implications and Strategies for all Investors'.
Bloomberg New Energy Finance (2016) 'Sustainable Energy in America Factbook'.
Bowen, A. and K. Kuralbayeva (2015) 'Looking for green jobs: the impact of green growth on employment', Grantham Research Institute on Climate Change and Environment Policy Brief.
Davison, M., Leadbetter, D., Lu, B. and J. Voll (2016) 'Are Counterparty Arrangements in Reinsurance a Threat to Financial Stability?', Bank of Canada Staff Working Paper 2016-39.
Dechezlepretre, A., Martin, R. and M. Mohnen (2013) 'Knowledge Spillovers from Clean and Dirty Technologies: A Patent Citations Analysis', Mimeo, London School of Economics.
Frondel, M., Ritter, N., Schmidt, C. and C. Vance (2010) 'Economic impacts from the promotion of renewable energy technologies; the German experience', Energy Policy, 38, pp.4048-4056.
Gagliardi, L., Marin, G. and C. Miriello (2016) 'The greener the better? Job creation effects of environmentally-friendly technological change', Industrial and Corporate Change, 25 (5):779-807.
Goldman Sachs (2012) 'Catastrophes and Climate', Top of Mind Issue 7, Economics, Commodities and Strategies Research.
Goldman Sachs (2015) 'The Low Carbon Economy: GS SUSTAIN equity investor's guide to a low carbon world, 2015-25'.
Grantham Research Institute on Climate Change and the Environment (2015) 'The 2015 Global Climate Legislation Study: A Review of Climate Change Legislation in 99 Countries'.
Helm, D. (2012) The Carbon Crunch: How We're Getting Climate Change Wrong - and How to Fix It, Yale University Press.
House of Commons Energy and Climate Change Committee (2016) '2020 renewable heat and transport targets', Second Report of Session 2016-17.
IEA (2016) 'Medium-Term Renewable Energy Market Report 2016'.
IPCC (2014) 'Climate Change 2014: Synthesis Report', Contribution of Working Groups I, II and III to the Fifth Assessment Report of the Intergovernmental Panel on Climate Change.
IRENA (2016) 'The Renewable Route to Sustainable Transport', A Working Paper Based on REMAP.
McJeon, H., Edmonds, J., Bauer, N., Clarke, L., Fisher, B., Flannery, B. P., Hilaire, J., Krey, V., Marangoni, G., Mi, R., Riahi, K., Rogner, H. and M. Tavoni (2014) 'Limited impact on decadal-scale climate change from increased use of natural gas', Nature, 514(7523), pp. 482-485.
OECD (2012) 'The Jobs Potential of a Shift towards a Low-Carbon Economy', Final Report to the European Commission.
ONS (2016) 'UK environmental accounts: Low carbon and renewable energy economy, final estimates: 2014', Statistical Bulletin.
Pollin, R. (2015) Greening the Global Economy, The MIT Press.
Sommers, D. (2013) 'BLS green jobs overview', BLS Monthly Labor review pp.3-16.
Swiss Re (2016) 'Climate change and its relevance for the insurance industry'.
Wei, M., Patadia, S. and D. Kammen (2010) 'Putting renewables and energy efficiency to work: How many jobs can the clean energy industry generate in the US?', Energy Policy, 38, pp.919-931.
World Bank (2012) 'Inclusive green growth: The pathway to sustainable development'.
World Economic Forum (2016) 'The Global Risks Report', 11th edition.
Zachmann, G. (2016) 'An approach to identify the sources of low-carbon growth for Europe', Bruegel Policy Contribution Issue n°16.
Urbanisation
Bank of America Merrill Lynch (2016) 'The Beneficiaries of Global Fiscal Stimulus'.
Department for Business, Innovation and Skills (2013) 'The Smart City Market: Opportunities for the UK', BIS Research Paper No. 136.
Dix-Carneiro, R. (2014) 'Trade Liberalization and Labor Market Dynamics', Econometrica, Volume 82, Issue 3 pp. 825-885.
Eggertsson, G. (2011) 'What Fiscal Policy Is Effective at Zero Interest Rates?', NBER Macroeconomics Annual 2010 25: 59-112.
El-Erian, M. (2016) The Only Game in Town: Central Banks, Instability, and Avoiding the Next Collapse, Yale University Press.
Emmerich, M. (2017) Britain's Cities, Britain's Future, London Publishing Partnership.
Frey, W. (2014) 'A Population Slowdown for Small Town America', Brookings Institution.
Glaeser, E. (2010) Triumph of the City: How Urban Spaces Make Us Human, Macmillan.
Goldman Sachs (2016) 'Infrastructure: Time to Start Digging', Fortnightly Thoughts Issue 109.
Hilber, C. and W. Vermeulen (2016) 'The Impact of Supply Constraints on House Prices in England', The Economic Journal, Volume 126, Issue 591 pp. 358-405.
Hunter, P. (2014) 'Towards a Suburban Renaissance: an Agenda for our City Suburbs', The Smith Institute.
Katz, B. and J. Wagner (2014) 'The Rise of Innovation Districts: A New Geography of Innovation in America', Brookings Institution.
Kneebone, E. and N. Holmes (2015) 'The Growing Distance between People and Jobs in Metropolitan America', Brookings Institution. Lloyds Bank (2016) 'Affordable Cities'.
McKinsey Global Institute (2014) 'Tackling the world's affordable housing challenge'.
McKinsey Global Institute (2016) 'Bridging global infrastructure gaps'.
McLaren, D. and J. Agyeman (2015) Sharing Cities, MIT Press.
OECD (2015) Ageing in Cities, OECD Publishing.
OECD (2015) The Metropolitan Century: Understanding Urbanisation and its Consequences, OECD Publishing.
Piso, M., Pels, B. and N. Bottini (2015) 'Improving Infrastructure in the UK', OECD Economics Working Paper No. 1244.
Rosenthal, S. and W. Strange (2004) 'Evidence on the Nature and Sources of Agglomeration Economies', in Handbook of Urban and Regional Economics, Henderson J. and J. Thisse eds., Elsevier.
Thomasson, S. (2012) 'Encouraging U.S. Infrastructure Investment', Council on Foreign Relations Press Policy Innovation Memorandum No. 17.
Townsend, A. (2013) Smart Cities: Big Data, Civic Hackers, and the Quest for a New Utopia, W. W. Norton & Company.
Turner, A. (2015) Between Debt and the Devil: Money, Credit, and Fixing Global Finance, Princeton University Press.
Increasing inequality
Aghion, P., Akcigit, U., Bergeaud, A.., Blundell, R. and D. Hemous, D (2015) 'Innovation and Top Income Inequality', CEPR Discussion Paper No 10659.
Alichi, A., Kantenga K. and J. Sole (2016) 'Income Polarization in the United States', IMF Working Paper No. 16/121.
Aguiar, Mark, and Mark Bils (2015) 'Has Consumption Inequality Mirrored Income Inequality'. American Economic Review, 105 pp. 2725-2756.
Bardhan, P (2005) Scarcity, Conflicts, and Cooperation: Essays in the Political and Institutional Economics of Development, MIT Press.
Belfield, C., Cribb, J., Hood, A. and R. Joyce (2016) 'Living standards, poverty and inequality in the UK: 2016', The Institute for Fiscal Studies.
Berg, A., and J. Ostry (2011) 'Inequality and Unsustainable Growth: Two Sides of the Same Coin?' IMF Staff Discussion Note 11/08.
Bonnet, O., Bono, P., Chappelle, G. and E. Wasmer (2014) 'Does Housing Capital Contribute to Inequality? A Comment on Thomas Piketty's Capital in the 21st Century', Sciences Po Economics Discussion Paper 2014-07.
Bowles, S. (2012) The New Economics of Inequality and Redistribution (Federico Caffè Lectures), Cambridge University Press.
Corak, M. (2013) 'Income Inequality, Equality of Opportunity, and Intergenerational Mobility', Journal of Economic Perspectives, 27 (3): 79-102.
Council of Economic Advisors (2016) 'Benefits of Competition and Indicators of Market Power', Issue Brief.
Dabla-Norris, E., Kochhar, K., Suphaphiphat, N., Ricka, F. and E. Tsounta (2015) 'Causes and Consequences of Income Inequality: A Global Perspective', IMF Staff Discussion Note SDN 15/13.
Harrop, A. and H. Reed (2015) 'Inequality 2030', Fabian Policy Report.
Jappelli, T. and L. Pistaferri (2014) 'Fiscal Policy and MPC Heterogeneity,' American Economic Journal: Macroeconomics, 6(4), 107-136.
Morgan Stanley (2014) 'US Economics: Inequality and Consumption'.
OECD (2015) Income Inequality: The Gap between Rich and Poor, OECD Publishing.
Parker, J., Souleles, N., Johnson, D. and R. McClelland (2013) 'Consumer Spending and the Economic Stimulus Payments of 2008,' American Economic Review, 103(6), 2530-2553.
Rajan, R. (2010) Fault Lines, Princeton University Press.
Scheidel, W. (2017) The Great Leveler: Violence and the History of Inequality from the Stone Age to the Twenty-First Century, Princeton University Press.
Song, J., Price, D., Guvenen, F., Bloom, N. and T. von Wachter (2015) 'Firming Up Inequality', NBER Working Paper No. 21199.
References
Political uncertainty
- Baker, S., Bloom N. and S. Davis (2016) 'Measuring Economic Policy Uncertainty', Quarterly Journal of Economics, Vol. 131 (4) pp. 1593-1636.
- Barber, M. and N. McCarty (2015) 'The Causes and Consequences of Polarization' in Solutions to Polarization in America, Persily, N. ed., Cambridge University Press.
- Blais, A., Morin-Chassé, A. and S. Singh (2015) 'Election Outcomes, Legislative Representation and Satisfaction with Democracy', Party Politics 1-15.
- Blumenau, J. and S. Hix (2015) 'What would the election look like under PR?', LSE Blog, http://blogs.lse.ac.uk/politicsandpolicy/what-would-the-election-look-like-under-pr/
- Caldara, D. and M. Iacoviello (2016) 'Measuring Geopolitical Risk', Working Paper, Board of Governors of the Federal Reserve Board
- Colander, D. and R. Kupers (2014) Complexity and the Art of Public Policy: Solving Society's Problems from the Bottom Up, Princeton University Press.
- Constantinescu, C., Mattoo, A. and M. Ruta (2017) 'Trade Developments 2016: Policy Uncertainty Weighs on World Trade', World Bank Group.
- Davis, S. (2015) 'Regulatory Complexity and Policy Uncertainty: Headwinds of Our Own Making', Hoover Institution Economics Working Paper 15118.
- Ford, R. (2015) 'In Britain, polarisation could be the solution', in Political Polarization in American Politics, Sides, J. and D. Hopkins eds., Bloomsbury Publishing.
- Francesco, G. and M. McMahon (2012), 'Policy uncertainty and household savings', Review of Economics and Statistics Vol. 94(2), 517-531.
- Gentzkow, M. and J. Shapiro (2010) 'What Drives Media Slant? Evidence from US Daily Newspapers', Econometrica 78, no. 1 pp. 35-71.
- Gilens, M. (2012) Affluence and Influence: Economic Inequality and Political Power in America, Princeton University Press.
- Haddow, A. and C. Hare (2013) 'Macroeconomic Uncertainty: What is it, How can we measure it and Why does it matter?', Bank of England Quarterly Bulletin.
- Jennings, W., Stoker, G., Clarke, N. and J. Moss (2014) 'Political disaffection is rising, and driving UKIP support', YouGov.
- Kaplan, R. (2012) The Revenge of Geography: What the Map Tells us about Maps and the Battle against Fate, Random House.
- McCarty, N., Poole, K. and H. Rosenthal (2015) Political Bubbles: Financial Crises and the Failure of American Democracy, Princeton University Press
- Milazzo, C. (2015) 'Getting it Right When it Counts: Constituency Marginality and Voters' Perceptions of British Parties' Policy Positions.' Journal of Elections, Public Opinion and Parties 25(2): 111-36.
- Mishra, P. (2017) Age of Anger: A History of the Present, Penguin Press.
- Naim, M. (2014) The End of Power: From Boardrooms to Battlefields and Churches to States, Why Being In Charge Isn't What It Used to Be, Basic Books.
- OECD (2010) 'Making Reform Happen: Structural Priorities in Times of Crisis'.
- OECD (2011) Future Global Shocks: Improving Risk Governance, OECD Publishing.
- Panousi, V. and D. Papanikolaou (2012) 'Investment, Idiosyncratic Risk, and Ownership', Journal of Finance, Vol. 67, Issue 3 pp. 1113-1148.
- Pastor, L. and P. Veronesi (2012) 'Uncertainty about government policy and stock prices', Journal of Finance 67, 1219-1264.


