Nesta is a registered charity in England and Wales with company number 7706036 and charity number 1144091. Registered as a charity in Scotland number SCO42833. Registered office: 1 Plough Place, London, EC4A 1DE.
www.nesta.org.uk
©Nesta 2014
Foreword
This project was jointly designed, delivered and authored by the University of Cambridge and Nesta
Nesta...
There is a growing movement afoot to revolutionise banking, investing and giving by using technology to simplify the links between those who want to invest money and those who need it.
Crowdfunding and peer-to-peer finance are at the vanguard of this movement. Nesta has been an active supporter of a range of crowdfunding platforms and an advocate for and expert on the development of the alternative finance market. We are especially proud to be publishing this research, which constitutes the most detailed and extensive survey of the alternative finance sector yet undertaken anywhere in the world.
We believe the results will make essential reading for anyone interested in the future of finance, both in the UK and in the wider world.
Stian Westlake, Executive Director of Policy and Research, Nesta
UNIVERSITY OF CAMBRIDGE
The UK alternative finance market is burgeoning and we need to develop a more nuanced understanding of its structural drivers, intrinsic characteristics, dynamics and diversity, challenges and opportunities. This report is an important first step to promote empirical research in this increasingly significant area of our economy.
Dr Mia Gray, Senior University Lecturer, University of Cambridge
This report has received valuable support from the Association of Chartered Certified Accountants (ACCA) and PricewaterhouseCoopers (PwC). ACCA funded and co-designed the national poll of SME awareness of alternative finance and PwC funded and co-designed the national poll of consumer awareness of alternative finance
pwc
The alternative finance industry is quickly becoming an important part of the UK economy. The innovative, technology led approach has improved access to finance for SMEs and seems to be having a positive impact on social and charitable enterprises. We are therefore delighted to be supporting what in our view is the most comprehensive research on the industry to date.
Mark James and Fergus Lemon, PwC
ACCA
This report marks an important milestone in the lifecycle of the fintech industry. Alternative finance in the UK has finally come of age in 2014 as a properly regulated market and a set of well-defined asset classes, drawing on the unique advantages of the UK as a global financial centre. But alternative finance is still set for substantial disruption, out of which a more concentrated, more networked and more mainstream industry will emerge. This study helps us understand that future a little better.
Manos Schizas, Senior Economic Analyst and Acting Head of SME Policy, ACCA
About the authors
Peter Baeck is a researcher at Nesta, where he focuses on the role of digital technologies in public and social innovation.
Liam Collins is a researcher at Nesta where he focuses on innovation and economic growth. Liam is co-author of four Nesta reports on both P2P Lending and Crowdfunding.
Bryan Zhang is a PhD Researcher in Alternative Finance at the University of Cambridge. He is a co-author of three industry reports on crowdfunding and alternative finance.
We would like to acknowledge the generous support received from the UK Crowdfunding Association and the Peer-to-Peer Finance Association.
We would like thank the following platforms and people for sharing data and distributing surveys.

Logos of other platforms sharing data:
- Abundance
- Assetz
- Bloom venture catalyst
- Buzzbnk
- Clifton Asset Management Plc
- Funding Empire™
- FundingKnight
- MarketInvoice
- Microgenius the community shares platform
- Platform Black
- Syndicate Room Intelligent Equity Crowdfunding
- SEEDRS
- Spacehive transform where you live
- Trillion Fund
- YIMBY by JustGiving
- Zopa
- Wellesley & Co.
Building on this we are also thankful for the large number platforms who completed our tracking survey.
Introduction
The alternative finance market in the UK is expected to grow to £1.74 billion of funding provided in 2014. Alternative finance covers a variety of new financing models that have emerged outside of the traditional financial system, that connect fundraisers directly with funders often via online platforms or websites.
As highlighted in this report, the UK market is growing rapidly, and has more than doubled in size year on year from £267 million in 2012 to £666 million in 2013 to £1.74 billion in 2014. In the process, it has given individuals more control over their money as well as new outlets to invest or donate it. At the same time entrepreneurs, SMEs, charities and community organisations are obtaining much-needed finance, which they in many cases, would not otherwise be able to secure. It is evident from our research that the alternative finance market is contributing to the growth and vitality of the UK economy as well as having a positive social impact on philanthropic giving and volunteering.
However, while the market is racing ahead, growing in the number of individuals and ventures funded, the amount of total finance raised, and the number of businesses operating in the alternative finance industry, research has lagged behind. Beyond the size and growth of the market, we actually know very little about alternative finance and the people who are using it to fund or fundraise for projects and ventures. Unanswered questions include:
- What type of people and organisations use the different alternative finance models?
- Why do people and organisations seeking money turn to alternative finance platforms?
- What makes the model attractive to people with money to donate, lend or invest?
- What is the socio-economic impact of alternative finance and how do organisations and businesses perform after fundraising on alternative finance platforms?
- How do people find out about various alternative finance models and what do they think of them having used them?
There exists lots of anecdotal stories from fundraisers and funders of projects and ventures, and some data from platforms that begins answering some of these questions, but none of them look at alternative finance holistically in the UK or try to systematically analyse trends and examine behaviour across multiple alternative financing models.
To address this shortcoming, Nesta and the University of Cambridge, supported by ACCA and PWC, have undertaken this extensive research, which is the largest study of the UK alternative finance industry to date. We hope that this unique study will shed light on the thriving alternative finance industry in the UK. Furthermore we hope that by studying one of the most dynamic, innovative and diverse markets of its kind in the world we can provide insights for individuals, businesses, governments and regulators both in and outside of the UK on the mechanisms, processes and impact of the alternative finance market.
This study uses extensive transaction data collected from alternative finance platforms as well surveys of their users, and we are very grateful to the UK alternative finance industry for their support. The What we did box explains in more detail how we undertook the study.
As noted earlier alternative finance is an umbrella term that covers a range of very different models from people lending money to each other or to businesses, to people donating to community projects and businesses trading their invoices. The distinctions between these models are important as they differ enormously in the types of people and organisations that use them, why they use them and the nature, form and amount of financial transactions that take place.
PEER-TO-PEER (P2P) BUSINESS LENDING
Debt-based transactions between individuals and existing businesses which are mostly SMEs with many individual lenders contributing to any one loan.
INVOICE TRADING
Firms sell their invoices at a discount to a pool of individual or institutional investors in order to receive funds immediately rather than waiting for invoices to be paid.
DONATION-BASED CROWDFUNDING
Individuals donate small amounts to meet the larger funding aim of a specific charitable project while receiving no financial or material return in exchange.
PEER-TO-PEER (P2P) CONSUMER LENDING
Individuals using an online platform to borrow from a number of individual lenders each lending a small amount; most are unsecured personal loans.
The term community shares refers to withdrawable share capital; a form of share capital unique to co-operative and community benefit society legislation. This type of share capital can only be issued by co-operative societies, community benefit societies and charitable community benefit societies.
EQUITY-BASED CROWDFUNDING
Sale of a stake in a business to a number of investors in return for investment, predominantly used by early-stage firms.
REWARD-BASED CROWDFUNDING
Individuals donate towards a specific project with the expectation of receiving a tangible (but non-financial) reward or product at a later date in exchange for their contribution.
PENSION-LED FUNDING
Mainly allows SME owners/directors to use their accumulated pension funds in order to invest in their own businesses. Intellectual properties are often used as collateral.
DEBT-BASED SECURITIES
Lenders receive a non-collateralized debt obligation typically paid back over an extended period of time. Similar in structure to purchasing a bond, but with different rights and obligations
44 facts about alternative finance in the UK
The information below contains highlights from the 2014 UK Alternative Finance Industry report produced by Nesta and the University of Cambridge.
The results are based on analysis of transaction data from alternative finance platforms, surveys of their users and commissioned national surveys of consumers and SMEs in the UK.
P2P BUSINESS LENDING
- £73,222 Average amount borrowed
- 33% of borrowers believed they would have been unlikely to get funds elsewhere
- On average it takes 796 micro-transactions from individual lenders to fund one loan
- 63% of business saw a growth in profit with 53% seeing an increase in employment since securing funding
- 83% of lenders were men
P2P CONSUMER LENDING
- £5,471 Average amount borrowed
- 54% have lent more than £5,000
- Lenders primarily motivated by interest rate available
- More than half of borrowers had been offered a loan from the bank but went with P2P Lending
- 46% used loan to purchase a vehicle
INVOICE TRADING
- £56,075 Average amount raised
- 33% of businesses said it was unlikely that they would have received finance could they not have turned to an invoice trading provider
- The average invoice finance auction only takes 8 hours
- Three in four users would use invoice trading in the future even if banks were to offer similar terms
EQUITY CROWDFUNDING
- £199,095 Average amount raised
- Two-thirds of investors have invested more than £1,000
- 38% of investors were professional investors or high net-worth individuals
- Since securing funding 70% of businesses have increased turnover, 60% have increased employment
- 54% of businesses sought expansion capital, 46% sought seed or start-up capital
Market size Growth chart 2012-2014
This chart visually represents the growth of the alternative finance market over three years:
- 2012: £267m
- 2013: £666m (+150% increase from 2012)
- 2014: £1.74 billion (+161% increase from 2013)
- 2014 Breakdown (Q1-Q4 Predicted):
- Q1: £312m
- Q2: £409m
- Q3: £468m
- Q4: £553m (Predicted)
Breakdown of 2014 market by platform and Average growth rate 2012-2014
This visual shows the market share in £ millions for 2014 and the average growth rate for each platform type between 2012 and 2014:
- P2P business lending: £749m (250% growth ↑)
- P2P consumer lending: £547m (108% growth ↑)
- Invoice trading: £270m (174% growth ↑)
- Equity crowdfunding: £84m (410% growth ↑)
- Community shares: £34m (95% growth ↑)
- Rewards crowdfunding: £26m (206% growth ↑)
- Pension-led funding: £25m (5% growth ↑)
- Debt-based securities: £4.4m (117% growth ↑)
- Donation crowdfunding: £2.0m (77% growth ↑)
- £174,286 Average amount raised
- The average investment in community shares is £368
- 38% of investors in community shares attended local shareholder meetings
- 32% of investors have offered to volunteer directly with the project they supported
- The prospect of a finance return was only important or very important to 24% of investors
AWARENESS OF ALTERNATIVE FINANCE
People who...
* Are aware of it: 58%
* Have used it: 14%
SMEs who...
* Are familiar with it: 44%
* Have used or tried to use it: 9%
DONATION CROWDFUNDING
- £6,102 Average amount raised
- 34% of fundraisers have seen an increase in volunteering after their campaign
- 27% of donors had offered to help or volunteer with the project they backed
- 46% of donors have funded projects that others in or outside their local area could use
DEBT-BASED SECURITIES
- £730,000 Average amount raised
- Average investment in debt-based securities is £1,243
- On average it takes 587 funders to fund a renewable energy project through debt-based securities
- The opportunity to make a positive social impact was an important factor in deciding to invest for 86% of investors
PENSION-LED FUNDING
- £70,257 Average amount raised
- Pension-led funding (PLF) users are mostly small businesses, 7% were sole traders while 60% had 5 or fewer employees
- 51% of PLF fundraisers thought that they would have been unlikely or very unlikely to secure funding elsewhere
- 43% have increased their employment after raising finance via PLF
REWARDS CROWDFUNDING
- £3,766 Average amount raised
- The majority of funders had spent less than £50 on supporting projects and mostly backed only a single project
- 53% said they would have been unlikely to get funded were it not for crowdfunding
- 72% of funders knew the person running the campaign they backed either personally or by reputation
This report is split into four main parts. In part one we look at findings from across the alternative finance industry, including the total size and growth of the market, as well as the significant differences between various alternative finance models. In part two we look at the general awareness of alternative finance in the UK amongst consumers and small and medium sized enterprises (SMEs). Part three looks in more detail at each alternative finance model from both funder and fundraiser perspectives. Finally, part four concludes the research and discusses the current as well as future development of alternative finance in the UK.
What we did – data sources and research methodology
To meet the multifaceted research objectives and ensure the consistency, rigour and validity of this comprehensive study, four stages of research activity were designed and carried out by researchers from March to September 2014.
Stage one involved collecting and analysing granular-level relational and transactional data directly from alternative finance platforms. Primary data totalling £1 billion in financing volume and one million in micro-transactions (e.g. from one lender to one borrower or from one donor to one project) were collected and then subsequently cleaned, anonymised, aggregated and analysed.
Stage two of the study consisted of designing and distributing model-specific questionnaires in order to survey both funders and fundraisers (i.e. users) of alternative finance in the UK. Surveys were distributed via 25 leading alternative financing platforms/providers as well as through public channels and social media. In total 15,658 users were surveyed.
Stage three, which was conducted in association with the ACCA and PwC, included commissioning two external national surveys to understand the level of awareness as well as the nuances of perception about alternative finance among 2,007 consumers and 506 SMEs in the UK.
Finally, in stage four, an industry-wide tracking survey was designed and distributed mainly through the UK crowdfunding association (UKCFA) and P2P Finance Association (P2PFA) to gather latest industrial figures for the year 2014. Actual transactional figures were collected for Q1-Q3 and projected figures were estimated and compiled by alternative finance platforms for the 4th Quarter. These projections were primarily provided by the platforms, but in a minority of cases were calculated by the research team based on the platform's previous growth rate.
1. Market Overview – the alternative finance market continues to grow rapidly
The state of the alternative finance market
In 2014, the total amount raised through various alternative finance models is on track to more than double compared to 2013. In the first three quarters of 2014, alternative finance platforms facilitated loans, investments and donations worth £1.2 billion, with platforms predicting the amount to reach £1.74 billion by the end of the year.
Market size Growth (2012-2014) with Quarterly Breakdown for 2014
This chart shows the market size and growth, with a detailed quarterly breakdown for 2014:
- 2012: £267m
- 2013: £666m (Growth +150%)
- 2014: £1.74 billion (Growth +161%)
- Q1: £312m
- Q2: £409m
- Q3: £468m
- Q4: £553m (Predicted)
As described earlier, alternative finance is an umbrella term covering a very diverse market containing different models. Looking across the different models of alternative finance, most grew substantially in 2014. On volume of funding facilitated, peer-to-peer (P2P) business lending and P2P consumer lending continue to dominate the market with £749 million and £547 million lent through those models respectively in 2014.
Invoice trading, is expected to grow to a £270 million sector by the end of the year, up by 179 per cent from 2013. Equity-based crowdfunding is on track to grow to £84 million a 201 per cent increase from 2013, whilst reward and donation-based crowdfunding are expected to reach £24 million and £2 million in the same period. Finally, debt-based securities, pension-led funding and community shares are expected to register £4.4 million, £25 million and £34 million respectively by the end of 2014.
The crowdfunding market by platform 2014 and Average growth rate 2012-2014
| Platform |
2014 Amount |
Average Growth Rate 2012-2014 |
| P2P business lending |
£749m |
↑ 250% |
| P2P consumer lending |
£547m |
↑ 108% |
| Invoice trading |
£270m |
↑ 174% |
| Equity crowdfunding |
£84m |
↑ 410% |
| Community shares |
34m |
↑ 95% |
| Rewards crowdfunding |
£26m |
↑ 206% |
| Pension-led funding |
£25m |
↑ 5% |
| Debt-based securities |
£4.4m |
↑ 117% |
| Donation crowdfunding |
£2.0m |
↑ 77% |
To put industry figures into context, in the first three quarters of 2014, the UK P2P consumer lending platforms had provided consumer credit to more than 62,000 individual borrowers in the UK. By the end of the year, it is expected that the UK alternative finance market will also provide over £1 billion worth of business finance to over 7,000 SMEs, equivalent to 2.4 per cent of cross national bank lending to SMEs based on Bank of England's 2013 baseline figures (Trends in Lending, October 2014).
Market likely to continue its growth in 2015
Looking at growth figures from the past three years, we project that the UK alternative finance market will grow to around £4.4 billion in 2015 if current growth remain buoyant.
There are a number of factors that suggest growth will continue apace. Firstly, when asked, current users of UK alternative platforms indicate that they are very likely to use alternative finance models more in the future. More than half of P2P business lenders for example, plan to lend more in the coming year than last year. On the borrower side, 86 per cent say they would be 'likely' or 'very likely to approach alternative finance platforms first in the future even if a bank were to offer funding on similar terms.
The second factor that indicates significant potential for future growth, is that awareness and usage of alternative finance in the UK is quite low. Forty-two per cent of individuals participating in a national survey were completely unaware of any type of alternative financing activities or platforms. Even more promising for the growth potential of the market is that just 14 per cent of the respondents in the same survey had used an alternative finance platform, leaving significant scope for expansion. Looking at potential fundraisers, there are also indications of the potential for future growth. While 44 per cent of SME's surveyed were familiar with some form of alternative finance, less than 10 per cent had approached an alternative platform to seek finance.
Differences in size and usage of alternative finance models
The amounts raised and contributed by users differs significantly across models
However, alternative finance platforms also have significant challenges ahead, as, despite the positive perceptions their users have of the industry, those who have not used it remain sceptical. Sixty per cent of surveyed consumers said they are ‘unlikely' or 'very unlikely to begin/continue using alternative finance platforms, citing concerns about perceived risks and a lack of information about those individuals and businesses that they would be funding. There was also a perception that their money would be safer with traditional financial institutions rather than with alternative finance providers.
The diverse nature of the alternative finance industry means that projects and businesses from a wide range of sectors are able to source funding for various purposes. Consequently, there are also significant variations in the usage and amounts raised by people and organisations through the different alternative finance models.
Those raising funds through reward-based crowdfunding are predominantly from the creative and social sectors and raise an average of £3,766 from 77 backers. Equity-based crowdfunding fundraisers come from a diverse range of sectors, from high-tech and healthcare to consumer products, and raise a much larger average amount of £199,095 from 125 investors. In invoice trading, the average invoice value is £56,075 and funded mostly by institutional investors and high net-worth individuals. P2P business borrowers tended to be from the manufacturing, professional business services, construction or retail sectors and on average borrowed £73,222 from 796 lenders. The average amount of funding secured by those using pension-led finance was £70,257.
|
Average amount raised |
Average number of funders |
| P2P Consumer Lending |
£5,471 |
201 |
| P2P Business Lending |
£73,222 |
796 |
| Equity Crowdfunding |
£199,095 |
125 |
| Rewards Crowdfunding |
£3,766 |
77 |
| Donation Crowdfunding |
£6,102 |
55 |
| Invoice Trading |
£56,075 |
7 |
| Pension-led Funding |
£70,257 |
N/A |
| Debt-based Securities |
£730,000 |
587 |
| Community Shares |
£174,286 |
474 |
The amounts of money being lent or donated by individual funders through the different alternative finance models varied considerably too. Our findings show that 66 per cent of equity-crowdfunding funders, 72 per cent of P2P consumer lenders and 84 per cent of P2P business lenders respectively had put more than £1,000 through the platforms that they used. In contrast, just 3 per cent of funders on donation or reward-based crowdfunding platforms had pledged the same amount or more. In a similar vein, when asked about what the money they used to fund would have been used for otherwise, P2P lenders and equity investors had pretty even splits between savings and investment. In contrast, the majority of reward and donation-based crowdfunding backers stated the money would have been used for day-to-day spending or charitable giving.
Users of alternative finance are predominantly men, but women are the majority for reward and donation-based crowdfunding
It is evident that alternative finance is primarily utilised by men. Looking at those securing funds through P2P business lending and equity-based crowdfunding, around three-quarters of those who successfully raised finance were men. This suggests alternative finance may facilitate the same gendered patterns of funding as seen in traditional finance models. However, this is not the case for all types of alternative finance. Female fundraisers made up 51 per cent and 64 per cent of the survey respondents for reward and donation-based crowdfunding respectively. Again, these findings are in line to those found in elsewhere, that women are better represented in social enterprises than in mainstream businesses.
The gender trends for funders follow a similar pattern. Just 14 per cent of equity crowdfunding investors and 17 per cent of P2P business lenders surveyed were women. While these figures are low, they compare favourably to other areas such as the male-dominated business angel population or financial asset ownership by gender.
Figure 1: Percentage of alternative finance fundraisers that were women by model
This bar chart illustrates the percentage of women fundraisers across different alternative finance models:
- Donation CF: 64%
- Rewards CF: 51%
- P2P Consumer Lending: 34%
- P2P Business Lending: 24%
- Equity CF: 22%
- PLF: 18%
- Invoice Trading: 17%
Users of alternative finance are well represented in all age groups
Users of alternative finance tend to be in the older age brackets. Almost three-quarters of all users surveyed were 45 or older, with almost a quarter over 65 years old. Conversely, funders of reward, donation and in particular equity-based crowdfunding tend to be younger than those using other models. For most models funders tended to be older than fundraisers.
Figure 2: Age of funders across the different alternative finance models
This stacked bar chart shows the distribution of funders by age group for various alternative finance models:
- Equity CF: Under 35 (38%), 35-54 (36%), 55+ (25%)
- Donation CF: Under 35 (40%), 35-54 (37%), 55+ (23%)
- Rewards CF: Under 35 (43%), 35-54 (35%), 55+ (22%)
- P2P Consumer Lending: Under 35 (12%), 35-54 (33%), 55+ (55%)
- P2P Business Lending: Under 35 (12%), 35-54 (31%), 55+ (57%)
- Debt-Based Securities: Under 35 (20%), 35-54 (40%), 55+ (40%)
- Community Shares: Under 35 (5%), 35-54 (39%), 55+ (56%)
A bar chart shows the percentage of respondents by age group (Under 35, 35-54, 55+) across different alternative finance models (Equity CF, Donation CF, Rewards CF, P2P Consumer Lending, P2P Business Lending, PLF, Invoice Trading).
- Equity CF: Under 35 (26%), 35-54 (48%), 55+ (26%)
- Donation CF: Under 35 (29%), 35-54 (64%), 55+ (7%)
- Rewards CF: Under 35 (41%), 35-54 (41%), 55+ (19%)
- P2P Consumer Lending: Under 35 (61%), 35-54 (20%), 55+ (19%)
- P2P Business Lending: Under 35 (62%), 35-54 (6%), 55+ (32%)
- PLF: Under 35 (50%), 35-54 (11%), 55+ (1%)
- Invoice Trading: Under 35 (49%), 35-54 (17%), 55+ (72%)
The geography of alternative finance - London and the South East the most active regions
The funder and fundraisers of alternative finance came from all corners of the UK. Relative to population size we see that usage of alternative finance closely follows the population distribution. Variations from this, are that slightly more individuals and businesses in the South East and South West use alternative finance platforms and slightly fewer in the East of England.
Looking at specific models and comparing the distribution of funders and fundraisers, we see that with some exceptions, the geographical distribution of funders closely mirrors the distribution of fundraisers. A notable exception was P2P consumer lending, where London and the South East had more lenders than borrowers, suggesting an outflow of money from these regions. The distribution of equity-based crowdfunding users illustrated that the South East had more investors than fundraisers while the opposite is true for London. When it comes to reward-based crowdfunding, London also had more fundraisers than funders.
Two horizontal bar charts show the percentage of funders and fundraisers from various UK regions for P2P Consumer Lending.
Funder percentages per region:
* Northern Ireland: 1%
* Wales: 4%
* Scotland: 6%
* South West: 10%
* South East: 17%
* London: 15%
* East of England: 5%
* West Midlands: 7%
* East Midlands: 7%
* Yorkshire and The Humber: 7%
* North West: 10%
* North East: 3%
Fundraiser percentages per region:
* Northern Ireland: 3%
* Wales: 4%
* Scotland: 11%
* South West: 12%
* South East: 22%
* London: 8%
* East of England: 7%
* West Midlands: 8%
* East Midlands: 7%
* Yorkshire and The Humber: 8%
* North West: 14%
* North East: 5%
Two horizontal bar charts illustrate the percentage of funders and fundraisers from different regions for Equity-based Crowdfunding.
Funder percentages per region:
* Europe (non-UK): 8%
* Northern Ireland: 1%
* Wales: 4%
* Scotland: 4%
* UK-South West: 12%
* UK-South East: 11%
* London: 31%
* UK-East of England: 8%
* UK-West Midlands: 4%
* UK-East Midlands: 3%
* UK-Yorkshire and The Humber: 3%
* UK-North West: 2%
* UK-North East: 1%
Fundraiser percentages per region:
* Europe (non-UK): 7%
* Northern Ireland: 4%
* Wales: 0%
* Scotland: 4%
* UK-South West: 15%
* UK-South East: 19%
* London: 41%
* UK-East of England: 7%
* UK-West Midlands: 4%
* UK-East Midlands: 4%
* UK-Yorkshire and The Humber: 0%
* UK-North West: 4%
* UK-North East: 0%
Two horizontal bar charts depict the percentage of funders and fundraisers from different regions for Reward-based Crowdfunding.
Funder percentages per region:
* Outside UK: 9%
* Northern Ireland: 1%
* Wales: 4%
* Scotland: 5%
* South West: 19%
* South East: 11%
* London: 19%
* East of England: 5%
* West Midlands: 6%
* East Midlands: 4%
* Yorkshire and The Humber: 5%
* North West: 9%
* North East: 2%
Fundraiser percentages per region:
* Outside UK: 6%
* Northern Ireland: 1%
* Wales: 2%
* Scotland: 7%
* South West: 16%
* South East: 14%
* London: 26%
* East of England: 4%
* West Midlands: 4%
* East Midlands: 4%
* Yorkshire and The Humber: 5%
* North West: 9%
* North East: 1%
Significant differences in users' income levels across different alternative finance models
Looking across the different alternative finance models, we see that the income levels of users differ quite noticeably. Those funding through debt-based securities, P2P business lending and in particular equity-based crowdfunding have the highest incomes. Fifty-two per cent of those investing through equity-based crowdfunding have an annual income of more than £50,000 with 21 per cent earning over £100,000. At the other end of the spectrum, those backing projects through reward and donation-based crowdfunding had the lowest incomes. In both models, 47 per cent of funders earned less than £25,000 per annum.
A stacked bar chart illustrates the annual income distribution of funders across various alternative finance models. Income brackets include <£15,000, £15,000-£25,000, £25,000-£35,000, £35,000-£50,000, £50,000-£100,000, £100,000-£150,000, and £150,000>.
Income distribution by model:
* Rewards CF: 24% (<£15k), 23% (£15k-£25k), 19% (£25k-£35k), 18% (£35k-£50k), 12% (£50k-£100k), 2% (£100k-£150k), 2% (>£150k)
* Donation CF: 18% (<£15k), 29% (£15k-£25k), 16% (£25k-£35k), 18% (£35k-£50k), 18% (£50k-£100k), 2% (£100k-£150k), 0% (>£150k)
* P2P Consumer: 17% (<£15k), 20% (£15k-£25k), 20% (£25k-£35k), 19% (£35k-£50k), 17% (£50k-£100k), 4% (£100k-£150k), 3% (>£150k)
* Community Shares: 16% (<£15k), 22% (£15k-£25k), 26% (£25k-£35k), 19% (£35k-£50k), 14% (£50k-£100k), 1% (£100k-£150k), 2% (>£150k)
* P2P Business: 13% (<£15k), 16% (£15k-£25k), 18% (£25k-£35k), 20% (£35k-£50k), 22% (£50k-£100k), 7% (£100k-£150k), 4% (>£150k)
* Debt-based securities: 12% (<£15k), 15% (£15k-£25k), 22% (£25k-£35k), 20% (£35k-£50k), 21% (£50k-£100k), 6% (£100k-£150k), 3% (>£150k)
* Equity CF: 7% (<£15k), 10% (£15k-£25k), 15% (£25k-£35k), 15% (£35k-£50k), 31% (£50k-£100k), 14% (£100k-£150k), 7% (>£150k)
Different motivations driving usage of alternative finance
The motives behind fundraisers turning to alternative sources of finance also vary depending on the model. Those who fundraised through donation and reward-based crowdfunding valued most having more control over their projects. In contrast, P2P business lending borrowers and entrepreneurs that had fundraised via equity-based crowdfunding valued the speed at which they could access funding and how easy the platform was to use. For P2P consumer borrowers the primary motive was securing a more favourable interest rate as well as a higher quality of customer service. Those trading invoices through alternative finance platforms did so largely to source working capital; whilst those utilising pension-led finance valued the ability to invest their own pension into their businesses.
In a similar vein, the motivations for funding also differed significantly across the industry. Those in P2P lending and equity-based crowdfunding were primarily driven by the prospect of financial returns with less concern for backing local businesses or supporting social causes. In contrast those in reward and donation-based crowdfunding were highly motivated by fundraisers' ideas and the potential to make a positive difference with their money. For instance, the prospect of obtaining financial return was 'important' or 'very important' to 82 per cent of P2P business lenders and to 96 per cent of investors in equity-based crowdfunding, whereas this was only 'important' or 'very important' to 24 per cent of people who bought community shares. Survey responses from users of donation-based crowdfunding highlight how only 22 per cent of people have funded one or more projects that they would benefit from themselves, whereas 46 per cent have funded projects that others in or outside their local area could use.
The socio-economic impact of alternative finance
By the end of 2014, it is expected that the UK alternative finance market will have provided working, growth and expansion capital to an estimated 7,180 SMEs as well as crucial funding for hundreds of community and voluntary organisations across the country. By the end of the year, over 80,000 people will have acquired personal loans from P2P consumer lending platforms, of which many are sole-traders borrowing money for business purposes.
The importance of the alternative finance market was also highlighted in the surveys of users of alternative finance platforms, where many fundraisers stated that they would have struggled to source funds otherwise. This is particularly true in donation-based crowdfunding where 64 per cent of those who raised money say it is 'unlikely' or 'very unlikely' they would have been able to access the funds they need if they could not have turned to alternative finance. Fifty-three per cent of those using reward-based crowdfunding thought it was 'unlikely' or 'very unlikely' that they would have been able to get funding elsewhere.
Impact on business growth
Since successfully raising finance, individuals and businesses have seen a variety of positive impacts. Three-quarters of those that received funding through reward or equity-based crowdfunding launched a new product or service after funding rounds. Seventy per cent of SME borrowers of P2P business lending have seen their turnover grow since secured funding with 63 per cent of them recording a growth in profit. A third of those who raised funds via P2P business lending or invoice trading, reported that they would have been 'unlikely' or 'very unlikely' to get funding elsewhere. Seventy-nine per cent of businesses had attempted to get a bank loan before turning to P2P business lending, with only 22 per cent being offered finance.
Increasing philanthropic giving and volunteering
Alternative finance models also facilitate significant giving to good causes predominantly through the reward, community shares and donation-based models as well as to renewable energy ventures through debt-based securities. For donations and reward-based crowdfunding just 23 per cent and 21 per cent stated the money they donated or pledged would otherwise be used for charitable giving, indicating that alternative finance is providing significant additional giving to social good projects. As well as the funds provided, crowdfunding is helping increase volunteering and social action. Our results show that 29 per cent of backers on donation-based crowdfunding platforms had also given advice and feedback to campaigns and 27 per cent had offered to help or volunteer with the project. Correspondingly, 34 per cent of fundraisers have seen an increase in volunteerism after they fundraised through donation-based crowdfunding.
2. Awareness and Perceptions of Alternative Finance
Alternative finance is a relatively new phenomenon, with most providers less than a decade old. Yet its rapid growth has meant it is already providing significant amounts of capital to UK individuals and businesses. To examine whether this growth is driven by niche pockets of UK society, or if it is beginning to gain prominence more widely, we commissioned two national surveys to gauge awareness and usage amongst the consumer and business populations.
Consumer awareness of alternative finance
Awareness of some type of alternative finance among the over 2,000 individuals surveyed was relatively high. Fifty-eight per cent of those asked were aware of at least one type of alternative finance presented to them with 42 per cent completely unaware of any type. Yet usage of alternative finance remains quite low. Just 14 per cent of those surveyed (less than a quarter of those aware of alternative finance) had used any type.
A stacked bar chart illustrates the awareness of alternative finance among respondents.
- Left Bar (Percentage of respondents):
- Unaware of any type of alternative finance: 42%
- Are aware of some type of alternative finance: 58%
- Right Bar (Percentage of respondents):
- Aware of some type but have not used any type of alternative finance: 44%
- Have used some type of alternative finance: 14%
A stacked bar chart shows the awareness and usage of different alternative finance models.
Awareness and usage breakdown by model:
* Investment-based crowdfunding*: Used (5%), Aware but not used (33%), Unaware (62%)
* P2P business lending: Used (5%), Aware but not used (34%), Unaware (61%)
* Reward-based crowdfunding/donation-based crowdfunding: Used (8%), Aware but not used (32%), Unaware (60%)
* P2P consumer lending: Used (7%), Aware but not used (38%), Unaware (55%)
* Equity-based crowdfunding and debt-based securities
When asked about future plans, 60 per cent of all respondents believed they were 'unlikely' or 'very unlikely' to begin/continue to using an alternative finance platform in the near future. These results were similar across the different alternative finance models. Of the 1,150+ respondents that were aware of alternative finance, flexibility (53 per cent) and speed (51 per cent) were the two features respondents associated most with alternative finance. However, 56 per cent also thought that alternative finance was risky.
Of the 875 respondents who were aware of alternative finance but had not used it, when asked what would make them more likely to invest/save through alternative finance platforms, the three most important factors were: if they could earn better returns (72 per cent), if it could give them a better sense of transparency and understanding of where their money goes (62 per cent) and if they could receive better guidance on how to use the different platforms (62 per cent). For those who were unaware, gaining better returns and having their money covered by a guarantee would encourage them to lend or invest.
SME familiarity of alternative finance
Thirty-one per cent of all respondents think that alternative finance platforms are more risky than traditional finance providers and 23 per cent consider them to be less secure. However, alternative finance platforms fared much better than traditional finance providers across a number of other characteristics. Twenty-eight per cent of all respondents think that alternative finance platforms are more socially responsible, 25 per cent believe they are more flexible and 21 per cent believe they are easier to use.
Whilst the majority of respondents said they would not consider P2P or crowdfunded activities for other services or products, 18 per cent said that they would consider it for exchanging currency, 11 per cent for insurance and 10 per cent for mortgages - highlighting the potential for other P2P and crowdfunded activities.
In addition to individuals, the other significant users of alternative finance platforms are SMEs. Specific alternative finance models such as P2P business lending, invoice trading, equity-based crowdfunding and pension-led funding deal almost exclusively with SMEs. In addition to this, reward-based crowdfunding and community shares are becoming increasingly important sources of funding for start-ups and community interest groups. In order to gauge the level of awareness and usage of alternative finance among the SME community, a national SME alternative finance survey was commissioned. The sample of 506 SMEs were gathered to be representative of the national SME population in terms of geographical spread, industry, size and turnover bands, with the exception of over-sampling businesses that have employees and under-sampled sole traders who would otherwise have dominated the sample. Wherever the sample did not accurately represent the SME population weights were applied in the analysis.
The SMEs surveyed were presented with descriptions of the different forms of alternative finance including the names of some of the most prominent alternative finance platforms in the market. Respondents were then asked about their familiarity with, and usage of, the respective models.
Forty-four per cent of those surveyed were familiar with at least one of the forms of alternative finance presented to them with 56 per cent unfamiliar with any. However, few had attempted to raise funds via an alternative finance platform. Just 9 per cent of those surveyed had approached an alternative finance provider. Those who were aware of, but had not used an alternative finance platform cited not needing external finance (77 per cent), not having a problem accessing finance from elsewhere (14 per cent) and not having enough knowledge about alternative finance platforms (9 per cent) as the reasons they had not used them.
A stacked bar chart illustrates SME familiarity with alternative finance.
- Left Bar (Percentage of respondents):
- Unfamiliar with any type of alternative finance: 56%
- Familiar with some type of alternative finance: 44%
- Right Bar (Percentage of respondents):
- Have not tried to use some type of alternative finance: 91%
- Have tried to use some type of alternative finance: 9%
Across the different alternative finance models, SMEs were most familiar with P2P lending (almost a quarter for P2P consumer or business lending). While invoice trading also fared well (21 per cent), familiarity with community shares (7 per cent), pension-led funding (9 per cent) and debt-based securities (11 per cent) was noticeably less.
A horizontal bar chart shows the percentage of SMEs familiar with and unfamiliar with different alternative finance models.
Familiarity breakdown by model:
* Peer-to-peer business or consumer lending: Familiar (24%), Unfamiliar (76%)
* Invoice trading: Familiar (21%), Unfamiliar (79%)
* Investment crowdfunding (equity): Familiar (15%), Unfamiliar (85%)
* Donation-based crowdfunding: Familiar (13%), Unfamiliar (87%)
* Reward-based crowdfunding: Familiar (12%), Unfamiliar (88%)
* Debt based securities: Familiar (11%), Unfamiliar (89%)
* Pension-led funding: Familiar (9%), Unfamiliar (91%)
* Community shares: Familiar (7%), Unfamiliar (93%)
When asked which forms of alternative finance they would like to learn more about, reward-based crowdfunding was the most popular response with 11 per cent of those aware of the model interested in finding out more about it. To gain a better understanding of the channels through which SMEs are becoming aware of this type of funding, they were asked to identify from where they had received information about alternative finance. The most cited source of information was the media (48 per cent) with colleagues or professional networks (35 per cent) and professional advisors (21 per cent) also ranking highly. When comparing those who are, or plan to use alternative finance, to those not planning to use it, the former disproportionately became aware through channels such as online intermediaries and established finance providers, indicating that these are more effective or trusted channels.
Cost of finance and regulation are important factors for SMEs considering alternative finance
SMEs that were aware of alternative finance were presented with a number of hypothetical statements on what would make them more or less likely to use alternative finance platforms. The ones that were cited most as factors that would increase the likelihood of them using alternative finance were if they offered cheaper funding (46 per cent), if they were regulated (46 per cent) and if they were faster and less complex than traditional funders (40 per cent). The factors that would make them less likely were if they believed most platforms would not be around in 10 years (37 per cent) or if platforms had a reputation of funding applicants regardless of quality (32 per cent).
A stacked bar chart compares SMEs' perceptions of UK alternative finance providers against traditional finance providers across various factors, categorized as "Better", "About the same", or "Worse".
Comparison by factor:
* Willingness to take risks: Better (29%), About the same (29%), Worse (10%)
* Flexibility: Better (26%), About the same (33%), Worse (9%)
* Speed: Better (23%), About the same (33%), Worse (10%)
* Accessibility: Better (21%), About the same (36%), Worse (10%)
* Generating financial returns on their investment: Better (17%), About the same (41%), Worse (7%)
* Generating social returns on their investment: Better (16%), About the same (34%), Worse (10%)
* Cost of capital: Better (16%), About the same (36%), Worse (11%)
* Knowing how your industry/businesses like yours work: Better (14%), About the same (37%), Worse (17%)
* Moral standards: Better (14%), About the same (32%), Worse (12%)
* Keeping your business' money and information safe: Better (8%), About the same (38%), Worse (18%)
* Lending/investment standards: Better (7%), About the same (38%), Worse (15%)
SMEs' perceptions of the UK alternative finance platforms in comparison to that of traditional funders were also explored in the survey. Alternative finance platforms were thought to be better than traditional providers when it came to their willingness to take risks (29 per cent of respondents), flexibility (26 per cent) and speed (23 per cent). They fared worse however when it came to whether they understood an SMEs' specific industry or business (17 per cent of respondents) and keeping money and information safe (18 per cent of respondents).
Of those SMEs planning to raise funds in the coming 12 months (27 per cent), slightly more (14 per cent) indicated that they would approach an alternative finance provider than those who said they would not (13 per cent). SME respondents would also consider using P2P or crowdsourced services for mortgages (13 per cent), insurance policies (12 per cent)or electronic invoicing (10 per cent) but were less willing to use such models for credit ratings (4 per cent) or currency exchange (5 per cent).
3. Size, growth and trends of different alternative finance models
P2P BUSINESS LENDING
£73,222
Average amount borrowed
33% of borrowers believed they would been unlikely to get funds elsewhere
On average it takes 796 micro-transactions from individual lenders to fund one loan
63% of business saw a growth in profit with 53% seeing an increase in employment since securing funding
83% of lenders were men
Market size: £749m
Average growth: +250%
P2P Business Lending Quarterly Funding
This section describes the growth of P2P business lending funding over time, presented as a series of figures representing quarterly and annual totals.
- 2012: £62m
- 2013: £193m
- 2014:
- Q1: £112m
- Q2: £183m
- Q3: £205m
- Q4: £250m (Predicted)
WHAT IS P2P BUSINESS LENDING?
Debt-based transactions between individuals and existing businesses which are mostly SMEs with many individual lenders contributing to any one loan.
The market has more than tripled in size since 2013
P2P business lending facilitates secured or non-secured business loans between individual lenders to mostly SMEs.
Over the last two years P2P business lending has experienced an impressive growth, with a 288 per cent increase from the £193 million in 2013 to a predicted £749 million in 2014. This growth can be largely attributed to the strong expansion of existing industrial players as well as the recent proliferation of this business model underpinned with the emergence of many new and diverse entrants into the market.
Lenders are creating large portfolios as lending is split among hundreds of borrowers
Analysis of primary transactional data from P2P business lending platforms worth £309 million covering over 3,000 loans and 3.18 million transactions from 2011-2013 illustrates that the average business interest rate paid is around 8.8 per cent. The average P2P business lending loan size is £73,222 and it takes approximately 796 transactions from individual lenders to the business borrower to fund a listed loan, with the average loan being just £91.95. P2P business lenders have, on average, a sizeable lending portfolio of £8,137 spread over a median of 52 business loans.
Manufacturing businesses using P2P borrowing most
Of 3,112 P2P business loans analysed, the top three most funded industrial sectors are manufacturing, professional and business services and retail.
P2P business borrowers by sector
| Industrial Sectors |
Count |
% of total P2P business loans |
| Manufacturing |
709 |
23% |
| Professional and Business Services |
431 |
14% |
| Retail |
424 |
14% |
| Construction |
347 |
11% |
| Information and Communication |
276 |
9% |
| Leisure & Hospitality |
276 |
9% |
| Healthcare |
219 |
7% |
| Wholesale |
203 |
7% |
| Finance |
124 |
4% |
| Transportation |
103 |
3% |
P2P lending for real estate finance also emerging
One of the fastest-growing markets within the P2P business lending model is secured lending for real estate mortgages and developments. For this particular section of the market, which was analysed separately, we found that the average business loan amount is considerable higher at £662,425 with an average loan term of 10 months.
In addition to looking at transactional data from platforms, we also surveyed 1,771 lenders and 323 business borrowers who have used P2P business lending, to attain further insights on their behaviour and views on alternative finance. The survey results mirror the findings from the platform data with 30 per cent having lent between £1,000 and £5,000 and 26 per cent having lent between £5,000 and £20,000. It is however interesting to note that almost 23 per cent have provided loans in the range from £20,000 to £100,000. Also corresponding to the findings from transactional data from platforms, our survey demonstrates that P2P business lenders do actively diversify their lending portfolios. One in four P2P business lenders has lent to more than 100 businesses, and 45 per cent have lent to between 20 and 100 businesses.
Lenders tend to be older males using money set aside for savings or investment
P2P business lending is primarily used by men who are 55 or older. Eighty-three per cent of surveyed lenders, and 74 per cent of borrowers were men. Fifty-seven per cent of lenders were 55 or older. They were also quite wealthy with a third having an annual income in excess of £50,000.
The majority of P2P business lenders learned about this alternative finance model through online advertising (28 per cent) and online intermediaries such as MoneySupermarket (25 per cent). When budgeting for lending through P2P business lending platforms, it is clear that the money primarily comes from lenders' investment budget (54 per cent) or their savings (45 per cent). Very few people (less than 2 per cent) have lent money they would otherwise use for day-to-day spending.
Lenders are primarily motivated by the financial return available
The main reason why people use P2P business lending to lend is to make a financial return on investment, with 82 per cent of respondents stating this as very important in their decision. Building on this, many also stated the service that P2P business lending offers, in terms of the ease of lending process (important or very important to 87 per cent), diversifying investment portfolios (important or very important to 88 per cent) and having control over where the lent money is going (important or very important to 81 per cent) were key to their decision to lend.
Unlike the donation and reward-based fundraising, the opportunity to use the P2P business lending model to support a specific sector or industry, supporting friends and family or supporting a social cause was of relatively low importance to the majority of lenders. Furthermore, it is interesting to observe that almost none of the P2P business lenders had personal connections to the businesses they lent to, with 97 per cent saying their first loan was to someone they didn't know.
Registered but inactive lenders concerned by business creditworthiness
We also asked those lenders who have set up accounts with P2P business lending platforms but have yet to make their first loan (5 per cent of all surveyed lenders) what would make them start lending. The key issue ranked important or very important by these potential lenders was uncertainty about the creditworthiness of business seeking loans (73 per cent of respondents). Uncertainty about how the model worked was not one of the more cited factors with 35 per cent saying this was 'important' or 'very important’. Inactive members highlighted more information about businesses seeking loans (13 per cent), greater tax incentives (31 per cent) and more information about risks associated with lending (11 per cent) as three key factors that would make them begin lending. Finally, 58 per cent of the surveyed inactive lenders indicated that they would start lending within the next 12 months.
Borrower seeking growth or working capital and value speed of service
Businesses seeking to borrow via P2P business lending most commonly seek a loan for expansion and/or growth capital (41 per cent) and working capital (34 per cent). SMEs borrowers often choose P2P business lending because the combination of the speed and ease of use of the model, rated important or very important by 94 per cent and 90 per cent of borrowers respectively. 91 per cent of borrowers highlight how they see P2P business lending as an easier way to get funded than traditional channels (e.g. bank) as a key factor in their decision to choose this lending model.
P2P business lending is funding many borrowers who would otherwise struggle
Responses show that borrowers in many instances have unsuccessfully sought funding from more traditional funders such as banks before attempting to borrow via P2P business lending platforms. 79 per cent of borrowers had attempted to get a bank loan before turning to P2P business Lending, with only 22 per cent of borrowers being offered a bank loan. 33 per cent thought it was unlikely or very unlikely that they would have been able to secure funding elsewhere had they not been successful in getting a loan through the P2P business lending platform, whereas 44 per cent of respondents thought they would have been likely or very likely to secure funding from other sources had they not used P2P business lending.
Businesses receiving loans reporting growth in term of job creation and turnover
Most business respondents have experienced positive growth since successfully securing a loan. 71 per cent of borrowers reported growth in turnover, 63 per cent experienced growth in profit with 53 per cent having increased their employment. The majority of the remaining respondents reported that their turnover, profit or employment levels had remained largely the same. Less than 5 per cent reported contraction under any metrics.
Growth of model likely to continue in 2015
The rapid growth of P2P business lending is illustrated not just by the increasing amount of money lent to businesses via the model in recent years, but also by the number of people and businesses who have only just started to use the platforms to lend and borrow. More than 69 per cent of P2P business lenders surveyed have begun using the model in just the last two years with half of these starting since the beginning of 2014. Similar trends exist on the borrower side with 48 per cent of the businesses responding to the survey having first borrowed in 2014 and 40 per cent in 2013.
Looking ahead, the majority of P2P business lenders expect to increase their lending in total and to more businesses, with 53 per cent of them expecting to lend more, and 38 per cent of them expecting to lend about the same. In addition, 65 per cent of lenders expect to lend more should their P2P lending qualify for the Individual Savings Account (ISA) scheme.
Ninety-four per cent of borrowers state that they will be likely or very likely to approach a P2P business lending platform first if they need finance in the future, and a significant 86 per cent would be likely or very likely to approach a P2P Lending platform even if a bank could offer similar terms. Ninety-seven per cent would be likely or very likely to recommend P2P business lending to other business that they know are seeking funding.
Current lenders' support for the P2P business lending model is emphasized by the fact that 59 per cent of lenders are very likely to recommend P2P business lending to others with money to lend, and 42 per cent of them are very likely to recommend P2P business lending to business looking to borrow money.
Newton Farm Foods
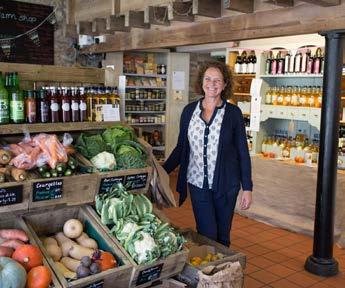
Newton Farm Foods is a family-run farm shop and café, frequented by locals and visitors to the village of Newton St. Loe in Somerset. Owner Celia uses produce from their award-winning farm to sell and cook in their café.
Although the main focus for Celia and her husband is farming, they have grown and developed their business from milking, to selling meats, to opening a small shop and café on their farm. Their business 'grew beyond belief', so Celia started looking for funding to extend the space and to include outdoor seating.
Having read our peer-to-peer business lender Funding Circle in the Sunday paper she decided it was an option that could work for her. Newton Farm Foods borrowed £60,000 from 915 people through Funding Circle to do this.
Potterspury Equine Centre

In March 2014, the Walker family borrowed £152,000 through Assetz Capital, a P2P lending platform that specialises in loans to SMEs and property developers, to purchase and develop an 8.5 acre equestrian centre in Potterspury, near Northampton. The project incorporated stables, paddocks and room for horses to exercise, as well as a small shop. Despite having a waiting list for the stables even before it was launched, Potterspury Equine Centre was unable to secure a traditional bank loan. 271 investors backed the project through an auction process, lending between £20-25,000 with expected returns of 12 per cent p/a gross.
Oyster World Games

In May 2014 Oysterworld a computer game development and publishing business based in Treforest, Wales successfully raised £300,000 on the Thincats P2P business lending platform to develop their business. This was a fixed rate auction and filled at 14 per cent by 152 lenders. Oysterworld had originally sought a bank loan but couldn't get it due to an existing charge over some of the company's assets even though this charge was due to time expire very shortly, which led the business to turn to P2P business lending.
Figure 13: How much in total have you lent via this P2P business lending platform?
A horizontal bar chart showing the percentage of respondents who have lent different amounts via P2P business lending platforms.
- £100,000+: 5%
- £50,000 - £100,000: 9%
- £20,000 - £50,000: 14%
- £5,000 - £20,000: 26%
- £1,000 - £5,000: 30%
- £500 - £1,000: 8%
- <£500: 8%
The x-axis ranges from 0% to 35% in increments of 5%, labelled "Percentage of respondents".
Figure 14: When you budget for lending through P2P business lending, where does the money come from?
A horizontal bar chart showing the percentage of respondents by source of funds for P2P business lending.
- Money I would invest: 53.7%
- Money I would save: 44.6%
- Money I would use for day to day spending: 1.7%
- Money I would give to charitable causes: 0.1%
The x-axis ranges from 0% to 60% in increments of 10%, labelled "Percentage of respondents".
Figure 15: How important are the following when making decisions about investing through P2P business lending rather than investing your money elsewhere?
A stacked horizontal bar chart illustrating the importance of various factors when deciding to invest through P2P business lending. Each bar represents a factor, and segments within the bar show the percentage of respondents rating it as "Very important", "Important", "Neither important nor unimportant", "Unimportant", or "Very unimportant".
Factors and their importance breakdown:
- To make a financial return: Very important: 82%, Important: 17%, Neither: 0%, Unimportant: 1%, Very unimportant: 0%
- To diversify my investment portfolio: Very important: 39%, Important: 49%, Neither: 9%, Unimportant: 0%, Very unimportant: 2%
- Supporting an alternative to the big banks: Very important: 39%, Important: 37%, Neither: 16%, Unimportant: 5%, Very unimportant: 3%
- To have control over where my money goes: Very important: 35%, Important: 46%, Neither: 14%, Unimportant: 4%, Very unimportant: 1%
- The ease of investment/lending process: Very important: 29%, Important: 58%, Neither: 12%, Unimportant: 0%, Very unimportant: 1%
- The choice of various loans on offer: Very important: 25%, Important: 53%, Neither: 18%, Unimportant: 0%, Very unimportant: 3%
- I feel my money is making a difference: Very important: 16%, Important: 41%, Neither: 29%, Unimportant: 9%, Very unimportant: 4%
- Supporting the SME sector: Very important: 12%, Important: 35%, Neither: 35%, Unimportant: 12%, Very unimportant: 5%
- Lending to industries I know/care about: Very important: 8%, Important: 26%, Neither: 42%, Unimportant: 18%, Very unimportant: 6%
- Doing social or environmental good: Very important: 7%, Important: 29%, Neither: 38%, Unimportant: 17%, Very unimportant: 8%
- Lending to local businesses/enterprises: Very important: 7%, Important: 19%, Neither: 43%, Unimportant: 22%, Very unimportant: 9%
- Curiosity: Very important: 6%, Important: 26%, Neither: 38%, Unimportant: 15%, Very unimportant: 16%, 2% (The "2%" is unclear, possibly a combined small percentage for the 'unimportant' categories, but visually it aligns with 'Very unimportant' which is also 16%)
- Supporting a friend or family members: Very important: 6%, Important: 33%, Neither: 30%, Unimportant: 28%, Very unimportant: 2%
- To help increase housing stocks: Very important: 11%, Important: 40%, Neither: 26%, Unimportant: 21% (No 'Very unimportant' shown for this one)
Figure 16: When choosing between lending opportunities, how important are the following in positively influencing your lending decision?
A stacked horizontal bar chart illustrating the importance of various factors when choosing between lending opportunities. Each bar represents a factor, and segments show the percentage of respondents rating it as "Very important", "Important", "Neither important nor unimportant", "Unimportant", or "Very unimportant".
Factors and their importance breakdown:
- Interest rate offered: Very important: 58%, Important: 39%, Neither: 0%, Unimportant: 0%, Very unimportant: 3%
- Risk rating/credit score: Very important: 47%, Important: 44%, Neither: 8%, Unimportant: 0%, Very unimportant: 1%
- Loan security or/and guarantee: Very important: 42%, Important: 44%, Neither: 12%, Unimportant: 0%, Very unimportant: 1%
- Loan repayment information: Very important: 23%, Important: 53%, Neither: 21%, Unimportant: 0%, Very unimportant: 2%
- Profile and nature of business: Very important: 23%, Important: 47%, Neither: 25%, Unimportant: 5%, Very unimportant: 1%
- Comments/responses in Q&A/: Very important: 21%, Important: 48%, Neither: 23%, Unimportant: 5%, Very unimportant: 2%
- Loan term/maturity: Very important: 20%, Important: 47%, Neither: 27%, Unimportant: 5%, Very unimportant: 1%
- Loan purpose: Very important: 14%, Important: 42%, Neither: 36%, Unimportant: 6%, Very unimportant: 2%
- Social impact of business: Very important: 7%, Important: 27%, Neither: 44%, Unimportant: 15%, Very unimportant: 6%
- Loan bidding history: Very important: 6%, Important: 31%, Neither: 46%, Unimportant: 14%, Very unimportant: 4%
- Location of business: Very important: 12%, Important: 43%, Neither: 29%, Unimportant: 14% (No 'Very unimportant' shown for this one)
Figure 17: How much do you plan to lend via the P2P business lending platform in the coming 12 months?
A horizontal bar chart showing the percentage of respondents' lending plans for the next 12 months.
- Lend more: 53%
- Lend about the same: 38%
- Lend less: 9%
The x-axis ranges from 0% to 60% in increments of 10%, labelled "Percentage of respondents".
Figure 18: Did you try to fundraise from the following sources before approaching P2P business lending and did you receive an offer of funding from them?
A clustered bar chart showing the percentage of respondents who sought funding from various sources and those who received an offer of funding from them, before approaching P2P business lending.
Sources of funding, with "Sought funding from" and "Received offer of funding from" percentages:
- Bank: Sought: 79%, Received: 22%
- Friends and family: Sought: 30%, Received: 26%
- Government/Public Funder: Sought: 19%, Received: 2%
- Building society/Credit union: Sought: 13%, Received: 3%
- Angel Investors: Sought: 13%, Received: 4%
- Venture Capital Firms: Sought: 12%, Received: 5%
- Philanthropic/Third Sector Funder: Sought: 7%, Received: 2%
The y-axis ranges from 0% to 90% in increments of 10%. The x-axis lists the funding sources.
Figure 19: What was your annual turnover in 2013?
A horizontal bar chart showing the percentage of respondents by their annual turnover in 2013.
- Over £5 million: 3%
- £1 million-£5 million: 14%
- £500,000-£1 million: 15%
- £200,000-£500,000: 22%
- £100,000-£200,000: 12%
- £50,000-£100,000: 13%
- £25,000-£50,000: 7%
- £0-£25,000: 12%
- £0: 3%
The x-axis ranges from 0% to 25% in increments of 5%, labelled "Percentage of respondents".
Figure 20: How many years have you been trading?
A vertical bar chart showing the percentage of respondents by years trading.
- <3 years: 26%
- 3-5 years: 22%
- 6-10 years: 15%
- >10 years: 37%
The y-axis ranges from 0% to 40% in increments of 5%, labelled "Percentage of respondents". The x-axis lists the trading year ranges.
Figure 21: What was your reason for borrowing on a P2P business lending platform?
A horizontal bar chart showing the percentage of respondents for different reasons for borrowing on a P2P business lending platform.
- Expansion/growth capital: 41%
- Working capital: 34%
- Asset purchase: 18%
- Other: 4%
- Paying for tax liability: 3%
The x-axis ranges from 0% to 45% in increments of 5%, labelled "Percentage of respondents".
Figure 22: How important were these factors in your decision to choose P2P business lending?
A stacked horizontal bar chart illustrating the importance of various factors in the decision to choose P2P business lending. Each bar represents a factor, and segments show the percentage of respondents rating it as "Very important", "Important", "Neither important nor unimportant", "Unimportant", or "Very unimportant".
Factors and their importance breakdown:
- Easier to get funded than traditional channels: Very important: 57%, Important: 34%, Neither: 6%, Unimportant: 0%, Very unimportant: 4%
- Speed: Very important: 53%, Important: 41%, Neither: 4%, Unimportant: 0%, Very unimportant: 2%
- Ease of use: Very important: 50%, Important: 40%, Neither: 8%, Unimportant: 1%, Very unimportant: 1%
- Transparency: Very important: 48%, Important: 38%, Neither: 12%, Unimportant: 1%, Very unimportant: 1%
- Better services: Very important: 42%, Important: 41%, Neither: 15%, Unimportant: 1%, Very unimportant: 2%
- Unable to get funding elsewhere: Very important: 35%, Important: 26%, Neither: 24%, Unimportant: 12%, Very unimportant: 3%
- Unable to source funding locally: Very important: 35%, Important: 18%, Neither: 36%, Unimportant: 7%, Very unimportant: 4%
- Better and more flexible terms: Very important: 28%, Important: 40%, Neither: 25%, Unimportant: 6%, Very unimportant: 1%
- More control: Very important: 27%, Important: 42%, Neither: 27%, Unimportant: 5% (No 'Very unimportant' shown for this one)
- Less risky: Very important: 24%, Important: 33%, Neither: 33%, Unimportant: 6%, Very unimportant: 4%
- Better rate: Very important: 22%, Important: 34%, Neither: 26%, Unimportant: 16%, Very unimportant: 3%
- Because the money comes from individuals: Very important: 13%, Important: 25%, Neither: 38%, Unimportant: 14%, Very unimportant: 11%
- Non-financial benefits (press/marketing etc.): Very important: 11%, Important: 19%, Neither: 46%, Unimportant: 14%, Very unimportant: 11%
- Curiosity: Very important: 9%, Important: 21%, Neither: 44%, Unimportant: 12%, Very unimportant: 14%
Figure 23: What has happened since you secured finance through P2P Business lending?
A clustered bar chart showing the percentage of respondents indicating changes in Employment, Turnover, and Profit/Net Income since securing finance through P2P business lending.
Categories of change:
- Change in Employment: Increase: 53%, About the same: 44%, Decrease: 3%
- Change in Turnover: Increase: 71%, About the same: 28%, Decrease: 1%
- Change in Profit/Net Income: Increase: 63%, About the same: 33%, Decrease: 4%
The y-axis ranges from 0% to 100% in increments of 10%, labelled "Percentage of respondents". The x-axis labels are "Change in Employment", "Change in Turnover", and "Change in Profit/Net Income".
Figure 24: How likely is it that you would have received finance elsewhere if you could not have gone to a P2P business lending platform?
A vertical bar chart showing the percentage of respondents' likelihood of receiving finance elsewhere if P2P business lending wasn't an option.
- Very likely: 17%
- Likely: 27%
- Neutral: 23%
- Unlikely: 21%
- Very unlikely: 12%
The y-axis ranges from 0% to 30% in increments of 5%, labelled "Percentage of respondents". The x-axis shows the likelihood categories.
P2P CONSUMER LENDING
Key Metrics and Market Overview
- Average amount borrowed: £5,471
- 54% have lent more than £5,000
- Lenders primarily motivated by interest rate available
- More than half of borrowers had been offered a loan from the bank but went with P2P Lending
- 46% used loan to purchase a vehicle
Market size and average growth of P2P Consumer Lending:
A bar chart illustrating the P2P consumer lending market size from 2012 to 2014, including quarterly predictions for 2014.
- 2012: £127m
- 2013: £287m
- 2014 (Predicted total): £547m
- Q1: £116m
- Q2: £128m
- Q3: £154m
- Q4: £149m (Predicted)
The chart also indicates an Average growth of +108%.
P2P consumer lending market doubles in 2014
P2P consumer lending, whereby individuals can lend and borrow money to each other online, has evolved to become an important force in the UK consumer credit and lending space. This sector is expected to grow from £287 million in 2013 to £547 million by the end of 2014 with nearly 100 per cent year-on-year growth.
Rejection rates on platforms are high while default rates remain low
For the P2P consumer lending sector, analysis was conducted on a dataset provided by platforms, which consists of 105,464 individual loans representing 20.5 million transactions (from one unique lender to one unique borrower) and £577 million worth of transactional volume. The average amount borrowed by individuals is £5,471 and the average lender portfolio size is £5,606. On average, it takes money from 201 individual lenders to fund one individual borrower's consumer loan with an average transaction value of just £27.10. However, it must be pointed out that the funding process on most of the P2P consumer lending platforms is highly automated with registered users normally only required to specify how much to lend or borrow and for what duration. Then based on algorithms and automated matching mechanisms, lenders' funds are divided and then channelled in smaller portions to fund a diversified loan portfolio at any given time. The majority of the borrowers had a A or A+ credit rating, which put them into the 'prime' or 'super-prime' borrower category, with the average rejection rate as high as 90 per cent (i.e. 9 out of 10 loan applications are rejected). This is one of the key factors to explain why the P2P consumer lending platforms have a very low average and weighted default rate of less than 1 per cent.
WHAT IS PEER-TO-PEER CONSUMER LENDING?
Individuals using an online platform to borrow from a number of individual lenders each lending a small amount; most are unsecured personal loans.
Users tend to be male and middle-aged
The average age for a borrower is 42 and approximately 80 per cent of borrowers are men. On the lender side, the average age is higher at 49 with 77 per cent of lenders being male. P2P consumer lending is also geographically sparse, with the postcode flow ratio of 0.81, which means both the lenders and borrowers are widely spread across the country.
Our survey of 6,392 borrowers and 4,259 lenders allowed us to find out more about the characteristics, behaviour and motivations of those using P2P consumer lending. A quarter of borrowers have an annual income of less than £25,000 and 18 per cent have an income of over £50,000. Lenders tended to be more present in the higher and lower income bands with 37 per cent of respondents earning less than £25,000 and 25 per cent earning more than £50,000. The main route by which P2P consumer lending users have heard about the model is through online advertising (43 per cent of borrowers and 27 per cent of lenders) and online intermediaries such as MoneySupermarket (42 per cent of borrowers and 33 per cent of lenders).
Lenders and borrowers primarily motivated by interest rate available
The key factor influencing people's decision to lend via a P2P consumer lending platform is the interest rate available on the loans they finance, with 78 per cent seeing this as a very important factor and 22 per cent as an important factor. Other factors deemed important or very important were 'the ability for lenders to choose how much to lend and for how long' (94 per cent) and 'the ease of use of the P2P consumer lending model' (89 per cent).
Borrowers primarily sought to fund the purchase of a vehicle (46 per cent), or the loan for home improvement (26 per cent) and debt consolidation (25 per cent). The primary factor influencing borrowers decision to seek a loan through P2P consumer lending was the opportunity to get a better interest rate, with 71 per cent of borrowers seeing this as a very important factor, followed by ease of use of the P2P consumer lending model (Important or very important to 90 per cent of borrowers) and the more flexible terms provided by the P2P consumer lending platforms (important or very important to 86 per cent).
More than half of the borrowers had been offered funding elsewhere
Interestingly, an inability to get funding elsewhere is not a common reason why borrowers sought a loan via a P2P consumer lending, with only 15 per cent of borrowers seeing this as a very important factor for their decision and 36 per cent seeing it as very unimportant. Of the borrowers who had sought a loan from a bank before approaching P2P consumer lending (59 per cent), the majority (over 90 per cent of them) were offered a bank loan. These findings are consistent with the strong credit profiles (i.e. prime or super-prime) of the borrowers revealed by the primary data. It is also worth highlighting that around 2-3 per cent of borrowers on P2P consumer lending platforms are borrowing for their businesses, mostly as sole-traders.
Three in four borrowers would approach P2P consumer lending first in the future
P2P consumer lending is likely to continue its rapid growth. This is evidenced by the fact that most users are recent joiners and more than half of borrowers have only started using the model within the last two years with 32 per cent beginning borrowing since the beginning of 2014. This trend is also true for lenders, where two thirds have begun lending in the last two years and 34 per cent since the beginning of 2014.
Reflecting on their experience with P2P consumer lending, 75 per cent of borrowers are very likely to approach P2P lending first if they were to borrow again in the future, and 54 per cent would be very likely to approach P2P consumer lending first even if a bank were to offer a loan on similar terms.
Lenders indicate the same support for P2P lending with 92 per cent of respondents saying they are likely or very likely to recommend P2P consumer lending to other people they know with money to lend, and 65 per cent are likely or very likely to recommend the model to people they know looking to borrow money. Finally, 64 per cent of lenders indicate they would lend more should P2P lending qualify for the ISA scheme.
Pizzarova

In 2013 Alex Corbett needed a loan to start a new gourmet fast food venture, focusing on making handmade sourdough pizzas in wood-fired ovens installed in the back of altered LandRovers. His aim was to serve night-time hot-spots and events around Somerset with pop-up restaurants. After some searching, Alex successfully sought a £60,000 loan via the Ratesetter P2P lending platform to start his business.
Andrew

In 2011 Andrew from Glasgow approached his bank for a personal loan which he needed to purchase a car as transportation for him and his young son. After the banks he approached offered him an interest rate of 18-19 per cent he went online to see what other funding options were available to him. Finding P2P lender Zopa, Andrew decided to give it a try and ended up receiving a £4,000 loan to buy and insure a black VW Polo, which he had approved at an interest rate below 10 per cent and in just three days.
Sean Harman CC BY-NC 2.0
Figure 25: How much in total have you lent via this peer-to-peer lending platform?
A horizontal bar chart showing the percentage of respondents who have lent different amounts via P2P lending platforms.
- Over £50,000: 9%
- £20,000 - £50,000: 14%
- £5,000 - £20,000: 31%
- £1,000 - £5,000: 28%
- £500 - £1,000: 8%
- £100- £500: 7%
- <£100: 4%
The x-axis ranges from 0% to 35% in increments of 5%, labelled "Percentage of respondents".
Figure 26: When you budget for investing through a P2P lending platform, where does the money come from? (can select multiple)
A horizontal bar chart showing the percentage of respondents by source of funds for investing through a P2P lending platform.
- Money I would save: 64%
- Money I would invest: 57%
- Money I would use for day to day spending: 3%
- Money I would give to charitable causes: 0.4%
The x-axis ranges from 0% to 70% in increments of 10%, labelled "Percentage of respondents".
Figure 27: How important are the following when making decisions about lending through a P2P platform rather than investing your money elsewhere?
A stacked horizontal bar chart illustrating the importance of various factors when deciding to lend through a P2P platform rather than investing money elsewhere. Each bar represents a factor, and segments within the bar show the percentage of respondents rating it as "Very important", "Important", "Neither important nor unimportant", "Unimportant", or "Very unimportant".
Factors and their importance breakdown:
- Interest rate available: Very important: 78%, Important: 22%, Neither: 0%, Unimportant: 0%, Very unimportant: 0%
- Knowing my money is protected by a provision: Very important: 60%, Important: 32%, Neither: 7%, Unimportant: 0%, Very unimportant: 1%
- I can choose how much to lend and for how long: Very important: 48%, Important: 46%, Neither: 5%, Unimportant: 0%, Very unimportant: 1%
- Supporting an alternative to the big banks: Very important: 35%, Important: 36%, Neither: 19%, Unimportant: 7%, Very unimportant: 3%
- Ease of use: Very important: 34%, Important: 55%, Neither: 9%, Unimportant: 0%, Very unimportant: 1%
- To diversify my investment portfolio: Very important: 26%, Important: 50%, Neither: 18%, Unimportant: 5%, Very unimportant: 1%
- Level of customer service: Very important: 22%, Important: 55%, Neither: 20%, Unimportant: 1%, Very unimportant: 1%
- Knowing my money is helping someone: Very important: 15%, Important: 36%, Neither: 32%, Unimportant: 12%, Very unimportant: 4%
- Access to secondary market: Very important: 8%, Important: 27%, Neither: 47%, Unimportant: 14%, Very unimportant: 3%
- Curiosity: Very important: 5%, Important: 24%, Neither: 38%, Unimportant: 18%, Very unimportant: 15%
Figure 28: What did you raise money through peer-to-peer consumer lending for?
A horizontal bar chart showing the percentage of respondents by what they raised money for through peer-to-peer consumer lending.
- Car/Vehicle purchase: 46%
- Home improvement: 26%
- Debt consolidation (e.g. paying off credit cards overdrafts): 25%
- For your business: 2%
The x-axis ranges from 0% to 50% in increments of 5%, labelled "Percentage of respondents".
Figure 29: How important were these factors in your decision to choose P2P consumer lending?
A stacked horizontal bar chart illustrating the importance of various factors in the decision to choose P2P consumer lending. Each bar represents a factor, and segments show the percentage of respondents rating it as "Very important", "Important", "Neither important nor unimportant", "Unimportant", or "Very unimportant".
Factors and their importance breakdown:
- Better interest rate: Very important: 71%, Important: 22%, Neither: 5%, Unimportant: 1%, Very unimportant: 1%
- More flexible terms (e.g early repayment): Very important: 56%, Important: 31%, Neither: 8%, Unimportant: 3%, Very unimportant: 2%
- Ease of use: Very important: 52%, Important: 38%, Neither: 7%, Unimportant: 1%, Very unimportant: 1%
- Transparency: Very important: 50%, Important: 36%, Neither: 11%, Unimportant: 1%, Very unimportant: 2%
- Speed: Very important: 50%, Important: 36%, Neither: 11%, Unimportant: 2%, Very unimportant: 2%
- More control: Very important: 45%, Important: 35%, Neither: 16%, Unimportant: 2%, Very unimportant: 2%
- Better services: Very important: 42%, Important: 37%, Neither: 18%, Unimportant: 2%, Very unimportant: 2%
- Less risky: Very important: 31%, Important: 30%, Neither: 32%, Unimportant: 4%, Very unimportant: 3%
- Because the money comes from individuals: Very important: 19%, Important: 21%, Neither: 41%, Unimportant: 12%, Very unimportant: 8%
- Curiosity: Very important: 7%, Important: 18%, Neither: 50%, Unimportant: 11%, Very unimportant: 14%
- Unable to get funding elsewhere: Very important: 7%, Important: 8%, Neither: 31%, Unimportant: 18%, Very unimportant: 36%
- Unable to source funding locally: Very important: 6%, Important: 8%, Neither: 33%, Unimportant: 20%, Very unimportant: 33%
Figure 30: Did you try to get the money from the following sources before approaching P2P lending, and did you receive an offer of funding from them?
A clustered bar chart showing the percentage of respondents who sought funding from various sources and those who received an offer of funding from them, before approaching P2P lending.
Sources of funding, with "Sought funding from" and "Received offer of funding from" percentages:
- Bank: Sought: 59%, Received: 54%
- Payday lender (online or offline): Sought: 2%, Received: 3%
- Building Society: Sought: 9%, Received: 8%
- Credit Union: Sought: 2%, Received: 2%
- Friend/family member: Sought: 7%, Received: 6%
The y-axis ranges from 0% to 80% in increments of 20%, labelled "Percentage of respondents". The x-axis lists the funding sources.
INVOICE TRADING
£56,075
Average amount raised
33% of businesses said it was unlikely that they would have received finance could they not have turned to an invoice trading provider. The average invoice finance auction only takes 8 hours.
Three in four users would use invoice trading in the future even if banks were to offer similar terms.
Market size
Average growth
+174%
Invoice Trading Market Size 2012-2014 (predicted)
A bar chart showing market size in million GBP, broken down by quarter for 2014.
- 2012: £36m
- 2013: £97m
- 2014 (Predicted): £270m
- Q1: £47m
- Q2: £56m
- Q3: £67m
- Q4: £100m
Invoice trading grew by 179 per cent in 2014
Invoice trading provides fundraising opportunities for small and medium enterprises to trade their invoices or receivables at a discount in exchange for the speedy procurement of working capital. In 2013 the sector grew by around 169 per cent and in 2014 it saw a further growth by 179 per cent. The average invoice auction duration is just eight hours with the average traded invoice value being £56,075. In the majority of cases, a trade invoice only takes seven micro-transactions to complete, signifying the participation of high networth individuals and institutional investors in this model.
A relatively small sample of 24 businesses responded to our survey of users of invoice trading, therefore the results that follow should be interpreted with caution. The surveyed SME borrowers were spread across a diverse range of sectors with 'technology' and 'business services' being the most common. More than half of the respondents were based in London or the South East but there were respondents from almost all regions in the UK.
The businesses using the invoice trading platforms tended to be small with over 90 per cent of them having fewer than 50 employees. Yet these are not necessarily young businesses. Over 40 per cent have been in business for over ten years. A third were less than 5 years old and almost all had a turnover of more than £200,000 with half having a turnover of more than £1 million.
WHAT IS INVOICE TRADING
Firms sell their invoices at a discount to a pool of individual or institutional investors in order to receive funds immediately rather than waiting for invoices to be paid.
Invoice trading is used to raise working capital
The vast majority (85 per cent) of businesses were trading invoices to secure working capital and 43 per cent of them had heard about invoice trading through online advertising. The speed of the process was what businesses valued the most (with 95 per cent stating it was a very important or important factor), with ease of use (81 per cent), transparency (85 per cent) and flexibility (85 per cent) also registering as either very important or important factors. Unsurprisingly given the reason for approaching invoice trading, the other important impact for SMEs was an improvement in cash flow, reported by 92 per cent of the respondents stating the effect. Almost all had approached banks beforehand with only a fifth receiving offers of funding from them. Over half saw it as 'unlikely' or 'very unlikely' that they would have received finance should they not have turned to an invoice trading platform.
Three in four would approach invoice trading before a bank in the future
Since receiving funding, 90 per cent of the respondents reported an increase in profit, 80 per cent of them saw an increase in turnover and 60 per cent recorded an increase in employment. Almost all plan to approach an invoice trading platform for funding in the future with three in four saying they would do so even if banks were to offer funding on similar terms. Eighty-six per cent are 'likely' or 'very likely' to recommend invoice trading to other businesses.

CADA
CADA Design is a London-based interior and graphic design company with a £3 million turnover. CADA has used the invoice trading platform MarketInvoice 20 times to convert over £441,000 worth of invoices into usable cashflow, paying an average 2-3 per cent per invoice cashed in. CADA has more than doubled their turnover, and gone from 18 to 30 staff in the past 18 months.
Figure 31: What was your purpose(s) for trading invoice(s)? (can select multiple)
A bar chart showing the percentage of respondents for different purposes.
- Working capital: 86%
- Expansion/growth: 14%
- Asset purchase: 5%
Figure 32: How important were these factors in your decision to choose invoice trading?
A stacked bar chart showing the importance of various factors.
- Speed: Very important (71%), Important (24%), Neither (5%), Unimportant (0%), Very unimportant (0%)
- More control: Very important (53%), Important (37%), Neither (11%), Unimportant (0%), Very unimportant (0%)
- Ease of use: Very important (52%), Important (29%), Neither (19%), Unimportant (0%), Very unimportant (0%)
- More flexible terms: Very important (52%), Important (33%), Neither (14%), Unimportant (0%), Very unimportant (0%)
- Easier to get funded: Very important (50%), Important (35%), Neither (10%), Unimportant (5%), Very unimportant (0%)
- Transparency: Very important (50%), Important (35%), Neither (10%), Unimportant (5%), Very unimportant (0%)
- Better services: Very important (40%), Important (30%), Neither (30%), Unimportant (0%), Very unimportant (0%)
- Unable to get funding elsewhere: Very important (37%), Important (26%), Neither (21%), Unimportant (11%), Very unimportant (5%)
- Unable to source funding locally: Very important (33%), Important (17%), Neither (28%), Unimportant (11%), Very unimportant (11%)
- Better pricing for invoices: Very important (29%), Important (29%), Neither (35%), Unimportant (6%), Very unimportant (0%)
- Lower cost: Very important (29%), Important (38%), Neither (24%), Unimportant (5%), Very unimportant (5%)
- Curiosity: Very important (5%), Important (5%), Neither (53%), Unimportant (11%), Very unimportant (26%)
Figure 33: How did you find out about online invoice trading?
A bar chart showing the percentage of respondents for different information sources.
- Online Advertising: 47%
- Professional advisor (e.g. financial advisor, accountant): 29%
- Offline/Print Advertising: 12%
- Business Associations (e.g. CBI, FSB): 12%
- Friends and Family: 6%
Figure 34: How likely is it that you would have received finance elsewhere if you could not have gone to invoice trading?
A bar chart showing the likelihood of receiving finance elsewhere.
- Very unlikely: 21%
- Unlikely: 11%
- Neither: 16%
- Likely: 32%
- Very likely: 21%
Figure 35: What has happened since you secured finance through invoice trading?
A stacked bar chart showing changes in profit/net income, turnover, and employment.
- Profit/Net Income: Decreased (0%), About the same (10%), Increased (90%)
- Turnover: Decreased (0%), About the same (20%), Increased (80%)
- Employment: Decreased (5%), About the same (35%), Increased (60%)
Figure 36: How likely are you to do the following after your invoice trading experience?
A stacked bar chart showing likelihood for future actions.
- Approach an invoice trading platform first if you need working capital in the future? Very likely (81%), Likely (19%), Unsure (0%), Unlikely (0%), Very unlikely (0%)
- Approach an invoice trading platform even if a bank offers you similar terms? Very likely (48%), Likely (29%), Unsure (14%), Unlikely (10%), Very unlikely (0%)
- Recommend invoice trading to other businesses that you know? Very likely (62%), Likely (24%), Unsure (14%), Unlikely (0%), Very unlikely (0%)
EQUITY CROWDFUNDING
£199,095
Average amount raised
Two-thirds of investors have invested more than £1,000
38% of investors were professional investors or high net-worth individuals
Since securing funding 70% of businesses have increased turnover, 60% have increased employment
54% of businesses sought expansion capital, 46% sought seed or start-up capital
Market size
Average growth
+410%
Equity Crowdfunding Market Size 2012-2014 (predicted)
A bar chart showing market size in million GBP, broken down by quarter for 2014.
- 2012: £3.9m
- 2013: £28m
- 2014 (Predicted): £84m
- Q1: £14m
- Q2: £17m
- Q3: £23m
- Q4: £30m
Equity-based crowdfunding grew by 201 per cent in 2014
Equity-based crowdfunding, whereby investors can diversify their portfolio and invest in both early-stage (e.g. pre-seed, seed and start-up) ventures as well as growth-stage companies, continues its rapid expansion with a 201 per cent year-on-year growth rate and facilitated £84 million in predicted total transaction volume for 2014.
WHAT IS EQUITY-BASED CROWDFUNDING
Sale of a stake in a business to a number of investors in return for investment, predominantly used by early-stage firms
Analysis of a dataset gathered from equity-based crowdfunding platforms, covering £37.43 million transactions from 2011 to the first quarter of 2014 and including 188 funded deals and 23,414 micro-transactions, shows that the average deal size of an equity-based crowdfunding campaign is £199,095. On average, it takes 125 investors to fund an equity deal with the average micro-transaction value being £1,599.
The average age of fundraisers is 43 and the average age of investors is 40. From the investor side, the average investment portfolio size is £5,414 with an average diversification rate of 2.48 (i.e. on average, one investor has invested in 2.48 equity-crowdfunding deals). Almost 95 per cent of the funded equity-based crowdfunding deals were eligible either for the EIS (Enterprise Investment Scheme) or the SEIS (Seed Enterprise Investment Scheme) schemes.
Sixty-two per cent of investors didn't have previous investment experience
Equity-based crowdfunding platforms are proving attractive for both retail investors who are new to venture capital investing, as well as for experienced investors. 62 per cent of the 290 investors surveyed described themselves as being retail investors with no previous investment experience. A sample of data from the platforms shows that the average portfolio size for certified high networth individuals and 'sophisticated investors' is over £8,000 in contrast to less than £4,000 for 'retail investors'.
Three-quarters of investors had invested in businesses run by entrepreneurs whom they had no previous knowledge about or connection to. The most common method of discovering investment opportunities was through browsing the equity-crowdfunding platform, with the least being offline promotion of the investment opportunities.
Investors primarily invest through equity-based crowdfunding platforms in the hope of making a financial return (very important to 61 per cent of investors). Portfolio diversification, the ease of the investment process and the added control over where their money goes was also seen as important or very important to more than 75 per cent of surveyed investors. Few investors came to the model to invest in a family member or a friend or to support a local business. Instead, investors are selecting specific investment opportunities on the crowdfunding platform, with the quality of the team (rated 'important' or 'very important' by 97 per cent of respondents) and the pitch (96 per cent) named as the most important factors. External endorsements and the views of other investors on forums were deemed less important. While 66 per cent of surveyed investors identified tax reliefs as an important factor, more than half stated that they would have invested even if the tax incentives were not present, with only a quarter saying they would not have.
While investors often read comments by other investors when making investment decisions, they rarely contribute comments or get in touch with other investors to discuss investment opportunities. The money they use to invest is money that would otherwise have (at least partly) been invested elsewhere (68 per cent of respondents) or saved (44 per cent of respondents).
Ventures seeking finance tended to find out about equity-based crowdfunding through online advertising or through the media and press. Over a third had sought funding from friends and family or business angels prior to approaching an equity-based crowdfunding platform.
Forty-seven per cent of successful fundraisers have increased their profit
For those who were successful in their attempt to fundraise, the biggest challenges with the process were developing a marketing strategy and a crowdfunding pitch. They reported that finding and working with an equity-based crowdfunding platform was not difficult.
Fundraisers found that funders added value beyond their financial contributions to the business through assisting with making connections to people in their networks (63 per cent of respondents) and providing market validation for the venture (60 per cent). Fundraisers believed that the most important routes to successfully sourcing funders was through their existing social networks and direct mailing.
Since securing funding, 47 per cent of fundraisers have increased profits, 70 per cent grew turnover and 60 per cent of them have taken on new employees. Three-quarters of the surveyed fundraisers have also launched a new product or service and two-thirds have attracted media coverage.
Half of investors plan on investing more in 2015
Those ventures that failed to reach their funding target identified that failure to generate momentum in the early stages of the campaign, insufficient support from the platform and not doing enough marketing as factors that led to their failure. Despite this, 80 per cent of them said they would be willing to try it again and half would recommend equity-based crowdfunding to others with the rest unsure.
Of the 196 active investors surveyed, 85 per cent had made their first investment since the beginning of 2013, with 36 per cent of investors becoming active in the last three months.
Around half of the investors surveyed plan to invest more in the coming year with around a third planning on investing the same amount. Eighty-one per cent of investors state they would recommend equity-based crowdfunding to someone they know, while 75 per cent say they would recommend a specific business seeking investment.
However, it is important to note that given the nature of investing in early-stage companies and the relative nascent state of equity-based crowdfunding model, that most equity crowdfunding investors are yet to see what returns their investments can bring.
All successful fundraisers would recommend equity-based crowdfunding to someone else seeking funding and 91 per cent of them state they would approach an equity crowdfunding platform first in the future if venture capital is needed.

Zero Carbon Food
Zero Carbon Food grows fresh salads greens and micro-herbs in disused underground spaces. They set up their first farm twelve stories underground, in a former WW2 bomb shelter underneath Clapham in South London. The aim is to commercially supply restaurants and individuals with locally and sustainably-grown fresh food. In August 2014, they used Crowdcube, an equity-crowdfunding platform to raise £580,810 from 482 investors for 29.04 per cent equity, exceeding their initial £300,000 target. Zero Carbon Food have since expanded their range of greens, and commercialised their produce.

NearDesk
NearDesk describes itself as the Oyster Card for desks, as the company lets users rent desk space at a growing number of different locations across the UK, including the opportunity for hourly rental of desk space. To grow the business, NearDesk sought to raise finance through Seedrs, an equity-based crowdfunding platform. In July 2014, NearDesk completed its equity-based crowdfunding round and raised £1 million by offering 22.56 per cent equity in its business.
Image credit: Josh Hallet CC BY-SA 2.0

Soshi Games
In January 2014, Soshi Games, a mobile game developer that combines expertise in consulting with creating digital games and apps for businesses, sought to raise capital through selling equity. The company managed to secure £285,000 of funding through Syndicate Room, an equity crowdfunding platform that allows its members access to investment opportunities that are backed by angel investors and venture capitalists. In the case of Soshi, the crowd invested alongside MidVen, an owner-managed VC firm that has invested in SMEs since 1990. Since raising finance Soshi has grown to a team of 11.
FUNDRAISERS
Figure 37: Fundraising activity before crowdfunding
A stacked bar chart showing the percentage of respondents who offered or sought funding from various sources.
- Government/Public Funder: Offered Funding (7%), Sought Funding (22%)
- Venture Capital Firm: Offered Funding (11%), Sought Funding (22%)
- Bank: Offered Funding (4%), Sought Funding (26%)
- Angel Investor: Offered Funding (20%), Sought Funding (41%)
- Friends and family: Offered Funding (41%), Sought Funding (54%)
Figure 38: Reasons for choosing equity-based crowdfunding
A stacked bar chart showing the importance of various factors for choosing equity-based crowdfunding.
- Transparency: Very important (47%), Important (37%), Neither (13%), Unimportant (0%), Very unimportant (3%)
- I can raise money on my own terms: Very important (46%), Important (38%), Neither (13%), Unimportant (3%), Very unimportant (0%)
- Easier to get funded than through traditional channels: Very important (41%), Important (41%), Neither (10%), Unimportant (8%), Very unimportant (0%)
- Speed: Very important (39%), Important (47%), Neither (11%), Unimportant (0%), Very unimportant (3%)
- More control: Very important (39%), Important (39%), Neither (16%), Unimportant (5%), Very unimportant (0%)
- Unable to source funding locally: Very important (32%), Important (34%), Neither (16%), Unimportant (11%), Very unimportant (8%)
- Ease of use: Very important (30%), Important (57%), Neither (14%), Unimportant (0%), Very unimportant (0%)
- Unable to get funding elsewhere: Very important (29%), Important (34%), Neither (18%), Unimportant (13%), Very unimportant (5%)
- Better service: Very important (24%), Important (37%), Neither (26%), Unimportant (11%), Very unimportant (3%)
- Non-financial benefits (press/marketing etc.): Very important (22%), Important (32%), Neither (32%), Unimportant (14%), Very unimportant (0%)
- Because the money comes from individuals: Very important (16%), Important (29%), Neither (42%), Unimportant (8%), Very unimportant (5%)
- Curious: Very important (10%), Important (23%), Neither (33%), Unimportant (13%), Very unimportant (21%)
UNSUCCESSFUL FUNDRAISERS
Figure 39: Would you recommend equity-based crowdfunding to someone else?
A pie chart showing responses to recommending equity-based crowdfunding.
- Yes: 50%
- No: 50%
- Unsure: 0% (not shown in chart, implied)
Figure 40: Would you try it again in the future?
A pie chart showing responses to trying equity-based crowdfunding again.
- Yes: 79%
- No: 21%
- Unsure: 0% (not shown in chart, implied)
SUCCESSFUL FUNDRAISERS
Figure 41: Challenges in raising funds through equity-based crowdfunding
A stacked bar chart showing perceived difficulty of various challenges.
- Developing marketing /social media strategy: Very Easy (9%), Easy (22%), Neither easy nor difficult (39%), Difficult (22%), Very Difficult (9%)
- Developing the crowdfunding pitch: Very Easy (9%), Easy (23%), Neither easy nor difficult (41%), Difficult (23%), Very Difficult (5%)
- Deciding how much equity to offer: Very Easy (17%), Easy (30%), Neither easy nor difficult (22%), Difficult (26%), Very Difficult (4%)
- The application and due diligence process: Very Easy (4%), Easy (43%), Neither easy nor difficult (30%), Difficult (17%), Very Difficult (4%)
- Communicating with prospective investors: Very Easy (13%), Easy (57%), Neither easy nor difficult (9%), Difficult (9%), Very Difficult (13%)
- Managing investor relations: Very Easy (23%), Easy (50%), Neither easy nor difficult (9%), Difficult (14%), Very Difficult (5%)
- Finding the right crowdfunding platform: Very Easy (30%), Easy (43%), Neither easy nor difficult (17%), Difficult (4%), Very Difficult (4%)
- Working with crowdfunding platform: Very Easy (45%), Easy (32%), Neither easy nor difficult (9%), Difficult (5%), Very Difficult (9%)
Figure 42: Change since securing funding
A stacked bar chart showing changes in profit, turnover, and employment.
- Profit: No change (47%), Increase (47%), Decrease (5%)
- Turnover: No change (30%), Increase (70%), Decrease (0%)
- Employment: No change (40%), Increase (60%), Decrease (0%)
Figure 43: Non-financial support received from funders
A bar chart showing the percentage of respondents receiving non-financial support.
- Networking and connections: 63%
- Proof of concept/Market Validation: 60%
- Marketing/Advocacy: 53%
- Help with their expertise and knowledge: 50%
- Help with follow-on funding: 39%
- Assistance with business/product development: 30%
INVESTOR
Figure 44: Status of investors
A bar chart showing the percentage breakdown of investor types.
- Professional investor with previous experience/high-networth individual: 38%
- Retail Investor with no previous experience of early stage/venture capital investment: 62%
Figure 45: How important are the following in your decision to invest in businesses through equity-based crowdfunding?
A stacked bar chart showing the importance of various factors in investment decisions.
- The prospect of financial returns: Very important (61%), Important (35%), Neither (4%), Unimportant (0%), Very unimportant (1%)
- To diversify my investment portfolio: Very important (30%), Important (47%), Neither (17%), Unimportant (5%), Very unimportant (1%)
- The ease of investment process: Very important (27%), Important (59%), Neither (10%), Unimportant (5%), Very unimportant (0%)
- To have control over where my money goes: Very important (25%), Important (55%), Neither (17%), Unimportant (1%), Very unimportant (2%)
- I feel my money is making a difference: Very important (22%), Important (41%), Neither (28%), Unimportant (7%), Very unimportant (2%)
- Investing in industries I know/care about: Very important (20%), Important (46%), Neither (25%), Unimportant (9%), Very unimportant (1%)
- Access to deal flow: Very important (15%), Important (36%), Neither (40%), Unimportant (6%), Very unimportant (4%)
- Doing social or environmental good: Very important (10%), Important (36%), Neither (30%), Unimportant (15%), Very unimportant (9%)
- Investing in local businesses: Very important (9%), Important (24%), Neither (34%), Unimportant (23%), Very unimportant (11%)
- Curiosity: Very important (8%), Important (42%), Neither (31%), Unimportant (13%), Very unimportant (6%)
- Supporting a friend or family members: Very important (6%), Important (22%), Neither (35%), Unimportant (21%), Very unimportant (17%)
Figure 46: Would you have invested through equity-based crowdfunding if tax incentives such as SEIS (Seed Enterprise Investment Scheme) and EIS (Enterprise Investment Scheme) were not present?
A pie chart showing the impact of tax incentives on investment.
- Yes: 52%
- No: 24%
- Unsure: 25%
Figure 47: When you budget for investing through equity-based crowdfunding, where does the money come from? (can select multiple)
A bar chart showing sources of investment funds.
- Money I would invest: 68%
- Money I would save: 44%
- Money I would use for day to day spending: 10%
- Money I would give to charitable causes: 2%
REGISTERED USERS YET TO BEGIN INVESTING
Figure 48: How important were the following factors in keeping you from investing to date?
A stacked bar chart showing the importance of factors hindering investment.
- Risk relating to the business: Very important (36%), Important (41%), Neither (17%), Unimportant (5%), Very unimportant (0%)
- Haven't found a business I want to invest in: Very important (36%), Important (36%), Neither (20%), Unimportant (7%), Very unimportant (3%)
- The lack of liquidity: Very important (25%), Important (30%), Neither (22%), Unimportant (19%), Very unimportant (4%)
- Haven't had time to examine pitches in detail: Very important (23%), Important (35%), Neither (33%), Unimportant (7%), Very unimportant (3%)
- Risk relating to the platform: Very important (22%), Important (34%), Neither (21%), Unimportant (17%), Very unimportant (5%)
- Not enough information about the business: Very important (17%), Important (29%), Neither (40%), Unimportant (13%), Very unimportant (0%)
- Uncertainty about regulation: Very important (15%), Important (14%), Neither (27%), Unimportant (26%), Very unimportant (18%)
- Business' valuation is not accurate: Very important (15%), Important (35%), Neither (41%), Unimportant (9%), Very unimportant (0%)
- Lack of understanding of tax breaks: Very important (15%), Important (24%), Neither (28%), Unimportant (19%), Very unimportant (15%)
- Don't feel like I have enough knowledge: Very important (12%), Important (19%), Neither (25%), Unimportant (21%), Very unimportant (23%)
Summary of Community Shares Market Performance and Investor Engagement:
This chart visually summarizes key statistics for community shares, including average amount raised, investor engagement, and market size growth.
Average Amount Raised:
£174,286
Average Investment in Community Shares:
£368
Investor Engagement:
* 38% of investors in community shares attended local shareholder meetings
* 32% of investors have offered to volunteer directly with the project they supported
* The prospect of a financial return was only important or very important to 24% of investors
Market Size (by year):
* 2012: £9 million
* 2013: £15 million
* 2014: £34 million (with an average growth of +95%)
Predicted Quarterly Breakdown for 2014 Market Size (£34m):
* Q4: £7.0 million
* Q3: £6.6 million
* Q2: £11.5 million
* Q1: £8.5 million
Market for community shares worth £34 million.
In 2014 the community shares market grew by 124 per cent from £15 million in 2013 to £33.6 million this year. While the majority of community shares investing occur offline, the online offering of community shares is becoming increasingly important in this model of alternative finance. From analysis of the data we attained via online community shares platform, the average deal size is £174,286. On average, it takes 474 investors to fund a community shares offering with an average investment amount of £368.
The term community shares refers to withdrawable share capital; a form of share capital unique to co-operative and community benefit society legislation. This type of share capital can only be issued by co-operative societies, community benefit societies and charitable community benefit societies.
Three hundred and eighty investors of online community shares were surveyed to gain further insights on the model. The majority of activity in online community shares investing is in the South of the UK, with 55 per cent of all online community shares investors based in the South East, and 14 per cent based in London. They are also most prevalent in older age brackets with only 18 per cent of investors under 44 years old and 55 per cent being 55 or older. 39 per cent of investors have an annual income less than £25,000, and 26 per cent have an annual income between £25,000 and £35,000. 19 per cent of them earn between £35,000 and £50,000, with only 17 per cent of investors earning £50,000 or more. When asked how much they had invested in online community shares offering, respondents predominantly selected between £51 and £100 (36 per cent) and between £101 and £500 (40 per cent). Only 2 per cent of investors have contributed £50 or less and just 15 per cent had invested over £1000.
Forty-two per cent of investors in community shares made their first investment in a community project run by an organisation they knew. However, for a large proportion of investors (38 per cent), their first investment was in a community project run by someone they didn't know prior to the investment.
Seventy-eight per cent of investors surveyed had made just a single investment and 15 per cent of them invested in 2 or 3 community shares offerings. Very few (7 per cent) had bought community shares more than three times. The primary route through which funders are finding out about online community shares offering is media mentions (46 per cent or respondents), followed by social media (22 per cent) and offline promotion (18 per cent).
When deciding to invest through community shares, the factors identified as being most important are the social aims of the project receiving investment. More than 90 per cent of respondents reported 'doing social or environmental good', 'feeling their money is making a difference' and that 'the organisation or projects invested in will create a stronger community' as important or very important factors. The prospect of achieving financial returns was only important or very important to 24 per cent of investors. 68 per cent of respondents say they invested amounts that they felt they could afford to lose.
When asked about their connections to the project, 55 per cent of investors stated that they invested in a project they could access or use. 59 per cent of respondents invested in a project that others in or outside of their local community could also benefit from.
One in Three Offer to Volunteer with the Project They Invested In
When asked where in their budget the money invested in community shares comes from, 58 per cent reported that it is money they would otherwise save with only 12 per cent used the money they would otherwise give to charitable causes.
In addition to the financial support, investors in community shares have offered a series of non-financial contributions to the projects they have invested in. 35 per cent have given feedback to fundraisers running the campaign and 32 per cent of them have offered to volunteer directly with the community project they funded. 38 per cent of respondents have attended shareholder meetings subsequently.
Looking ahead, 75 per cent of people who invested in online community shares offering would be likely or very likely to recommend this form of investing to people they know. 67 per cent of investors would be likely or very likely to invest more should they get a 30 per cent social investment tax relief on their investment in community shares.
A photograph of Hastings Pier, a long pier stretching into the sea with a light-coloured structure, seen from a slightly elevated perspective. People are visible walking on the pier.
Hastings Pier
In October 2013, the Hasting Pier Charity set out to raise £500,000 to bridge the funding gap in rebuilding the community's pier via the Microgenius online community shares platform. The total cost of the rebuild is £14 million, of which a large amount was secured from the Heritage Lottery Fund.
By the end of the campaign with Microgenius in April 2014, 3,057 people had bought community shares in the pier for a total of £562,560. The aim of the project was to increase the attractiveness of the region for tourism, and give the community a sense of ownership over the iconic monument. The pier is due to reopen in spring 2015, with funfairs, a circus, an open-air cinema and theatre, farmers' markets and a heritage centre among the plans for the attraction.
Investor
Figure 49: How important are the following in your decision to invest in organisations/projects through community shares crowdfunding?
This stacked bar chart shows the percentage of respondents rating various factors as "Very important", "Important", "Neither important nor unimportant", "Unimportant", or "Very unimportant" when deciding to invest in community shares crowdfunding.
- Investing in my local community: 55% Very important, 34% Important, 9% Neither, 1% Unimportant, 1% Very unimportant.
- Doing social or environmental good: 53% Very important, 41% Important, 6% Neither, 0% Unimportant, 0% Very unimportant.
- Organisation/project I invested in will create a stronger community: 53% Very important, 40% Important, 7% Neither, 0% Unimportant, 0% Very unimportant.
- I feel my money is making a difference: 49% Very important, 45% Important, 6% Neither, 0% Unimportant, 0% Very unimportant.
- Organisation/project I invested in will be owned democratically by the community: 42% Very important, 42% Important, 14% Neither, 0% Unimportant, 2% Very unimportant.
- The ease of investment process: 8% Very important, 44% Important, 33% Neither, 11% Unimportant, 4% Very unimportant.
- Supporting a friend or family members: 7% Very important, 19% Important, 38% Neither, 20% Unimportant, 15% Very unimportant.
- Curiosity: 4% Very important, 15% Important, 40% Neither, 17% Unimportant, 24% Very unimportant.
- The prospect of financial returns: 4% Very important, 20% Important, 38% Neither, 26% Unimportant, 13% Very unimportant.
- Gaining experience and confidence to set up my own share offer: 2% Very important, 5% Important, 27% Neither, 28% Unimportant, 38% Very unimportant.
- To diversify my investment portfolio: 1% Very important, 13% Important, 19% Neither, 32% Unimportant, 34% Very unimportant.
Figure 50: Did you support community shares crowdfunding campaigns in any of the following ways beyond funding them?
This horizontal bar chart shows the percentage of respondents who supported community shares crowdfunding campaigns in various non-financial ways.
- Promoting the campaign: 57%
- Attending shareholder meetings/AGMs: 39%
- Giving feedback/advice to those running the campaign: 35%
- Offering to help/volunteer directly with the project: 32%
- Making introductions and connections: 24%
- Giving goods to the campaign rather than money: 4%
- Helping the fundraisers by letting them use space you have: 1.4%
Figure 51: As a funder/investor in community shares, how important are the following?
This stacked bar chart shows the importance ratings for various aspects as a funder/investor in community shares, broken down into "Very important", "Important", "Neither important nor unimportant", "Unimportant", and "Very unimportant".
- Getting directly involved with running of the project/organisation: 8% Very important, 25% Important, 39% Neither, 22% Unimportant, 7% Very unimportant.
- Attending shareholder meetings/AGMs: 6% Very important, 31% Important, 33% Neither, 22% Unimportant, 8% Very unimportant.
- Getting your investment back: 5% Very important, 25% Important, 31% Neither, 26% Unimportant, 13% Very unimportant.
- Receiving interest/dividend on your investment: 5% Very important, 22% Important, 35% Neither, 26% Unimportant, 11% Very unimportant.
Pension-Led Funding
Summary of Pension-Led Funding Market Performance and User Characteristics:
This chart visually summarizes key statistics for Pension-Led Funding (PLF), including average amount raised, user demographics, and market size growth.
Average Amount Raised:
£70,257
User Characteristics:
* PLF users are mostly small businesses.
* 7% were sole traders.
* 60% had 5 or fewer employees.
* 51% of PLF fundraisers thought that they would have been unlikely or very unlikely to secure funding elsewhere.
* 43% have increased their employment after raising finance via PLF.
Market Size (by year):
* 2012: £23 million
* 2013: £25 million
* 2014: £25 million (with an average growth of 5%)
Predicted Quarterly Breakdown for 2014 Market Size (£25m):
* Q4: £7.2 million
* Q3: £6.0 million
* Q2: £4.2 million
* Q1: £7.4 million
Pension led funding is now a £25 million market.
Pension-led funding (PLF) offers SME owners and directors the opportunity to re-channel, and re-invest their pension funds back into their own ventures and companies mostly as working or expansion capital through SIPP or SASS instruments. PLF has supplied more than £25 million of finance to SMEs in 2014. Analysis of data from PLF providers show that the average amount raised through PLF is £70,257.
What is Pension-Led Funding?
Mainly allows SME owners/directors to use their accumulated pension funds in order to invest in their own businesses. Intellectual properties are often used as collateral.
Pension Led Funding Is Used Primarily by Small Mature Businesses
Seventy-four businesses responded to our survey of PLF users. The businesses seeking PLF came from a range of sectors with retail, construction, technology and manufacturing among the most prevalent. They are almost entirely small businesses. Seven per cent were sole traders with 60 per cent having five or fewer employees. Though small, many are not young. Almost half have been trading for more than 10 years with just eight per cent trading for less than three years. Three-quarters had begun using PLF in the last three years.
Users of PLF believed it was easier to access funds through the model than through traditional financing channels. They also value being able to utilise their pension funds (an 'important' or 'very important' factor in choosing PLF for 66 per cent of respondents) and having more control over their finances (73 per cent). More than half had approached a bank for funding before securing funds through PLF, with less than a third of those receiving an offer of funding from the bank.
When asked how they found out about PLF, the most common responses were professional advisor (40 per cent) and offline advertising (35 per cent). Whilst some respondents found it difficult to find the PLF provider (11 per cent) and to transfer their existing pension across (13 per cent), in general, most of the survey respondents found that PLF was easy to use.
Sixty-two Per Cent of Businesses Have Seen Their Profit Grow After Securing Finance Through PLF
Just over half of the businesses surveyed believed it would have been 'unlikely' or 'very unlikely' that they would have secured the funds they needed from other sources, had they been unable to use PLF. Since obtaining funding, 62 per cent have seen their profit grow, 59 per cent have increased turnover and 43 per cent have employed more people. Other reported impacts since securing PLF include improved cash flow (53 per cent) and the launching of a new product or service (47 per cent).
Respondents' view of PLF was generally positive. 81 per cent say they would be 'likely' or 'very likely' to recommend PLF to a business they know. 79 per cent are 'likely' or 'very likely' to approach PLF for funds in the future with 66 per cent inclined to do so, even if a bank offered funds on similar terms.
Figure 52: In which sector does your company/organisation operate?
This horizontal bar chart illustrates the percentage of respondents operating in various sectors.
- Retail and Wholesale: 16%
- Construction: 12%
- Technology: 11%
- Manufacturing and Engineering: 11%
- Media and Publishing: 10%
- Business and Professional Services: 10%
- Health and Social Work: 7%
- Real Estate and Housing: 5%
- Food and Drink: 5%
- Transport and Utilities: 3%
- Energy and Mining: 3%
- Education and Research: 3%
- Internet and E-Commerce: 1%
- Finance: 1%
- Arts, Music and Design: 1%
- Agriculture: 1%
Figure 53: How many years have you been trading?
This horizontal bar chart displays the percentage of respondents based on how many years their company has been trading.
- More than 10 years: 48%
- 6-10 years: 28%
- 5 years: 4%
- 4 years: 1%
- 3 years: 11%
- 2 years: 2%
- 1 year: 2%
- Less than one year: 4%
Figure 54: What was your purpose(s) for raising capital through pension-led funding? (can select multiple)
This vertical bar chart shows the percentage of respondents for different purposes of raising capital through pension-led funding.
- Working capital: 58%
- Expansion/growth capital: 37%
- Asset purchase: 29%
- Paying for tax liability: 4%
Figure 55: How did you find out about pension-led funding?
This horizontal bar chart shows the percentage of respondents who found out about pension-led funding through various channels.
- Professional Advisor: 40%
- Offline/Print Advertising: 35%
- Online Advertising: 18%
- Business Associations: 7%
- Friends and Family: 4%
- Online intermediary: 2%
- Government Departments: 0%
Figure 56: How likely is it that you would have received finance elsewhere if you could not have gone to pension-led funding?
This vertical bar chart illustrates the likelihood of respondents having received finance elsewhere if pension-led funding was not an option.
- Very likely: 7%
- Likely: 18%
- Neither: 25%
- Unlikely: 29%
- Very unlikely: 22%
Figure 57: Change since accessing funding
This stacked bar chart shows the percentage change in Profit, Turnover, and Employment since businesses accessed funding, categorized by "Increase", "About the same", "Decrease", and "Business folded".
- Profit: 62% Increase, 27% About the same, 7% Decrease, 4% Business folded.
- Turnover: 59% Increase, 32% About the same, 5% Decrease, 4% Business folded.
- Employment: 43% Increase, 45% About the same, 6% Decrease, 6% Business folded.
Reward-Based Crowdfunding
Summary of Reward-Based Crowdfunding Market Performance and Funder Behavior:
This chart visually summarizes key statistics for reward-based crowdfunding, including average amount raised, funder characteristics, and market size growth.
Average Amount Raised:
£3,766
Funder Behavior:
* The majority of funders had spent less than £50 on supporting projects and mostly backed only a single project.
* 53% said they would have been unlikely to get funded were it not for crowdfunding.
* 72% of funders knew the person running the campaign they backed either personally or by reputation.
Market Size (by year):
* 2012: £4.2 million
* 2013: £21 million
* 2014: £26 million (with an average growth of +206%)
Predicted Quarterly Breakdown for 2014 Market Size (£26m):
* Q4: £8.3 million
* Q3: £5.1 million
* Q2: £7.0 million
* Q1: £5.2 million
The reward-based crowdfunding market grew to £26 million in 2014
Reward-based crowdfunding is probably the model that has really captured the public's imagination and media's attention, and it is the type of alternative finance that registered the highest usage rate (eight per cent) in our national consumer poll among all surveyed models.
Reward-based crowdfunding has seen a steady increase of 17 per cent in 2014 from £20.5 million in 2013 to over £26 million in 2014. Analysis of transactional data worth over £30 million between 2010 and the first quarter of 2014 shows that the average size of the reward-based fundraising campaign is £3,766 with approximately 77 backers per campaign and an average donation of £48.92. The average crowdfunding success rate across seven surveyed reward-based crowdfunding platforms is around 35 per cent. On average, a successful campaign took 28 days to reach their funding target.
What Is Reward-Based Crowdfunding?
Individuals donate towards a specific project with the expectation of receiving a tangible (but non-financial) reward or product at a later date in exchange for their contribution.
From the survey of 191 fundraisers and 1,128 backers who have used reward-based crowdfunding, it is clear that those seeking to fundraise in the UK through this model are predominantly those in the social sector or creative industries. They tend to be small operations, often individuals with little trading history and modest if any turnover. They had chosen reward-based crowdfunding as a potential source of finance to have more control over the project (important or very important for 78 per cent of respondents), raise funds on their own terms (66 per cent), to access the non-financial benefits that crowdfunding can provide (71 per cent) and for the transparency (71 per cent) and speed (68 per cent) of the funding process.
Most Backers Use Reward-Based Crowdfunding to Fund People They Know
When choosing which campaigns to back, more than 60 per cent of backers valued the quality of the idea, the team and knowing their money was making a difference. Funders were also quite influenced by personal recommendations from people they knew.
Backers reported that the money they used to fund projects would otherwise have gone towards day-to-day spending, rather than savings or investment. Very few backers (less than 10 per cent of those surveyed) viewed their support as an investment, but rather as a chance to support worthwhile projects.
Aside from contributing funds, 70 per cent of backers also gave non-financial support, usually by promoting the crowdfunding campaign. Eighty per cent of backers would recommend reward-based crowdfunding or a specific crowdfunding campaign to someone they knew. Many of them (39 per cent) have also used other alternative finance platforms, usually other reward-based crowdfunding sites. Funders tended to have contributed small amounts (61 per cent of respondents had in total contributed less than £50 to projects) to projects and had backed only a single project. Those on reward-based crowdfunding platforms that focused on funding creativity tended to have contributed more and backed more projects. They generally found out about the campaign through social media or direct mailing. In many cases they also had some connection to, or knowledge of, the fundraiser prior to the crowdfunding campaign. Most backers gave funds to someone they knew at least by reputation, and only 28 per cent had backed someone they didn't know.
The principle difficulties fundraisers faced when sourcing funds were finding backers and developing campaign material. Corresponding to how backers reported finding out about fundraising campaigns, fundraisers listed social media and their existing social networks as the most effective routes to reaching potential backers, with offline promotion the least effective. Just over half of fundraisers stated they would have been 'unlikely' or 'very unlikely' to raise funds without crowdfunding, a further 21 per cent did not know if they would have been able to do so or not.
Three in Four Unsuccessful Fundraisers Would Try It Again
Those who failed to reach their crowdfunding target put their lack of success down to not getting their community or network sufficiently engaged with the project(rated an 'important' or 'very important' factor in their lack of success by 80 per cent of respondents), not generating enough momentum in the campaign's early stages (74 per cent) and trying to raise too much money (50 per cent). Despite this, three quarters of surveyed fundraisers would try it again or recommend this model to someone else seeking funds.
Twenty-nine Per Cent of Fundraisers Increased Employment After Raising Finance Through Reward-Based Crowdfunding
Looking at the impact, 29 per cent of the fundraisers reported an increase in employment, 49 per cent an increase in turnover and 37 per cent a growth in profits since obtaining finance through reward-based crowdfunding. Two-thirds also reported having completed their project or launched a new product or service and getting more engagement from supporters. Related to this, three-quarters of fundraisers reported that they benefited from accessing the networks of their funders and around the same proportion said their backers provided assistance with marketing and advocacy of the project.
Ninety-two Per Cent of Fundraisers Would Recommend the Model to Someone Else Seeking Funds
The majority (70 per cent) of the successful fundraisers used the model for the first time since the beginning of 2013, providing further evidence to this being a very young market, with lots of people raising money for the first time in recent years. Successful fundraisers viewed reward-based crowdfunding quite positively and 92 per cent would recommend the model to someone else seeking funds. 81 per cent of them would approach reward-based crowdfunding again in the future should they need more finance.
Vote For Policies

Vote for Policies, an innovative online voter-support service launched a crowdfunding campaign on Crowdfunder and raised £23,551 to pay for a state-of-the-art new website to help the British public decide who to vote for in the 2015 UK general election. Initially launched just before the 2010 UK general election by social change enthusiast Matt Chocqueel-Mangan, Vote for Policies was an unprecedented success, helping 280,000 voters decide their ballots. With over 850 backers funding the project, Vote for Policies now expects to encourage up to five million current and first time voters to re-engage with party politics in a positive and meaningful way.

The CSA is a non-profit organic community farm which grows organic vegetables using a no-dig method that is respectful of the soil. The operation is entirely paid for through local people subscribing in advance for each growing season, during which they will receive weekly vegetable boxes.
In February 2014, the farm used crowdfunding platform Buzzbank to raise £13,685 from 116 supporters. This was used to double their land and membership base. The funding also enabled the farm to expand its range of activities, including growing more organic and affordable food for members, as well as extend the farms outreach programs to disadvantaged groups in the local community.
Figure 58: How much money have you used to fund through the site?
This horizontal bar chart displays the percentage of respondents based on the amount of money they have used to fund through the site.
- £1-£10: 18%
- £11-£50: 43%
- £51-£100: 17%
- £101-£500: 16%
- £501-£1,000: 3%
- £1,001-£5,000: 2%
- More than £5,000: 1%
Figure 59: Relationship to fundraiser
This horizontal bar chart shows the percentage of respondents indicating their relationship to the fundraiser.
- Someone I don't know: 28%
- Organisation/company I know: 24%
- Friend: 14%
- Someone I know by reputation: 10%
- Organisation/company I'm associated: 7%
- Other personal connection (e.g. friend): 7%
- Family member: 5%
- Colleague: 4%
Figure 60: Reasons for backing projects
This stacked bar chart illustrates the importance ratings ("Very important", "Important", "Neither important nor unimportant", "Unimportant", "Very unimportant") for various reasons for backing projects.
- The quality of the campaign pitch: 50% Very important, 41% Important, 7% Neither, 0% Unimportant, 1% Very unimportant.
- Doing social or environmental good: 45% Very important, 39% Important, 12% Neither, 1% Unimportant, 3% Very unimportant.
- I feel my money is making a difference: 40% Very important, 48% Important, 9% Neither, 1% Unimportant, 2% Very unimportant.
- How money will be spent: 33% Very important, 49% Important, 14% Neither, 1% Unimportant, 3% Very unimportant.
- The quality of the campaign team: 33% Very important, 47% Important, 16% Neither, 1% Unimportant, 3% Very unimportant.
- Supporting a local project or business: 27% Very important, 35% Important, 25% Neither, 9% Unimportant, 4% Very unimportant.
- Supporting someone I know (friends and family): 20% Very important, 31% Important, 30% Neither, 13% Unimportant, 7% Very unimportant.
- Being part of the creative process: 14% Very important, 33% Important, 34% Neither, 15% Unimportant, 4% Very unimportant.
- Getting a reward/product I couldn't get elsewhere: 10% Very important, 22% Important, 37% Neither, 21% Unimportant, 11% Very unimportant.
- Curiosity: 6% Very important, 25% Important, 43% Neither, 16% Unimportant, 11% Very unimportant.
- Funding to date: 4% Very important, 25% Important, 49% Neither, 17% Unimportant, 4% Very unimportant.
- Social pressure: 1% Very important, 2% Important, 20% Neither, 32% Unimportant, 45% Very unimportant.
Figure 61: What would you otherwise do with the money you use to back crowdfunding campaigns? (can select multiple)
This horizontal bar chart shows what respondents would otherwise do with the money they use to back crowdfunding campaigns.
- Day to day: 64%
- Savings: 22%
- Charitable giving: 21%
- Investment: 9%
Fundraisers
Figure 62: Reasons for raising through reward-based crowdfunding
This stacked bar chart illustrates the importance ratings ("Very important", "Important", "Neither important nor unimportant", "Unimportant", "Very unimportant") for various reasons fundraisers choose reward-based crowdfunding.
- Non-financial benefits (press/marketing etc.): 32% Very important, 39% Important, 22% Neither, 6% Unimportant, 0% Very unimportant.
- More overall control over my project/business: 29% Very important, 49% Important, 17% Neither, 5% Unimportant, 1% Very unimportant.
- Don't need to give out equity or taking on loans: 27% Very important, 38% Important, 27% Neither, 6% Unimportant, 2% Very unimportant.
- Unable to get funding elsewhere: 25% Very important, 30% Important, 27% Neither, 12% Unimportant, 6% Very unimportant.
- Because the money comes from individuals rather than institutions: 22% Very important, 39% Important, 28% Neither, 9% Unimportant, 3% Very unimportant.
- Transparency: 21% Very important, 50% Important, 21% Neither, 6% Unimportant, 2% Very unimportant.
- Unable to source funding locally: 20% Very important, 23% Important, 31% Neither, 16% Unimportant, 10% Very unimportant.
- I can raise funding on my own terms: 19% Very important, 47% Important, 25% Neither, 8% Unimportant, 1% Very unimportant.
- Speed: 18% Very important, 50% Important, 24% Neither, 6% Unimportant, 2% Very unimportant.
- Curious: 12% Very important, 36% Important, 39% Neither, 8% Unimportant, 6% Very unimportant.
- Creative input from my backers: 12% Very important, 31% Important, 36% Neither, 19% Unimportant, 2% Very unimportant.
UNDERSTANDING ALTERNATIVE FINANCE The UK Alternative Finance industry Report 2014 (as an introductory phrase, not a heading)
Figure 63: How difficult were the following factors when raising finance?
A stacked bar chart illustrating the perceived difficulty of various factors when raising finance.
- Sourcing funders and marketing: 7% Very Difficult, 42% Difficult, 32% Neither easy nor difficult, 17% Easy, 2% Very Easy.
- Developing campaign material (e.g. video): 4% Very Difficult, 31% Difficult, 34% Neither easy nor difficult, 28% Easy, 3% Very Easy.
- Fulfilment and delivery of rewards: 22% Very Difficult, 39% Difficult, 31% Neither easy nor difficult, 6% Easy, 3% Very Easy.
- Communicating with prospective funders: 2% Very Difficult, 22% Difficult, 32% Neither easy nor difficult, 37% Easy, 7% Very Easy.
- Setting up the crowdfunding campaign page: 7% Very Difficult, 27% Difficult, 55% Neither easy nor difficult, 10% Easy, 2% Very Easy.
- Developing your fundraising plan/pitch: 2% Very Difficult, 25% Difficult, 33% Neither easy nor difficult, 36% Easy, 4% Very Easy.
- Finding the right crowdfunding platform: 2% Very Difficult, 9% Difficult, 25% Neither easy nor difficult, 37% Easy, 27% Very Easy.
- Setting up rewards/tiers: 1% Very Difficult, 21% Difficult, 36% Neither easy nor difficult, 38% Easy, 3% Very Easy.
- The application process: 0% Very Difficult, 4% Difficult, 21% Neither easy nor difficult, 56% Easy, 18% Very Easy.
Legend: Very Difficult, Difficult, Neither easy nor difficult, Easy, Very Easy.
Figure 64: How likely is it that you would have received funding without crowdfunding?
A bar chart showing the percentage of respondents by the likelihood of receiving funding without crowdfunding.
- Very likely: 6%
- Likely: 20%
- Don't know: 21%
- Unlikely: 32%
- Very unlikely: 21%
Figure 65: Proportion of businesses seeing growth since raising crowdfunding
A stacked bar chart showing the proportion of businesses seeing growth in employment, turnover, and profit since raising crowdfunding.
- Employment: 29% Increase, 69% No Change, 1% Decrease.
- Turnover: 49% Increase, 50% No Change, 0% Decrease.
- Profit: 37% Increase, 61% No Change, 1% Decrease.
Legend: Increase, No Change, Decrease.
Figure 66: Did you receive the following non-financial support from your funders?
A horizontal bar chart showing the percentage of respondents who received various types of non-financial support from their funders.
- Networking and connections: 74%
- Marketing/Advocacy: 72%
- Proof of concept/Market Validation: 64%
- Assistance with project/product development: 51%
- Help with their expertise and knowledge: 45%
- Involvement in creative processes: 42%
- Help with follow-on funding: 23%
Having failed in your attempt to raise funds through rewards-based crowdfunding...
Figure 67: Would you try it again in the future?
A pie chart showing the percentage of respondents who would try again in the future after a failed crowdfunding attempt.
Figure 68: How likely are you to recommend crowdfunding to someone else?
A pie chart showing the percentage of respondents who would recommend crowdfunding to someone else after a failed attempt.
DEBT-BASED SECURITIES
£730,000 Average amount raised
Average investment in debt-based securities is £1,243
On average it takes 587 funders to fund a renewable energy project through debt-based securities
The opportunity to make a positive social impact was an important factor in deciding to invest for 86% of investors
A bar chart showing the market size for debt-based securities from 2012 to 2014, with a breakdown for 2014 by quarter.
Market size £4.4m
Average growth +117%
- 2012: £1.0m
- 2013: £2.7m
- 2014: £4.4m
- Q4: £1.5m (Predicted)
- Q3: £0.4m
- Q2: £1.1m
- Q1: £1.4m
The debt-based securities market grew by 63 per cent in 2014
Online debt-based securities in renewable energy projects grew by 63 per cent in 2014 to £4.4 million in total financing. The average deal size for debt-based securities is £730,000. On average, it takes 587 investors to fund a renewable energy project through debt-based securities with an average investment amount of £1,243.
The survey of 384 investors in debt-based securities shows that they in general invest relatively large amounts. Sixty-two per cent had invested more than £500 with 21 per cent having invested more than £5,000. They tended to invest in single or very few projects with a third having made only one investment and half less than three investments. This finding however must be reconciled by the fact that debt-based securities is a relatively new model of alternative finance and only a small amount of deals have been offered and funded to date.
WHAT ARE DEBT-BASED SECURITIES?
Lenders receive a non-collateralized debt obligation typically paid back over an extended period of time. Similar in structure to purchasing a bond, but with different rights and obligations.
The focus on renewable energy matters to investors, being local doesn't
Looking at motivations for investing in debt-based securities, the important or very important factor for investors was the opportunity to back green/renewable energy products (92 per cent) and to make a positive social impact (86 per cent). They cared less about whether the business behind the project was local or not. When asked what they would otherwise have done with the money they invested, a pretty even split responded that they would have either invested it elsewhere (62 per cent) or saved it (55 per cent).
Investing in debt-based securities on renewable projects was generally perceived to be a low risk investment option. When presented with a number of different investment options such as P2P lending, investing in start-ups or the stock markets, only bonds were perceived to be less risky by investors.
Funders found their way to investing in renewable projects through a number of channels. The most common of which was online advertising, which brought in a third of survey respondents, with offline advertising and word of mouth also proving important.
Forty-five per cent plan to invest more in 2015
Looking forward, 45 per cent of surveyed investors plan to put more funds through this model in the coming year with 37 per cent planning on investing a similar amount.
Resilient Energy Great Dunkilns

Using the Abundance Generation platform, Resilient Energy Great Dunkilns (REGD) reached its £1.4 million investment target on the 1st of January 2013. The money raised was used to fund the first community scale wind turbine in the Forest of Dean. The wind turbine has been operational and generating electricity since October 2012. Investors of the debentures receive an estimated rate of return of 6.75 per cent-8.0 per cent (after fees) in two yearly payments across the 20-year lifespan of the project. On top of that, the partnership has vouched to donate an average £15,000-20,000 per year of operation for further community infrastructure development.
Figure 69: How much have you invested in debt-based securities to date?
A horizontal bar chart showing the percentage of respondents by their total investment in debt-based securities.
- More than £5,000: 21%
- £2,000-5,000: 18%
- £500-2,000: 23%
- £250-500: 12%
- Less than £250: 26%
Figure 70: When making decisions about investing in debt-based securities instead of other investment opportunities, how important are the following?
A stacked bar chart showing the importance of various factors when deciding to invest in debt-based securities.
- Investing in green/renewable energy: 65% Very important, 27% Important, 4% Neither important nor unimportant, 1% Unimportant, 2% Very unimportant.
- I feel my money is making a difference: 50% Very important, 33% Important, 11% Neither important nor unimportant, 2% Unimportant, 2% Very unimportant.
- To have a positive social impact: 45% Very important, 41% Important, 10% Neither important nor unimportant, 2% Unimportant, 2% Very unimportant.
- Control over where money goes: 34% Very important, 46% Important, 16% Neither important nor unimportant, 1% Unimportant, 3% Very unimportant.
- To invest in something real/tangible: 33% Very important, 43% Important, 18% Neither important nor unimportant, 5% Unimportant, 1% Very unimportant.
- They offer a relatively low risk, stable financial return: 22% Very important, 61% Important, 11% Neither important nor unimportant, 5% Unimportant, 1% Very unimportant.
- To support local businesses: 15% Very important, 28% Important, 37% Neither important nor unimportant, 15% Unimportant, 4% Very unimportant.
- To diversify my investment portfolio: 14% Very important, 49% Important, 22% Neither important nor unimportant, 10% Unimportant, 6% Very unimportant.
- The level of investment risk: 11% Very important, 60% Important, 24% Neither important nor unimportant, 4% Unimportant, 1% Very unimportant.
- Regular capital repayments: 7% Very important, 37% Important, 34% Neither important nor unimportant, 16% Unimportant, 6% Very unimportant.
Legend: Very important, Important, Neither important nor unimportant, Unimportant, Very unimportant.
Figure 71: When you budget for investing in debt-based securities, where does the money come from? (can select multiple)
A bar chart showing the sources of money budgeted for investing in debt-based securities.
- Money I would invest: 62%
- Money I would save: 55%
- Money I would use for day to day spending: 8%
- Money I would give to charitable causes: 3%
Figure 72: How risky do you perceive this type of investing in comparison with the following?
A stacked bar chart showing how risky respondents perceive investing in debt-based securities compared to other investment types.
- Investing in startups/early stage companies: 77% Less risky, 15% About the same, 8% More risky.
- Lending to individuals: 71% Less risky, 21% About the same, 8% More risky.
- Lending to SMEs: 49% Less risky, 46% About the same, 5% More risky.
- Investing in public stocks: 40% Less risky, 39% About the same, 21% More risky.
- Bonds: 10% Less risky, 40% About the same, 49% More risky.
Legend: Less risky, About the same, More risky.
Figure 73: To the best of your knowledge, how much do you plan to invest in debt-based securities in the coming 12 months?
A stacked bar chart showing investment plans for debt-based securities in the next 12 months, in terms of total investment and number of projects.
- In terms of total investment: 45% Invest less, 37% Invest about the same, 18% Invest more.
- In terms of number of renewable energy projects invested in: 50% Invest less, 37% Invest about the same, 13% Invest more.
Legend: Invest less, Invest about the same, Invest more.
DONATION BASED CROWDFUNDING
£6,102 Average amount raised
34% of fundraisers have seen an increase in volunteering after their campaign
27% of donors had offered to help or volunteer with the project they backed
46% of donors have funded projects that others in or outside their local area could use
A bar chart showing the market size for donation-based crowdfunding from 2012 to 2014, with a breakdown for 2014 by quarter.
Market size £2.0m
Average growth +77%
- 2012: £0.8m
- 2013: £0.8m
- 2014: £2.0m
- Q4: £0.6m (Predicted)
- Q3: £0.5m
- Q2: £0.5m
- Q1: £0.4m
Projects with a social or civic focus raised £2 million through donation-based crowdfunding in 2014
Donation-based crowdfunding allows fundraisers, primarily from social and cultural groups, creative enterprises and community-based organisations to directly make an on-line appeal for donations. Donation-based crowdfunding is disintermediating the existing charitable giving sector by connecting donors directly with fundraisers and beneficiaries, for often small-scale and local projects. This new model, which is less than two years old, has already contributed a considerable £2 million a year to good causes, social projects and community initiatives. Transaction data from platforms show that the average size of successfully funded projects is £6,102. The average donation for this form of crowdfunding is £110.54, reflecting the donations from larger philanthropic and corporate funders alongside individuals. The involvement of the former is particularly the case for larger-scale civic crowdfunding projects. On average, it takes 55 donors to fund a donation-based crowdfunding campaign.
Based on a relatively small survey sample of 72 backers and 32 fundraisers, who have used donation-based crowdfunding, it is clear that the amounts contributed by individuals through this model are relatively small. 75 per cent of surveyed respondents contributed between £1- £50 in total.
WHAT IS DONATION BASED CROWDFUNDING?
Individuals donate small amounts to meet the larger funding aim of a specific charitable project while receiving no financial or material return in exchange.
Seventy-seven per cent of donations are in addition to people's normal charitable giving
Personal connections play a strong role in matching backers and fundraisers within the donation-based crowdfunding model. 52 per cent of surveyed backers reported that the first introduction they had to this type of alternative finance came through recommendations made by a friend or family member or other first or second-degree social connections. Building on this, social media plays a strong role in getting backers to support donation-based crowdfunding campaigns, with 68 per cent of backers finding out about the first campaign they supported through this medium.
The social and communal nature of donation-based crowdfunding is, as expected, the primary draw for funders. Most funders felt it was important or very important to make a difference (95 per cent), support social and environmental goods (96 per cent) and to know how the money was being spent (90 per cent). Furthermore, it is interesting to observe that 77 per cent of donors stated that money they contributed to projects with a social purpose via crowdfunding is in addition to what they would otherwise give to charitable causes. This finding indicates the potential and capacity for donation-based crowdfunding to increase charitable giving.
It is also interesting to observe that only 22 per cent of people have funded one or more projects that they would benefit from themselves, whereas 46 per cent have funded projects that others in or outside their local area could use, revealing the altruistic nature of many donors.
Two thirds of fundraisers were unlikely to have received financing elsewhere
Just as it has the potential to increase giving, there are also indications that donation-based crowdfunding primarily brings finance to projects that would otherwise not get funded. Sixty-four per cent of the surveyed fundraisers who have used donation-based crowdfunding stated that it was 'unlikely' or 'very unlikely' that they would have been able to receive finance for their projects through other sources.
In addition to their financial support, donors have provided a range of other benefits and types of support for projects they funded. Ninety per cent helped with promoting the crowdfunding campaign, while 29 per cent of backers had given advice and feedback to project owners and 27 per cent had offered to help or volunteer with the project. This is backed by survey findings from fundraisers' perspectives, where 34 per cent of fundraisers have seen an increase in volunteers after they raised funding through donation-based crowdfunding.
Forty-seven per cent of fundraisers are very likely to turn to donation-based crowdfunding in the future
Looking ahead, 67 per cent of fundraisers reported that they are very likely to recommend donation-based crowdfunding to others seeking funding, and 47 per cent would be very likely to approach a donation-based crowdfunding platform if they need finance in the future. The same goes for backers, where 72 per cent were likely or very likely to recommend donation-based crowdfunding to people they know.
Lancaster Bulldogs

Shaun Gash wanted to help the Lancaster Bulldogs Wheelchair Basketball Club to repair, replace and buy more competition-standard wheelchairs. To do this he launched a fundraising campaign on YIMBY (Yes In My Back Yard), a donation based crowdfunding platform. After a 30-day campaign, he successfully raised £2,520. The new and refurbished chairs will allow the team to compete in the GBWBA National League, and help introduce more children and young people to wheelchair basketball. Each chair costs between £1,500-£3,000 and the club needs at least 4 new chairs. Thanks to the YIMBY campaign they raised a quarter of the total sum, and together with other fundraising activities they have reached a total of £9,627.27 to date.
The Line - A Sculpture Walk for London

In March 2014, art dealer Megan Piper and urban regeneration expert Clive Dutton raised £142,585 from 198 backers on Spacehive, a donation-based crowdfunding platform, for the initial planning and organisation of The Line, a sculpture walk in East London. The proposed route for the Line will connect the Queen Elizabeth Olympic Park in Stratford and the O2 in North Greenwich. It will present existing and new works of art, and showcase views of the City's eastern landmarks, such as Victorian Gasholders and the world's largest tidal mill, all set amongst a diversity of river and marshland wildlife.
FUNDERS
Figure 74: How much money have you used to fund through this donation-based crowdfunding platform?
A bar chart showing the distribution of money used by funders through donation-based crowdfunding platforms.
- £1-£10: 30%
- £10-£50: 45%
- £50-£100: 13%
- £100-£500: 6%
- £500-£1,000: 3%
- £1,000-£5,000: 0%
- More than £5,000: 3%
Figure 75: When you budget for giving through donation-based crowdfunding, where does the money come from? (can select multiple)
A horizontal bar chart showing the sources of money budgeted for giving through donation-based crowdfunding.
- Money I would use for day to day spending: 63%
- Money I would give to charitable causes: 23%
- Money I would save: 23%
- Money I would invest: 3%
Figure 76: Type of support funders have given to campaigns?
A horizontal bar chart showing the types of support funders have given to campaigns.
- Promoting the campaign: 90%
- Giving feedback/advice to those running the campaign: 29%
- Offering to help/volunteer directly with the project: 27%
- Making introductions and connections: 27%
- Helping the fundraisers by letting them use space you have: 7%
- Giving goods to the campaign rather than money: 5%
Figure 77: When backing projects through a donation-based crowdfunding platform how important are the following for your decision to fund?
A stacked bar chart showing the importance of various factors for funders' decisions when backing projects via donation-based crowdfunding.
- How fundraised money will be spent: 64% Very important, 31% Important, 4% Neither important nor unimportant, 0% Unimportant, 0% Very unimportant.
- I feel my money is making a difference: 56% Very important, 40% Important, 4% Neither important nor unimportant, 0% Unimportant, 0% Very unimportant.
- Doing a social or environmental good: 49% Very important, 41% Important, 9% Neither important nor unimportant, 1% Unimportant, 0% Very unimportant.
- The quality of the team: 41% Very important, 49% Important, 6% Neither important nor unimportant, 1% Unimportant, 3% Very unimportant.
- Supporting someone I know (friends and family): 40% Very important, 29% Important, 18% Neither important nor unimportant, 9% Unimportant, 4% Very unimportant.
- Supporting a local project/organisation: 27% Very important, 34% Important, 29% Neither important nor unimportant, 7% Unimportant, 3% Very unimportant.
- The quality of the campaign pitch: 26% Very important, 44% Important, 21% Neither important nor unimportant, 6% Unimportant, 3% Very unimportant.
- Support a project that will benefit my local community: 17% Very important, 26% Important, 39% Neither important nor unimportant, 11% Unimportant, 7% Very unimportant.
- Fund something I can benefit from as a local resident: 11% Very important, 16% Important, 41% Neither important nor unimportant, 16% Unimportant, 16% Very unimportant.
- Funding project has received to date: 11% Very important, 21% Important, 39% Neither important nor unimportant, 21% Unimportant, 7% Very unimportant.
- Getting a product/service I wouldn't otherwise be able to get: 9% Very important, 17% Important, 36% Neither important nor unimportant, 25% Unimportant, 13% Very unimportant.
- Get more involved with my local community: 7% Very important, 28% Important, 45% Neither important nor unimportant, 12% Unimportant, 9% Very unimportant.
- Curiosity: 4% Very important, 22% Important, 32% Neither important nor unimportant, 19% Unimportant, 23% Very unimportant.
- Social pressure: 3% Very important, 17% Important, 23% Neither important nor unimportant, 54% Unimportant, 3% Very unimportant.
Legend: Very important, Important, Neither important nor unimportant, Unimportant, Very unimportant.
FUNDRAISERS
Figure 78: Why did you choose donation-based crowdfunding?
A stacked bar chart showing the importance of various reasons for choosing donation-based crowdfunding.
- Transparency: 52% Very important, 33% Important, 10% Neither important nor unimportant, 5% Unimportant, 0% Very unimportant.
- Speed: 50% Very important, 32% Important, 5% Neither important nor unimportant, 14% Unimportant, 0% Very unimportant.
- More control over my project/organisation: 41% Very important, 41% Important, 5% Neither important nor unimportant, 14% Unimportant, 0% Very unimportant.
- Because the money comes from individuals rather than institutions: 36% Very important, 27% Important, 23% Neither important nor unimportant, 14% Unimportant, 0% Very unimportant.
- I can raise funding on my own terms: 35% Very important, 35% Important, 20% Neither important nor unimportant, 10% Unimportant, 0% Very unimportant.
- Non-financial benefits (press/marketing/engagement): 32% Very important, 36% Important, 27% Neither important nor unimportant, 5% Unimportant, 0% Very unimportant.
- Unable to source funding locally: 18% Very important, 36% Important, 32% Neither important nor unimportant, 14% Unimportant, 0% Very unimportant.
- Curious: 17% Very important, 28% Important, 28% Neither important nor unimportant, 11% Unimportant, 17% Very unimportant.
- Unable to get funding elsewhere: 14% Very important, 33% Important, 33% Neither important nor unimportant, 19% Unimportant, 0% Very unimportant.
Legend: Very important, Important, Neither important nor unimportant, Unimportant, Very unimportant.
Figure 79: How likely is it that you would have received finance elsewhere if you could not have gone to crowdfunding?
A bar chart showing the likelihood of receiving finance elsewhere if crowdfunding was not an option.
- Very likely: 0%
- Likely: 14%
- Neither: 21%
- Unlikely: 50%
- Very unlikely: 14%
Figure 80: What is your current number of employees?
A horizontal bar chart showing the distribution of respondents by their current number of employees.
- No employees: 46%
- 1-5: 31%
- 6-10: 0%
- 11-50: 4%
- 50-250: 12%
- over 250: 8%
Conclusion
We hope that this report has shed light on what is a fast growing and highly diverse market, and one that is becoming an importance source of funding for individuals, businesses and organisations who often cannot struggle to access finance elsewhere. This research had reaffirmed the need to understand how the distinctive funding types within the market work, what their common characteristics are and how do they differ in the funding mechanisms they use, their processes and impact. On users, the research also highlights how imperative it is to appreciate their differentiated motivations to lend, invest, donate or raise funds and how they behave and interact in the context of the various alternative finance models.
Looking at the socio-economic impact, it has been interesting to observe how the organisations that have used alternative finance have generally performed well after fundraising, with the majority of them reporting increases in employment, volunteering, turnover or profit. In turn, it seems that at least in the short to medium term, alternative finance is channelling finance to organisations and projects worthy of funding.
Furthermore, by examining the level of awareness and usage by consumers and SMEs in a national context, it can be concluded that there is still significant potential for the alternative finance market to expand. However, in order to grow, the industry needs to continue innovating, educating users and addressing the various concerns consumers and SMEs have about alternative finance. Our findings indicate that in many cases, alternative finance is still predominately used by older men from higher income groups. While this mirrors patterns of investment that we see in traditional finance, this indicates an opportunity for alternative finance to expand to other demographics and parts of society, and engage more women, younger people and those from lower income groups who are often not sufficiently served by traditional institutions.
While this report has made an important first step in understanding many of the underlying dynamics and emerging trends within the alternative finance market, there are still a lot of unanswered questions and many aspects of the industry remain unexplored. Not least of these is how to define the boundary of a market currently being largely defined by the funding types and organisations that opt into the industry rather than any objective definition.
Another area for further exploration is that whilst this study demonstrates that businesses who have utilised alternative finance seem to perform well in the short term after fundraising, due to the nascent nature of the market, we haven't been able to track and document their longitudinal performances or impact. It will be very interesting, for instance, to record the trajectory of start-ups that have fundraised through equity-based and reward-based crowdfunding and follow them through their life cycles and major funding or exit events.
We also have little data on how alternative finance enables cross-border investment activities and funding outcomes. Given the amount of transnational financing flow already being facilitated on many platforms, there is a need to further the alternative finance research within a European and global context, and the role of UK based platforms in global alternative finance market. Building on this, much can be gained by studying how different alternative finance markets evolve in different economies and under varied regulatory frameworks.
It also would be interesting to study how inexperienced, professional and institutional funders interact with each other on various alternative finance platforms. Across the funding models and types of projects, from P2P business lending to donation-based campaigns for civic projects, we are seeing an increasing trend of large traditional funders co-funding or match-funding alongside individuals. We still know very little about how this works and how best to design the funding partnership between institutional and non-institutional investors to ensure both investor types, and those being funded, all benefit. We would like to see more experiments and research in this area.
Finally, we have seen a substantial number of people offering to contribute non-financial resources, from their time to goods, services or space along with their money on many socially-orientated or community-focused alternative finance platforms. We need to understand more about how these resources are contributed and utilised, and to what extent alternative financing activities can increase social action, foster community engagement and increase giving. We need to understand better how social enterprises, community organisations and voluntary groups can leverage alternative finance more effectively as part of their fundraising toolkit.
Acknowledgements
We are grateful for the valuable support we have had from Dr Mia Gray of Cambridge University in shaping the design of the research and providing comments on final report. Professor Mingfeng Lin of the University of Arizona also contributed greatly in data collection, processing and analysis.
Thanks to our colleagues at Nesta Stian Westlake, Jo Casebourne and Chris Haley who have provided valuable feedback on the research and to Zoe Jacob and Nick Moore for research assistance.
We would like to thank PWC and ACCA for funding and conducting national consumer and SME surveys respectively. In particular, thanks to Mark James and Fergus Lemon at PWC, and Manos Schizas and Charlotte Chung at the ACCA for their valued contributions to the research.
From the UKCFA we would like to thank Julia Groves, Annika Wahlberg and Antonia Goodall and from P2PFA Christine Farnish and Sam Ridler.
We would like thank the following platforms and people for sharing data and distributing surveys: Giles Andrews, Mat Gazeley, Didier Baclin, Matt Piatkus, Vlasios Vasileiou (Zopa); Rhydian Lewis, Simon Hawtin, James Tall, Scott Murphy (Rate Setter); Kevin Caley (Thin Cats); James Meekings, David De Koning, Lisa Jacob, Jingyi Wei (Funding Circle); Stuart Law, Andrew Holgate, Chris Mellish (Assetz Capital); Christian Faes, David Serafini (LendInvest); Andrew Turnbull, Aldwyn Boscawen (Wellesley & Co); Nick Moules, Daniel Rajkumar (Rebuilding Society); Graeme Marshall, Mark Harrison (Funding Knight); Parag Patel (Funding Empire); Darren Westlake, Luke Lang, James Roberts, Kieran Garvey (Crowd Cube); Jeff Lynn, Karen Kerrigan, Alysia Wanczyk, Thomas Davies (Seedrs); Goncalo de Vasconcelos, Tom Britton (Syndicate Room); Phil Geraghty, Owen Wallis, Dave Barnwell (Crowdfunder); Amanda Boyle (Bloom VC); Theresa Burton (BuzzBnk); Anil Stocker, Ari Last, Paul Crayston (Market Invoice); Louise Beaumout, Lucinda Anderson (Platform Black); Chris Gourlay, Fred Tarr (Space Hive); Jack Sheldon, Elizabeth Kessick, Jonathan Waddingham (Yimby); Adam Tavener, Carly Shute, Caron Parsons, Kevin Peake (Clifton); Simon Borkin, Lisa Dale-Clough (Microgenius); Bruce Davis, Conor Bishop (Abundance).
Finally, we would like to thank other industry and government officials who helped inform the priorities for research including those who attended the alternative finance roundtable discussion organised by the Cabinet Office, June 13, 2014:
Cabinet Office: Ben Warren, Rob Parker, Jess Cordingly; HM Treasury: Cameron Yorston, Matthew Gill, Mark Pickard; BIS: Mark Gibbon, Scott MacDonald; DCLG: Anne-Marie Dean, DFID: Leanne Jones; Big Society Capital: Candice Mortran; DCMS: Alex Martin, CBI: Matthew Fell and Tom Thackray.
Endnotes
- 1For general purpose, please quote this report as (Nesta, 2014). For academic reference, please quote this report as (Zhang, Z., Collins, L., Baeck, P. 2014). Analyses contained in this report are partly based on ongoing academic research collaborations between Bryan Zhang, Mingfeng Lin (University of Arizona) and Mia Gray (Cambridge University).
- 2The 2012 and 2013 figures have been adjusted from those published in the Rise of Future Finance (Nesta, 2012). This is due to the evolution of the definition used and funding types included. The alteration is primarily due to the exclusion of online fundraising such as people raising money when running marathons.
- 3Actual transactional volume for Q1-Q3, and predictions for Q4 were collected via a UK-wide industry tracking survey. Q4 projections were capped at the sum of the previous two quarters wherever applicable. In a minority of instances where a platform did not fill out the tracking survey, volumes were sourced by extracting publicly available information from their sites.
- 4This is based on the number of businesses that raised finance through P2P business lending, equity crowdfunding, community shares, debt based securities, invoice trading and pension led funding.
- 5The prediction for 2015 is calculated by projecting forward by one year the average growth rate over the past 3 years.
- 6Where possible the business owner was contacted to fill in the survey.
- 7Marlow, S. and Patton, D. (2005) All Credit to Men? Entrepreneurship, Finance, and Gender. Entrepreneurship, Theory and Practice, 29(6) 717-35 Marlow, S. McAdam, M. (2012) Analyzing the Influence of Gender Upon High-Technology Venturing Within the Context of Business Incubation Entrepreneurship, Theory and Practice. 36(4) 655-76
- 8http://www.socialenterprise.org.uk/uploads/files/2013/07/the_peoples_business.pdf
- 9http://www.gla.ac.uk/media/media_362647_en.pdf
- 10https://www.gov.uk/government/uploads/system/uploads/attachment_data/file/270426/table_13-2.pdf
- 11http://www.ons.gov.uk/ons/dcp171778_367167.pdf
- 12From our survey of P2P consumer borrowers, 2.2% said they were borrowing for their business.
- 13SASS stands for Small Self-Administrated Scheme and SIPP stands for Self-Invested Personal Pension, both are investment regulated pension schemes.
Nesta
1 Plough Place
London EC4A 1DE
[email protected]
@nesta_uk
www.facebook.com/nesta.uk
www.nesta.org.uk
November 2014
ISBN: 978-1-84875-158-3
Nesta is a registered charity in England and Wales with company number 7706036 and charity number 1144091. Registered as a charity in Scotland number SCO42833. Registered office: 1 Plough Place, London, EC4A 1DE.
CC BY NC SA





